Technology
First, trade policy uncertainty has dealt a blow to this tech subindex. Not only are 90% of sales foreign sourced, but a large chunk is also China-related sales. The table highlights the excessive sensitivity these stocks have to the U.S. dollar. In fact, the…

Highlights Portfolio Strategy The drubbing in the S&P semi equipment index is overdone and even a modest improvement on either the trade policy, industry demand or currency fronts could result in a reflex rebound, warranting an above benchmark allocation. An oil price rebound on the back of a more balanced supply/demand backdrop, a continuation in the global capex energy upcycle and compelling relative valuations all suggest that the path of least resistance is higher for oil majors. Recent Changes Boost the S&P Semiconductor Equipment index to overweight today, on a tactical three-to-six month time horizon. Table 1
Signal Vs. Noise
Signal Vs. Noise
Feature Equities attempted to stage a recovery last week and are in a triple bottom technical formation, still consolidating the October tremor. The Fed meeting later this week will likely prove a catalyst on the monetary policy front, especially if the closely watched FOMC median dots decrease for 2019 as the bond market has been expecting. As we mentioned in our 2019 High-Conviction calls Report two weeks ago,1 the Fed will dominate markets next year and any dovish change in interest rate expectations will breathe a sigh of relief into the SPX. Given the heightened volatility and violent recent equity market oscillations, it is important to separate the noise from the actual signal. While distinguishing between the two is hard at times, we are relying on a few key indicators to aid us in this process. First, our S&P 500 EPS growth model is still expanding near the 10% mark for next year as clearly 25% EPS growth is not sustainable. While the risk is that this growth rate decelerates further, as long as EPS do not contract next year, stock prices should recover (Chart 1). From a macro perspective, at this stage of the cycle with nominal GDP growth between 4-5%, organic EPS growth should at least mimic nominal output growth. Tack on a 2% buyback yield or artificial EPS growth and attaining a 7% EPS growth rate is likely next year.
Chart 1
Second, while the 5/2 and 5/3 yield curve slopes have inverted and we heed these signals, the 10/2 and the Fed’s spread (2-year yield minus the fed funds rate) have yet to invert. Historically, the most significant yield curve signals for the equity market are when simultaneously all the different yield curve slopes are inverted. While everyone is infatuated with the yield curve inversion implications of recession, we are laser focused on the interplay between the yield curve and stock market peaks. Importantly, typically the 10/2 yield curve inversion occurs before stock market peaks. Going back to the mid-1960s there has been only one time when the stock market peaked prior to the yield curve inversion, in 1973: the SPX crested on January 11 and the yield curve inverted on January 16 (due to lack of data we use the effective fed funds rate instead of the 2-year yield prior to 1976). In all the other iterations, the yield curve inverts prior to the stock market top. Even in 1998 the yield curve inverted in late-May and the SPX peaked in mid-July before suffering a 20% drawdown. Similarly, on February 2, 2000 the yield curve inverted and on March 24, 2000 the SPX topped out for the cycle.
Chart 2
Chart 3… And Then The SPX Peaks
...And Then The SPX Peaks
...And Then The SPX Peaks
In other words, the yield curve inversion is a leading indicator and once the curve inverts, it signals that the stock market highpoint will follow soon thereafter (Charts 2 & 3). The broad market tops on average 248 days (median 77 days) following the yield curve inversion (Table 2), though the large variability in each iteration limits the usefulness of this average as an accurate predictor. Nevertheless, the implication remains that the SPX has yet to peak for the cycle. Table 2Yield Curve Inversions And S&P 500 Peaks
Signal Vs. Noise
Signal Vs. Noise
Third, a slew of economically sensitive indicators have troughed. Sweden’s PMI and Swedish stock market relative performance have been in a V-shaped recovery. As we highlighted earlier this week,2 Sweden is a small open economy and it is likely sniffing out an improvement in global export volume growth and a likely de-escalation in the U.S./China trade tussle. EM FX, the CRB raw industrials commodities index, the Baltic Dry Index and semi equipment stocks (see more details in the next section) all suggest that the worst is over, and global trade will likely resume its advance in the coming months (Chart 4). Chart 4Hyper-sensitive Indicators Sniffing Out A Trough?
Hyper-sensitive Indicators Sniffing Out A Trough?
Hyper-sensitive Indicators Sniffing Out A Trough?
Finally, inflation is coming off the boil and will likely decelerate in the months ahead courtesy of the fall in WTI crude oil prices. Were oil to move sideways from here, headline inflation would decelerate further, likely overwhelming core CPI (Chart 5). This is significant, as it could serve as a monetary policy catalyst. Put differently, decelerating inflation may cause the Fed to reconsider the pace of its interest rate hikes. A pause in the tightening cycle in March 2019 would be a welcome development for stocks, especially if the fed funds rate is nearing the terminal rate as we recently highlighted in our trough-to-peak fed funds rate tightening cycle analysis.3 Chart 5Inflation Will Decelerate
Inflation Will Decelerate
Inflation Will Decelerate
Adding it all up, our still expanding SPX EPS growth model, a lack of a 10/2 yield curve inversion, a trough in a number of economically sensitive indicators and the potential for a temporary Fed hike pause in March next year, all signal that the equity bull market is not over and fresh all-time highs are looming in 2019. This week we are upgrading, on a tactical basis, a bombed out tech subgroup, and updating our view on a deep cyclical index. Semi Equipment: Enough Is Enough We are lifting exposure in the niche S&P semi equipment index from underweight to a modest overweight. Putting this in perspective, this small index comprises only 1.5% of the tech universe and commands a mere 0.3% weight in the S&P 500. There are high odds that most of the carnage in semi equipment stocks is already reflected in the violent swing of the sell side community from extreme bullishness up until August of this year to the current extreme bearishness. As a reminder, the S&P semi equipment index was part of U.S. Equity Strategy’s high-conviction underweight call revealed in November 27, 2017 when the sell-side could not have enough of semi equipment stocks as analysts were also mesmerized last winter by the near $20,000/bitcoin related mania.4 This timing coincided with the peak in performance of this hypersensitive early-cyclical tech index (Chart 6). Chart 6Extreme Bearishness...
Extreme Bearishness...
Extreme Bearishness...
To get a sense of how far the pendulum has swung on the bearish camp, we note the following: The relative 12-month forward EPS growth has deflated from positive 60% to negative 20% (Chart 6). The index’s forward P/E is trading at a 40% discount to the SPX, relative 5-year EPS growth estimates are near previous troughs and even compared to the overall tech sector; semi equipment long-term EPS growth is now forecast to trail their tech brethren (Chart 7). Even forward sales growth has collapsed, falling to a multi-year low. Analysts now expect an outright contraction in revenues to the tune of 4% or 10 percentage points below the S&P 500 (Chart 6). Net EPS revisions have also been sinking like a stone, approaching the 2012 nadir (Chart 6). Technical conditions are oversold with cyclical momentum as bad as it gets (Chart 7). Chart 7...Reigns
...Reigns
...Reigns
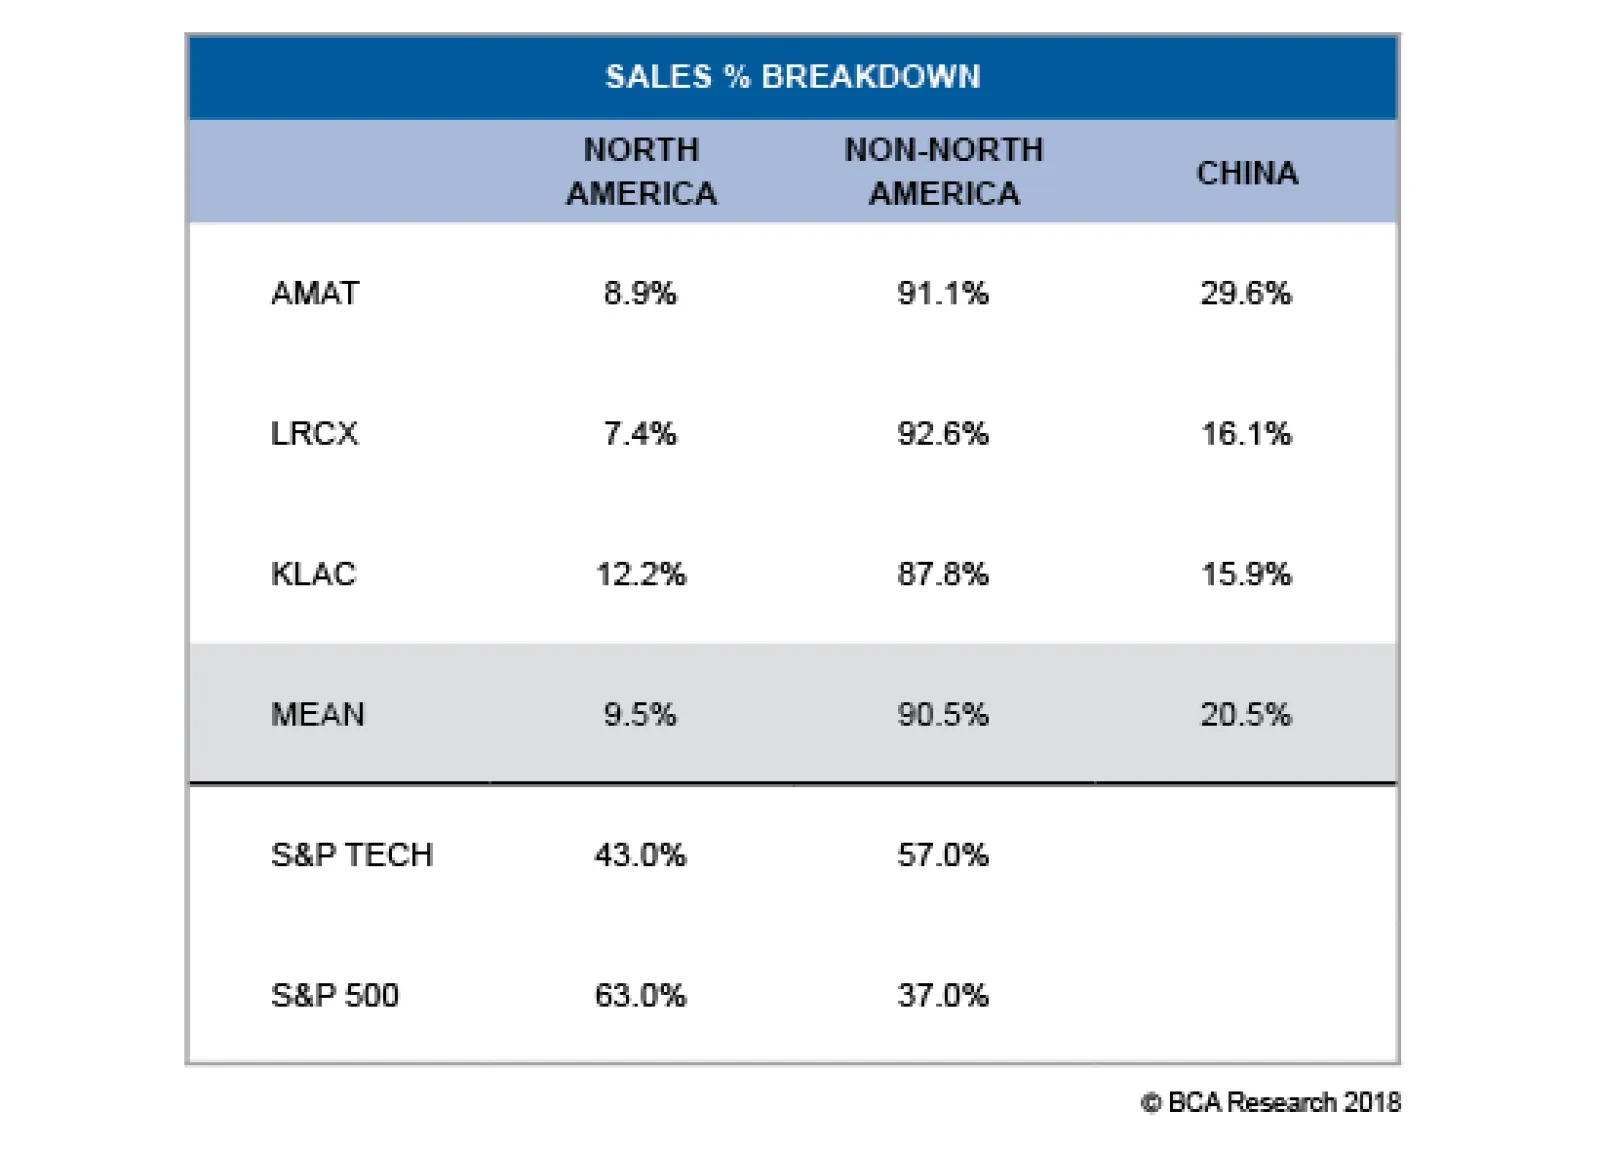
Beyond this overly pessimistic backdrop, there are some macro indicators that, were they to sustain their recent budding recoveries, would serve to catalyze the chip equipment group. First, trade policy uncertainty has dealt a blow to this tech subindex (trade policy uncertainty shown inverted, top panel, Chart 8). Not only are 90% of sales foreign sourced, but a large chunk is also China-related sales. Table 3 highlights the excessive sensitivity these stocks have to the U.S. dollar. In fact, the correlation with J.P. Morgan’s EM FX index is an almost perfect one (Chart 8). If President Trump is serious about striking a deal with China, then this group would enjoy a relief rally. Chart 8Potential Positive Catalysts
Potential Positive Catalysts
Potential Positive Catalysts
Table 3U.S. Semi Equipment Geographical Sales Breakdown
Signal Vs. Noise
Signal Vs. Noise
Second, emerging market manufacturing PMIs are showing some signs of life, underscoring that semi equipment demand may turn out to be marginally less grim than currently anticipated (Chart 9). Chart 9EM Green Shoots?
EM Green Shoots?
EM Green Shoots?
Third, while global semi sales will continue to decelerate for the next three-to-six months, the semi market is functioning as if the inventory liquidation cycle is in the later innings, with our industry pricing power proxy plummeting 180 percentage points from peak-to-the-recent trough, just below the contraction zone (Chart 10). Chart 10Inventory Liquidation Is In Late Stages
Inventory Liquidation Is In Late Stages
Inventory Liquidation Is In Late Stages
Finally, any bounce in cryptocurrencies may also serve as a positive catalyst for additional demand for the semi equipment companies that enjoy monopolies in their respective manufacturing niches (Chart 10). In sum, the drubbing in the S&P semi equipment index is overdone and even a modest improvement on either the trade policy, industry demand or currency fronts could result in a reflex rebound. Bottom Line: Lift the S&P semi equipment index from underweight to overweight today, as a tactical move for the next three-to-six months. The ticker symbols for the stocks in this index are: BLBG: S5SEEQ – AMAT, LRCX and KLAC. Oil Majors Are Holding Firm In early-February we upgraded the heavyweight integrated oil & gas energy subindex to an above benchmark allocation. Our thesis centered on a capex upcycle recovery and firming oil price backdrop that would unlock excellent value in this key energy subgroup. Since then, the relative share price ratio has moved laterally. Interestingly, this defensive energy subindex neither kept up with the steep oil price advance until the end of September, nor with the recent drubbing in crude oil prices (Chart 11). Put differently, oil majors never discounted sustainably higher oil prices, and are also refraining from extrapolating recent oil prices weakness far into the future. Chart 11Defensive Oil Equities
Defensive Oil Equities
Defensive Oil Equities
While the Trump Administration’s flip-flop on the Iranian sanctions has injected extreme volatility into oil prices, some semblance of normality has returned to the crude oil markets as last week OPEC and Russia agreed to a production cut in order to help balance the market. Another key factor that has contributed to the recent fall in oil prices at the margin has been U.S. shale oil supplies. Roughly 30% per annum growth in U.S. crude oil production is unsustainable and, were production to remain near all-time highs and move sideways in 2019, then the growth rate would fall back to the zero line. Such a paring back in the growth rate, along with OPEC/Russia discipline, would likely balance the oil market and pave the way for an oil price recovery (oil production shown inverted, Chart 12). Chart 12U.S. Supply Response Is Looming
U.S. Supply Response Is Looming
U.S. Supply Response Is Looming
Given that BCA’s Commodity & Energy Strategy service continues to forecast higher oil prices into 2019, the S&P integrated oil & gas index should stage a sustainable rebound next year. While the recent swift drop in oil prices is jeopardizing the still recovering capital expenditure cycle, we doubt $50/bbl oil would make current projects uneconomical and result in mothballing or outright canceling of ongoing oil exploration projects (Chart 13). Granted, a big assumption is that oil prices at least hold near the current level and do not suffer a relapse to the early-2016 lows. Historically, rising oil exploration outlays and integrated oil & gas share prices move in lock step and the current message is to expect a rebound in the latter (Chart 14). Chart 13Low Odds Of A Total...
Low Odds Of A Total...
Low Odds Of A Total...
Chart 14...Capex Collapse
...Capex Collapse
...Capex Collapse
Finally, sell-side analysts are throwing in the towel. Net earnings revisions have taken a beating of late, which is positive from a contrary point of view (second panel, Chart 15). Relative valuations are extremely compelling on a number of metrics including relative price-to-book, price-to-sales and relative forward price-to-earnings (third panel, Chart 15). Tack on a near 200bps positive delta in the dividend yield versus the broad market and yield hungry investors will also seek the relative safety of this defensive energy subindex (bottom panel, Chart 15). Chart 15Integrated Stocks Are On Sale
Integrated Stocks Are On Sale
Integrated Stocks Are On Sale
Netting it all out, an oil price rebound on the back of a more balanced supply/demand backdrop, a continuation in the global capex energy upcycle and compelling relative valuations all suggest that the path of least resistance is higher for oil majors. Bottom Line: Stay overweight the heavyweight S&P integrated oil & gas energy subindex. The ticker symbols for the stocks in this index are: BLBG: S5IOIL – XOM, CVX and OXY. Anastasios Avgeriou, Vice President U.S. Equity Strategy anastasios@bcaresearch.com Footnotes 1 Please see BCA U.S. Equity Strategy Weekly Report, “2019 Key Views: High-Conviction Calls,” dated December 3, 2018, available at uses.bcaresearch.com. 2 Please see BCA U.S. Equity Strategy Sector Insights, “Can Sweden Lead The SPX?” dated December 12, 2018, available at uses.bcaresearch.com. 3 Please see BCA U.S. Equity Strategy Weekly Report, “2019 Key Views: High-Conviction Calls,” dated December 3, 2018, available at uses.bcaresearch.com. 4 Please see BCA U.S. Equity Strategy Weekly Report, “2018 High-Conviction Calls,” dated November 27, 2017, available at uses.bcaresearch.com. Current Recommendations Current Trades Size And Style Views Favor value over growth Favor large over small caps
Highlights On the bright side, Malaysia’s structural backdrop is improving notably, especially in the semiconductors segment. Yet the cyclical growth outlook remains downbeat. While we are maintaining a market-weight allocation to Malaysian equities within an EM equity portfolio, we are putting this bourse on our upgrade watch list. As a play on the ameliorating structural outlook, we recommend an overweight position in Malaysian small-cap stocks relative to the EM universe – both the small-cap and overall equity benchmarks. Feature Malaysian stocks have performed quite poorly in recent years: the equity index, in U.S. dollars, is close to its 2016 lows in absolute terms, and relative to the emerging markets (EM) benchmark, it is not far from the lows of last decade (Chart I-1). Chart I-1Malaysian Stocks & Commodities Prices: Tight Relationship
Malaysian Stocks & Commodities Prices: Tight Relationship
Malaysian Stocks & Commodities Prices: Tight Relationship
Odds are that a structural bottom in this bourse’s relative performance versus the EM index may have been reached. Hence, we are putting Malaysian equities on our upgrade watch list while maintaining a market-weight allocation due to tactical considerations. On the negative side, the past credit excesses have not been recognized and provisioned for by Malaysian commercial banks. The latter account for a notable 34% of the MSCI Malaysia index, and they will be a drag on this bourse's performance. Absolute performance also still hinges on global growth, commodities prices and the overall direction of Asian/EM markets. We are still negative on these parameters. Critically, there are various signs indicating an ameliorating structural backdrop in Malaysia. The country is undergoing notable improvements in the semiconductor sector, thereby reducing its dependence on commodities and increasing its exposure to a high-value industry. To capitalize on this theme of an improving structural backdrop, we are recommending an overweight position in Malaysian small-cap stocks relative to the EM universe – both the small-cap and overall equity benchmarks. Shifting Away From Commodities And Toward Electronics Parting Ways With Commodities Malaysia and its financial markets have been very exposed to commodities prices over the past 15 years or so (Chart I-1, top panel). Nevertheless, the country seems to be shifting away from its considerable reliance on the resource sector and moving into other value-added segments: in particular, semiconductors and technology. Such a structural shift – if successful – would be an extremely positive development as it would lead to rising productivity gains and higher per capita income growth. In short, the country would be able to achieve higher rates of sustainable non-inflationary growth, feeding into a sustainable bull market in Malaysian equities. Several points are noteworthy in this regard: The real output of crude and petroleum products as well as palm oil are declining sharply relative to the economy’s real total output (Chart I-2). Chart I-2Malaysia's Commodities Output Is Falling In Importance
Malaysia's Commodities Output Is Falling In Importance
Malaysia's Commodities Output Is Falling In Importance
Exports volumes of palm oil, crude oil and natural gas have all been falling relative to Malaysia’s total overseas shipment volumes (Chart I-3). Chart I-3Commodities Export Volumes Are Declining In Relative Terms
Commodities Export Volumes Are Declining In Relative Terms
Commodities Export Volumes Are Declining In Relative Terms
Crude oil, gas, and palm oil now account for 4%, 5%, and 7% of total exports in value terms, respectively. Crucially, not only is the importance of commodities in the overall Malaysian economy diminishing in volume terms, it is also falling in nominal terms due to low resource prices. For instance, net export revenues from fuel (i.e. crude oil, petroleum and natural gas) have fallen from US$18 billion in 2013 to US$5 billion today (Chart I-4, top panel). Chart I-4Commodities' Net Export Revenues Are Also Diminishing
Commodities' Net Export Revenues Are Also Diminishing
Commodities' Net Export Revenues Are Also Diminishing
Meanwhile, net exports of palm oil (and other plant-based fats) have dropped from US$20 billion to US$10 billion (Chart I-4, bottom panel). Improvement In High-Value-Added Manufacturing There are also some positive structural signs taking place in the Malaysian economy that are signaling an improvement in productivity and competitiveness: Malaysian export volumes of machinery and transport equipment are expanding in absolute terms as well as relative to overall export volumes (Chart I-5, top and middle panels). Chart I-5Malaysia's Machinery Exports Are Rocking
Malaysia's Machinery Exports Are Rocking
Malaysia's Machinery Exports Are Rocking
Remarkably, Malaysian aggregate export volumes are quickly regaining lost global market share (Chart I-5, bottom panel). Further, the ratio of exports to imports has hit a structural bottom and is slowly picking up in volume terms (Chart I-6). Chart I-6Malaysian Overall Exports Are Regaining Lost Market Share
Malaysian Overall Exports Are Regaining Lost Market Share
Malaysian Overall Exports Are Regaining Lost Market Share
This suggests some improvements in the competitiveness of domestic industries is slowly underway. Meanwhile, Malaysian high-skill and technology intensive exports as a share of global high-tech exports seem to have made a major bottom in U.S. dollar terms and will begin to rise (Chart I-7). Chart I-7Bottom In Malaysia's High-Tech Global Share?
Bottom In Malaysia's High-Tech Global Share?
Bottom In Malaysia's High-Tech Global Share?
Advanced education enrollment is high and improving – and is only outpaced by Korea and China in emerging Asia (Chart I-8). Importantly, Malaysia has among the best demographics of mainstream developing countries. The working age population as a share of the total population will continue to be high all the way to 2040. Chart I-8Malaysians Like Going To School
Malaysians Like Going To School
Malaysians Like Going To School
Malaysian expenditures on R&D have also been on the rise, outpacing a lot of other countries in the region (Chart I-9, top panel). R&D expenditures in Malaysia could also be catching up to Singapore’s (Chart I-9, bottom panel). Chart I-9Malaysia's Expenditure On R&D Is Rising
Malaysia's Expenditure On R&D Is Rising
Malaysia's Expenditure On R&D Is Rising
In line with these positives, net FDIs into Malaysia have been rising briskly (Chart I-10). Importantly, these investments have been driven by European companies, meaning the latter are transferring valuable technological know-how to Malaysia. Chart I-10Net FDIs Are Rising
Net FDIs Are Rising
Net FDIs Are Rising
The Malaysian ringgit is cheap (Chart I-11) and has reached almost two-decade lows against many Asian currencies. This makes Malaysia increasingly more competitive. Chart I-11The Ringgit Is Cheap
The Ringgit Is Cheap
The Ringgit Is Cheap
Finally, our colleagues from the Geopolitical Strategy team believe that the recently elected Pakatan Harapan government will improve governance and transparency, which had significantly deteriorated under Najib Razak’s rule. A Marriage To Electronics Malaysia is attempting to reestablish itself as a major semiconductor hub in the region. Remarkably, after declining for 15 years, semiconductor exports are finally rising as a share of GDP (Chart I-12) and Malaysian semiconductor exports are outperforming those of its neighbors. Chart I-12Malaysian Semiconductor Exports Are Booming
Malaysian Semiconductor Exports Are Booming
Malaysian Semiconductor Exports Are Booming
The Malaysian government since 2010, has identified the semiconductor sector as a key area for development and prosperity. In turn, it has been introducing programs and setting up institutions to support the industry. The 2019 budget reinforces the government’s priority to develop the sector. Several anecdotal observations confirm that Malaysia is moving up the value chain in the semiconductor industry, and is going beyond simple testing and assembly: Growing the semiconductor cluster: The Malaysian Institute of Microelectronic Systems (MIMOS) has established a shared services platform for advanced analytical services in the semiconductor industry to provide support to Malaysian semiconductor companies. The Economic Industrial Design Centre (EIDC) is also providing support to SMEs in order to enhance their efficiency. Similarly, the Semiconductor Fabrication Association of Malaysia (SFAM) has been partnering with local universities to enhance their engineering programs and offer training, internships and research opportunities for students. Developing home-grown semiconductors: In 2015, Malaysian public institutions in partnership with private companies developed the Green Motion Controller (GMS), an integrated circuit that reduces energy consumption. This semiconductor is an energy efficient controller that carries applications in hybrid cars and air conditioners, among other things. Nanotechnology: NanoMalaysia – a nanotechnology commercialization agency – is providing services to SMEs and start-ups to help increase their competitiveness by enabling them to upgrade to more efficient production methods. Light-emitting Diode (LED) manufacturing: Malaysia is becoming a hub for the manufacturing of energy efficient LED chips. This is the result of OSRAM’s – a German light manufacturer – large investment in a high-tech production facility. There are early signs already that the above developments are beginning to bear results. Chart I-13 shows that the difference between exports and imports of semiconductors (in U.S. dollars) have been surging. This shows Malaysia is able to add greater value to the semiconductors it imports and then re-exports. Chart I-13Malaysia Adds Value To The Semis It Imports
Malaysia Adds Value To The Semis It Imports
Malaysia Adds Value To The Semis It Imports
Bottom Line: Commodities are declining in importance to the Malaysian economy. Meanwhile, Malaysia’s structural backdrop is improving as the semiconductor and hardware technology segments are rising in prominence. Cyclical Weakness Despite the positive structural backdrop, Malaysia’s cyclical outlook remains challenging. Our view on commodities and global trade continues to be negative. Not only are commodities prices deflating but semiconductor prices are also falling, and their global shipments are weakening (Chart I-14). Chart I-14Cyclical Weakness In Global Semiconductor Cycle
Cyclical Weakness In Global Semiconductor Cycle
Cyclical Weakness In Global Semiconductor Cycle
The epicenter of the global trade slowdown, however, will be in Chinese construction activity. Consequently, industrial resources prices are more vulnerable than electronics in this global growth downturn. The above deflationary forces would negatively shock Asia’s growth outlook, and consequently Malaysian growth as well: The top panel of Chart I-15 shows that Malaysian narrow money growth has already rolled over decisively and is foreshadowing weaker bank loan growth. Chart I-15Malaysian Domestic Growth Set To Weaken
Malaysian Domestic Growth Set To Weaken
Malaysian Domestic Growth Set To Weaken
Slower bank loan growth will weaken purchasing power and impact domestic consumption. The middle panel of Chart I-15 shows that car sales – having surged this summer because of the abolishment of the GST – are weakening anew. Malaysian companies and banks have among the largest foreign currency debt loads (Table I-1). We expect more currency depreciation in Malaysia, as we do in EM overall. This will make foreign currency debt more expensive to service, and consequently dampen companies’ and banks’ appetites for expansion. Table I-1Malaysia's External Debt Breakdown
Malaysia: Structural Improvements Despite Cyclical Weaknesses
Malaysia: Structural Improvements Despite Cyclical Weaknesses
Finally, the real estate sector remains depressed. Property volume sales are contracting and have dropped to 2008 levels, and housing construction approvals are slumping (Chart I-16). Chart I-16Malaysia's Property Sector Is Depressed
Malaysia's Property Sector Is Depressed
Malaysia's Property Sector Is Depressed
While this means that cleansing has been taking place in the property sector, the banking sector has not recognized NPLs and remains the weakest link in the Malaysian economy. Specifically, the top panel of Chart I-17 illustrates that the NPLs in the banking system still stand at a mere 1.5%. This is in spite of the fact that since 2009, non-financial private sector credit to GDP has risen significantly. Therefore, the true level of NPLs is probably considerably higher. Chart I-17Malaysian Banks Are Under-Provisioned
Malaysian Banks Are Under-Provisioned
Malaysian Banks Are Under-Provisioned
Further, Malaysian banks have been lowering provisions to boost profits (Chart I-17, bottom panel). This is unsustainable. As growth weakens, Malaysian banks will see their NPLs rise and will need to raise provisions. Chart I-18 demonstrates that if provisions rise by 20%, bank operating earnings will contract and bank share prices would fall. Chart I-18Malaysian Banks' Share Prices Will Fall
Malaysian Banks' Share Prices Will Fall
Malaysian Banks' Share Prices Will Fall
Bottom Line: Malaysia’s cyclical growth outlook is still feeble, with the banking system being the weakest link. Banks’ large weight in the equity index makes this bourse still vulnerable in the coming months. Optimal Macro Policy Mix Fiscal Consolidation… Fiscal policy is set to be tighter as per the Malaysian government budget announced on November 2 and its preference to pursue fiscal consolidation to reduce the deficit. The budget projects only a slight increase in expenditures in 2019, which means it will likely slowdown from 8% currently (Chart I-19). Chart I-19Government Expenditure Growth Will Soften
Government Expenditure Growth Will Soften
Government Expenditure Growth Will Soften
The government will also recognize public-sector liabilities not presently shown on its balance sheet and strengthen both transparency and administrative efficiency. Critically, the budget also includes strategies to support the entrepreneurial part of the economy. Overall, this budget bodes very well for the structural outlook. Yet it will not support growth cyclically. …To Be Offset By Easy Monetary Policy Despite continued currency weakness, the Malaysian monetary authorities will not be in a hurry to raise interest rates to defend the ringgit. This is in contrast with other central banks in the region like Indonesia and the Philippines. This is presently an optimal policy mix for Malaysia and is positive for the stock market’s relative performance versus its counterparts in many other EMs. Malaysia’s structural inflation is low: core inflation hovers around zero. Therefore, the central bank will neither raise interest rates nor sell its foreign exchange reserves to defend the currency. Both currency depreciation and low interest rates are needed to mitigate the downturn in exports as well as offset fiscal consolidation. In the meantime, the ringgit is unlikely to depreciate in a sudden and vicious manner but rather will likely fall gradually. First, the current account will remain in surplus, even as global trade contracts. The basis is that if Malaysian exports fall, imports will simultaneously follow. The country imports a lot of intermediate goods to then process and re-export. Second, Malaysia is unlikely to witness pronounced capital flight as occurred in 2015. The new government has increased confidence in the economy among both locals and foreigners. In addition, net portfolio investments have been negative for a while. This means that a large amount of foreign capital has exited already, reducing the risk of further outflows. What’s more, foreign ownership of local currency bonds has fallen from 33% in June 2016 to 24% today. Moreover, at 28% of market cap, foreign ownership of equities is among the lowest in EM. These also limit potential foreign selling. Bottom Line: Policymakers are adopting a wise policy mix for the economy at the current juncture: tight fiscal and easy monetary policies. This is structurally positive, even if it does not preclude cyclical weakness. Investment Conclusions Weighing structural positives versus the cyclical growth weakness and the unhealthy banking system, we are maintaining a market-weight allocation to Malaysian stocks within the EM universe, but are placing this bourse on our upgrade watch list. We need to see a selloff in bank stocks before we upgrade it to overweight. Within Malaysian equities, we recommend shorting/underweighting banks and going long/overweighting small cap stocks. To capitalize on Malaysia’s improving structural growth outlook, we recommend buying Malaysian small caps, but hedging positions by shorting the EM aggregate or small-cap indexes. The ringgit is poised to depreciate further versus the U.S. dollar along with other EM/Asian currencies. We continue to short the ringgit versus the greenback. With respect to sovereign credit and local government bonds, dedicated portfolios should currently have a market-weight allocation. The negative cyclical growth outlook is offset by the right macro policy mix and improving growth potential. Ayman Kawtharani, Associate Editor ayman@bcaresearch.com Equity Recommendations Fixed-Income, Credit And Currency Recommendations
Highlights So What? The tech war will continue to disrupt the trade truce. Why? The U.S. and China have legitimate national security concerns about each other’s tech policies. The 90-day trade talks cannot succeed without some compromises on tech issues. Chinese structural reforms could also reduce U.S. concerns over tech transfer. Feature The fanfare over President Donald Trump’s tariff ceasefire, agreed at the G20 summit on December 1, has already proved short-lived. We know now that on the same day President Trump sat down with Chinese President Xi Jinping to negotiate the truce, Canadian authorities arrested Meng Wanzhou, the chief financial officer of Huawei, under a U.S. warrant. Huawei is the world’s biggest telecoms equipment maker, second-biggest smartphone maker, and one of China’s high-tech champions. So far the controversial arrest – which prompted Beijing to make representations to the U.S. ambassador – has not derailed the trade truce. China’s Commerce Ministry has announced that tariffs will be eased and imports of American goods will increase. The CNY-USD has climbed upwards despite a rocky global backdrop in financial markets (Chart 1). Chart 1Currency Part Of The Trade Truce?
Currency Part Of The Trade Truce?
Currency Part Of The Trade Truce?
Nevertheless, Meng’s arrest calls attention to our chief reason for skepticism about the ability of the U.S. and China to conclude a substantive trade deal. In essence, “trade war” is a misnomer for a broader strategic conflict that is centered on the military-industrial balance rather than the trade balance. Trade War? Tech War! The historian Paul Kennedy, in his bestselling The Rise and Fall of the Great Powers, argued that the history of competition between nations is determined by economic and technologically advanced industrial production.1 Eighteenth-century Britain defeated France; Ulysses S. Grant defeated Robert E. Lee; and the U.S., the allies, and Russia defeated Nazi Germany and Imperial Japan. This thesis helps to explain why China’s recent technological acceleration has provoked a more aggressive reaction from the U.S. than its general economic rise over the past four decades. For example, while China is rapidly catching up to the U.S. in research and development spending, it is only spending about half as much as the U.S. relative to its overall economy (Chart 2). If it comes to match the U.S.’s ratio then it will overwhelm it in real R&D investment, at least in dollar value. And R&D is just one of many factors showing that China is eroding the U.S.’s global dominance. Chart 2The U.S. Has Some Competition
The U.S. Has Some Competition
The U.S. Has Some Competition
In September, an inter-agency U.S. government task force initiated by President Trump’s Executive Order 13806 sought to assess the strength of the U.S. defense industrial base and resilience of its supply chains.2 The conclusion was that the U.S.’s military-industrial base is suffering from a series of macro headwinds that need to be addressed urgently. The report cited key domestic issues, such as the erosion of the U.S. manufacturing sector (Chart 3). It argued that the country is rapidly losing the ability to source its defense needs from home, develop human capital for future needs, and surge capabilities in a national emergency. Chart 3Decline Of The U.S. Manufacturing Base
Decline Of The U.S. Manufacturing Base
Decline Of The U.S. Manufacturing Base
However, foreign competition, specifically “Chinese economic aggression,” also holds a central place in the report. The obvious risk is U.S. overreliance on singular Chinese sources for critical inputs, as highlighted during the 2010 rare earth embargo, when Beijing halted exports of these metals to Japan during a flare-up of their maritime-territorial dispute in the East China Sea (Chart 4). Chart 4China’s Rare Earth Supply Chain Leverage
U.S.-China: The Tech War And Reform Agenda
U.S.-China: The Tech War And Reform Agenda
The authors’ point is not simply that China’s near-monopoly of rare earths remains a threat to the U.S. supply chain, but that Beijing’s willingness to leverage its advantageous position in the supply chain to coerce its neighbors could be used in other areas. After all, Washington’s reliance on China is rapidly extending to industrial goods that are critical for U.S. defense supply chains, such as munitions for missiles. But Washington’s greatest fear is China’s move into higher-end manufacturing and information technology – and hence the flare-up in tensions over ZTE and Huawei this year. Bottom Line: Technological sophistication and economic output determine which nations rise and which fall over the course of history. While the U.S. can accept China’s eventually surpassing it in economic output, it cannot accept China’s technological superiority. This would translate into military and strategic supremacy over time. Semiconductors: The Next Battlefront While the U.S. lacks a national industrial policy, Beijing has made a concerted effort to promote indigenous production and innovation. The obvious example is Beijing’s state-backed ascent to the top of the global solar panel market. More broadly, China’s export growth has been fastest in the categories of goods where the U.S. has the greatest competitive advantage (Chart 5). Again, the U.S. concern is not market share in itself, but China’s ability to compete as an economically advanced “great power.” Chart 5China’s Comparative Advantage Threatens U.S. Global Market Share
U.S.-China: The Tech War And Reform Agenda
U.S.-China: The Tech War And Reform Agenda
Semiconductors are rapidly becoming the next major battleground, as China is trying to build its domestic industry and the U.S. is considering a new slate of export controls that could constrict the flow of computer chips to China.3 Semiconductors are critical as the building blocks of the next generation of technologies. The semiconductor content of the world’s electronic systems is ever rising. Breakthroughs such as artificial intelligence and the Internet of Things (IoT) promise to create a huge boost in demand for chips in the coming decades. China’s predicament is that the U.S. and its allies control 95% of the global semiconductor market (Chart 6), and yet China is the world’s largest importer, making up about a third of all imports, and its largest consumer (Chart 7). This is a dangerous vulnerability that China has been working to mitigate. Back in 2014 Beijing launched a $100-$150 billion semiconductor development program and has more or less stuck with it. The Made in China 2025 program projects that China will produce 70% of its demand for integrated circuits by 2030 (Chart 8). Chart 6China’s Chip Makers Are Still Small Fry
U.S.-China: The Tech War And Reform Agenda
U.S.-China: The Tech War And Reform Agenda
Chart 7China Accounts For 60% Of Global Semiconductor Demand
U.S.-China: The Tech War And Reform Agenda
U.S.-China: The Tech War And Reform Agenda
While China-domiciled chip companies have a long way to go, they are rising rapidly, and China has already become a big player in global semiconductor equipment manufacturing (18% market share to the U.S.’s 11%). Chart 8Made In China 2025 Targets
U.S.-China: The Tech War And Reform Agenda
U.S.-China: The Tech War And Reform Agenda
The problem for the U.S. is that semiconductors are one area where China runs a large trade deficit. Indeed, the U.S.’s share of China’s market is somewhat larger than the U.S. share of the global market, suggesting that the U.S. has not yet gotten shut out of the market (Chart 9). Chart 9U.S. Chips Still Have An Edge In China
U.S.-China: The Tech War And Reform Agenda
U.S.-China: The Tech War And Reform Agenda
Moreover, 60% of U.S. semi imports from China and 70% of exports are with “related parties,” i.e. U.S. corporate subsidiaries operating in China. The U.S.’s highly competitive semiconductor industry is the most exposed to the imposition of tariffs (Chart 10). This may explain why so many exemptions were granted to the U.S. Trade Representative’s third tariff schedule: out of $37 billion in semi-related Chinese imports to face tariffs, $22.9 billion were given waivers.4 Chart 10Tariffs Are Harmful To U.S. Chip Makers
U.S.-China: The Tech War And Reform Agenda
U.S.-China: The Tech War And Reform Agenda
The Barack Obama administration, initially faced with China’s disruptive entrance into this sector, determined that the U.S.’s best response would be to “win the race by running faster.” A council on science and technology warned that the U.S. would have to make extensive investments in STEM education, job retraining, manufacturing upgrades, research and development, international collaboration, and export promotion in order to stay ahead.5 However, these initiatives proved to be either too rhetorical (due to policy priorities and gridlock in Washington) or too slow-in-coming to make a difference in light of China’s rapid state-directed investments under the Xi Jinping administration. The Trump administration has obviously taken a more punitive approach. Trump originally focused on China’s alleged currency manipulation and criticized its large trade surpluses with the United States, but his focus has evolved since taking office. Under the influence of U.S. Trade Representative Robert Lighthizer – who is now heading up the 90-day talks – Trump’s complaints have given way to a Section 301 investigation into forced technology transfers, intellectual property theft, and indigenous innovation. This investigation eventually provided the justification for imposing tariffs on $250 billion worth of Chinese imports. Over this time period, it has become clear that there is considerable consensus across the U.S. government, on both sides of the aisle, to take a more aggressive approach with China that includes tariffs, sanctions, foreign investment reviews, and potentially new export controls. Significantly, the high-tech conflict has escalated separately from the trade war: it operates on a different timeline and according to a different set of interests. For example: The ZTE affair: The Commerce Department’s denial order against telecoms equipment maker ZTE came on April 15, even as the U.S. and China were trying (ultimately failing) to negotiate a trade deal to head off the Section 301 tariffs. CFIUS reforms: The U.S. Congress proceeded throughout the summer on its efforts to modernize the Committee on Foreign Investment in the United States, culminating in the Foreign Investment Risk Review Modernization Act (FIRRMA). The Treasury Department released its implementing rules for the law in October, which will take effect even as trade negotiations get underway. The secretive body’s major actions have always been to block deals with China or related to China (Table 1). Table 1U.S. Foreign Investment Reviews Usually Hit China
U.S.-China: The Tech War And Reform Agenda
U.S.-China: The Tech War And Reform Agenda
Chipmaker sanctions: The U.S. Department of Justice indicted Chinese chipmaker Fujian Jinhua Integrated Circuit despite the November diplomatic “thaw” between the two countries in preparation for the G20 summit.6 This action occurred even as top American and Chinese diplomats and generals engaged in talks intended to simmer down strategic tensions in the South China Sea and elsewhere. New export controls: Despite the 90-day trade talks scheduled through March 1, the U.S. government is currently holding public hearings on whether to expand U.S. export controls to cover a range of emerging technologies. These hearings, to conclude on December 19, are being held pursuant to the Export Control Reform Act signed into law in August along with the CFIUS reform. Most recently, the arrest of Meng Wanzhou, the CFO of Huawei, falls into this trend – casting doubt on the viability of the tariff ceasefire and forthcoming trade talks. The incident highlights how the pace, scale, and momentum of the tech conflict are substantial and will be difficult to reverse. Furthermore, the U.S. is building alliances with like-minded Western countries in order to encourage a unified embargo of Huawei, ZTE, and potentially other Chinese tech companies. In particular the U.S. and its allies are trying to block Chinese companies out of their upcoming 5G networks. The U.S. banned Huawei back in 2012, but it fears that allied countries – particularly those that host U.S. military bases – will have their commercial networks compromised by Huawei.7 5G will enable superfast connections that form the basis of the Internet of Things. If Huawei is embedded in 5G networks, it could theoretically gain unprecedented penetration into Western society and industry. Since China’s Communist Party has prioritized the “fusion” of civilian capabilities with military,8 and since the country’s security forces and cyber regulators are authorized to have access to Chinese companies’ critical infrastructures and data at will, American government departments have been soliciting allied embassies not to adopt Huawei as a supplier despite its competitive pricing and customizability. Australia, New Zealand, and Japan have effectively banned Huawei from 5G for their own reasons; the U.K. and others are considering doing the same. The expansion of this coalition creates a difficult backdrop for negotiating a final trade deal by March 1. And yet the G20 ceasefire clearly improved the odds of such a deal. So what will break first, the tech war or the trade ceasefire? Bottom Line: The tech war is intensifying even as the trade war takes a pause. The large-scale U.S. mobilization of a coalition of states opposed to China’s growing presence is a bad sign for the 90-day talks, though so far they are intact. What A Deal Might Look Like To get a sense of whether the tech war will upend the trade talks, or vice versa, we need to consider what a final trade deal that includes the U.S.’s technological demands would look like. It is significant that on November 20, the eve of the G20 summit, U.S. Trade Representative Lighthizer released a report updating the findings of his Section 301 investigation.9 Lighthizer’s position matters because he is leading the 90-day talks and a critical swing player within the administration.3 Lighthizer’s report is essentially the guideline for the U.S. position in the 90-day talks. It makes the following key claims: China has not altered its abusive and discriminatory trade practices since the Section 301 investigation was concluded. These practices include grave accusations of cyber-theft and industrial espionage. The report also argues that China’s state-driven campaign to acquire tech through mergers and acquisitions is ongoing, despite the drop in Chinese mergers and acquisitions in the United States over 2017-18 (Chart 11). The reason, the USTR alleges, is that China tightened controls on investment in real estate and other non-strategic sectors (essentially capital flight from China), whereas Chinese investment to acquire sensitive technology in Silicon Valley is still intense and is being carried out increasingly through venture capital deals (Chart 12). Chart 11M&A No Longer China’s Best Way To Get Tech...
U.S.-China: The Tech War And Reform Agenda
U.S.-China: The Tech War And Reform Agenda
Chart 12...Now Venture Capital Deals Offer A Better Way
U.S.-China: The Tech War And Reform Agenda
U.S.-China: The Tech War And Reform Agenda
China’s concessions so far are “incremental” and in some cases deceptive. For instance, China’s propaganda outlets have de-emphasized the “Made in China 2025” program even though the government is continuing apace with this program, as well as other state-subsidized industrial programs that utilize stolen tech, such as the “Strategic Emerging Industries” (SEI) policy. Not only has China maintained certain targets for domestic market share in key technologies, but modifications to the program have in some cases increased these targets, such as in the production of “new energy vehicles” (Chart 13). Other concessions, such as on foreign investment equity caps, are similarly unsatisfactory thus far, according to the USTR. For instance, China’s pledge gradually to allow foreigners to operate wholly owned foreign ventures in the auto sector is said to arrive too late to benefit foreign car manufacturers, who have already spent decades building relationships under required joint ventures. Chart 13The Opposite Of U.S.-China Compromise
U.S.-China: The Tech War And Reform Agenda
U.S.-China: The Tech War And Reform Agenda
Trade partners share the U.S.’s concerns and are taking actions to address the same problems. In addition to the aforementioned actions on the 5G, the EU is developing foreign investment review procedures for the first time. Foreign industry groups share the U.S. business lobby’s fear of China’s forced tech transfers. Ultimately, Lighthizer’s report shows both that a trade deal is possible and that it will be extremely difficult to achieve: Possible, because while the report touches on deep structural factors underlying China’s practices, it emphasizes technical issues. Since these issues can often be adjusted by degree, there is ostensibly room to bargain. Difficult, because the main takeaway of the report is that the U.S. is giving China an ultimatum to stop cyber theft and industrial espionage. At minimum, the U.S. will demand assurances that China’s military, intelligence, and cyber agencies will rein in their hacking, spying, and tech acquisition campaigns. Other disputes are more susceptible to tradeoffs, but it will be hard for the U.S. to compromise on a list of grievances that so plainly enumerates national security violations. Can China really compromise on aspects of its Made in China 2025 industrial plan? Possibly. What China cannot compromise on is technological advancement in general, since its future economic sustainability and prosperity depend on it. So China may not accept getting shut out of investment opportunities in Silicon Valley. But if the 2025 plan provokes foreign sanctions, then it interferes with China’s technological advance, and hence can be compromised in order to achieve China’s true end. It makes sense for China and the U.S. to focus on the above tech issues – that is, for the “structural” part of the trade talks – as opposed to any macroeconomic structural demands that are more difficult to pull off at a time when China’s credit cycle is exceedingly weak and the economy is slowing. For instance, on China’s currency, while the U.S. will have to have some kind of agreement, and China has already shown it will allow some appreciation to appease the U.S., China is highly unlikely to agree to a dramatic, Plaza Accord-style currency appreciation. Therefore the negotiators will have to accept a nominal agreement on currency practices, perhaps as an addendum as was done with the U.S.-Korea trade renegotiation. As for other strategic tensions, China is continuing to support the Trump administration’s diplomatic efforts with North Korea. Therefore the U.S. is unlikely to get much traction on its demand that China remove missiles from the South China Sea. But unlike cyber theft and corporate hacking, the South China Sea could conceivably be set aside for the purposes of a short-term trade deal and left for later rounds of negotiations, much as Trump’s border wall with Mexico was set aside during the NAFTA renegotiation. Bottom Line: The U.S. is demanding that China (1) rein in its hacking and spying (2) shift its direct investment to less tech-sensitive sectors (3) adjust its Made in China targets to allow for more foreign competition (4) lower foreign investment equity restrictions. Our sense, from looking at these demands, is that a trade deal is possible. But given the underlying strategic rivalry, and the intensity of the tech conflict, we think it is more likely that the tech war will ultimately derail the trade talks than vice versa. China’s Reform And Opening Up Turns 40 Finally, a word about China’s reforms, which are no longer discussed much by investors, given that many of the ambitious pro-market reforms outlined at the 2013 Third Plenum flopped. This month marks the 40th anniversary of China’s “Reform and Opening Up” policies under Deng Xiaoping. The original Third Plenum, the third meeting of the 11th Central Committee at which Deng launched his sweeping policy changes, occurred on December 18-22, 1978. In the coming days, General Secretary Xi Jinping will commemorate the anniversary with a speech. Various party media outlets have been celebrating reform and opening up over the past few months. We have no interest in adding to the hype. But we do wish to highlight the interesting overlap in the deadline for the trade talks, March 1, with the annual meeting of China’s legislature, when new policy initiatives are rolled out. To conclude a substantive trade deal, China needs to make at least a few structural concessions. And to satisfy the Trump administration, these concessions will have to be implemented, not merely promised, since the administration has argued consistently that past dialogues have gone on forever without tangible results. The surest way to achieve such a compromise would be to strike a trade deal and then begin implementation at the appropriate time in China’s own political calendar, which would be the March NPC session – right after the 90-day negotiation period ends. What kind of structural changes might China make? Of the four points outlined above, the one that is likely to get the most traction is lifting foreign venture equity caps (Table 2). This would be substantive because it would remove an outstanding structural barrier to foreign market access – China’s prohibitive FDI environment – while depriving China of a means of pressuring firms into conducting technology transfers. It would also have the added benefit of attracting investment that could push up the renminbi. Table 2China’s Foreign Investment Equity Caps
U.S.-China: The Tech War And Reform Agenda
U.S.-China: The Tech War And Reform Agenda
In this context, we will watch very carefully both for progress in the 90-day talks and for any new and concrete proposals within President Xi’s upcoming economic statements. This includes the annual Central Economic Work Conference as well as the 40th anniversary of the historic Third Plenum. Bottom Line: The basis for a substantial U.S.-China trade deal would be Chinese structural changes to grant the U.S. (and others) greater market access for investment and a safer operating environment for foreign intellectual property. While we remain pessimistic, the reform agenda is important to watch. Investment Conclusions We continue to believe that a final trade deal between the U.S. and China is not likely forthcoming – at least not in the 90-day timeframe. The difficulty of working out a deal with the tech issues above should support this baseline view. Nevertheless, given that there is a possible path forward, and given that Chinese tech stocks are heavily oversold, is now a good time for investors to buy? Our view is no, on a cyclical 6-12 month horizon. Relative to the MSCI China investable index, tech stocks are not so badly beaten down as they first appear (Chart 14). The incredible earnings performance of this sector over the past five years has rolled over lately, as reflected in trailing earnings-per-share. This is true relative to U.S. tech stocks and the global equity market as well (Chart 15). Chart 14China's Tech Selloff In Line With Market
China's Tech Selloff In Line With Market
China's Tech Selloff In Line With Market
Chart 15Tech Earnings Rolled Over Pre-Tariffs
Tech Earnings Rolled Over Pre-Tariffs
Tech Earnings Rolled Over Pre-Tariffs
Since this is a decline in trailing earnings, it does not stem from the trade war, but rather from internal factors like consumer sentiment and retail sales (given the large weights of consumer-related firms like Alibaba and Tencent in this sector). Relative to global tech stocks, Chinese tech has definitely become less expensive after the recent selloff. But they are still not cheap (Chart 16). Given the headwinds outlined above – the fact that the tech war is more likely to derail the trade talks than the trade talks are likely to resolve the tech war – we think it is too early to bottom-feed. Chart 16Tech Stocks Not All That Cheap
Tech Stocks Not All That Cheap
Tech Stocks Not All That Cheap
In short, U.S.-China tensions are rising when looked at from the perspective of, first, China’s aggressive state-backed industrial programs and technological acquisition and, second, the U.S.’s emerging technological protectionism and alliance formation. Two long-term implications can be drawn: First, many of the United States’ complaints stem not only from China taking advantage of its economic openness, but also from the U.S.’s low-regulation environment and opposition to state-driven industrial policy. The U.S. will not have much luck demanding that China stop pouring billions of dollars of government funds into its nascent industries; it will deprive its own emerging sectors of funds if it prevents Chinese investment into Silicon Valley. In other words, the U.S. will have to become less open and more heavily regulated. The CFIUS reforms and the proposed export controls highlight this trend. In addition, any escalation of tensions will likely result in Chinese reprisals against U.S. companies. The U.S. tech sector is the marginal loser (Table 3). Table 3S&P Tech Companies With Large China Exposure
U.S.-China: The Tech War And Reform Agenda
U.S.-China: The Tech War And Reform Agenda
Second, while it is often believed that China is playing “the long game,” the government’s technological acquisition policies suggest a very short-term modus operandi. The allegations of widespread and flagrant use of tech company employees by intelligence agencies, and gross cyber intrusions, if true, imply that China is making a mad dash for technology even at the risk of alienating its trading partners and driving them into a coalition against it. Since no government can overlook the national security implications of such practices, China will continue to suffer from foreign sanctions and embargoes, until it convinces foreign competitors it has changed its ways. As a result, China’s tech and industrial sectors are the marginal losers. The big picture is that the U.S. is setting up a “firewall” of rules and regulations to protect its knowledge and innovation, and China is frantically “downloading” as much data as possible before the firewall is fully operational. This dynamic will be difficult to reverse given that the overall context is one of rising suspicion and strategic distrust. Matt Gertken, Vice President Geopolitical Strategy mattg@bcaresearch.com Jonathan LaBerge, CFA, Vice President Special Reports jonathanl@bcaresearch.com Footnotes 1 The Rise and Fall of the Great Powers: Economic Change and Military Conflict from 1500-2000 (Random House, 1988). 2 Please see “Assessing and Strengthening the Manufacturing and Defense Industrial Base and Supply Chain Resiliency of the United States,” Interagency Task Force in Fulfillment of Executive Order 13806, September 2018, available at media.defense.gov. 3 Please see U.S. Bureau of Industry and Security, “Review of Controls for Certain Emerging Technologies,” Department of Commerce, November 19, 2018, available at www.federalregister.gov. 4 Please see Dan Kim, "Semiconductor Supply Chains and International Trade,” SEMI ITPC, November 5, 2018. 5 Please see President’s Council of Advisors on Science and Technology, “Ensuring Long-Term U.S. Leadership In Semiconductors,” Report to the President, January 2017, available at obamawhitehouse.archives.gov. 6 Please see Department of Justice, “PRC State-Owned Company, Taiwan Company, and Three Individuals Charged With Economic Espionage,” Office of Public Affairs, November 1, 2018, available at www.justice.gov. 7 Please see Stu Woo and Kate O’Keeffe, “Washington Asks Allies To Drop Huawei,” Wall Street Journal, November 22, 2018, available at www.wsj.com. 8 Please see Lorand Laskai, “Civil-Military Fusion and the PLA’s Pursuit of Dominance in Emerging Technologies,” China Brief 18:6, April 9, 2018, available at Jamestown.org. 9 Please see Office of the United States Trade Representative, “Update Concerning China’s Acts, Policies, And Practices Related To Technology Transfer, Intellectual Property, And Innovation,” dated November 20, 2018, available at ustr.gov.
Overweight (High-Conviction) One of the key themes for 2019 we noted in Monday’s Weekly Report is the later stages of the U.S. capex upcycle; we highlight our high-conviction overweight recommendation on the S&P software index, a hold-over from last year, which is levered to this theme. As shown in the top panel, relative capital outlays and the share price ratio are joined at the hip. Software upgrades offer the simplest, quickest and most effective capital deployment, especially when productivity gains ground to a halt. Importantly, leading indicators of overall capex remain upbeat and should continue to underpin software profits (second panel). The recovery in the software price deflator (bottom panel), a proxy for industry pricing power, corroborates the upbeat demand backdrop. With regard to financial statements, software stocks have pristine balance sheets with more cash on hand than debt, which sustains the net debt-to-EBITDA ratio in negative territory. Interest coverage is great at 10x and free cash flow generation is expanding smartly. Bottom Line: Software stocks should remain core tech holdings in equity portfolios; we reiterate our high-conviction overweight recommendation. Please see Monday’s Weekly Report for more details. The ticker symbols for the stocks in this index are: BLBG: S5SOFT - MSFT, ORCL, ADBE, CRM, INTU, RHT, ADSK, SNPS, CTXS, ANSS, CDNS, FTNT and SYMC.
Software Still Has Room To Run
Software Still Has Room To Run
Highlights Portfolio Strategy Higher interest rates, with the Federal Reserve tightening monetary policy three more times in the next seven months, will be the dominant theme next year. All four of our high-conviction underweight calls are levered to this theme. The later stages of the U.S. capex upcycle underpin three of our high-conviction overweight calls for 2019. Recent Changes Downgrade the S&P Home Improvement Retail index to underweight today. Trim the S&P Interactive Media & Services index to a below benchmark allocation today. Table 1
2019 Key Views: High-Conviction Calls
2019 Key Views: High-Conviction Calls
Feature Fed policy will dominate markets next year as the dual tightening backdrop – rising fed funds rate and accelerated downsizing of the Fed balance sheet – remains intact. Two weeks ago we raised the question: is the Fed tightening monetary policy too far too fast?1 In more detail, we put the latest monetary tightening cycle in historical perspective and examined trough-to-peak moves in the fed funds rate since the 1950s (Chart 1). Chart 1Too Far Too Fast?
Too Far Too Fast?
Too Far Too Fast?
A good friend I call “the smartest man in California” correctly pointed out that 500bps of tightening today is not the same as in the 1970s or 1980s. Chart 2 adjusts for that by including the average nominal GDP growth rate during these tightening episodes and adds more color to each era. As a reminder, the latest cycle that commenced in December 2015 is already 25bps above the median, if one uses the Wu-Xia shadow fed funds rate to capture the full quantitative easing effect, and above-average nominal output growth. Chart 2Trough-To-Peak Tightening Cycle Already Above Historical Median
2019 Key Views: High-Conviction Calls
2019 Key Views: High-Conviction Calls
Trying to answer the question, we are concerned that as the Fed remains committed to tighten monetary policy three more times by mid-2019, a yield curve inversion looms, especially if the U.S. economy suffers a soft patch in the first half of next year (please refer to our Economic Impulse Indicator analysis in the October 22ndand November 19th Weekly Reports). This would signal at least a pause, if not reversal, in Fed policy. With that in mind, this week we are revealing our high-conviction calls for 2019. Four of our calls are a play on this tightening monetary backdrop that is one of BCA’s themes for next year.2 The later stages of the U.S. capex upcycle underpin three of our high-conviction calls. Table 22018 High-Conviction Calls Recap
2019 Key Views: High-Conviction Calls
2019 Key Views: High-Conviction Calls
However, before we highlight our 2019 high-conviction calls in detail, Table 2 tallies our calls from last year. We had a stellar performance in our 2018 high-conviction calls with an average excess return of 11.6% versus the S&P 500. As the year turns the corner, closing out the remaining calls brings down the average relative return to 7.5%, still a very impressive number, with a total of ten hits and only two misses for the year. Anastasios Avgeriou, Vice President U.S. Equity Strategy anastasios@bcaresearch.com Software (Overweight, Capex Theme) Software stocks are our first hold out from last year’s high-conviction overweight list, levered to the capex upcycle theme. Chart 3 shows that relative capital outlays and the share price ratio are joined at the hip. Software upgrades offer the simplest, quickest and most effective capital deployment, especially when productivity gains ground to a halt. Importantly, leading indicators of overall capex remain upbeat and should continue to underpin software profits. Beyond capex, M&A has been fueling software stock prices. It did not take long for the large CA acquisition to get surpassed by RHT and more recently SYMC was also rumored to be in play (Chart 3). Inter-industry M&A activity is reaching fever pitch and this frenzy is bidding up premia to stratospheric levels. The push to the cloud, SaaS and even AI has boosted the appeal of software stocks and brought them to the forefront of potential takeout candidates. These are secular trends and will likely continue to gain steam irrespective of the different stages in the business cycle. As a result, software stocks should remain core tech holdings in equity portfolios. The recovery in the software price deflator (Chart 3), a proxy for industry pricing power, corroborates the upbeat demand backdrop. With regard to financial statements, software stocks have pristine balance sheets with more cash on hand than debt, which sustains the net debt-to-EBITDA ratio in negative territory. Interest coverage is great at 10x and free cash flow generation is expanding smartly. The ticker symbols for the stocks in this index are: BLBG: S5SOFT - MSFT, ORCL, ADBE, CRM, INTU, RHT, ADSK, SNPS, CTXS, ANSS, CDNS, FTNT and SYMC. Chart 3Software
Software
Software
Air Freight & Logistics (Overweight, Capex Theme) Air freight & logistics stocks are the second hold out from our high-conviction overweight list, although we added it to list only in late-March. This transportation sub-index laggered is a capex and trade de-escalation play for the first half of 2019. Importantly, energy costs comprise a large chunk of freight services input costs and the recent drubbing in oil markets will boost margins especially on the eve of the busiest season for courier delivery services (top panel, Chart 4). On that front, there are high odds that this holiday sales season will be another record setting one, as wage inflation is underpinning discretionary incomes. Keep in mind that the accelerating domestic manufacturing shipments-to-inventories ratio confirms that demand for hauling services is upbeat. The implication is that rising demand for freight services will buoy industry profits and lift valuations out of their recent funk (Chart 4). Firming industry operating metrics also tell a positive story and suggest that relative share prices will soon take off. Air freight pricing power has been healthy, in expansionary territory and above overall inflation measures. While the U.S./China trade tussle and the appreciating greenback are clear risks to our sanguine S&P air freight & logistics transportation subindex, most of the grim news is already reflected in depressed relative forward profit estimates, bombed out valuations and washed out technicals (Chart 4). The ticker symbols for the stocks in this index are: BLBG: S5AIRF - FDX, UPS, EXPD and CHRW. Chart 4Air Freight & Logistics
Air Freight & Logistics
Air Freight & Logistics
Defense (Overweight, Capex Theme) We have been overweight the pure-play BCA defense index since late-2015 and there are high odds that this juggernaut that really commenced with the George Walker Bush presidency remains in a secular growth trajectory. Our strategy is to add exposure on any meaningful pullbacks and keep this index as a structural overweight within the GICS1 S&P industrials index. The recent drawdown offers such an opportunity and we are adding this index to the 2019 high-conviction overweight list. The rise of global "multipolarity" - or competition between the world's great nations - and the decline of globalization, along with a global arms race and increased risk of cyber-attacks, have been documented in our "Brothers In Arms" Special Report. These trends all signal that global defense related spending will remain upbeat in the coming decade.3 In the U.S. in particular, where military spending in absolute terms is greater than the rest of the world put together, defense spending and investment have bottomed and will continue to accelerate (Chart 5). In fact, the CBO continues to project that defense outlays will jump further next year. While such a breakneck pace is clearly unsustainable, President Trump is serious about upgrading and updating the U.S. military in order to keep China's geopolitical and military ascendancy in check (as well as to deal with Russia and Iran).4 The upshot is that defense outlays will continue to expand into the 2020s. Such a buoyant demand backdrop is music to the ears of defense contractor CEOs, and represents a boost to defense equity revenue growth prospects. This capital goods sub-industry has extremely high fixed costs and thus any increase in top line growth flows straight to the bottom line. Put differently, defense contractors enjoy high operating leverage. No wonder M&A activity is robust: at least four large deals have been announced in the past year that are underpinning takeout premia. A closer look at operating metrics corroborates that defense goods manufacturers are firing on all cylinders. New orders recently jumped to fresh all-time highs and the industry's shipments-to-inventories ratio is rising, on track to surpass the 2008 peak. Unfilled orders are also running at a high rate, signaling that factories will keep on humming at least for the next few quarters. Importantly, the industry is not standing still and is making significant investments. U.S. defense capex as reported in the financial statements of constituent firms is growing at roughly 20%/annum or twice as fast as overall capex (Chart 5 on page 7). While interest coverage has been modestly deteriorating, it is twice as high as the overall market (Chart 5 on page 7). Impressively, defense ROE is running near 30%, again roughly double the rate of the broad market. The ticker symbols for the stocks in the BCA defense index are: LMT, LLL, NOC, GD and RTN. Chart 5Defense
Defense
Defense
Consumer Discretionary (Underweight, Higher Fed Funds Rate Theme) We recommend investors avoid the consumer discretionary sector that suffers when interest rates rise. Chart 6 depicts this inverse correlation consumer discretionary equities have with interest rates, especially the fed funds rate. Most discretionary equites are levered off of floating rates and thus any increase in the fed funds rates gets reflected immediately in banks' prime lending rate. Also, most consumer debt is floating rate debt and thus tighter monetary conditions, at the margin, dampen consumer debt uptake and, as a knock-on effect, weigh on discretionary consumer outlays. Recently we highlighted that, now that the Fed has been raising rates and allowing bonds to roll off its balance sheet, volatility is making a comeback. Unsurprisingly, the consumer discretionary share price ratio is inversely correlated with the VIX index, signaling that more pain lies ahead for this early cyclical index (VIX shown inverted, Chart 6). Sentiment and technical indicators also point to more downside ahead for this interest-rate sensitive index. Our sector advance/decline line is waning and EPS breadth has plunged. Worrisomely, sell-side analysts are penciling in an extremely optimistic 5-year outlook with EPS growth 23.4%/annum or 1.4 times higher than the overall market. Clearly this is not realistic as it assumes a tripling of EPS in the coming 5 years. Relative EPS estimates have already given way as AMZN commands very little EPS weight, despite its massive market cap weight (30% of the S&P consumer discretionary sector), and suggests that relative share prices will converge lower (Chart 6 on page 9). As a result, the 12-month forward P/E ratio is trading at a 24% premium to the broad market and significantly above the historical mean. Technicals are almost as extended as relative valuations and cyclical momentum has likely peaked, warning that a downdraft in relative share prices looms (Chart 6 on page 9). Chart 6Consumer Discretionary
Consumer Discretionary
Consumer Discretionary
Home Improvement Retail (Underweight, Higher Fed Funds Rate Theme) While the probablity of a housing recession remains low, we are concerned that too much euphoria is already priced in the S&P home improvement retail (HIR) index, and there are high odds that next year HIR will suffer the same fate as homebuilders did this year (Chart 7). Thus, we are downgrading the S&P HIR index to underweight and adding it to the high-conviction underweight list for 2019. Fixed residential investment (FRI) as a percentage of GDP is up 50% from trough to the recent peak, whereas relative HIR performance is up 170% in the same time frame. Our worry is that optimistic sell side analysts' relative profit forecasts will be hard to attain, let alone surpass as FRI is steadily sinking (Chart 7). Worrisomely, our HIR model has plunged on the back of the wholesale liquidation in lumber prices and rising interest rates (Chart 7). Lumber deflation will prove a profit headwind as building supply Big Box retailers make a set margin on wood products. Select industry operating metrics suggest that the easy profits are behind HIR. Not only is our productivity growth proxy (sales per employee) on the verge of deflating, but also an inventory surge has sunk the HIR sales-to-inventories ratio into the contraction zone. Finally, there is rising supply of new and existing homes for sale already on the market, and that puts off remodeling activity at least until this supply glut clears (months' supply shown inverted, Chart 7). The ticker symbols for the stocks in this index are: BLBG: S5HOMI - HD, LOW. Chart 7Home Improvement Retail
Home Improvement Retail
Home Improvement Retail
Short Small Caps/Long Large Caps (Higher Fed Funds Rate Theme) The days in the sun are over for small cap stocks and we are compelled to put the size bias favoring large caps in our high-conviction calls list for 2019. Small caps are severely debt saddled. Sustained small cap balance sheet degradation is worrying, with S&P 600 net debt-to-EBITDA close to 4 compared with less than 2 for the SPX (Chart 8). Such gearing is fraught with danger as the default rate has nowhere to go but higher. Small and medium enterprises (SMEs) have a higher dependency on bank credit as opposed to the bond market access that mega caps enjoy. Most bank credit is floating rate debt and so are lines of credit, and as the Fed remains firm on tightening monetary policy, interest expense costs are skyrocketing for SMEs. In a relative sense this will weigh on net profits. Moreover, small caps are a lot more sensitive to interest rates, and the selloff in the 10-year Treasury note heralds more pain in 2019 (Chart 8). Small caps are high(er) beta stocks and when volatility spikes they underperform large caps. When the Fed ballooned its balance sheet and dropped the fed funds rate to zero it suppressed volatility. Now that the Fed has been decreasing the size of its balance sheet and raising interest rates, this is working in reverse and volatility is making a comeback as we have been highlighting in our research, and will continue to weigh on small caps (VIX shown inverted, middle panel, Chart 8). Another way to showcase small caps' riskier status is the close correlation they have with the relative EM equity share price ratio. When EMs outperform the SPX, small caps follow suit and vice versa. Importantly a wide gap has opened recently and we suspect that it will narrow via small caps following the EM higher beta stocks lower (SPX vs. EM ratio shown inverted, fourth panel, Chart 8 on page 12). Chart 8Small Vs. Large
Small Vs. Large
Small Vs. Large
Interactive Media & Services (Underweight, Higher Fed Funds Rate Theme) In our initiation of coverage on the S&P interactive media & services index,5 we highlighted three key risks that offset the revenue & profit growth vigor of this group, comprised almost entirely of Alphabet (Google) and Facebook. These were a renewed regulatory focus, rapid unpredictable changes in tastes & technology and an appreciating U.S. dollar. It is the first of these that has risen most dramatically since that report. Tack on the inverse correlation these growth stocks have with interest rates (top panel, Chart 9) and that is causing us to lower our recommendation to underweight and include this index in the high-conviction underweight list for 2019. Increasing regulatory efforts on technology will be a key theme next year, one we explored this past summer.6 Our conclusion was that both antitrust (particularly in the case of Alphabet) and privacy regulation (particularly in the case of Facebook) added significant risk to these near monopolies; calls for legislating both have dramatically amplified. Tim Cook, Apple’s CEO, recently commented that more regulation for Facebook and Alphabet was inevitable; we agree. While the form such regulation might take remains open to debate (for example, the U.S. could adopt an EU-style General Data Protection Regulation (GDPR)), we fear the associated headline risk (not to mention likely profit headwinds) will impair stock prices in the S&P interactive media & services index. This communication services sub-index is particularly prone to such a risk when it already trades at close to a 40% valuation premium to the broad market (middle panel, Chart 9 on page 14). Adding insult to injury is the PEG ratio that is trading at a 60% premium to the broad market (bottom panel, Chart 9 on page 14). In the face of the Fed’s sustained tightening cycle these extreme growth stocks are vulnerable to massive gravitational pull. The ticker symbols in the stocks in this index are: S5INMS – GOOGL, GOOG, FB, TWTR and TRIP. Chart 9Interactive Media & Services
Interactive Media & Services
Interactive Media & Services
Footnotes 1 Please see BCA U.S. Equity Strategy Report, "Manic Market," dated November 19, 2018, available at uses.bcaresearch.com. 2 Please see BCA The Bank Credit Analyst Report, "OUTLOOK 2019: Late-Cycle Turbulence", dated November 26, 2018, available at bca.bcaresearch.com. 3 Please see BCA U.S. Equity Strategy Special Report, "Brothers In Arms," dated October 31, 2016, available at uses.bcaresearch.com. 4 Please see BCA Geopolitical Strategy Special Report, "A Global Show Of Force?" dated October 10, 2018, available at gps.bcaresearch.com. 5 Please see BCA U.S. Equity Strategy Special Report, "New Lines Of Communication," dated October 1, 2018, available at uses.bcaresearch.com. 6 Please see BCA U.S. Equity Strategy Special Report, "Is The Stock Rally Long In The FAANG?", dated August 1, 2018, available at uses.bcaresearch.com. Current Recommendations Current Trades Size And Style Views Favor value over growth Favor large over small caps
Highlights The relative performance of developed market (DM) versus emerging market (EM) equities just corresponds to the relative performance of healthcare versus financials. On a six month horizon, DM will underperform EM. Within Europe, overweight Poland, Hungary and Czech Republic, but steer clear of energy-heavy Russia. Wait for the 10-year BTP yield to move closer to 3 percent before buying Italian assets, either in absolute or relative terms. Buy the pound on any sharp sell-offs during the Brexit psychodrama. Our medium-term expected value of pound/euro equals 1.18. Chart of the WeekDeveloped Vs. Emerging Markets = Healthcare Vs. Financials
Developed Vs. Emerging Markets = Healthcare Vs. Financials
Developed Vs. Emerging Markets = Healthcare Vs. Financials
Feature They say that to capture the Zeitgeist at any moment, all you need to do is name the top five companies in the world. So here are the top five companies in the developed equity markets (DM): Apple, Microsoft, Google, Amazon, and Facebook (Table I-1). Table I-1Developed Markets: Top 5 Companies
DM Versus EM, And Two European Psychodramas
DM Versus EM, And Two European Psychodramas
These five names do perfectly capture the spirit of our time and should not surprise you. Now look at the top five companies in the emerging equity markets (EM): Tencent, Taiwan Semiconductor, Samsung Electronics, Alibaba, and Naspers (Table I-2). Table I-2Emerging Markets: Top 5 Companies
DM Versus EM, And Two European Psychodramas
DM Versus EM, And Two European Psychodramas
What may surprise you is that technology titans dominate in EM markets too. In fact, the technology sector's weighting in EM, at 25 percent, is even larger than in DM, at 19 percent. If technology looms even larger in EM than in DM, what is the defining sector difference between the two regions? The answer is that emerging markets have almost no healthcare stocks, and an offsetting substantial overweighting to financials (Table I-3). Table I-3Developed Markets Versus Emerging Markets: Sector Weights
DM Versus EM, And Two European Psychodramas
DM Versus EM, And Two European Psychodramas
Developed Vs. Emerging Markets = Healthcare Vs. Financials The following is a very different way of looking at the DM versus EM investment decision and, as such, may differ from the BCA house view. As we have demonstrated time and time again on these pages, an equity market's dominant sector skew is of critical importance to investors (Chart I-2). This is because equity sector skews almost always drive regional and country relative performance. Crucially, this fundamental truth applies at the highest level too: the relative performance of DM versus EM. The Chart of the Week should leave you in absolutely no doubt that the relative performance of DM versus EM just corresponds to the relative performance of healthcare versus financials. Chart I-2Developed Versus Emerging Markets: Sector Weight Differences
DM Versus EM, And Two European Psychodramas
DM Versus EM, And Two European Psychodramas
Nevertheless, this striking observation raises a fascinating question: what is the direction of causality? Does healthcare versus financials drive DM versus EM, or in fact does DM versus EM drive healthcare versus financials? The answer is sometimes the former, and at other times the latter. For example, a major slump in emerging economies would undoubtedly drag down global equities. In the ensuing synchronized bear market, the more defensive healthcare sector would almost certainly outperform the financials, and under these circumstances the direction of causality would clearly be from DM versus EM to global sector performance. On the other hand, absent a major bear market, if a reappraisal of sector relative valuations and growth prospects caused a rotation in sector leadership, the causality would run in the other direction: from global sector performance to DM versus EM. Such a reappraisal of sector relative valuations and growth prospects appears to be underway at the moment, and is likely to persist for the next few months. This is because the very sharp down-oscillation in global credit growth which occurred from February through September has now clearly flipped into an up-oscillation. For investors, these oscillations in global credit growth provide excellent tactical opportunities because the oscillations are very regular and therefore predictable; and the cyclical versus defensive sector performance closely tracks the oscillations. So after healthcare's strong outperformance versus financials from February through September, sector relative performance has now flipped into a reverse configuration (Chart I-3). Chart I-3An Up-Oscillation In Global Credit Growth Technically Favours Financials
An Up-Oscillation In Global Credit Growth Technically Favours Financials
An Up-Oscillation In Global Credit Growth Technically Favours Financials
To be clear, this is likely a tactical opportunity lasting no more than six months or so. Nevertheless, from a DM versus EM perspective, it would imply a countertrend move within a structural trend - in which the outperformance of DM versus EM temporarily ends, or even flips into an underperformance (Chart I-4). Chart I-4An Up-Oscillation In Global Credit Growth Technically Favours EM
An Up-Oscillation In Global Credit Growth Technically Favours EM
An Up-Oscillation In Global Credit Growth Technically Favours EM
For European equity investors, the important implication is that developed Europe versus emerging Europe closely tracks broad DM versus broad EM (Chart I-5). Of course, 'emerging Europe' is a misnomer because Poland, Hungary, Czech Republic, and even Russia are developed economies and markets. Nevertheless, as they fall within the MSCI EM index, they tend to move with EM. Chart I-5Developed Europe Vs. Emerging Europe = Developed Markets Vs. Emerging Markets
Developed Europe Vs. Emerging Europe = Developed Markets Vs. Emerging Markets
Developed Europe Vs. Emerging Europe = Developed Markets Vs. Emerging Markets
The upshot is that on a tactical horizon, emerging Europe is likely to outperform developed Europe. However, given our high conviction view that non-energy commodities will continue to outperform energy, focus on Poland, Hungary and Czech Republic and steer clear of energy-heavy Russia. European Psychodrama 1: Italy Vs. The EU In the low-level game of chicken between Italy and the EU Commission over Italy's 2019 budget, the bond market will determine who swerves first. If the 10-year BTP yield rises and stays well above 4 percent, the weakened capital position of Italian banks from lower bond prices combined with deteriorating funding conditions will weigh on bank lending and economic growth. This will put pressure on the Italian government to swerve first and concede ground to the EU's demands. That said, it is hard to know the exact level of yields at which the government would reach its pain threshold. On the other hand, if the 10-year BTP yield falls and stays well below 3 percent, the bond market's insouciance would embolden the Italian government. Moreover, this apparent vote of confidence would be based on sound economics. Italy likely has a very high fiscal multiplier, meaning that a modest increase in its budget deficit to 2.4 percent would more than pay for itself through higher economic growth. Under these circumstances the EU would be under pressure to swerve first and give Italy some room for manoeuvre. The long-term investment opportunity is the Italy versus Spain sovereign 10-year yield spread. At 200 bps, the spread is at its all-time widest, and incongruous with the vanishing gap between the non-performing loans ratios in Italy and Spain. Nevertheless, our recommendation is to wait for the 10-year BTP yield to move closer to 3 percent before buying Italian assets, either in absolute or relative terms (Chart I-6). Chart I-6Remain Neutral Italian Assets Until The 10-Year BTP Yield Moves Closer To 3 Percent
Remain Neutral Italian Assets Until The 10-Year BTP Yield Moves Closer To 3 Percent
Remain Neutral Italian Assets Until The 10-Year BTP Yield Moves Closer To 3 Percent
European Psychodrama 2: Brexit In the psychodrama called Brexit, every new plot twist and turn has the potential to move the pound up or down by a few cents in a day. The next such major twist is the passage of the withdrawal bill through the U.K. parliament in early December. The ultra Brexiteer Conservative MPs and Northern Ireland Unionists will almost certainly vote against the agreement that Theresa May has forged with Brussels. This is because the agreement conjures up the Brexiteers' worst nightmare: a potentially indefinite customs union with the EU27, making it impossible for the U.K. to strike free trade deals with the rest of the world. Hence, for Theresa May to get her agreement through parliament, she will require the support of a substantial number of Labour MPs. But the substantial numbers just aren't there. The upshot is that she is likely to lose the vote, at which point the pound will tumble. For medium-term investors, this would be the moment to buy the pound, and we now explain why. On a six month horizon, the crucial question is: what will happen when the Article 50 process for the U.K. to leave the EU expires at 11pm on March 29, 2019? There are only three possibilities: 1. The U.K. doesn't leave the EU. At this advanced stage on the timeline, not leaving the EU on March 29 2019 effectively means an extension of the Article 50 process. This would require the U.K. to apply for an extension, and for the EU27 to agree to it. But realistically, the EU27 would only agree to it to facilitate a general election and/or a second referendum which could reverse Brexit. Probability = 45%. With the parliamentary arithmetic pointing to a rejection of May's Brexit deal as it stands, an amendment to the withdrawal bill forcing a second referendum, or a lost vote of no confidence in the government could lead to this outcome. Pound/euro = 1.20, because of the realistic prospect of reversing Brexit (Chart I-7). Chart I-7British Public Opinion On Brexit Is Shifting
Long Emerging Markets Vs. Developed Markets
Long Emerging Markets Vs. Developed Markets
2. The U.K. enters a transition period to leave the EU with a negotiated agreement. Theresa May's proposed withdrawal deal, or a variation of it, is approved by the U.K parliament (and the EU27) Probability = 45%. Appropriate amendments to the withdrawal agreement might sufficiently reduce the parliamentary rebellion. Pound/euro = 1.20 because the removal of the 'no deal' outcome would liberate the BoE to hike interest rates. 3. The U.K. crashes out of the EU with 'no deal'. Probability = 10%. This outcome would be the result of a gridlock in the U.K. parliament, with no majority formed for any Brexit strategy. Unlikely, but not impossible. Pound/euro = 1.00 because the U.K. economy would face months of severe disruption and uncertainty. Based on these three possible outcomes on March 29 2019, our expected value of pound/euro equals 1.18. Meaning that any sharp sell-off during the ongoing psychodrama constitutes a medium-term buying opportunity. Dhaval Joshi, Senior Vice President Chief European Investment Strategist dhaval@bcaresearch.com Fractal Trading Model* Supporting the thesis in the main body of this report, the 130-day fractal dimension of EM versus DM recently hit its lower bound, suggesting an oversold extreme and a likely countertrend move. For a short-term trade, position for a 2.5% profit with a symmetrical stop-loss. In other trades, long Portugal / short Hungary hit its stop-loss and is closed, leaving four open trades. For any investment, excessive trend following and groupthink can reach a natural point of instability, at which point the established trend is highly likely to break down with or without an external catalyst. An early warning sign is the investment's fractal dimension approaching its natural lower bound. Encouragingly, this trigger has consistently identified countertrend moves of various magnitudes across all asset classes. Chart I-8
Long Emerging Markets Vs. Developed Markets
Long Emerging Markets Vs. Developed Markets
The post-June 9, 2016 fractal trading model rules are: When the fractal dimension approaches the lower limit after an investment has been in an established trend it is a potential trigger for a liquidity-triggered trend reversal. Therefore, open a countertrend position. The profit target is a one-third reversal of the preceding 13-week move. Apply a symmetrical stop-loss. Close the position at the profit target or stop-loss. Otherwise close the position after 13 weeks. Use the position size multiple to control risk. The position size will be smaller for more risky positions. * For more details please see the European Investment Strategy Special Report "Fractals, Liquidity & A Trading Model," dated December 11, 2014, available at eis.bcaresearch.com Fractal Trading Model Recommendations Asset Allocation Equity Regional and Country Allocation Equity Sector Allocation Bond and Interest Rate Allocation Currency and Other Allocation Closed Fractal Trades Trades Closed Trades Asset Performance Currency & Bond Equity Sector Country Equity Indicators Bond Yields Chart II-1Indicators To Watch - Bond Yields
Indicators To Watch - Bond Yields
Indicators To Watch - Bond Yields
Chart II-2Indicators To Watch - Bond Yields
Indicators To Watch - Bond Yields
Indicators To Watch - Bond Yields
Chart II-3Indicators To Watch - Bond Yields
Indicators To Watch - Bond Yields
Indicators To Watch - Bond Yields
Chart II-4Indicators To Watch - Bond Yields
Indicators To Watch - Bond Yields
Indicators To Watch - Bond Yields
Interest Rate Chart II-5Indicators To Watch - Interest Rate Expectations
Indicators To Watch - Interest Rate Expectations
Indicators To Watch - Interest Rate Expectations
Chart II-6Indicators To Watch - Interest Rate Expectations
Indicators To Watch - Interest Rate Expectations
Indicators To Watch - Interest Rate Expectations
Chart II-7Indicators To Watch - Interest Rate Expectations
Indicators To Watch - Interest Rate Expectations
Indicators To Watch - Interest Rate Expectations
Chart II-8Indicators To Watch - Interest Rate Expectations
Indicators To Watch - Interest Rate Expectations
Indicators To Watch - Interest Rate Expectations
Overweight (downgrade alert) In an August Insight Report, we noted the stratospheric rise of Apple was the key driver of the S&P 500's exceptional run and the S&P tech hardware, storage & peripherals (THSP) index's stellar outperformance.1 In that report, we suggested that clients institute a stop in this high-conviction call at the 10% relative return mark; Apple's fall since the weak outlook provided in their recent earnings report triggered that stop on Friday. Accordingly, we have booked the 10% gain since the April 9, 2018 addition of the S&P THSP index to our high-conviction list. The core rationale for our initial high-conviction overweight recommendation was our capex upcycle theme. However, capex intentions have rolled over, albeit from extended levels, and that should reveal itself in lower real capital deployment growth in general (second panel). More specific to the S&P THSP index, the decelerating investment growth has been pronounced in computers and peripheral equipment (bottom panel), which is corroborated by Apple's slowing sales expansion. Our thesis is thus somewhat dented and we are also compelled to add it to our downgrade watch list. Bottom Line: The recent pullback in the S&P THSP index triggered our stop last Friday and we locked in gains of 10% since inception. The S&P THSP index is now off our high conviction overweight list and we also put it on downgrade alert. The ticker symbols for the stocks in this index are: BLBG: S5CMPE - HPQ, WDC, STX, XRX, AAPL, HPE, NTAP. 1 Please see BCA U.S. Equity Strategy Insight Report, "Tech Hardware Is On Fire," dated August 31, 2018, available at uses.bcaresearch.com.
The Falling Apple And The Law Of Gravity
The Falling Apple And The Law Of Gravity

Inter-industry M&A activity is reaching fever pitch and this frenzy is bidding up premia to stratospheric levels. The push to the cloud, SaaS and even AI has boosted the appeal of software stocks and brought them to the forefront of potential takeout…
Overweight (High-conviction) Despite recent tech stock ills, software stocks continue to defy gravity and remain in a multi-year uptrend, still above the dotcom bubble relative performance highs (top panel). We reiterate our high-conviction overweight status and within tech we continue to prefer the S&P software and S&P tech hardware, storage & peripherals indexes to the early-cyclical tech S&P semis and S&P semi equipment subgroups. While rising M&A premia have been a core driver of software stock performance, industry operating metrics are on fire which supports the elevated industry valuation multiples. Top line growth is accelerating and running at a higher clip than the broad market. The recovery in the software price deflator (middle panel), a proxy for industry pricing power, corroborates this bright demand backdrop. Impressively, labor additions have been muted, implying that margins can expand further and possibly challenge cyclical highs (bottom panel). Overall, feverish software M&A activity, the ongoing capex upcycle, firming industry operating metrics and pristine balance sheets, suggest that software stocks are a must have for equity portfolios; please see Monday's Weekly Report for more details. Bottom Line: The S&P software index remains a high-conviction overweight. The ticker symbols for the stocks in this index are: BLBG: S5SOFT - MSFT, ORCL, ADBE, CRM, INTU, RHT, ADSK, CA, SNPS, CTXS, ANSS, CDNS, FTNT and SYMC.
Software Is In High Demand
Software Is In High Demand