Technology
The dramatic decline in semi equipment stocks has not been arrested in the Q3 earnings season, despite relatively positive results. We think the overall negative sentiment around global tech stocks in general and valuation high-flyers in particular has been…

Highlights Portfolio Strategy Frenzied software M&A activity, the ongoing capex upcycle, firming industry operating metrics and pristine balance sheets suggest that software stocks are a must have for equity portfolios. Rising interest rates along with the Fed's quantitative tightening, the return of volatility, higher gasoline prices, stretched technicals and a lack of a valuation cushion all suggest that it pays to remain bearish consumer discretionary stocks. Recent Changes We lifted the S&P Industrial Conglomerates index to overweight in a Sector Insight on Wednesday last week.1 Table 1
Recuperating
Recuperating
Feature Chart 1Stocks Are...
Stocks Are…
Stocks Are…
The S&P 500 found its footing last week, but the volatility comeback assures more violent oscillations before equities resume their upward trajectory. Crash-prone October lived up to its reputation but it is now over, and once the midterm election uncertainty passes this week, investors will refocus their attention on the U.S./China trade war and U.S. economic growth. Trump's moderating approach on the former was welcome news last week, and any further de-escalation signs in the trade tussle will breathe a huge sigh of relief for equities. On the investment front, the 10% SPX drawdown triggered our "buy the dip" strategy on Friday October 26 (please see the "Time To Bargain Hunt" Sector Insight), when we put to work longer-term oriented capital. Our "buy the dip" view remains intact, as we still do not foresee a recession in the coming 9-12 months. On the volatility front, the CBOE SKEW index, a measure of tail risk,2 is sending a positive message as investors are no longer buying tail risk protection as they did in August. Interestingly, as the nominal level of the SPX has been increasing over the decades so has the price of tail risk protection (Chart 1). We view the recent collapse in the CBOE SKEW index as a positive indication that the worst may be behind the equity market. With regard to global flows to U.S. shores, the Treasury International Capital (TIC) System data revealed that global portfolio managers were not chasing U.S. equities this summer as they had been at the beginning of the year. The likely current trough in net foreign portfolio flows into U.S. equities should, at the margin, underpin U.S. stocks (Chart 2). Chart 2... Likely Out Of The Woods...
... likely out of the woods…
... likely out of the woods…
On the U.S. economic front, the latest GDP release revealed that housing is indeed softening. This is the first time since the GFC that residential investment's contribution to real GDP growth turned negative for three consecutive quarters. Tack on decelerating house prices and collapsing lumber prices (Chart 3) and residential real estate confirms the yellow flag from our recently introduced Economic Impulse Indicator.3 Chart 3...But Housing Poses A Risk
...but housing poses a risk
...but housing poses a risk
While house prices are decelerating, corporate pricing power remains upbeat. True, investors focused on anecdotes about input cost inflation this earnings season and all but ignored evidence that companies across different sectors have been able, and will continue, to raise selling prices by more than the rise in wage and commodity costs. Thus, corporate profit margin squeeze fears are overblown; they are likely a risk for the back half of 2019, especially if volume growth suffers a setback. This week we are updating our corporate pricing power gauge. While our overall proxy has ticked down, it is still clocking higher than wage inflation. In fact, our pricing power diffusion index shows excellent breadth (second panel, Chart 4). This firming corporate inflation backdrop suggests that businesses have been successful in passing on rising input costs down the supply chain or to the consumer, and thus suggests that investors are mistakenly fretting about a looming profit margin squeeze. Chart 4No Margin Pressures Yet
no margin pressures yet
no margin pressures yet
While labor cost inflation is trending higher, wage growth remains contained near 3% despite a multi-decade low in the unemployment rate. According to our wage growth diffusion index, just over half of the 44 industries we track have to contend with rising wages, a visible fall from earlier in the year (middle panel, Chart 4). In addition, the Atlanta Fed Wage Growth Tracker remains tame and the switcher/stayer index recently nosedived to multi-year lows. The switcher/stayer index provides a reliable leading indication for the trend in overall labor expenses (fourth panel, Chart 4). Put differently, corporate pricing power is rising on a broadening basis while leading indicators of wage inflation suggest an easing in wage pressures in the coming months. As a result, there are rising odds that expanding forward operating margin expectations are likely, extending the two year margin expansion phase (bottom panel, Chart 4). Digging deeper into our corporate pricing power update is revealing. Table 2 summarizes the results. As a reminder, we calculate industry group pricing power from the relevant CPI, PPI, PCE and commodity growth rates for each of the 60 industry groups we track. Table 2 also highlights shorter term pricing power trends and each industry's spread to overall inflation. Table 2Industry Group Pricing Power
Recuperating
Recuperating
73% of the industries we cover are lifting selling prices, while another ten industries are experiencing only mild price deflation (less than a 0.6% decline). If we include those ten industries then 90% of sectors are maintaining or raising selling prices. One third of the industries are lifting prices at a faster clip than overall inflation. This is lower than our early-July report. Outright deflating sectors increased by four to sixteen since our last update but only six are deflating at 1% or more. On a slightly negative note, fourteen industries are experiencing a downtrend in selling price inflation, twice as many since our most recent report (Table 2). Deep cyclicals/commodity-related industries continue to dominate the top ranks, occupying the top 7 slots (top panel, Chart 5). Despite the ongoing global export softness, intensifying trade tussle with China and 5% year-to-date appreciation in the trade-weighted U.S. dollar, the commodity complex's ability to increase prices is impressive especially given that the base effects from the late-2015/early-2016 manufacturing recession have filtered out. On the flip side, tech industries dominate the bottom ranks of Table 2. Chart 5Cyclicals Have The Upper Hand
cyclicals have the upper hand
cyclicals have the upper hand
In sum, accelerating business sector selling prices will continue to underpin top line growth into 2019. As long as wage inflation rises gradually and does not gallop higher and the corporate sector sustains its pricing power, then profit margins and earnings will remain upbeat. This week we update a high-conviction overweight tech subgroup and reiterate our below benchmark allocation to an early cyclical sector. Software Is In High Demand Despite recent tech stock ills, software stocks continue to defy gravity and remain in a multi-year uptrend, still above the dotcom bubble relative performance highs (top panel, Chart 6). We reiterate our high-conviction overweight status and within tech we continue to prefer the S&P software and S&P tech hardware, storage & peripherals indexes to the early-cyclical tech S&P semis and S&P semi equipment subgroups. Chart 6Software Fever
software fever
software fever
It did not take long for the large CA acquisition to get surpassed by RHT. Inter-industry M&A activity is reaching fever pitch and this frenzy is bidding up premia to stratospheric levels (fourth panel, Chart 6). The push to the cloud, SaaS and even AI has boosted the appeal of software stocks and brought them to the forefront of potential takeout candidates. These are secular trends and will likely continue to gain steam irrespective of the different stages in the business cycle. As a result, software stocks should remain core tech holdings in equity portfolios. Chart 7Capex Gains...
capex gains…
capex gains…
Beyond the positive M&A angle that we have been exploring for quite some time in our research, software stocks are particularly levered on capital spending. Chart 7 shows that relative capital outlays and the share price ratio are joined at the hip. Software upgrades offer the simplest, quickest and most effective capital deployment especially when productivity gains ground to a halt. Importantly, leading indicators of overall capex remain upbeat and should continue to underpin software profits (Chart 8). Chart 8...Say Stick With Software
...say stick with software
...say stick with software
Moreover, industry operating metrics are on fire. Top line growth is accelerating and running at a higher clip than the broad market. The recovery in the software price deflator (middle panel, Chart 9), a proxy for industry pricing power, corroborates this bright demand backdrop. Impressively, labor additions have been muted, implying that margins can expand further and possibly challenge cyclical highs (bottom panel, Chart 9). Chart 9Operating Metrics Are Firing On All Cylinders
operating metrics are firing on all cylinders
operating metrics are firing on all cylinders
With regard to financial statements, software stocks have pristine balance sheets with more cash on hand than debt, which sustains the net debt-to-EBITDA ratio in negative territory. Interest coverage is great at 10x and free cash flow generation is expanding smartly (Chart 10). Chart 10Pristine Balance Sheets
pristine balance sheets
pristine balance sheets
Nevertheless, all of these positives have pushed several valuation metrics to a premium to the broad market and leave little space for any mishaps. On a forward P/E, trailing P/S, and even EV/EBITDA basis, software equities are pricey, but we think for good reason (bottom panel, Chart 10). This rerating phase will likely continue until there is evidence of an end either to the M&A frenzy, or capex upcycle or business cycle. In sum, feverish software M&A activity, the ongoing capex upcycle, firming industry operating metrics and pristine balance sheets, suggest that software stocks are a must have for equity portfolios. Bottom Line: The S&P software index remains a high-conviction overweight. The ticker symbols for the stocks in this index are: BLBG: S5SOFT - MSFT, ORCL, ADBE, CRM, INTU, RHT, ADSK, CA, SNPS, CTXS, ANSS, CDNS, FTNT and SYMC. Consumer Discretionary Stocks Are Still A Sell While we remain constructive on financials that benefit from higher rates, we continue to recommend investors avoid the consumer discretionary sector - the other early cyclical - that suffers when interest rates rise. Chart 11 depicts this inverse correlation consumer discretionary equities have with interest rates, especially the fed funds rate. Most discretionary equites are levered off of floating rates and thus any increase in the fed funds rates gets reflected immediately in banks' prime lending rate. Also, most consumer debt is floating rate debt and thus tighter monetary conditions, at the margin, dampen consumer debt uptake and, as a knock-on effect, weigh on discretionary consumer outlays. Chart 11Rising Fed Funds Rates...
rising fed funds rates…
rising fed funds rates…
Last week we highlighted that, now that the Fed has been raising rates and allowing bonds to roll off its balance sheet, volatility is making a comeback. Unsurprisingly, the consumer discretionary share price ratio is inversely correlated with the VIX index, signaling that more pain lies ahead for this early cyclical index (VIX shown inverted, Chart 12). Chart 12...The Volatility Comeback...
...the volatility comeback…
...the volatility comeback…
Money aggregates also corroborate that the time to buy consumer discretionary equities is when the money supply is galloping higher and shed exposure when both M1 and M2 are decelerating as we have shown in previous research. Importantly, the velocity of M2 money stock is inversely correlated with relative share prices and the current message is negative for consumer discretionary stocks as GDP is finally growing faster than M2 money growth (velocity of M2 money stock shown inverted, Chart 13). Chart 13...And Money Velocity Point To More Losses In Consumer Discretionary
...and money velocity point to more losses in consumer discretionary
...and money velocity point to more losses in consumer discretionary
Not only are higher interest rates anchoring consumer discretionary stocks but rising energy prices are also dealing a blow to this sector. Chart 14 shows our Consumer Drag Indicator (CDI, comprising mortgage rates and energy prices). Historically, our CDI has been an excellent leading indicator of relative share price momentum. Currently, the message is clear: the sinking CDI signals that a bear market in consumer discretionary stocks has likely commenced. Chart 14Heed The Message From The Consumer Drag Indicator
heed the message from the consumer drag indicator
heed the message from the consumer drag indicator
Sentiment and technical indicators also point to more downside ahead for this interest-rate sensitive index. Our sector advance/decline line is waning and EPS breadth has plunged (Chart 15). Worrisomely, sell-side analysts are penciling in an extremely optimistic 5-year outlook with EPS growth north of 30%/annum or twice as high as the overall market. Clearly this is not realistic as it assumes a near quadrupling of EPS in the coming 5 years. Chart 15Bad Breadth...
Bad Breadth…
Bad Breadth…
In the near-term, analysts are more cautious (bottom panel, Chart 15). Relative EPS estimates have already given way as AMZN commands very little EPS weight, despite its massive market cap weight (30% of the S&P consumer discretionary sector), and suggests that relative share prices will converge lower (top panel, Chart 16). As a result, the 12-month forward P/E ratio is trading at a 27% premium to the broad market and significantly above the historical mean. Technicals are almost as extended as relative valuations and cyclical momentum has likely peaked, warning that a downdraft in relative share prices looms (Chart 16). Chart 16...With Poor Technicals And No Valuation Cushion
...with poor technicals and no valuation cushion
...with poor technicals and no valuation cushion
Adding it up, a rising interest rate backdrop along with the Fed's quantitative tightening, the return of volatility, higher gasoline prices, stretched technicals and a lack of a valuation cushion, all suggest that it pays to remain bearish consumer discretionary stocks. Bottom Line: The path of least resistance is lower for the S&P consumer discretionary index, stay underweight. Anastasios Avgeriou, Vice President U.S. Equity Strategy anastasios@bcaresearch.com 1 Please see BCA U.S. Equity Strategy Sector Insight, "A Rout For Conglomerates Opens A Buying Opportunity," dated October 31, 2018, available at uses.bcaresearch.com. 2 "The crash of October 1987 sensitized investors to the potential for stock market crashes and forever changed their view of S&P 500® returns. Investors now realize that S&P 500 tail risk - the risk of outlier returns two or more standard deviations below the mean - is significantly greater than under a lognormal distribution. The Cboe SKEW Index ("SKEW") is an index derived from the price of S&P 500 tail risk. Similar to VIX®, the price of S&P 500 tail risk is calculated from the prices of S&P 500 out-of-the-money options. SKEW typically ranges from 100 to 150. A SKEW value of 100 means that the perceived distribution of S&P 500 log-returns is normal, and the probability of outlier returns is therefore negligible. As SKEW rises above 100, the left tail of the S&P 500 distribution acquires more weight, and the probabilities of outlier returns become more significant. One can estimate these probabilities from the value of SKEW. Since an increase in perceived tail risk increases the relative demand for low strike puts, increases in SKEW also correspond to an overall steepening of the curve of implied volatilities, familiar to option traders as the "skew"." Source: CBOE, http://www.cboe.com/products/vix-index-volatility/volatility-indicators/skew 3 Please see BCA U.S. Equity Strategy Weekly Report, "Icarus Moment?" dated October 22, 2018, available at uses.bcaresearch.com. Current Recommendations Current Trades Size And Style Views Favor value over growth Favor large over small caps
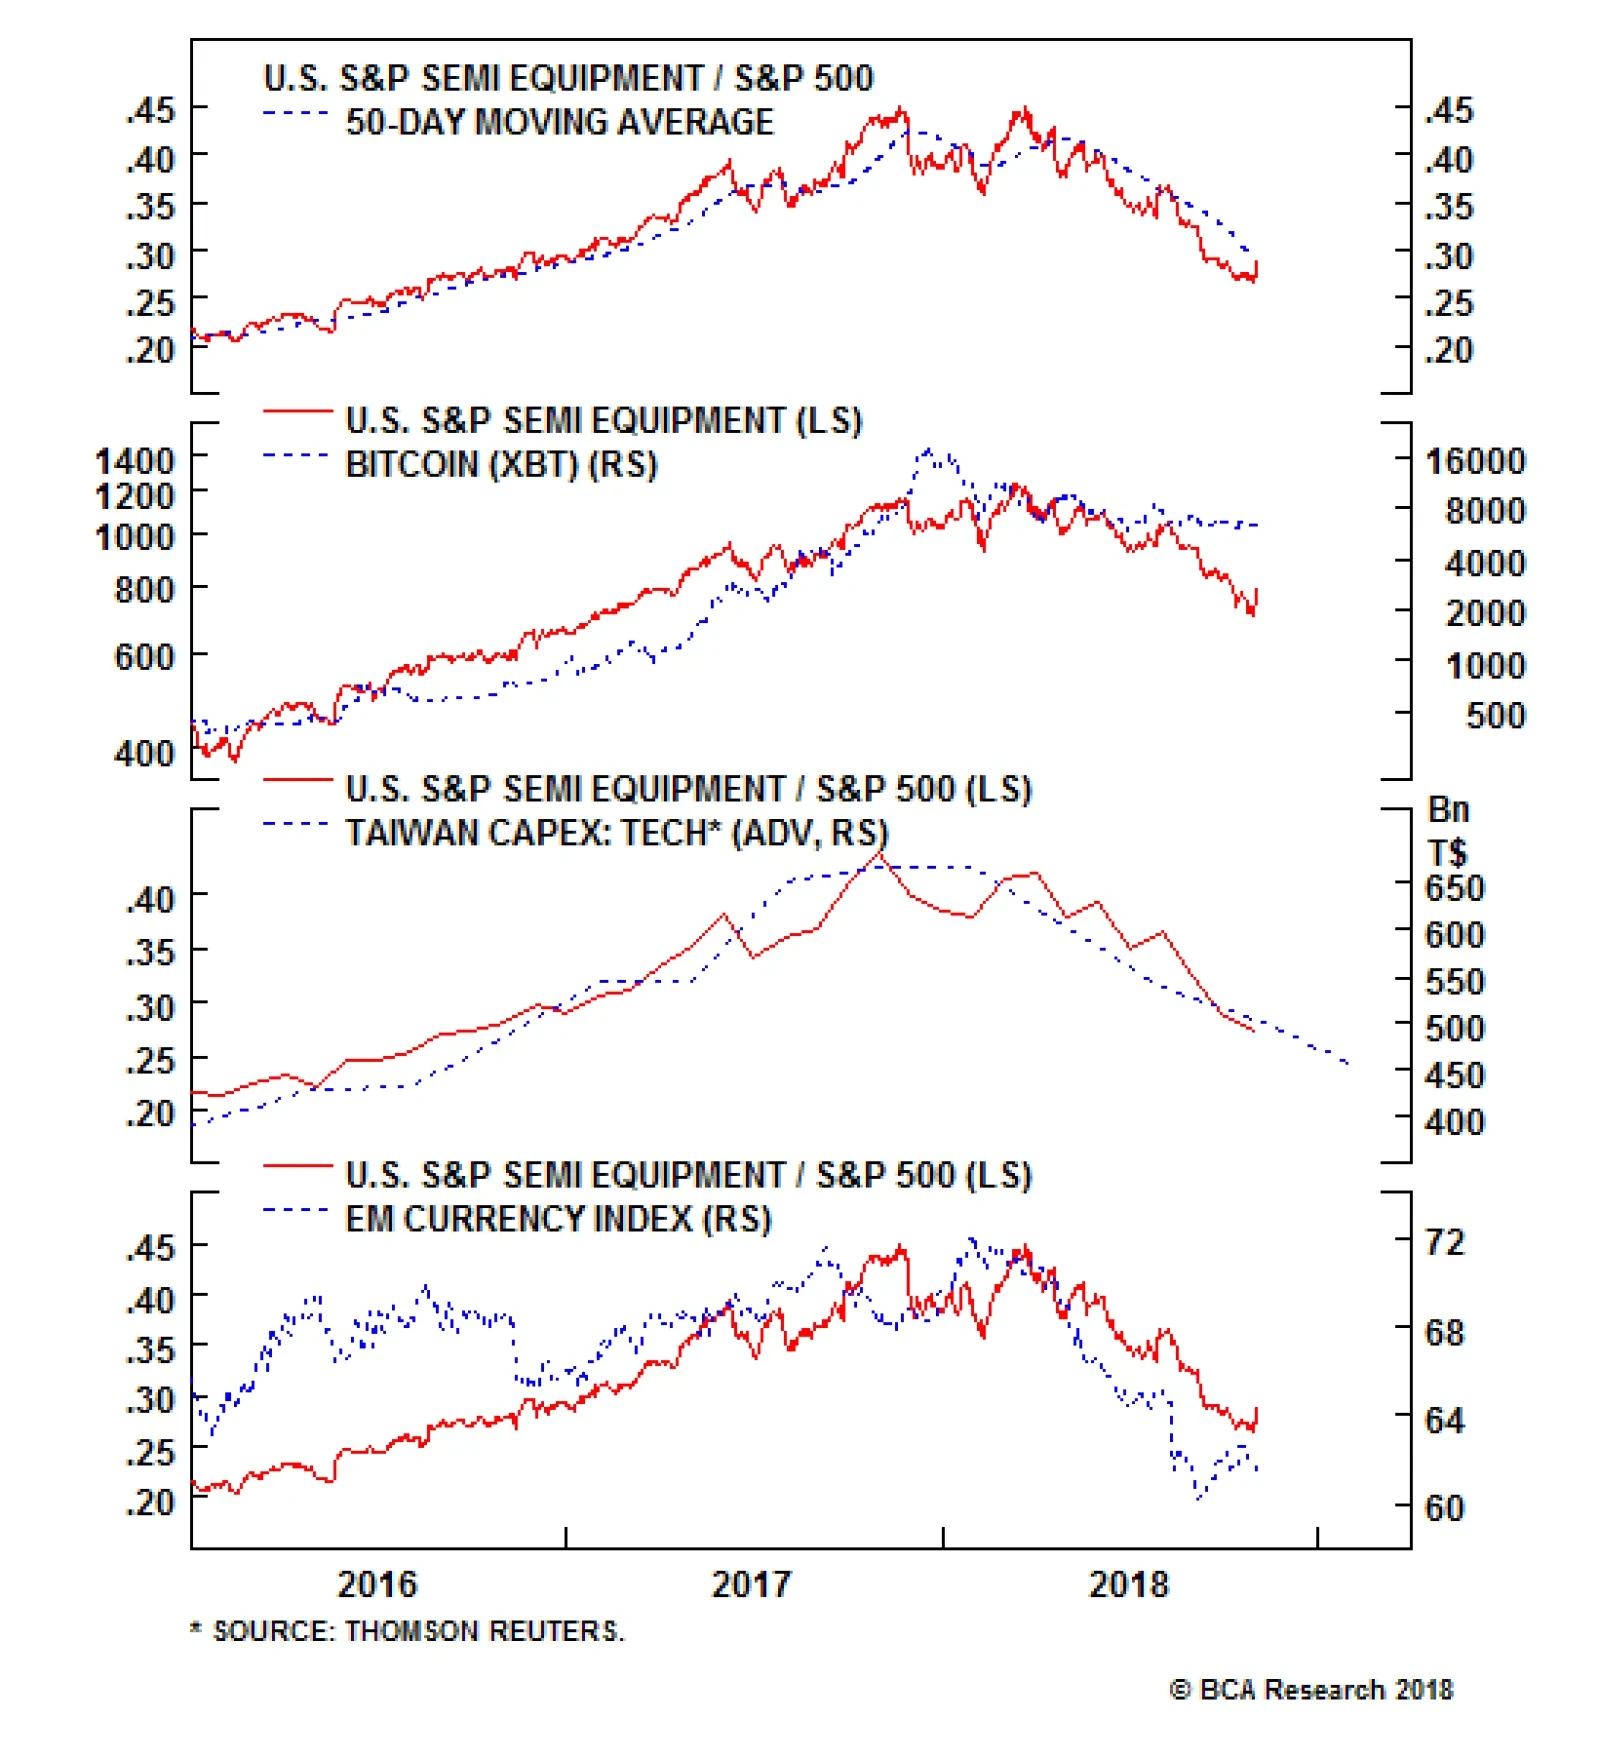
Underweight The dramatic decline in semi equipment stocks has not been arrested in the Q3 earnings season, despite relatively positive results. We think the overall negative sentiment around global tech stocks in general and valuation high flyers in particular has been weighing on the index. Still, much hinges on the results of sector heavyweight Applied Materials later this month, as their guidance update should offer some visibility into the sector operating environment; we continue to believe a bottom has yet to be found. Our bearish view is based on three factors that have not shown substantial improvement. Bitcoin has stabilized but we think the end of its meteoric increase (second panel) will continue to impair what had been a significant source of demand, driving pain in both volumes and pricing power for semi equipment which should take a toll on gross margins. Further, Taiwanese capex continues to slide, implying another source of demand has been faltering (third panel). Lastly, EM currencies, while stable at this new low level, will continue to sap consumer purchasing power (bottom panel). Bottom Line: A downbeat backdrop for semi equipment stocks tells us that things will get worse before they get better; stay underweight. The ticker symbols for the stocks in this index are: BLBG: S5SEEQ - AMAT, LRCX, KLAC.
A Dark Spot In An Otherwise Bright Earnings Season
A Dark Spot In An Otherwise Bright Earnings Season
Highlights The long term direction for the pound is higher... ...but as the EU withdrawal bill passes through the U.K. parliament, expect a very hairy ride. The stock markets in Norway, Sweden and Denmark are driven by energy, industrials, and biotech respectively. Upgrade Sweden to neutral and downgrade Denmark to underweight. Think of semiconductors as twenty-first century commodities. Overweight the semiconductor sector versus broader technology indexes. Chart of the WeekBritish Public Opinion On Brexit Is Shifting
Understanding Brexit, Scandinavian Markets, And Semiconductors
Understanding Brexit, Scandinavian Markets, And Semiconductors
Feature The Brexit drama is playing out exactly as scripted (Chart I-2). Chart I-2The Pound Is Following The Brexit Drama
The Pound Is Following The Brexit Drama
The Pound Is Following The Brexit Drama
In July, we wrote: "The U.K. government's much hyped 'Chequers' proposal for Brexit risks getting a cold shower... the EU27 will almost instantaneously reject the proposed division between goods and services as 'cherry-picking' from its indivisible four freedoms - goods, services, capital, and people... the rejection will be based not just on the EU's founding principles, but also on the practical realities of a modern economy - specifically, the distinction between goods and services has become increasingly blurred." 1 Hence, the Chequers proposal to avoid a hard border between Northern Ireland and the Irish Republic is just wishful thinking: "The Irish border trilemma will remain unsolved, leaving a 'backstop' option of Northern Ireland remaining in the EU single market - an outcome that will be politically unpalatable." 2 What happens next? Understanding Brexit In a sense, Brexit is very simple. The EU27 sees only three options for the long-term political and economic relationship between the U.K. and the EU. Remain in the EU (no Brexit). Plug into an off-the-shelf setup, either the European Economic Area (EEA), European Free Trade Association (EFTA), or a permanent customs union, which already establish the EU relationship with Norway, Iceland, Liechtenstein, and Switzerland (soft Brexit). Become a 'third country' to the EU like, for example, Canada (hard Brexit). The first option, to stay in the EU, is politically impossible unless a new U.K. referendum overturned the original referendum's vote to leave. The second option, to join the EEA, EFTA, or permanent customs union is very difficult for Theresa May - because it is strongly opposed by many of the Conservative government's ministers and members of parliament who regard the option as 'Brino' (Brexit in name only). However, in a significant recent development, the opposition leader Jeremy Corbyn has committed the Labour party to a Brexit that keeps the U.K. in a permanent customs union.3 The third option, to become a 'third country', would very likely require some sort of border in Ireland. As already discussed, the only way to avoid a border would be a perfect alignment between the U.K and EU on tariffs and regulations for goods and services. But then, there would be little point in becoming a third country. Here's the crucial issue. The EU27 does not know which option the U.K. will eventually take, yet it must provide an 'all-weather' safeguard for the Good Friday peace agreement, requiring no border between Northern Ireland and the Irish Republic. Therefore, the EU27 will need the withdrawal agreement to commit: either the whole of the U.K. to a potentially permanent customs union with the EU; or Northern Ireland to a potentially permanent customs separation from the rest of the U.K. - in effect, breaking up the U.K by creating a border between Britain and Northern Ireland. Clearly, the hard Brexiters and/or Northern Ireland unionist MPs will vote down a withdrawal bill which contains either of these commitments, thereby wiping out Theresa May's slender majority. The intriguing question is: might Labour MPs - or enough of them - vote for a potentially permanent customs union to get the soft Brexit they want? Labour would be torn between the national interest and the party interest, as it would be missing a golden opportunity to topple the Conservative government. If the withdrawal bill musters a majority, it would remove the prospect of a 'no deal' Brexit and the pound would rally - because it would liberate the Bank of England to hike interest rates more aggressively (Chart I-3 and Chart I-4). If the bill failed, the government and specifically Theresa May would be badly wounded. She might call a general election there and then. Chart I-3Absent Brexit, U.K. Interest Rates Would Be Higher
Absent Brexit, U.K. Interest Rates Would Be Higher
Absent Brexit, U.K. Interest Rates Would Be Higher
Chart I-4Absent Brexit, U.K. Interest Rates Would Be Higher
Absent Brexit, U.K. Interest Rates Would Be Higher
Absent Brexit, U.K. Interest Rates Would Be Higher
If May limped on, parliament would nevertheless have the final say on whether to proceed with a no deal Brexit. And the parliamentary arithmetic indicates that a clear majority of MPs would vote against proceeding over the cliff-edge. At this point with the government paralysed, the only way to unlock the paralysis would be to go back to the people. Either in a general election or in a new referendum, the key issue for the public would be a choice between one of the three aforementioned options for the U.K./EU long-term relationship - because by then, it would be clear that those are the only options on offer. Based on a clear recent shift in British public opinion, the preference is more likely to be for a soft (or no) Brexit than to become a third country (Chart of the Week). Bottom Line: The long term direction for the pound is higher but, as the withdrawal bill passes through parliament, expect a very hairy ride. Understanding Scandinavian Stock Markets The Scandinavian countries - Norway, Sweden, and Denmark - have many things in common: their languages, cultures, and lifestyles, to name just a few. However, when it comes to their stock markets, the three countries could not be more different. Looking at the three bourses, each has a defining dominant sector (or sectors) whose market weighting swamps all others. In Norway, oil and gas accounts for over 40 percent of the market; in Sweden, industrials accounts for 30 percent of the market and financials accounts for another 30 percent; and in Denmark, healthcare accounts for 50 percent of the market (Table I-1). Table I-1The Scandinavian Stock Markets Could Not Be More Different!
Understanding Brexit, Scandinavian Markets, And Semiconductors
Understanding Brexit, Scandinavian Markets, And Semiconductors
In a sense, the dominant equity market sectors in Norway and Sweden just reflect their economies. Norway has a large energy sector; Sweden specializes in advanced industrial equipment and machinery and it also has very high level of private sector indebtedness, explaining the outsized weighting in banks. However, Denmark's equity market - dominated as it is by Novo Nordisk, which is essentially a biotech company - has little connection with Denmark's economy. The important point is that the four dominant sectors - oil and gas, industrials, financials, and biotech - each outperform or underperform as global (or at least pan-regional) sectors. If oil and gas outperforms, it outperforms everywhere and not just locally. It follows that the relative performance of the four dominant equity sectors drives the relative stock market performances of Norway, Sweden, and Denmark. Norway versus Sweden = Energy versus Industrials (Chart I-5) Chart I-5Norway Vs. Sweden = Energy Vs. Industrials
Norway Vs. Sweden = Energy Vs. Industrials
Norway Vs. Sweden = Energy Vs. Industrials
Norway versus Denmark = Energy versus Biotech (Chart I-6) Chart I-6Norway Vs. Denmark = Energy Vs. Biotech
Norway Vs. Denmark = Energy Vs. Biotech
Norway Vs. Denmark = Energy Vs. Biotech
Sweden versus Denmark = Industrials and Financials versus Biotech (Chart I-7) Chart I-7Sweden Vs. Denmark = Industrials And Financials Vs. Biotech
Sweden Vs. Denmark = Industrials And Financials Vs. Biotech
Sweden Vs. Denmark = Industrials And Financials Vs. Biotech
Last week, we upgraded some of the more classical cyclical sectors to a relative overweight. Our argument was that if an inflationary impulse is dominating, beaten-down cyclicals have more upside than the more richly-valued equity sectors; and if a disinflationary impulse from higher bond yields is dominating, its main casualty will be the more richly-valued equity sectors. On this basis, our ranking of the four sectors is: Industrials, Financials, Energy, Biotech. Which means the ranking of the Scandinavian stock markets is: Sweden, Norway, Denmark. Bottom Line: From a pan-European perspective, upgrade Sweden to neutral and downgrade Denmark to underweight. Understanding Semiconductors The best way to understand semiconductors is to think of them as twenty-first century commodities. In the twentieth century, many everyday goods and products contained a classical commodity such as copper. Today, the ubiquity of electronic gadgets, devices, and screens contains a twenty-first century equivalent: the microchip. Hence, semiconductors are to the tech world what classical commodities are to the non-tech world. They exhibit exactly the same cycle of relative performance. If, as we expect, beaten-down industrial commodities outperform, it follows that the beaten-down semiconductor sector will outperform broader technology indexes (Chart I-8). Chart I-8Semiconductors Follow The Commodity Cycle
Semiconductors Follow The Commodity Cycle
Semiconductors Follow The Commodity Cycle
Bottom Line: Overweight the semiconductor sector versus technology. Dhaval Joshi, Senior Vice President Chief European Investment Strategist dhaval@bcaresearch.com 1 For example, the sale of a car is no longer the sale of just a good. As car companies often structure the financing of the car purchase, a car purchase can be a hybrid of a good - the car itself, and a service - the financing package. Therefore, a single market for cars requires a single market for both goods and services. 2 The Irish border trilemma comprises: 1. the U.K./EU land border between Northern Ireland and the Irish Republic; 2. the Good Friday peace agreement requiring the absence of any physical border within Ireland; 3.the Northern Ireland unionists' refusal to countenance a U.K./EU border at the Irish Sea, which would entail a customs border between Northern Ireland and the rest of the U.K. 3 At the Labour Party's just-held 2018 conference, Jeremy Corbyn made a commitment to joining a permanent U.K./EU customs union. Fractal Trading Model* This week's recommended trade comes from Down Under. The 25% outperformance of Australian telecoms (driven by Telstra) versus insurers (driven by IAG and AMP) over the past 3 months appears technically extended, with a 65-day fractal dimension at a level that has regularly indicated the start of a countertrend move. Therefore, the recommended trade is short Australian telecoms versus insurers, setting a profit target of 7% and a symmetrical stop-loss. In other trades, long CRB Industrial commodities versus MSCI World Index achieved its profit target very quickly, leaving four open trades. For any investment, excessive trend following and groupthink can reach a natural point of instability, at which point the established trend is highly likely to break down with or without an external catalyst. An early warning sign is the investment's fractal dimension approaching its natural lower bound. Encouragingly, this trigger has consistently identified countertrend moves of various magnitudes across all asset classes. Chart I-9
Short Australian Telecom Vs. Insurers
Short Australian Telecom Vs. Insurers
The post-June 9, 2016 fractal trading model rules are: When the fractal dimension approaches the lower limit after an investment has been in an established trend it is a potential trigger for a liquidity-triggered trend reversal. Therefore, open a countertrend position. The profit target is a one-third reversal of the preceding 13-week move. Apply a symmetrical stop-loss. Close the position at the profit target or stop-loss. Otherwise close the position after 13 weeks. Use the position size multiple to control risk. The position size will be smaller for more risky positions. * For more details please see the European Investment Strategy Special Report "Fractals, Liquidity & A Trading Model," dated December 11, 2014, available at eis.bcaresearch.com Fractal Trading Model Recommendations Equities Bond & Interest Rates Currency & Other Positions Closed Fractal Trades Trades Closed Trades Asset Performance Currency & Bond Equity Sector Country Equity Indicators Bond Yields Chart I-1Indicators To Watch - Bond Yields
Indicators To Watch - Bond Yields
Indicators To Watch - Bond Yields
Chart I-2Indicators To Watch - Bond Yields
Indicators To Watch - Bond Yields
Indicators To Watch - Bond Yields
Chart I-3Indicators To Watch - Bond Yields
Indicators To Watch - Bond Yields
Indicators To Watch - Bond Yields
Chart I-4Indicators To Watch - Bond Yields
Indicators To Watch - Bond Yields
Indicators To Watch - Bond Yields
Interest Rate Chart I-5Indicators To Watch - Interest Rate Expectations
Indicators To Watch - Interest Rate Expectations
Indicators To Watch - Interest Rate Expectations
Chart I-6Indicators To Watch - Interest Rate Expectations
Indicators To Watch - Interest Rate Expectations
Indicators To Watch - Interest Rate Expectations
Chart I-7Indicators To Watch - Interest Rate Expectations
Indicators To Watch - Interest Rate Expectations
Indicators To Watch - Interest Rate Expectations
Chart I-8Indicators To Watch - Interest Rate Expectations
Indicators To Watch - Interest Rate Expectations
Indicators To Watch - Interest Rate Expectations

Against such a backdrop, the coming quarters should see sectors that benefit from rising interest rates and that also serve as inflation hedges outperform. This means we favor "FIT" stocks, which refers to financials, industrials and selected technology…
Highlights The renaming of telecommunication services and reallocation of some tech and consumer discretionary stocks ends a long run of a purely domestic, defensive GICS1 sector. Our initial recommendation is underweight for the newly minted S&P communication services sector. Interactive media & services, formerly (mostly) internet software & services, is moving from tech to communication services where it promises to be the core revenue and profit driver of the sector. However, regulatory risk, a rapid pace of change with extremely low switching costs and currency exposure in a very international sector keep us on the fence. We are initiating coverage on the S&P interactive media & services index with a neutral recommendation. Feature Several Indexes Have Found New Homes At the market's close last Friday, investors welcomed a new (rather, a renamed) GICS1 sector to the industry taxonomy: the S&P communication services sector (Table 1). The change had long been overdue as the progenitor sector, telecommunication services, had been hollowed down to three companies and represented approximately 2% of the S&P 500. Further, finding homes for various new media and technology companies had left a hodgepodge of consumer discretionary and information technology subsectors that bore little resemblance to their respective peers. In short, we welcome the new taxonomy. Table 1Classification Changes
New Lines Of Communication
New Lines Of Communication
However, this change brings a good deal of uncertainty with it. The most recent GICS1 change was the reallocation of real estate (mostly REITs) from a financials sub-index to their own GICS1 classification; this change involved a relatively simple carve-out. The creation of communication services includes carve-outs as well as stock-by-stock changes for a brand new index with a core sub-index, interactive media & services, that we initiate coverage on later in this report. Importantly, the reshuffling dilutes an up-to-recently pure-play safe haven index. Previously, telecommunications services was an ultra-low beta, high-dividend yielding, zero currency-exposed prototypical defensive index. Communication services will be dominated by relatively high beta, low dividend yielding and heavily international stocks. In more detail, it morphs into a roughly 45% deep cyclical, 37.5% early cyclical and 17.5% defensive index. MSCI has proposed classifying communication services as cyclical, with no new defensive offset, meaning the market has lost a GICS1 defensive sector. Further, we estimate roughly 20% of the communication services index is value-oriented, a fairly drastic change from the 100% value-oriented former telecommunication services index. Now approximately 60% will be growth-oriented and the balance a blend of the two. One would presume that adding many new stocks to the sector would alleviate telecommunication services' lack of breadth (two companies split 95% of the market cap weight roughly evenly). However, the sheer dominance of Alphabet and Facebook, which will combine to represent approximately 40% of the S&P communication services sector, means that the absence of breadth is being replaced with less absence of breadth (Chart 1). Chart 1Before... And After
New Lines Of Communication
New Lines Of Communication
Further impacting the cyclicality of the new index is the source of revenues. Telecommunication services revenues are relatively inelastic as the service they provide is very much a consumer staple. Communication services in general and interactive media & services in particular have much more volatile revenue profiles, relying heavily on ad sales (Facebook & Google) or consumer discretionary spending (Netflix & Disney). We have not covered the index that includes Facebook and Alphabet, so we have been de facto at a benchmark allocation. As detailed in the following section, we are not changing that recommendation with our initiation of coverage. Our telecom services recommendation remains underweight (though obviously now a subsector within communication services). Our recommendations on the other material industries moving into communication services (movies & entertainment and cable & satellite, collectively the media indexes) are similarly remaining unchanged at a benchmark allocation. Bottom Line: The net result is that we are negatively biased on the new S&P communication services sector and our initial recommendation is underweight. For investors seeking tech exposure we continue to recommend the S&P software and S&P tech hardware, storage & peripherals tech sub-indexes that are high-conviction overweights. Please see the housekeeping section at the end of this report for more details. Interactive Media & Services - Breaking Out? The new interactive media & services index broadly matches the former internet software & services index (that used to be a subsector of the information technology GICS1 sector), but with a twist. Facebook & Alphabet comprised more than 90% of the old index and will command a similar share of the new. However, eBay has found a new home alongside Amazon in the consumer discretionary index, swapping places with TripAdvisor. Meanwhile, Akamai and Verisign are moving to a new index, internet services & infrastructure. Still, the vast majority of the index was, and remains, weighted to two companies. Accordingly, and in the absence of new forward looking data, we will be basing much of our analysis on the old internet software & services index and extrapolating it to the new interactive media & services. It comes as no shock to market observers that the internet services & software index has been gaining share of the S&P 500 as its component stocks have been roaring ahead. In fact, the streak of outperformance has been uninterrupted from the beginning of 2017 until very recently (Chart 2). The usual conclusion is that this is the result of a dramatic surge in valuation. While it is true that the internet services & software index trades at a hefty valuation multiple from an absolute perspective, the valuation has in fact declined relative to the broad market since the beginning of 2017 (Chart 3). Underlying the meteoric rise in market share of the internet software & services stocks without a corresponding relative valuation increase has been a step higher in relative earnings. As shown in Chart 4, earnings growth in this index has vaulted higher in the past five years, dramatically outpacing the growth in the share price for most of the past three years. Chart 2Rising Prices Amidst...
Rising Prices Amidst...
Rising Prices Amidst...
Chart 3... Falling Valuations
... Falling Valuations
... Falling Valuations
Chart 4EPS Growth Has Outpaced Price
EPS Growth Has Outpaced Price
EPS Growth Has Outpaced Price
A key differentiator between this index and virtually every other index we cover is the source of revenues and earnings, namely advertising. Despite years of acquisitions and organic R&D building non-advertising businesses, last year saw 86% of Alphabet's revenues derived from advertising. The number is even larger at Facebook, where nearly all of its revenues are generated through selling advertising placements. This revenue quite obviously comes with a high margin and extremely high operating leverage. As such, the past decade of economic expansion has been excellent for the index. In fact, Facebook's entire history as a public company has been in the midst of a bull market. The elevated degree of cyclicality of internet software & services profits largely explains the earnings outperformance in the expansion to date, though clearly presents a risk to relative profitability when the cycle turns. Profit Growth Has A Long Runway... Consumer confidence, which is still pushing up against multi-decade highs, combined with online's growing share of advertising dollars, will continue to drive revenue growth of interactive media & services well ahead of the broad market. Such historically high consumer confidence is supported by generationally low unemployment (Charts 5 and 6). In other words, as long as everyone who wants a job has a job, interactive media & services revenues are relatively secure. Chart 5Ad Revenues Are Solid...
Ad Revenues Are Solid...
Ad Revenues Are Solid...
Chart 6... When Jobs Are Plenty
... When Jobs Are Plenty
... When Jobs Are Plenty
A rebuttal to that bullish thesis that has grown more common since Facebook issued downbeat guidance in July that subsequently knocked more than $130 billion of market cap off the stock (it has since fallen even further) is that growth is decelerating and margins are tightening considerably. Google too has been downplaying cresting EPS growth rates. We counter with the argument we postulated in our mid-summer analysis of the impact of regulatory reform on the technology sector that negativity coming from management at these firms may be sandbagging to defray some of the elevated regulatory scrutiny into their outrageous profitability.1 Further, the sell side does not appear to believe the guidance; current estimates for revenue growth at Facebook & Google for the next three years are a 20% and 17% compounded annual growth rate (CAGR), respectively, or three times as high as the broad market. Nevertheless, even the always-optimistic sell side is calling for EPS growth rates that trail revenue growth, implying the message of declining profitability is hitting home; Facebook and Google have three-year EPS CAGRs of 16% and 12%, respectively. Under the watchful eye of regulators across the world, both firms are investing heavily in safety & security that each has flagged as a significant headwind to margins. While these growth rates are a far cry from earlier profitability, they broadly match the current S&P 500 long-term EPS growth rate of 16%. ...But Three Key Risks Keep Us On The Fence The declining profitability of the sector brings us to the first of three key risks that prevent us from turning positive on interactive media & services: regulation. In the previously noted analysis of regulatory reform on the tech sector,2 our colleagues in BCA's Geopolitical Strategy service noted that both concentration and privacy concerns should present significant sources of apprehension for investors. We would certainly agree. The stock market reaction to regulation (or regulatory action in the form of fines) has thus far been muted, but that does not put us completely at ease. We are conscious that an antitrust breakup of Google or a privacy/data sharing/first amendment issue action against Facebook or Twitter could be potentially business model-breaking. Accordingly, we weigh this against the index's spectacular profitability. With respect to our second key risk, we are reminded of a quote from Donald Rumsfeld in 2002: "there are things we know we know. We also know there are known unknowns; that is to say we know there are some things we do not know. But there are also unknown unknowns -- the ones we don't know we don't know". At BCA, we are neither technologists nor trend experts. Accordingly, there is a great deal of potential changes in consumer tastes or technology that we are unaware of that could deliver the same fate to Facebook and/or Google as the fallen tech giants of the past. In an environment where switching costs appear to be close to nil, this is particularly risky. This could come about either from within Silicon Valley where Schumpeter's creative destruction process is alive and well (keep in mind Google did not exist prior to 1998 and Facebook was born in 2004), or even from China that apparently has jumped ahead of the U.S. in terms of AI capabilities. Some early signs are worrying. A survey from the Pew Research Center last month said that 26% of respondents had deleted the Facebook app from their phone in the past year.3 While the core Facebook application is just one of several of the company's properties, recent news that the founders of Instagram, Facebook's second largest social media network, were exiting amidst internal turmoil reinforces our fears. We are unable to put our finger on how social media tastes or the technology used to consume content will change, but we are confident that any change will be both rapid and unpredictable. Chart 7U.S. Dollar Risk
U.S. Dollar Risk
U.S. Dollar Risk
Our third risk is also the biggest: the U.S. dollar. One of BCA's key views for the next year is the appreciation of the U.S. dollar; we have been flagging this as the key source of risk to our otherwise sanguine view on the broad U.S. equity market in general and the heavily international tech sector (the early-cyclical semi and semi equipment sectors are the most exposed and we are underweight both4) in particular. Overseas sales for Facebook and Google represented 51% and 53% of overall sales, respectively, in 2017 and both companies have indicated growth outside North America will outpace domestic sales. Google's recent rumored foray into China is not only encouraging more government scrutiny of the search giant, but it would also exacerbate the EPS sensitivity to forex fluctuations. As long as the U.S. dollar is appreciating, the translation of foreign sales and profits to the home currency will further dampen EPS growth (Chart 7). In the context of the elevated valuations these companies share, combined with the empirical reactions when earnings or guidance have disappointed in the past, any headwinds to growth may drive a valuation derating. Bottom Line: Innovation and supportive macro trends are likely to keep driving profit growth in interactive media & services that, though slower than in the past, still outpaces the broad market. However, three key risks keep us on the sidelines: a renewed regulatory focus, rapid unpredictable changes in tastes & technology and an appreciating U.S. dollar that threatens to sap growth in the key foreign segments. We are initiating coverage with a neutral rating. The tickers in this index are BLBG: S5INMS - GOOG, GOOGL, FB, TWTR, TRIP. Housekeeping Items With the exception of the new neutral recommendation on interactive media & services, we are not changing any recommendations on any other sector with this report. However, in accordance with the GICS changes, we are shifting a number of sectors today. First, we are renaming telecommunication services to communication services; telecom services remains an underweight subsector under the new banner. We are moving four indexes from consumer discretionary to communication services: advertising (overweight), cable & satellite (neutral), movies & entertainment (neutral) and publishing (neutral). Though the new sector has one overweight subsector (advertising) and one underweight subsector (telecom services), the much greater weight of the latter subsector biases our recommendation on the communication services sector to underweight. Within consumer discretionary, our recommendation prior to this change was underweight. As we are moving only neutral- and overweight-recommended subsectors out of the larger index, our underweight recommendation for consumer discretionary is unchanged (modestly more negative, especially if we consider our recent intra-housing market sub sector swap5). Chris Bowes, Associate Editor chrisb@bcaresearch.com 1 Please see BCA U.S. Equity Strategy Special Report, "Is The Stock Rally Long In The FAANG?" dated August 1, 2018, available at uses.bcaresearch.com. 2 Ibid. 3 Pew Research Center http://www.pewresearch.org/fact-tank/2018/09/05/americans-are-changing-their-relationship-with-facebook/ 4 Please see BCA U.S. Equity Strategy Weekly Report, "Party Like It's 2004!" dated September 17, 2018, available at uses.bcaresearch.com. 5 Please see BCA U.S. Equity Strategy Weekly Report, "Indurated," dated September 24, 2018, available at uses.bcaresearch.com. Current Recommendations
Underweight In yesterday's Daily Insight, we highlighted our neutral barbell portfolio in tech, staying overweight secular growth defensive tech sub-sectors (namely S&P software and S&P tech hardware, storage & peripherals, both of which are high-conviction overweights) and underweight the hyper-cyclical chip and chip equipment stocks. With respect to the latter, we think the macro environment has deteriorated. Three factors underpin our negative view on semi equipment's growth prospects and there is no light at the end of the tunnel yet. Bitcoin's (and other cryptocurrencies) collapse is dealing a blow, at the margin, to demand for semi equipment (second panel). Taiwan's financials statement-reported data on IT capex and national data on overall Taiwanese capital outlays corroborates this downbeat demand backdrop (third panel). Finally, the drubbing in EM currencies is sapping purchasing power from the consumer and also warns that things will get worse for U.S. semi equipment stocks before they get better (bottom panel). Bottom Line: Continue to avoid the S&P semis and S&P semi equipment indexes; see Monday's Weekly Report for more details. The ticker symbols for the stocks in these indexes are: BLBG: S5SECO - INTC, NVDA, QCOM, TXN, AVGO, MU, ADI, AMD, MCHP, XLNX, SWKS, QRVO, and BLBG: S5SEEQ - AMAT, LRCX, KLAC, respectively.
Avoid Chip Stocks At All Costs
Avoid Chip Stocks At All Costs
Stay Neutral S&P Tech
Stay…
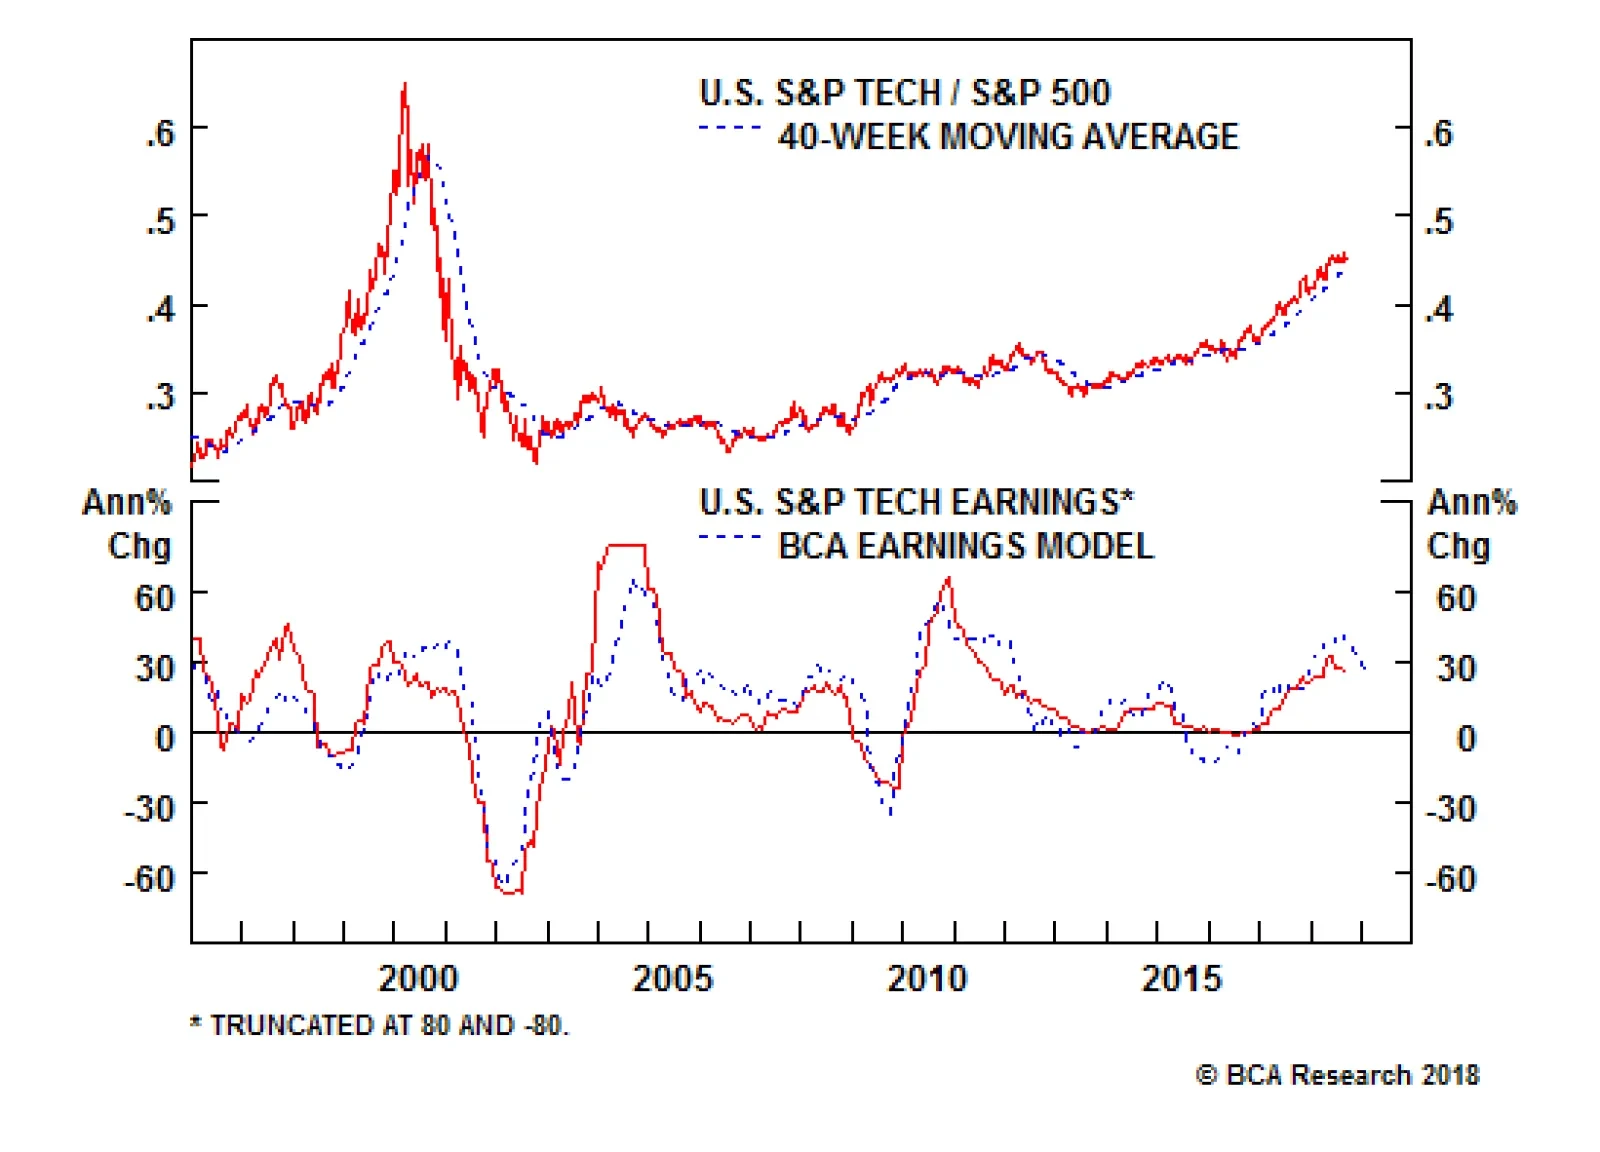
Neutral The stratospheric rise of tech profits, particularly in the past two years, have done most of the heavy lifting in pulling the S&P 500's profit margin ever higher, pushing the index itself to new all-time highs last month. The implication is that in order for the broad market to suffer a severe blow, tech has to take a hit, and vice versa. On the EPS front, our profit growth model has recently ticked higher from an already extended level, signaling that the profit outlook remains bright (second panel). The news on the operating front is equally encouraging. The San Francisco Fed's tech pulse index - an index of coincident indicators of technology sector activity - is reaccelerating (third panel). Such positivity is offset by the acknowledgment of three material risks. First, the tech sector garners 60% of its revenues from abroad and thus the appreciating U.S. dollar is a significant profit headwind (bottom panel). Second, a rising U.S. inflation backdrop along with the related looming selloff in the bond market should knock the wind out of the tech sector's sails. Third, leading indicators of emerging Asian demand are souring rapidly and were the trade war to re-escalate, EM economic data would retrench further. Bottom Line: We prefer to remain on the sidelines in the S&P information technology sector and sustain a barbell portfolio within the sector. Please see this week's Weekly Report for more details.
Tech On Steroids
Tech On Steroids
Highlights Portfolio Strategy Stick with a neutral weighting in the tech sector as rising interest rates, higher inflation and a firming greenback offset improving industry operating metrics on the back of the virtuous capex upcycle. Chip and chip equipment stocks will remain under pressure as global semi sales are under attack and leading indicators of semi demand suggest that more pain lies ahead at a time when chip selling prices are steeply decelerating. Recent Changes There are no changes to our portfolio this week. Table 1
Party Like It's 2004!
Party Like It's 2004!
Feature Equities regained their footing last week and remain perched near all-time highs. Investors are largely ignoring the trade-related uncertainty and are instead focusing on the upbeat economic backdrop. Both soft and hard data continue to send an unambiguously healthy signal for the U.S. economy, a potent tonic for corporate profitability. Chart 1EPS Will Do All The Heavy Lifting
EPS Will Do All The Heavy Lifting
EPS Will Do All The Heavy Lifting
While a lot of parallels have been drawn between today and the late-1990s, our sense is that the current financial market and economic outlooks resemble more the mid-2000s. Chart 1 shows that, between 2004 and the stock market peak in late-October 2007, forward profit growth estimates peaked at over 20%/annum and the forward multiple drifted steadily lower. Nevertheless, stocks remained well bid and rose alongside forward EPS (top and third panels, Chart 1). In other words, despite decelerating forward profit growth estimates and a contracting forward multiple, expanding forward EPS did the heavy lifting, explaining all of the advance in the SPX. The similarities to today are eerie: while profit growth peaked in Q1/2018, 10% EPS growth is elevated for the tenth year of an expansion, and the forward multiple is coming in (Chart 1). On the policy front, the Bush tax cuts hit in the mid-2000s with the elimination of the double taxation of dividends and a drop in personal income tax rates, along with a one-time cash repatriation of corporate profits stashed abroad. With regard to the economic backdrop, capex was roaring and nominal GDP was firing on all cylinders as a housing bubble was getting inflated. The GDP deflator also hit a high mark. The ISM manufacturing survey eclipsed 61 in 2004 and non-farm payrolls were expanding smartly (Chart 2). But despite all that apparent overheating especially in the housing market, the real fed funds rate was near zero in 2004 (top panel, Chart 3). Finally, a number of financial market metrics were also similar to today. Oil prices were on their way to triple digits, high yield spreads were below 400bps and the VIX probed, at the time, all-time lows (Chart 3). However, one key difference between the mid-2000s and today is the strengthening U.S. dollar. The firming greenback remains a key risk to our positive equity market view (bottom panel, Chart 3), as it will eventually infiltrate EPS. Netting it all out, if history at least rhymes, an earnings-led advance in the SPX is the most likely outcome. Our sanguine cyclical (9-12 month) equity market view remains predicated on a 10%/annum increase in EPS and a sideways-to-lower move in the forward multiple. Meanwhile, wage inflation is slowly starting to rear its ugly head. In fact, we are surprised by the fits and starts in average hourly earnings growth. At this stage of the cycle, wage growth should start galloping higher as executives aggressively bid up the price of labor in order to fill job openings and bring expansion plans to fruition. A simple wage growth indicator comprising resource utilization and the unemployment gap suggests that wage inflation will really kick into higher gear in the coming 12 months (shown as a Z-score, Chart 4). Chart 2Eerie...
Eerie…
Eerie…
Chart 3...Parallels With 2004
...Parallels With 2004
...Parallels With 2004
Chart 4Mind The Return Of Inflation
Mind The Return Of Inflation
Mind The Return Of Inflation
Two weeks ago we highlighted that the S&P 500's profit margins are benefiting from lower corporate taxes and muted wage growth, a goldilocks backdrop. Despite evidence of a pending inflationary impulse, as long as businesses are successful in passing rising input costs down the supply chain and onto the consumer, then margins and EPS will continue to expand. Nevertheless, deconstructing the SPX's all-time high profit margins is in order. Chart 5 & Chart 6 show the 11 GICS1 sector profit margin time series using Standard & Poor's data, and Chart 7 is a snapshot of Q2/2018 profit margins for the 11 sectors and the broad market. Chart 5Sectorial Profit ...
Sectorial Profit …
Sectorial Profit …
Chart 6...Margin Breakdown
...Margin Breakdown
...Margin Breakdown
Chart 7Tech Is A Clear Outlier
Party Like It's 2004!
Party Like It's 2004!
Five sectors (tech, industrials, materials, consumer discretionary and utilities) are enjoying record-high profit margins, and four (financials, consumer staples, telecom services and real estate) are on the verge of joining that club. This leaves two sectors with declining margin profiles: health care and energy. While most sectors are +/- five percentage points away from the S&P 500, the tech sector sports profit margins at twice the level of the SPX or eleven percentage points higher and is the clear outlier (Chart 7). The implication is that the broad market's EPS fortunes are closely tied to the high-flying tech sector that commands a 26% market cap weight. Thus, this week we are compelled to highlight the deep cyclical tech sector, and two of its hyper-sensitive and foreign exposed subcomponents. Tech On Steroids In late-August we published a chart on tech margins (which we are reprinting today) showing the upward force they have exerted on the broad equity market for the better part of the past decade (top panel, Chart 8). Naturally, stratospheric profits must underpin these parabolic margins. The middle panel of Chart 8 highlights that since 2006 tech EPS have almost quadrupled, pulling SPX profits higher. As a reminder, the S&P tech sector commands a 24% profit weight in the S&P 500, the highest since the history of this data series and almost double the weight during the previous cycle's peak (bottom panel, Chart 8). The implication is that in order for the broad market to suffer a severe blow, tech has to take a hit, and vice versa. Chart 8Secular Tech EPS Growth Has Boosted Margins
Secular Tech EPS Growth Has Boosted Margins
Secular Tech EPS Growth Has Boosted Margins
Chart 9EPS Growth Model Flashing Green
EPS Growth Model Flashing Green
EPS Growth Model Flashing Green
On the EPS front, our profit growth model has recently ticked higher from an already extended level, signaling that the profit outlook remains bright (Chart 9). The virtuous capex upcycle - BCA's key theme for the year - remains the key driver behind our EPS model. Chart 10 shows that the tech sector continues to make inroads in the overall capex pie, according to financial statement-reported data, and has now doubled its share since the GFC trough to roughly 12%. National accounts corroborate this data and underscore that pent up demand is getting unleashed, following a near 15-year hibernation period (bottom panel, Chart 10). The news on the operating front is equally encouraging. The San Francisco Fed's tech pulse index - an index of coincident indicators of technology sector activity1 - is reaccelerating. Tech new orders-to-inventories are also picking up steam and suggest that sell side analysts have set the relative EPS bar too low (Chart 11). Finally, the latest PCE report revealed that consumer outlays on tech goods are also gaining momentum, even relative to overall consumer spending. While this upbeat backdrop would point to an above benchmark tech allocation, three risks keep us at bay. First, the tech sector garners 60% of its revenues from abroad and thus the appreciating U.S. dollar is a significant profit headwind, especially for 2019 when the delayed negative FX translation effects will most likely emerge (third panel, Chart 12). Chart 10Capex On The Upswing...
Capex On The Upswing…
Capex On The Upswing…
Chart 11...Underpinning Tech Operating Metrics...
...Underpinning Tech Operating Metrics…
...Underpinning Tech Operating Metrics…
Chart 12...But Three Risks Keep Us At Bay
...But Three Risks Keep Us At Bay
...But Three Risks Keep Us At Bay
Second, a rising U.S. inflation backdrop along with the related looming selloff in the bond market should knock the wind out of the tech sector's sails. Tech business models are built to withstand deflation and thrive in a disinflationary environment. Thus, when inflation re-emerges, tech stocks suffer (CPI and 10-year UST yield shown inverted, top two panels, Chart 12). Third, leading indicators of emerging Asian demand are souring rapidly and were the trade war to re-escalate, EM in general and tech-laden Korean and Taiwanese economic data in particular would retrench further (bottom panel, Chart 12). Bottom Line: We prefer to remain on the sidelines in the S&P information technology sector and sustain a barbell portfolio within the sector. As a reminder we continue to express our bullishness via two high-conviction overweight defensive tech sub-sectors, S&P software and S&P tech hardware, storage & peripherals (THSP), and our bearishness via avoiding their early cyclical peers, S&P semis and S&P semi equipment. Avoid Chip Stocks At All Costs While we are neutral the broad tech sector and prefer secular growth defensive tech sub-sectors, we continue to recommend shying away from chip and chip equipment stocks. Chart 13 shows the extreme sensitivity to changes in final demand of chip related stocks versus their defensive tech peers. In more detail, software and THSP indexes are in a secular advance with regard to EPS outperformance, whereas semis and semi equipment profits are hyper-cyclical with mean-reverting relative profit profiles. Granted, the commoditization of semiconductors explains this close correlation with the business cycle. But, as we highlighted last November when we put the semi equipment index on the high-conviction underweight list, extrapolating EPS growth euphoria far into the future was fraught with danger.2 In fact, late-November 2017 marked the peak in semi equipment performance versus the overall IT sector, confirming the early cyclical nature of chip stocks (Chart 14). Chart 13Bifurcated EPS
Bifurcated EPS
Bifurcated EPS
Chart 14Good Times...
Good Times…
Good Times…
Three factors have weighed heavily on this industry's growth prospects and there is no light at the end of the tunnel yet. Bitcoin's (and other cryptocurrencies) collapse is dealing a blow, at the margin, to demand for semi equipment (top panel, Chart 15). Taiwan's financials statement-reported data on IT capex and national data on overall Taiwanese capital outlays corroborates this downbeat demand backdrop (Chart 16). Finally, the drubbing in EM currencies is sapping purchasing power from the consumer and also warns that things will get worse for U.S. semi equipment stocks before they get better (bottom panel, Chart 15). Chart 15...Do Not Last Forever
...Do Not Last Forever
...Do Not Last Forever
Chart 16Semi-Heavy Taiwan Emits A Grim Signal
Semi-Heavy Taiwan Emits A Grim Signal
Semi-Heavy Taiwan Emits A Grim Signal
The outlook for their brethren, semi producers, is equally downtrodden. Global semi sales have crested and leading indicators of future semi revenue growth are sending a warning signal. Chinese imports of electronics have come to an abrupt halt, and the U.S. dollar's appreciation is also waving a red flag (second & bottom panels, Chart 17). BCA's calculated global leading economic indicator excluding the U.S. and BCA's calculated global ZEW Indicator of Economic Sentiment excluding the U.S. both herald a steep deceleration in global semi sales (Chart 17). On the pricing power front, using Asian DRAM prices as an industry pricing power gauge, DRAM momentum is on a trajectory to contract some time in Q1/2019. The implication is that semi earnings will surprise to the downside. Still expanding global chip inventories are not providing an offset and also confirm that semi EPS optimism is unwarranted (middle & bottom panels, Chart 18). Finally, another source of demand for chip stocks has reversed, as industry M&A activity has plummeted toward decade lows. Not only is this negative for pricing power, but inflated premia are also now working in reverse especially given this year's QCOM/NXPI and AVGO/QCOM flops (top panel, Chart 18). Our Chip Stock Timing Model (CSTM) does an excellent job encapsulating all these moving parts and is currently in the sell zone (bottom panel, Chart 19). Chart 17Global Semi Sales Trouble...
Global Semi Sales Trouble…
Global Semi Sales Trouble…
Chart 18...Abound
...Abound
...Abound
Chart 19Chip Stock Timing Model Says Sell
Chip Stock Timing Model Says Sell
Chip Stock Timing Model Says Sell
Bottom Line: Continue to avoid the S&P semis and S&P semi equipment indexes. The ticker symbols for the stocks in these indexes are: BLBG: S5SECO - INTC, NVDA, QCOM, TXN, AVGO, MU, ADI, AMD, MCHP, XLNX, SWKS, QRVO, and BLBG: S5SEEQ - AMAT, LRCX, KLAC, respectively. Anastasios Avgeriou, Vice President U.S. Equity Strategy anastasios@bcaresearch.com 1 https://www.frbsf.org/economic-research/indicators-data/tech-pulse/ 2 Please see BCA U.S. Equity Strategy Weekly Report, "2018 High-Conviction Calls," dated November 27, 2017, available at uses.bcaresearch.com. Current Recommendations Current Trades Size And Style Views Favor value over growth Favor large over small caps