United States
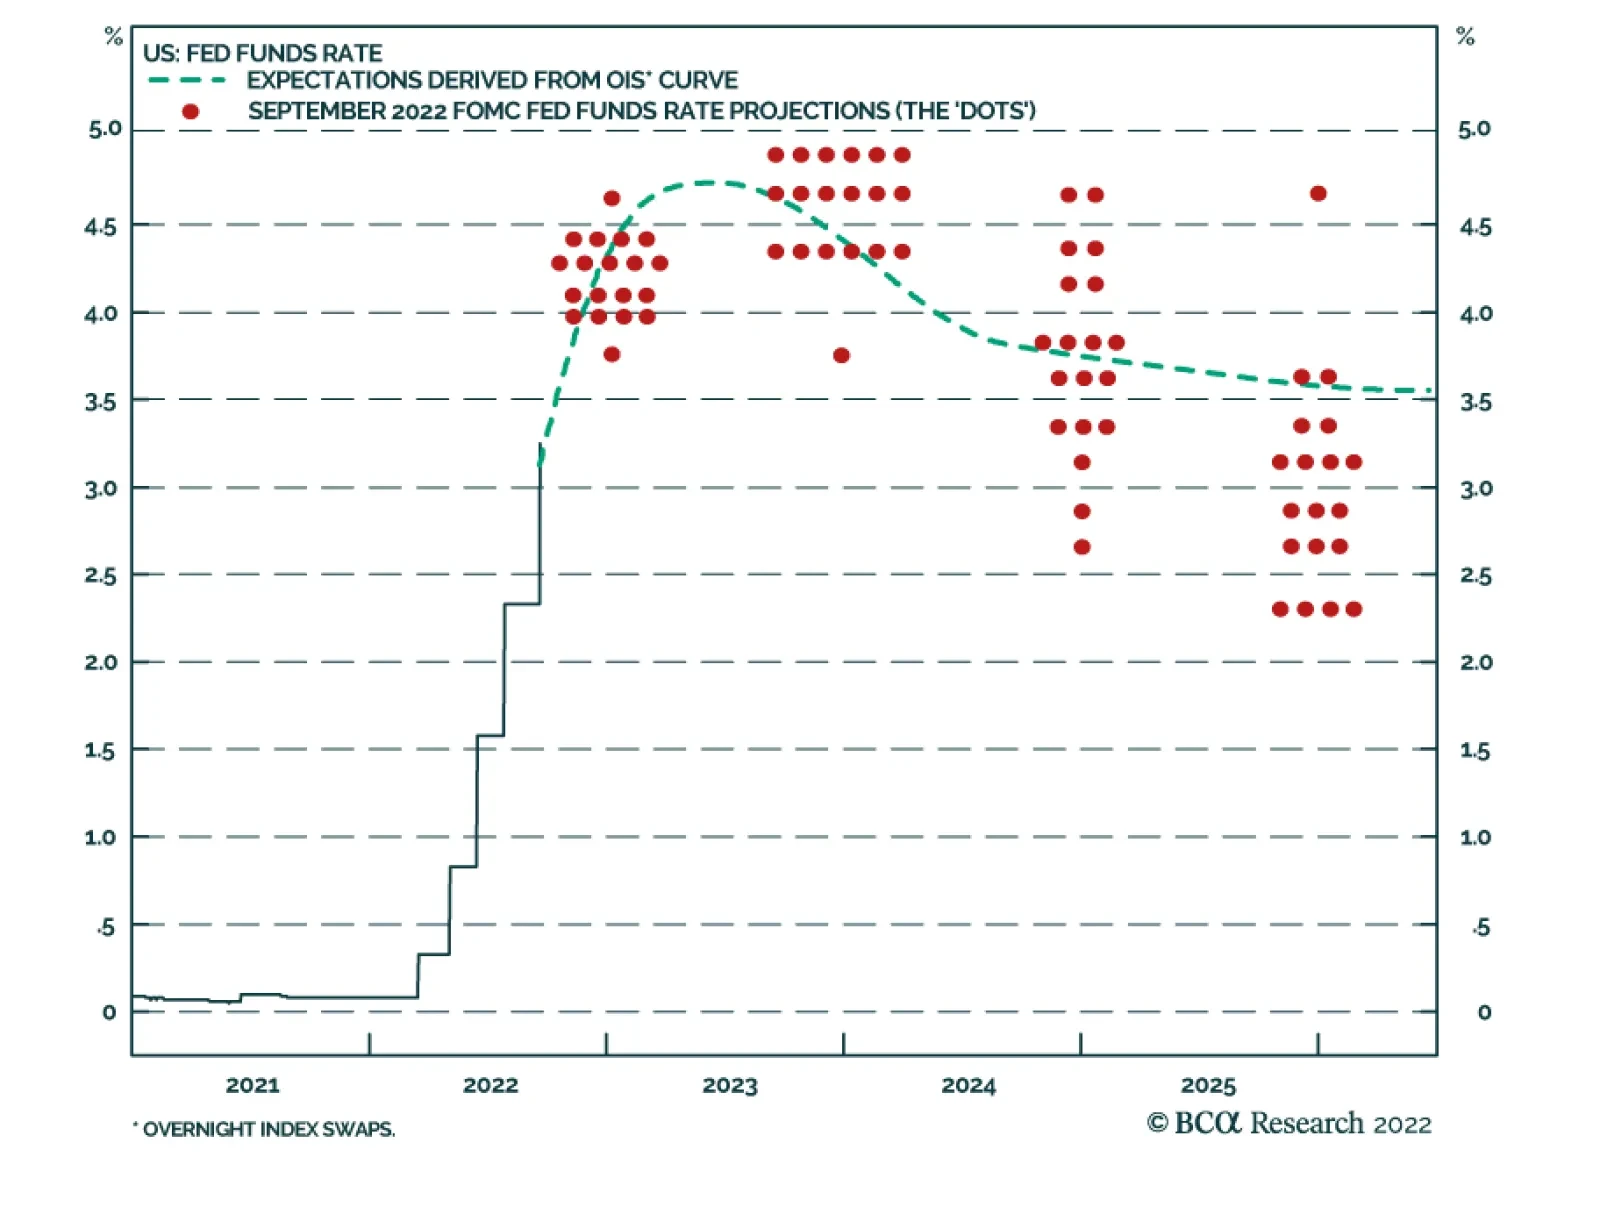
As expected, the Fed delivered a 75bp rate hike on Wednesday, bringing the fed funds rate to a range of 3% to 3.25%. The updated Summary of Economic Projections (SEP) shows downwards revisions to economic growth estimates and upwards revisions to unemployment…
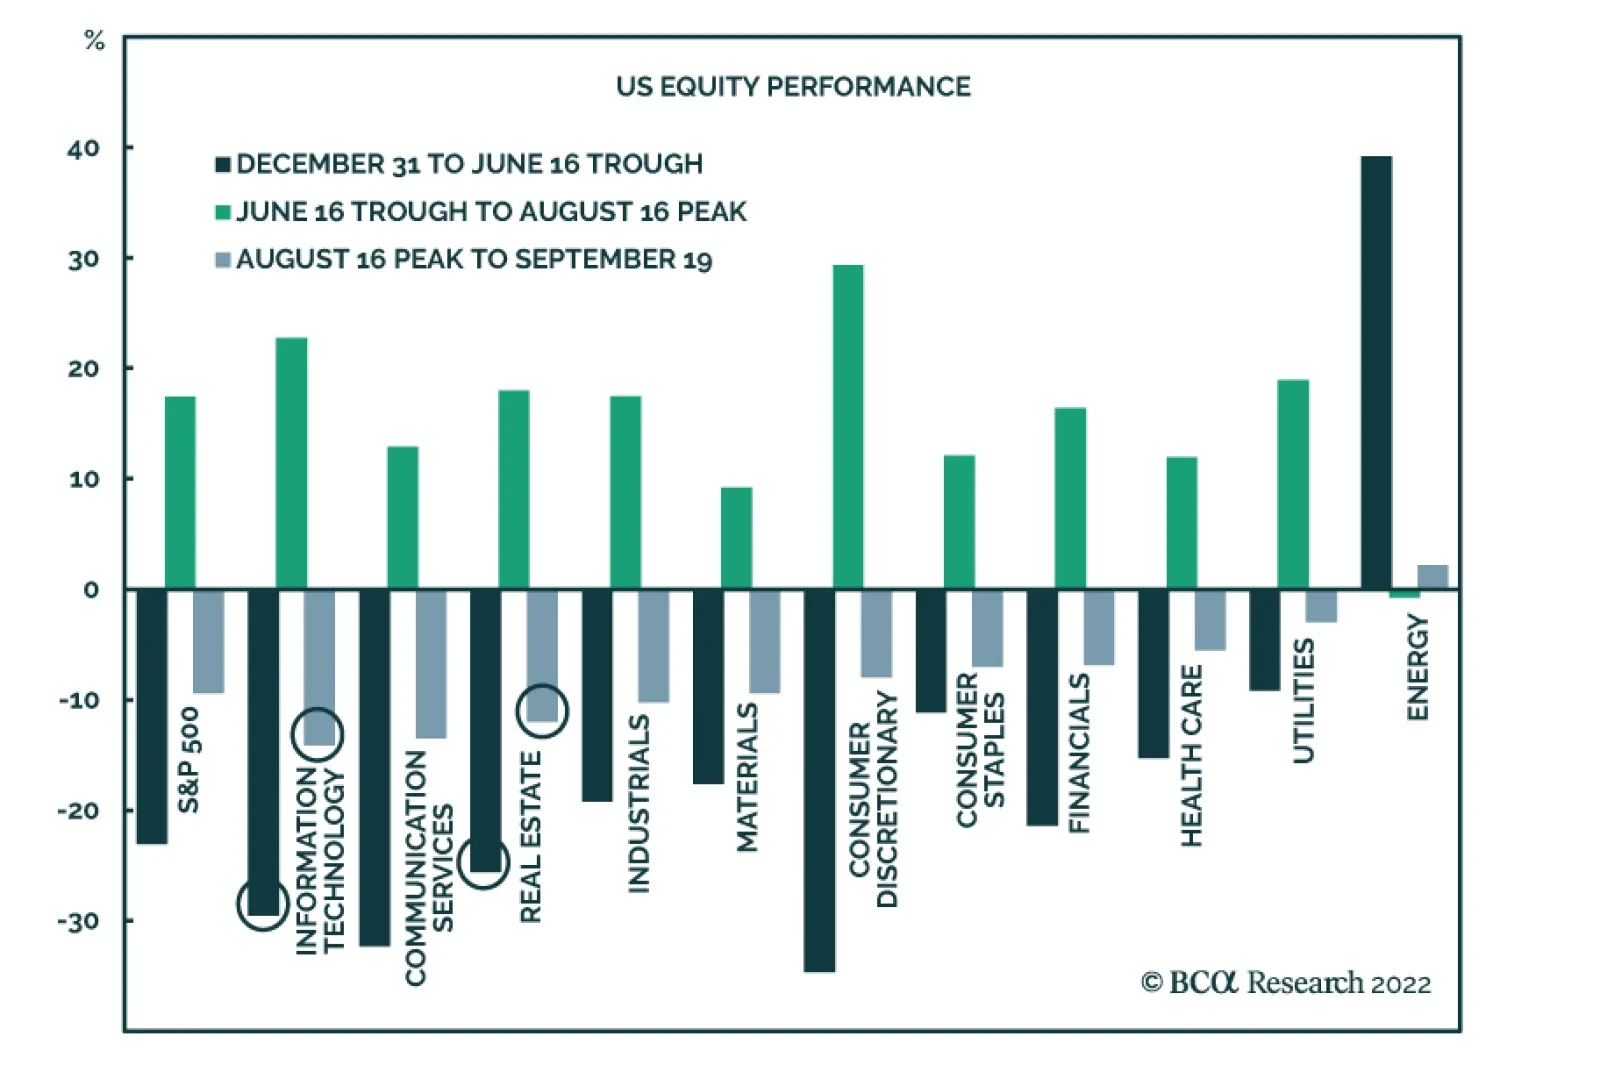
Since the S&P 500 peaked on August 16, information technology and real estate have been among the three worst performing US equity sectors. This marks a major reversal from their performance during the mid-June to mid-August rally. During that period, IT…
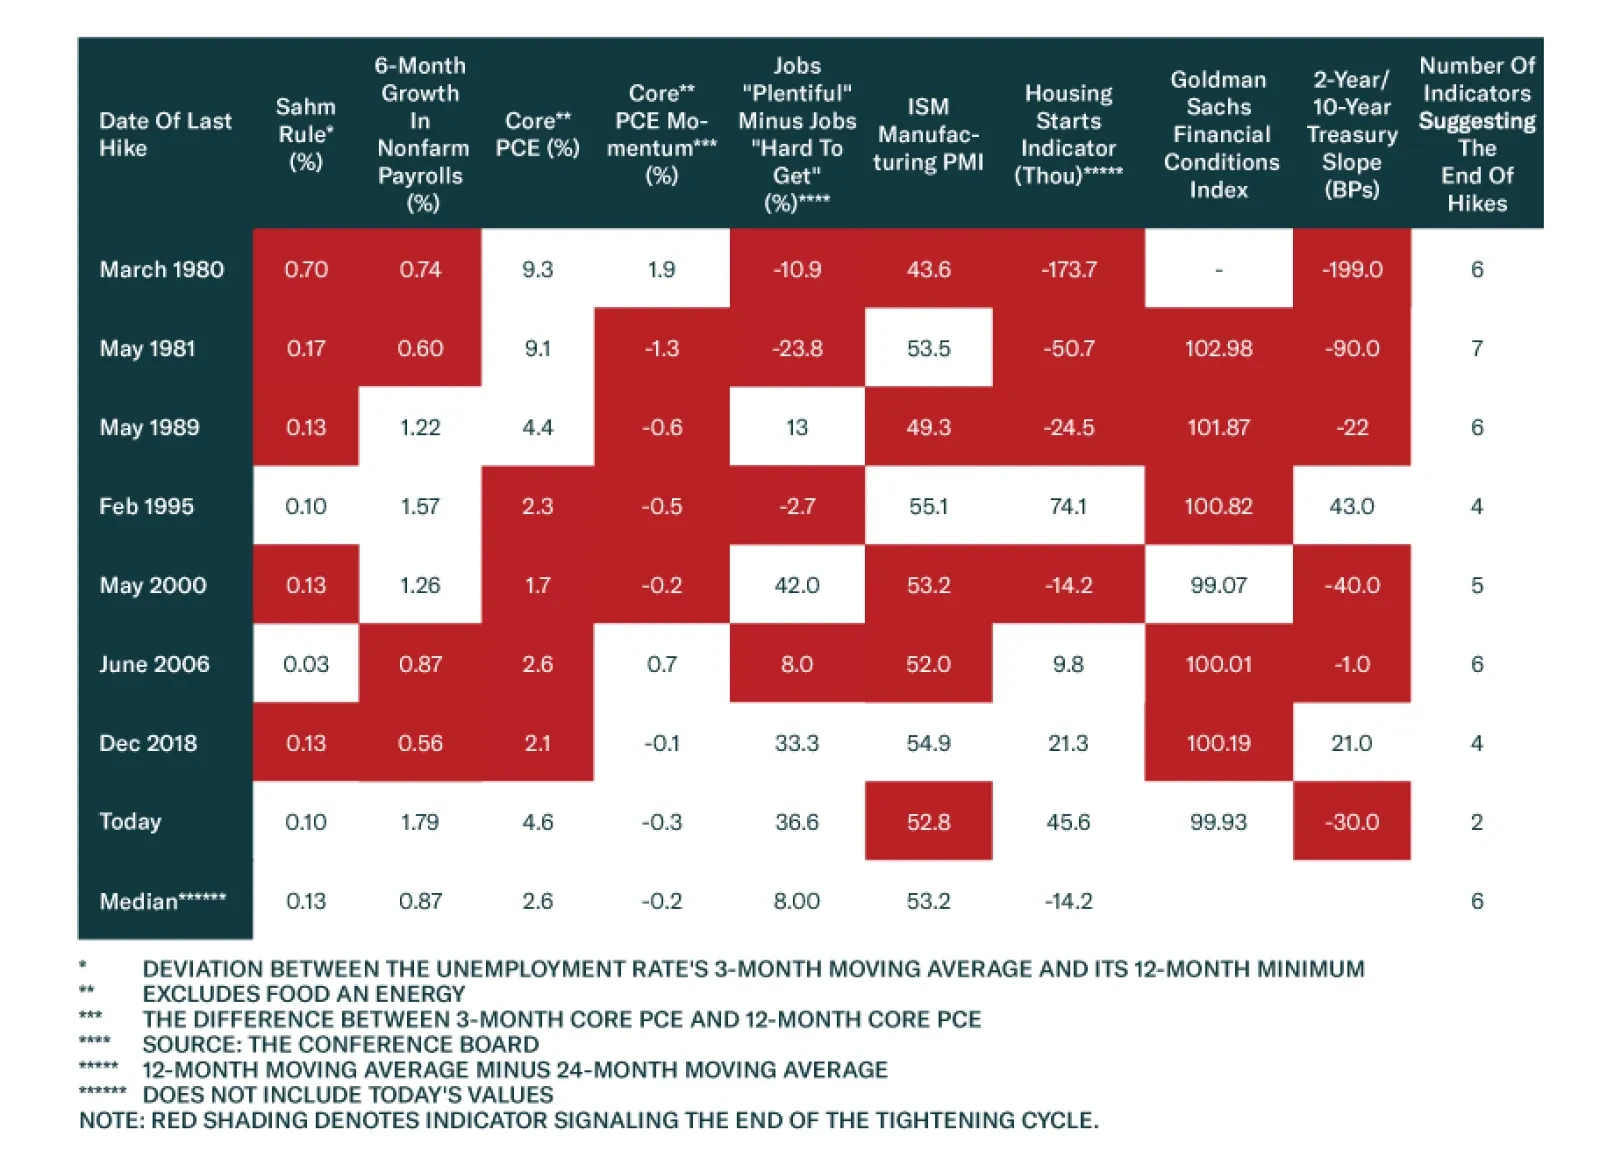
According to BCA Research’s US Bond Strategy service, we are not yet close to the end of the Fed’s tightening cycle. The team has identified nine economic indicators that are particularly relevant for the Fed’s policy stance. The indicators are: The…

Executive Summary There’s Value In TIPS
There's Value In TIPS
There's Value In TIPS
A survey of economic and financial market indicators suggests that we are not yet close to the end of the Fed’s tightening cycle. This argues for a continued flattening of the yield curve and one more push higher in bond yields before the end of the cyclical bond bear market. While headline inflation has rolled over, there is so far little indication of a slowdown in core price appreciation. We see core CPI reaching 3.6% during the next 12 months, driven by decelerating goods prices but sticky wage growth and services inflation. The TIPS market is discounting an overly sanguine view of headline inflation for the next 12 months, and there is value in owning TIPS versus nominal Treasuries. Bottom Line: Investors should reduce portfolio duration to ‘below-benchmark’ and hold a position in 5-year/30-year Treasury curve flatteners. Investors should also overweight TIPS versus nominal Treasuries and own 2-year/10-year TIPS breakeven inflation curve flatteners. Feature US bond yields continued their ascent last week, spurred on by August’s surprisingly high core CPI print and the perception that the Fed will have to tighten policy even more quickly to bring inflation back down. Currently, the market is discounting that the Fed will lift the funds rate to 4.61% by April of next year and then bring it back down to 4.26% by the end of 2023 (Chart 1). Chart 1Rate Expectations
Rate Expectations
Rate Expectations
This market-implied interest rate path would involve 225 bps of tightening at the next 5 FOMC meetings, or an average rate increase of +45 bps per meeting. With a 75 basis point rate increase looking like a lock for this week, market pricing is consistent with additional 50 basis point increases at the final two meetings of this year (November and December) and then two more 25 basis point rate hikes in Q1 2023. After that, the market anticipates that the tightening cycle will be over. Our view continues to be that the peak in the fed funds rate will occur later than April 2023 and that, while a pause in the Fed’s tightening cycle is likely at some point next year, inflation will be strong enough to preclude outright rate cuts. In terms of investment strategy, last week’s report presented empirical evidence showing that, on average, Treasury yields peak 1-2 months before the last rate hike of the cycle.1 In fact, in the seven Fed tightening cycles that we analyzed, the 10-year Treasury yield always peaked within a window spanning four months before the last rate hike and four months after (Table 1). This analysis suggests that even if the fed funds rate peaks in April, as is implied by the market, bond yields likely have one more leg higher before the end of the cyclical bear market. Table 1Timing Fed Tightening Cycles
One Last Hurrah For Bond Bears
One Last Hurrah For Bond Bears
While we have been consistently highlighting that the market is not pricing-in a sufficiently high average fed funds rate for 2023, we have been recommending an ‘at benchmark’ portfolio duration stance on the view that falling inflation could briefly send bond yields lower in the near term. The 10-year Treasury yield did fall back to 2.60% on August 1, but it then rebounded quickly and has continued to head higher since. With Treasury yields unlikely to re-test those depths anytime soon, we recommend shifting to a ‘below-benchmark’ portfolio duration stance to play the final leg higher in bond yields before a US recession ends the cyclical bond bear market. The next section of this report surveys nine cyclical economic indicators and argues that the balance of evidence suggests that the fed funds rate’s peak will occur later than April 2023. Then, the final section of this report discusses our recommended TIPS investment strategy in light of last week’s CPI report and our outlook for inflation. Tracking The Tightening Cycle One of the most useful tools in our arsenal for assessing the state of the interest rate cycle is our Fed Monitor. The Fed Monitor is a composite of 47 economic and financial market variables that has been designed to output a positive value when the data recommend interest rate hikes and a negative value when rate cuts are required. Historically, the Monitor does a good job of lining up with the actual path of the fed funds rate (Chart 2). Chart 2Fed Monitor Says More Tightening Required
Fed Monitor Says More Tightening Required
Fed Monitor Says More Tightening Required
The Fed Monitor is currently down off its highs, but at 1.03 it is well above the zero line. Looking at past tightening cycles, we find that the Monitor has averaged 0.41 on the day of the last rate hike of a cycle, with a range of outcomes spanning -0.49 to +0.93. Notably, the +0.93 upper-end of that range occurred in 1995, a time when the Fed only delivered a modest amount of policy easing before pivoting back to tightening in 1999. The variables in our Fed Monitor can be grouped into three categories: (i) economic growth variables, (ii) inflation variables and (iii) financial market variables. Interestingly, we observe that the Economic Growth component of our Monitor has dipped into negative territory while the Inflation and Financial Conditions components continue to argue for tighter policy (Chart 2, bottom 3 panels). A negative Economic Growth component suggests that we are getting closer to the end of the tightening cycle, but the Fed will likely stay hawkish and tolerate an even deeper negative reading from Economic Growth as long as inflation remains high. In addition to our Fed Monitor, we have identified nine economic indicators (some included in the Fed Monitor and some not) that are particularly relevant for the Fed’s policy stance. In this week’s report, we look at the message these indicators were sending on the day of the last rate hike of seven past tightening cycles. The indicators are: The Sahm Rule: Economist Claudia Sahm has noted that a recession always occurs when the 3-month moving average of the unemployment rate rises by more than 0.5% off its trailing 12-month low.2 We include the unemployment rate’s deviation from its 12-month low as a measure of labor market utilization. Employment Momentum: We look at the 6-month growth rate in nonfarm payrolls as a measure of momentum in the labor market. Inflation: We use 12-month core PCE as a measure of inflation that is most closely related to the Fed’s target. Inflation Momentum: To measure momentum in inflation we look at the difference between 3-month core PCE and 12-month core PCE. Labor Market Tightness: Using responses from the Conference Board’s Consumer Confidence Survey, we look at the number of people who describe jobs as “plentiful” minus the number who describe jobs as “hard to get”. Economic Growth: We use the ISM Manufacturing PMI as a simple measure of the trend in aggregate demand in the US economy. Housing: To assess trends in the housing market we look at the 12-month moving average in housing starts minus the 24-month moving average. Financial Conditions: We use the Goldman Sachs Financial Conditions Index to assess whether financial conditions are accommodative or restrictive. The Yield Curve: We look at the 2-year/10-year Treasury slope to ascertain whether the bond market perceives the monetary policy stance as accommodative or restrictive. Table 2A lists the nine indicators described above and shows their values on the day of the last rate hike of seven past tightening cycles. We also include the current reading from each indicator. Finally, we shade in red every cell that we deem consistent with the Fed stopping its tightening cycle. To make this determination we compare the value on the day of the last rate hike to the median value witnessed on the day of the last hike across all seven tightening cycles. We don’t use median values for the Goldman Sachs Financial Conditions Index or the Treasury slope. Rather, we say that an inverted yield curve and a Financial Conditions reading above 100 are both consistent with the end of rate hikes. Table 2AEconomic Indicators At The End Of Fed Tightening Cycles
One Last Hurrah For Bond Bears
One Last Hurrah For Bond Bears
The last column of Table 2A simply adds up the number of red cells in each row. As of today, we see that only 2 out of nine indicators are consistent with the end of the tightening cycle. The end of a tightening cycle has never occurred with less than four indicators flashing red. Table 2B takes a slightly more sophisticated approach to the same exercise. Rather than simply comparing above or below the median, we rank each indicator as a percentile relative to its value on the day of the last rate hike across seven different tightening cycles. We then combine those percentile ranks with an equal weighting to get an “End of Tightening Score”. Larger values are consistent with a greater likelihood that the tightening cycle will end and lower values are consistent with a lower likelihood. Currently, the End of Tightening Score stands at 28%, lower than on the day of the last rate hike in all of the cycles we analyzed. Table 2BEconomic Indicators At The End Of Fed Tightening Cycles: Percentile Ranks
One Last Hurrah For Bond Bears
One Last Hurrah For Bond Bears
As is the case with our Fed Monitor, the closest End of Tightening Score to today’s occurred in 1995. One key difference between 1995 and today is that core inflation was running much closer to target in 1995. This gave the Fed scope to fine tune its policy stance without risking its inflation fighting credibility. That flexibility is not available to the Fed in today’s high inflation environment. Bottom Line: A survey of economic and financial market indicators suggests that we are not yet close to the end of the Fed’s tightening cycle. This argues for a continued flattening of the yield curve and one more push higher in bond yields before the end of the cyclical bond bear market. Investors should set portfolio duration to ‘below benchmark’ and maintain a position in 5-year/30-year Treasury curve flatteners.3 The TIPS Market Is Too Complacent August’s month-over-month core CPI print came in well above expectations at +0.57%, sending bond yields higher and risk assets lower last week. Zooming out, while falling gasoline prices appear to have shifted the trend in headline inflation, there is so far little evidence of a meaningful move down in core or trimmed mean measures of CPI (Chart 3). Chart 3No Slowdown In Core CPI
No Slowdown In Core CPI
No Slowdown In Core CPI
Chart 4Core CPI Forecast
Core CPI Forecast
Core CPI Forecast
In a recent Special Report, we went through the five major components of CPI (energy, food, shelter, goods and services) and came up with 12-month forecasts for both core and headline inflation.4 For core inflation, we forecast that it will fall to 3.6% during the next 12 months (Chart 4). The main driver of the drop will be a return of goods inflation to pre-pandemic levels (Chart 4, panel 3). We anticipate only a minor pullback in shelter inflation (Chart 4, panel 2) and that services inflation will remain elevated, driven by strong wage growth (Chart 4, bottom panel). Recently, we have seen some evidence that home prices and rents on new leases are decelerating, no doubt a response to high and rising mortgage rates. That said, we don’t anticipate much pass through from those trends into shelter inflation during the next 12 months. First, home price appreciation leads shelter CPI by 18 months (Chart 5A). This means that we shouldn’t expect falling home prices to meaningfully impact shelter inflation until the end of 2023. Second, rental growth on new leases as measured by Zillow and Apartment List has clearly decelerated, but it is still running much hotter than shelter CPI (Chart 5B). Given the limited historical track record, it’s very difficult to say how much (if any) of the recent deceleration in rental growth will ultimately pass through to the CPI. Chart 5AHome Prices & Shelter CPI
Home Prices & Shelter CPI
Home Prices & Shelter CPI
Chart 5BDecelerating Rents
Decelerating Rents
Decelerating Rents
In our research, we have found that measures of labor market utilization are the most important variables to include in any model of shelter inflation. For ease of forecasting, the model shown in Chart 4 and in the top panel of Chart 6 uses the unemployment rate as its measure of labor market tightness. This model works well, but it arguably understates shelter inflation because it doesn’t include a variable capturing wage growth. If we replace the unemployment rate in our model with the more comprehensive aggregate weekly payrolls measure, then we get a much tighter fit and a model that does a better job explaining the recent surge in shelter CPI (Chart 6, bottom panel).5 All in all, we conclude that our expectation that shelter inflation will fall from 6.3% to 4.7% during the next 12 months may wind up being a tad optimistic. When we combine our forecast for 3.6% core inflation with two scenarios for the oil price – a benign one based on what is priced into the futures curve and another based on the forecasts of our commodity strategists – we get an expected range of 2.1% to 4.7% for headline CPI during the next 12 months (Chart 7). According to our Golden Rule of TIPS Investing, if 12-month headline CPI comes in above the current 1-year CPI swap rate then TIPS will outperform nominal Treasuries during the 12-month investment horizon.6 Chart 6Modeling Shelter Inflation
Modeling Shelter Inflation
Modeling Shelter Inflation
Chart 7There's Value In TIPS
There's Value In TIPS
There's Value In TIPS
At present, the 1-year CPI swap rate is 2.76%, near the bottom of our expected range of outcomes for 12-month headline CPI. It seems to us that a lot of things will have to go right for inflation to come in below market expectations during the next year. For this reason, we think it makes sense for investors to overweight TIPS versus nominal Treasuries in US bond portfolios. Chart 8Own Inflation Curve Flatteners
Own Inflation Curve Flatteners
Own Inflation Curve Flatteners
Additionally, we see a lot of value in owning TIPS breakeven curve flatteners (Chart 8). The 2-year and 10-year TIPS breakeven inflation rates are both currently 2.38%, meaning that the 2-year/10-year TIPS breakeven slope is at zero. Higher-than-expected inflation during the next 12 months will put more pressure on the front-end of the breakeven curve than the long end, flattening the curve. Further, logic dictates that an inverted inflation curve is more consistent with an environment where the Fed is fighting above-target inflation than a positively sloped one. There will come a time when it makes sense for the inflation curve to move back into positive territory, but that won’t be until the Fed has brought inflation down much closer to its target. Bottom Line: The inflation outlook priced into markets for the next 12 months is too benign. Investors should overweight TIPS versus nominal Treasuries and own TIPS breakeven inflation curve flatteners. Ryan Swift US Bond Strategist rswift@bcaresearch.com Footnotes 1 Please see US Bond Strategy Weekly Report, “A Brief History Of Fed Tightening Cycles”, dated September 13, 2022. 2 https://www.brookings.edu/wp-content/uploads/2019/05/ES_THP_Sahm_web_20190506.pdf 3 For more details on this curve trade please see US Bond Strategy Weekly Report, “The Great Soft Landing Debate”, dated August 9, 2022. 4 Please see US Bond Strategy Special Report, “The Golden Rule Of TIPS Investing”, dated August 23, 2022. 5 Aggregate weekly payrolls = nonfarm employment x average weekly hours x average hourly earnings 6 Please see US Bond Strategy Special Report, “The Golden Rule Of TIPS Investing”, dated August 23, 2022. Recommended Portfolio Specification Other Recommendations Treasury Index Returns Spread Product Returns
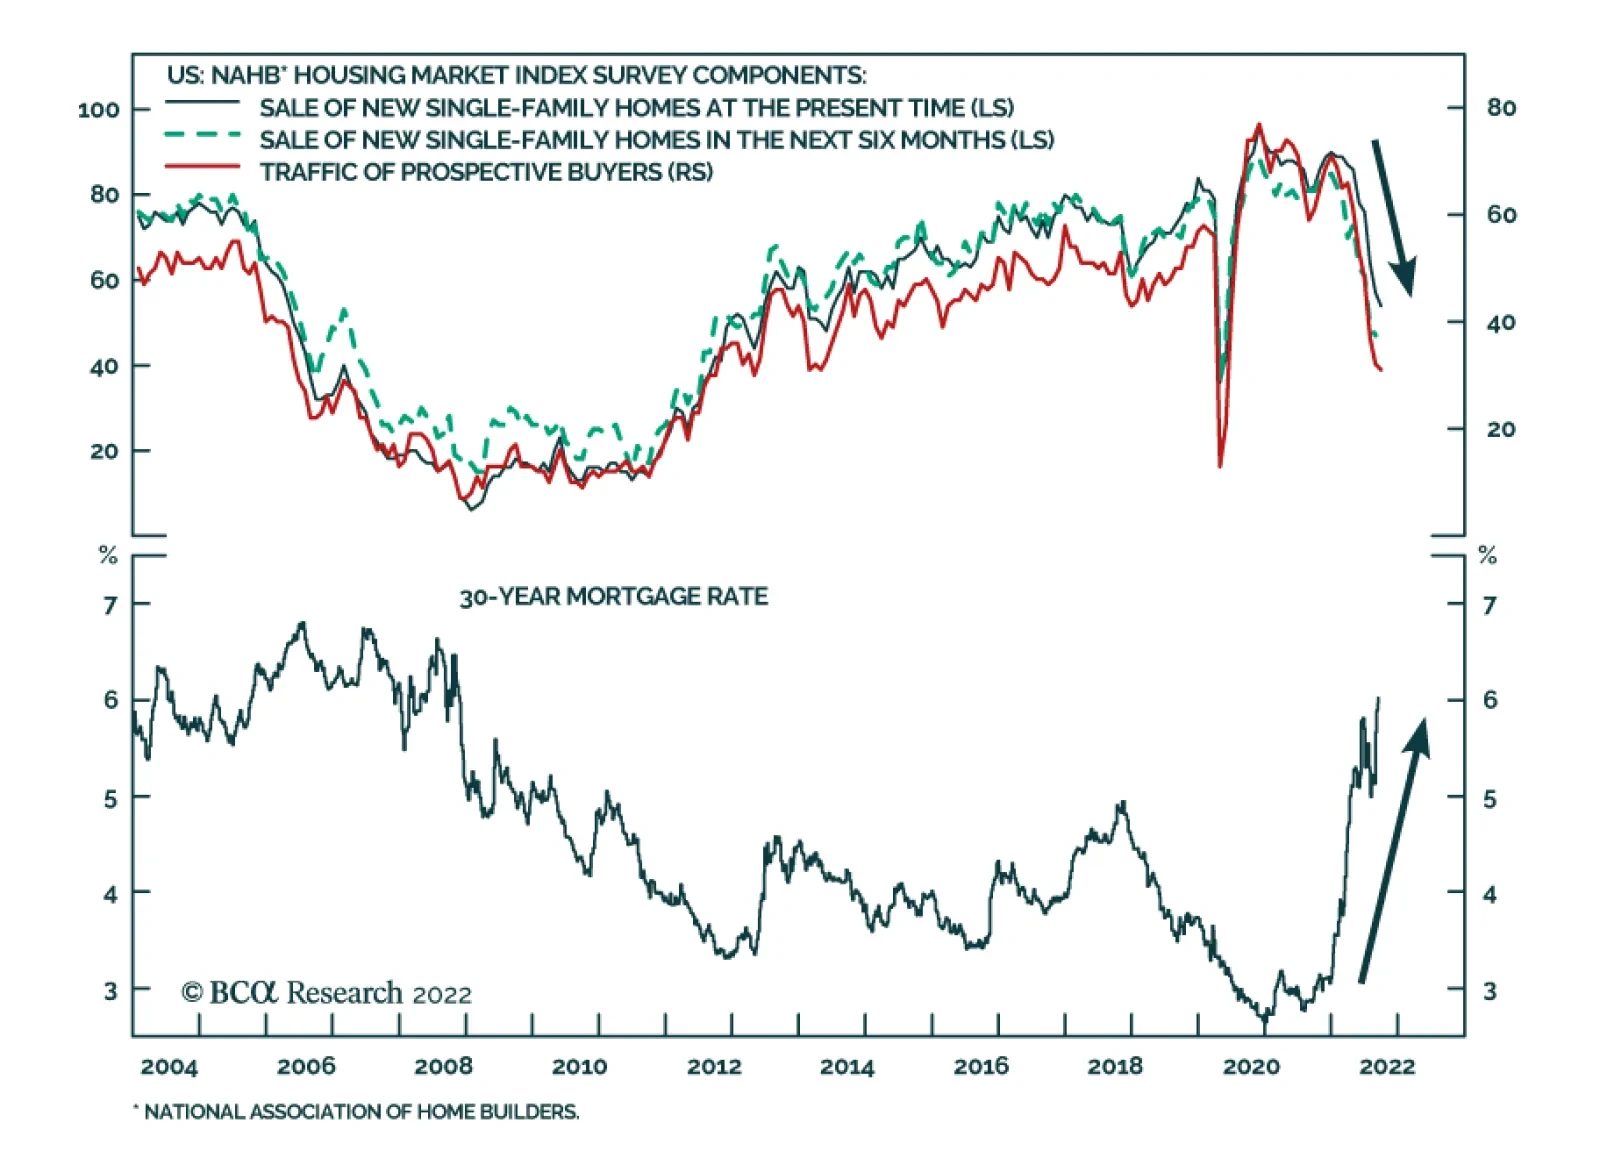
The NAHB Housing Market Index, which measures sentiment among US homebuilders, dropped by a greater-than-expected 3 points to 46 in September, the lowest level since May 2020. All three sub-indices – current sales conditions, sales expectations in the next…
Image
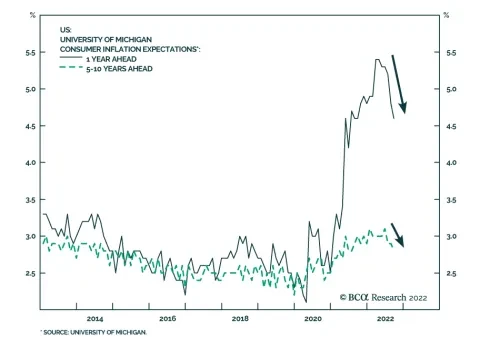
The preliminary release of the University of Michigan Consumer Survey shows household sentiment firmed slightly in September. The headline index ticked up by 1.3 points to 59.5 on the back of improvements in both the…
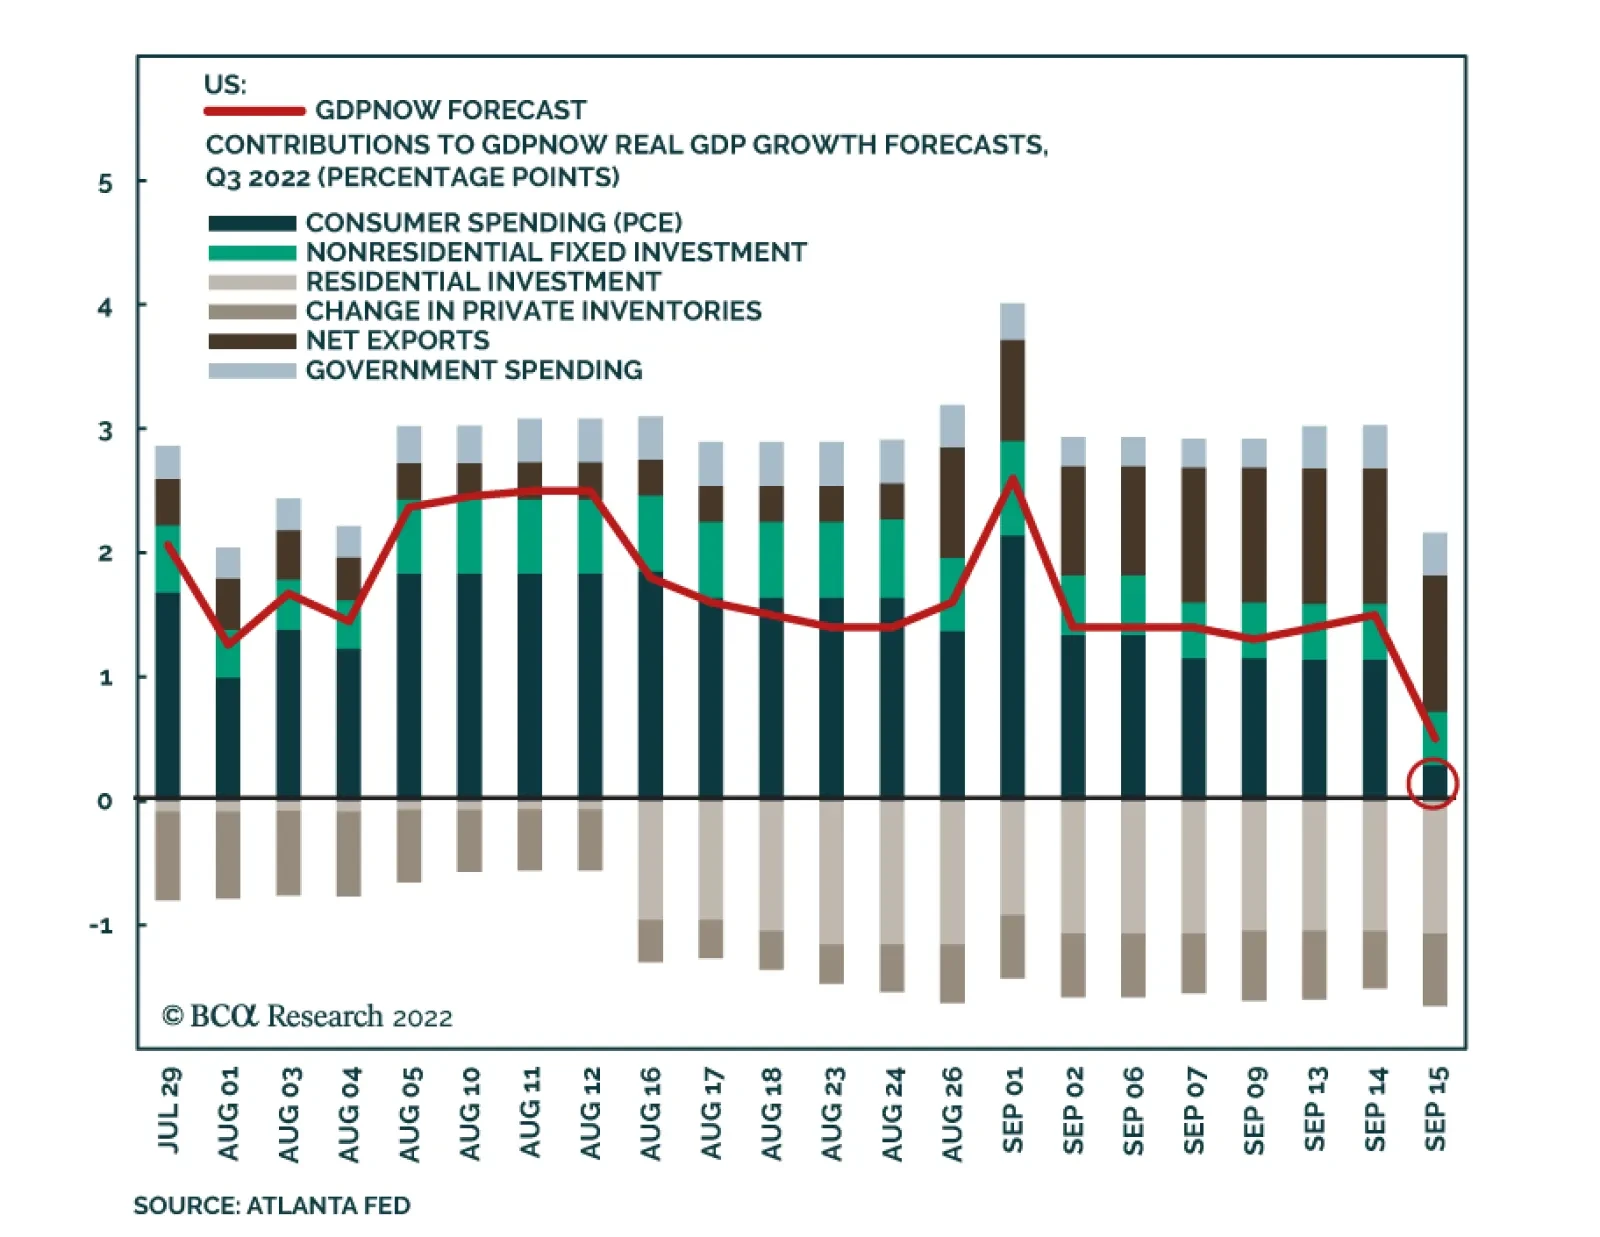
Just over a month ago, we highlighted that the Atlanta Fed’s GDPNow model was signaling that US economic conditions were firming in Q3. At the time, the model was estimating US real GDP growth of 2.5% in Q3. However, the most recent reading is not as…
Executive Summary Robotization Is Gaining Pace
The Robot Revolution
The Robot Revolution
In today’s publication, we will zero in on one of the most exciting areas of technological innovation that also presents substantial long-term investment potential – robotics. The robotics industry is expected to grow steadily both in the US and abroad thanks to a confluence of favorable long-term trends such as deteriorating global demographics, and a shift of manufacturing toward onshoring and customization. Thanks to technological breakthroughs in the areas of AI, machine learning, lidars, and machine vision, robots are becoming more intelligent and dexterous, thus suitable for an increasing list of tasks and applications. Robots are also becoming more affordable, which is a catalyst for ubiquitous adoption. Increased connectivity and broad-based automation and robotization, are ushering in Industrial Revolution 4.0, improving productivity manyfold. Over time, robotics will change our world beyond recognition, improving not only manufacturing and service industries but also our daily lives. Bottom Line: Robotics is an exciting story of technological innovation, which also presents substantial long-term investment potential. And while the US equity market is likely to remain volatile for months to come, the recent correction in robotics stocks presents an attractive entry point for patient investors with longer investment horizons. Chart 1US Manufacturers Cannot Fill In Vacant Positions, Wages Are Surging
US Manufacturers Cannot Fill In Vacant Positions, Wages Are Surging
US Manufacturers Cannot Fill In Vacant Positions, Wages Are Surging
Last month we published a report: “Industrials: A Trifecta Of Positives” in which we noted that the US is entering a period of industrial boom prompted by favorable government policy and generous spending, and strong new trends in onshoring and automation (Chart 1). This trifecta of positives helps the sector defy the gravity of the slowing economy. In this week’s publication, we will zero in on automation and robotization. This is one of the most exciting areas of technological innovation, which presents substantial long-term investment potential. And while the US equity market is likely to remain volatile for months to come, robotics ETFs such as BOTZ, ROBO, IRBO, and ROBT are off some 40%-50% from their recent post-pandemic peaks (Table 1) and present an attractive entry point for patient investors with longer investment horizons. Table 1An Attractive Entry Point for Long-term Investors
The Robot Revolution
The Robot Revolution
What Is A Robot? Recent breakthroughs in AI and robotics technology are awe-inspiring and unsettling. The "robot revolution" could be as transformative as previous General Purpose Technologies (GPT), including the steam engine, electricity, and the microchip. GPTs are technologies that radically alter the economy's production process and make a major contribution to living standards over time The most basic definition is "a device that automatically performs complicated and often repetitive tasks". Interestingly, according to the definition of the International Standards Organization (ISO), software (bots, AI, process automation), remotely controlled drones, voice assistants, autonomous cars, ATMs, smart washing machines, etc. are not robots. Broadly speaking, there are three types of robots: Industrial, service, and collaborative (cobots). Industrial robots work on assembly lines in manufacturing, service robots perform necessary as well as potentially harmful tasks for humans, while collaborative robots (or “cobots”) work next to human workers. We will discuss different types of robots in more depth in later sections. Robotics Industry Is Growing Steadily Global Adoption Chart 2Robotization Is Gaining Pace
The Robot Revolution
The Robot Revolution
According to the International Federation of Robotics, as of 2020, industrial robot stock has constituted 3 million units and between 2015 and 2020 has been growing at 13% per year. A total of 383,000 units of industrial robots were installed in 2020. Industrial robots reported record preliminary sales in 2021, with 486,800 units shipped globally, a 27% increase from 2020. The pace of installations is forecasted to stay robust well into 2024 (Chart 2). Service robot adoption has also clearly been crossing the chasm: In 2020, nearly 132,000 service robots were installed, a 41% increase over 2019, and 19 million consumer service robots were installed, a 6% increase over 2019. Together, the service robot turnover was approximately $12 billion in 2020. The US Is Lagging But The Pace Is Accelerating Chart 3Industrial Robots Across The Globe
The Robot Revolution
The Robot Revolution
The US has been lagging other developed countries in terms of automation and robotization (Chart 3). However, labor shortages brought about by the pandemic appear to have “moved the needle.” According to the Association for Advancing Automation (A3), the number of robots sold in the US in 2021 rose by 27% over 2020 with 49,900 units installed. 2022 is on pace to exceed previous records, with North American companies ordering a record 11,595 robots in Q1, a 28% increase over Q1-2021. Multiple Tailwinds Promote Ubiquitous Robotization The robotics industry is expected to grow steadily both in the US and abroad thanks to a confluence of forces, such as deteriorating global demographics, manufacturing shifts toward onshoring and customization, and technological breakthroughs that make robots more capable and affordable. Aging Population Leads To Labor Shortages Populations in both developed and emerging markets is aging: More people both in high and upper-middle-income countries will retire in the next decade than will enter the workforce, making labor shortages inevitable. In the US, the problem is particularly acute. Since 2020, labor force participation has declined from 63.4% to 62.4%, most likely due to early retirements, while the unemployment rate stands at a historically low 3.7%. There are two job openings per job seeker, and many businesses report difficulty finding qualified staff. As companies are struggling to fill existing openings, they are increasingly turning towards robots: Replacing labor with automation/robots allows them to produce more and avoid a profit margin squeeze. IFR reports that an increasing number of small- and medium-sized businesses are deploying robots. Related Report US Equity StrategyIndustrials: A Trifecta Of Positives Onshoring And Reshoring As we pointed out in the recent report on Industrials, the onset of the pandemic and geopolitical tensions have accelerated the pace of reshoring. Supply chain disruptions have highlighted corporate vulnerabilities and made companies realize that “just-in-case” trumps “just-in-time.” However, companies that bring their businesses back home do realize that finding workers is a challenge, while labor costs are many times higher. Hence, one of the solutions they pursue is automation and robotization. Mass Customization The “new normal” in many industries is mass customization, i.e., variations for a growing number of products, dubbed a “batch of one.” The shift towards high mix, low volume production raises the importance of manufacturing flexibility and agility – and that is when the industrial robot, capable of working in high to low-volume productions on simple to complex processes, comes to the rescue. The Lower Total Cost Of Ownership Technological advances have made robots both more sophisticated and more affordable. In addition, to a growing supply of low-cost robots, there are also novel pricing models, such as “Robots-as-a-Service” and pay-as-you-use, which support the ubiquitous adoption of robots even by smaller enterprises. Technological Breakthroughs Recent advances in artificial intelligence (AI), computer vision, radars, and networks have expanded the range of tasks that robots can do. Effectively, new technology gives the robot the ability to see, hear, and pick up objects, acting differently according to the data the robot receives, offering it a certain level of autonomous decision-making. Now that robots can “see” and “hear,”, they are being taught how to “feel,” and some of the recent technological advances are truly mind-boggling. Glasgow University researchers have developed ultra-sensitive electronic skin that learns from sensations it experiences. A robotic hand covered with the new e-skin recoiled from what it recognized as “painful” stimuli. This new technology will allow robots to interact with the world in a whole new way, an invention that can be leveraged in a wide range of applications, from prosthetic limbs to the “internet-of-things”.1 And this is just one of many recent inventions. Virtuous Cycle Of Innovation The Robotics industry is going through a perpetual and ever-accelerating cycle of innovation (Chart 4). Improvements to one domain of robotic applications can be transferred to others, benefitting from “adjacent” technologies. In other words, innovations in vacuum cleaners or transport trucks can be easily applied to other areas of robotics, as despite differences in prices and value-add, all the robotic applications are trying to solve the same problems. Advances in different fields in robotics create opportunities for ever more applications, creating a virtuous cycle. Chart 4Robotics Will Enter Into A Virtuous Cycle
The Robot Revolution
The Robot Revolution
Furthermore, robotics is a poster child for Moore’s Law, which refers to the phenomenon whereby transistors on a microchip double every two years, eventually leading to exponential improvements in computing power. Automation and robotics take advantage of these improvements as they are challenged with more complex tasks. We predict the virtuous cycle for robots will span several decades. As the cost of automation drops, better solutions will be developed, resulting in the ‘early retirement’ of dated but otherwise fully functional robotic systems. The following is a brief synopsis of advances in technology and their applications to robotics. Technologies That Help Robots Act Like Humans AI And Machine Learning (ML) AI and ML not only teach robots to perform certain tasks but also makes machines more intelligent by training them to act in different scenarios. To do this, vast amounts of data are consumed. For example, to “teach” a robot to recognize an object and act accordingly, a massive number of images are used to train the computer vision model. Dexterity And Deep Imitation Learning One of the major challenges of roboticists is improving the dexterity of robots and empowering them to manipulate objects gripped by the hand, akin to humans. Some researchers are using machine learning to empower robots to independently identify and work out how to grab objects. Deep Imitation Learning, neural-network-based algorithms, allow the robot to “learn” from humans. For example, in a robotics study led by researchers from the University of Tokyo, the machine learning embedded in the robot practiced a method observed by a human demonstrator. After watching one of the researchers peel a banana periodically for thirteen hours, a robot successfully learned how to peel a banana without crushing the fruit.2 There are also major improvements in hardware, with grippers ranging from pincer-like appendages to human-like hands. Lidar Lidar (Light Detection and Ranging) technology uses sophisticated laser radars that allow robots to navigate their surroundings through object perception, identification, and collision avoidance. Lidar sensors provide information in real-time about the robot’s surroundings such as walls, doors, people, and various objects. While originally expensive, Lidar costs are starting to fall thanks to a more effective chip design and more economical mechanical implementation. Lidars are crucial for advances in industrial automation and warehouse robots. Machine Vision Deep Learning has brought about a groundbreaking advancement in machine vision. One of the early hurdles in machine vision may be described with a simple question: “Am I looking at a large object that’s far away or a tiny object that’s up close?” The modern approach to answering this question is to use both 3-D cameras and the context. 3-D is simulated by using two or more overlapping cameras, correlating the information on camera movements with changing images from the cameras. Deep Learning algorithms help formulate the context of these changing images.3 Machine vision provides higher quality mapping at a more affordable cost than Lidar, especially when it comes to indoor robotics and automation. Industrial Internet Of Things In Robotics The implementation of the “Industrial Internet of Things” (IIoT) is vital for manufacturing automation and robotics. Its main goal is to create a constant tracking of inputs and outputs, enabling communication along the entire supply chain, passing data between enterprise level and plant floor systems, and improving productivity through the use of big data. Robots working at different stages of the manufacturing process are interconnected, ensuring flawless production. IIoT technology aims to improve productivity by reducing human-to-human and human-to-computer interactions, reducing costs, and minimizing the probability of mistakes. Similar to smart homes, IIoT factories are smart factories.4 Industrial Revolution 4.0 Early industrial robots performed very specific operations under carefully controlled conditions – an assembly robot that encountered a misaligned component would simply install it that way, resulting in a defective product. However, thanks to improvements in vision systems, computing, AI, and mechanics, the ability of robots to perform increasingly complex tasks that involve some limited decision-making has improved. Increased connectivity, brought about by IIoT, and ubiquitous automation and robotization, are ushering in a new Industrial Revolution, dubbed 4.0. As in previous industrial revolutions, innovation improves productivity manifold. Chart 5Robots Are Proficient In Many Tasks
The Robot Revolution
The Robot Revolution
Industrial robots are deployed to carry out a wide variety of tasks (Chart 5). Arc welding, spot welding, assembly, palletizing, material removal, inspection, material handling, and packaging are some of the most popular applications for robots, but the list does not stop with just those. Industrial robots limit the need for human interaction while being able to complete tasks accurately with a high level of repeatability. Proficiency with these many tasks allows robots to add value to a multitude of industries, such as automotive, electronics, aerospace, food, and medical. While in the past the automotive sector was the key end-demand market for global robotics sales, non-automotive sales now represent 58% of the total, demonstrating a broadening reach of automation. Metals, Auto, and Food and Consumer Goods have the highest growth in terms of the purchase of robots (Charts 6 & 7). Chart 6Robots Are Gaining Traction In Multiple Industries
The Robot Revolution
The Robot Revolution
Chart 7In The US, Robotization Is Broad-Based
The Robot Revolution
The Robot Revolution
We expect the rising digitalization of the manufacturing sector to lead to a new wave of automation investment in developed countries. Key Players In Industrial Robots Space The global industrial robotics market is largely dominated by established Japanese and European companies: ABB, Yaskawa, KUKA, and Fanuc. However, the sizzling demand for robots demonstrates that technological breakthroughs are no longer just about the established players, as many industrial companies, such as Rockwell Automation, Eaton, and Caterpillar, are becoming leaders in this new space. These companies also reach across the aisle to software companies to leverage their expertise in data storage, computing, and artificial intelligence. Rockwell has recently partnered with Microsoft, while others are acquiring software companies. Deere has acquired GUSS Automation, a pioneer in semi-autonomous spring for high-value crops. These companies will benefit from strong demand for their products and should exhibit strong sales and profit growth. Service Robots Are Here To Help Service robots can significantly benefit humans in a variety of fields, including healthcare, automation, construction, household, and entertainment. These robots are managed by internal control systems, with the option of modifying the operation manually. These service robots remove the possibility of human error, manage time, and increase production by lowering the workload of staff and labor. Chart 8Service Robots Across Industries
The Robot Revolution
The Robot Revolution
Service robots are quickly becoming an essential part of business for service-focused companies in healthcare, logistics, and retail (Chart 8). Developments in edge artificial intelligence processors and the arrival of 5G telecom services are likely to propel the market for service robots to new heights. The usage of service robots is extremely broad and range from cleaning to preparing meals to delivering goods. The following are some of the key areas that benefit from service robots. Healthcare Common duties assigned to service robots include setting up patient rooms, tracking inventory and placing orders, and transporting supplies, medication, and linens. Cleaning and disinfection robots can also help create a safe and sanitized facility for everyone. Further, robots assist in performing difficult surgeries and medical procedures. Robots also help the elderly and disabled. For example, ReWalk has developed a wearable robotic exoskeleton that provides powered hip and knee motion to enable individuals with spinal cord injury (SCI) to stand upright, walk, turn, and climb and descend stairs. The system allows independent, controlled walking while mimicking the natural gait pattern of the legs. Military Defense Autonomous Mobile Robots (AMR) are helpful for combating fires, disarming bombs, and traversing through dangerous areas. Fully automated drone robots are indispensable for military intelligence and combat operations. Logistics As e-commerce sales continue to surge, logistics businesses are using service robots to help overcome current labor shortages, assist current workers to avoid workforce burnout, and enable warehouse automation. Robotic arms are often assigned tasks like picking, placing, and sorting objects, and because these cobots can navigate warehouses independently, they are used to deliver materials to human workers for accurate and efficient order fulfillment. Some logistics companies, such as FedEx, are experimenting with using AMR for last-mile delivery of goods, which is often the most expensive and least productive part of the entire delivery chain. AMR can navigate sidewalks, unpaved surfaces, and steps while carrying cargo. Key Players In Service Robots Space Many US companies are active in this space. Amazon (AMZN) developed robots to support its fulfillment center operation: Robots help automate storage and retrieval mechanisms throughout vast warehouses. IRobot (IRBT) has developed a series of AI-enabled robot vacuums, mops, and pool cleaners – friendly pet-like bots you may see in many American homes. There are also highly sophisticated surgical robots, developed by Stryker (SYK) and Intelligent Surgical (ISRG). Collaboration Between Humans And Robots Collaboration between humans and robots is still in its infancy but it is one of the fastest-growing fields within robotics. Cobots work alongside humans, allowing humans to be more productive and avoid tedious or strenuous tasks. Cobots can be installed directly in the current production system, with less space than conventional robots. Equipped with intelligent features such as vision and force sensors, the flexibility of cobots means they can perform tasks like parts handling, assembly, and bin picking. Manufacturers adopting cobots, particularly those featuring vision and inspection systems, are seeing an increase in quality and efficiency. Investment Characteristics I hope we have convinced our readers that Robotics is a promising long-term investment theme. We also noted that the robotics ETFs are currently down substantially from their peaks. However, this report would not have been complete without a closer look at the investment characteristics of the robotics ETFs. A few salient points: Table 2Price Sensitivity
The Robot Revolution
The Robot Revolution
Robotics ETFs have betas to the S&P 500 ranging from 1.2 to 1.4 (Table 2), which signals that the robotics sector is a high octane play on the US equity market. The recent pullback in the S&P 500 was particularly punishing for the stocks exposed to robotics. In terms of market capitalization, companies in this space tend to be smaller than the median company in the S&P 500, as they constitute the robotics ecosystem and supply chain (AI, Lidar), and tend to be younger and smaller. Robotics ETFs have always traded at a premium to the market given their superb growth potential. However, currently, ROBO ETF, which is a proxy for the rest of the cohort on a relative basis, is trading just under a half standard deviation above the historical mean (Chart 9). In terms of macroeconomic exposure, all of the robotics ETFs have a pronounced negative exposure to the US dollar – after all, robotics and automation are a global phenomenon. A stronger dollar makes American multinational sales from abroad lower both because of the translation effect and higher prices. The robotics theme doesn’t have much exposure to interest rates, inflation, or commodities, but is somewhat positively exposed to bitcoin (Table 3). Chart 9Valuations And Technicals Are Attractive
Valuations And Technicals Are Attractive
Valuations And Technicals Are Attractive
Table 3Robotics Is A High Octane Equities Theme With A Significant Sensitivity To USD
The Robot Revolution
The Robot Revolution
Investment Implications Robotics is a compelling long-term investment theme as Industrial Revolution 4.0 is taking place in front of our eyes. And while over the short term, monetary tightening and slowing economic growth, both at home and abroad, will be a headwind; over time a new Google or Facebook may emerge in this space. We have already watched the success of Nvidia, a supplier of sophisticated chips for the industry. Table 4Comparing ETFs
The Robot Revolution
The Robot Revolution
There are four ETFs that focus on Robotics and Automation (Table 4). BOTZ Is the largest ETF with $2.1 billion AUM, followed by ROBO at $1.7 billion, which is also the most expensive (Table A1 in the Appendix) Which one is the best? To answer this question, we have turned to the quant wizards at the BCA Equity Analyzer team. To compare the ETFs, they have assigned a BCA stock selection and Owl Analytics ESG scores to stocks in each of the robotics ETFs, to calculate composites. We note the BCA composite score is low across the board, as robotics as a nascent investment theme scores low on valuations. We note that while ESG scores are comparable across the portfolios, there is some variation in BCA scores. Overall, ROBO is marginally better than the other options: It has the highest BCA score and is the most liquid. It also has a lower beta to the S&P 500 than BOTZ and IRBO, making it slightly less risky. Unfortunately, it is also the most expensive. Bottom Line Robotics is an exciting long-term theme that benefits from multiple tailwinds, such as demographic trends, continuous technological innovation, reshoring, and customization. Robots are also becoming more intelligent and dexterous, and have better “senses,” making them suitable for an increasing list of tasks and applications. Robots are also becoming more affordable, which is a catalyst for ubiquitous adoption. Over time, robotics will change our world beyond recognition, improving not only manufacturing and service industries but also our daily lives. And that is a future from which investors should certainly profit. Irene Tunkel Chief Strategist, US Equity Strategy irene.tunkel@bcaresearch.com Appendix Table A1ETF Universe
The Robot Revolution
The Robot Revolution
Footnotes 1 Clive Cookson in London, "Ouch! Robotic hand with smart skin recoils when jabbed in the palm,” Financial Times, June 1, 2022, ft.com 2 Ron Jefferson, "Deep Learning Robot with Fine Motor Skills Peel Bananas Without Crushing the Fruit,” Science Times, March 29, 2022, sciencetimes.com 3 "Is Lidar Going to be Replaced by Machine Vision?” LiDAR News, January 12, 2022, blog.lidarnews.com 4 Jennifer Stowe, "Automation and IoT: Transforming How Industries Function,” IoT For All, October 12, 2020, iotforall.com Recommended Allocation Recommended Allocation: Addendum
The Robot Revolution
The Robot Revolution
Executive Summary Turbulence remains the signal feature of 2022 as worries about inflation and the Fed’s reaction to it continue to haunt investors and plague financial markets. Despite four-decade highs in measured inflation, long-run inflation expectations have held fast, keeping an inflation vicious circle from taking hold. As the diminishing threat from COVID helps unsnarl supply and transportation bottlenecks, it will also reduce the potential for expectations to become unmoored. The labor market has been sending encouraging signals for the economy and corporate profit margins. Although payrolls continue to expand at a robust pace and job openings remain near record highs, upward wage pressures appear to be losing momentum. Households have proven willing to spend their excess pandemic savings and maintain a sizable cushion to keep the economy growing near its long-run trend pace. All Is Not Yet Lost
All Is Not Yet Lost
All Is Not Yet Lost
Bottom Line: Markets remain volatile, subject to sharp swings upon any data points that portend a shift in the Fed’s tightening campaign. The August CPI report did not change our view that the consensus is underestimating the potential for positive earnings surprises in the next two quarters and we continue to recommend overweighting equities over the next three to six months. Feature Will the real inflation trend please stand up? Financial markets were emboldened by July’s CPI release, which reported a 0.1% month-over-month decline in inflation, 10 basis points below expectations, and demoralized by August’s edition, which reported a 0.1% month-over-month increase, 20 basis points above expectations. Core inflation, which backs out changes in volatile food and energy prices, came in at 0.6% in August after a 0.3% reading in July. In the harsh light of the August release, the July data point looked anomalous to the naked eye after holding between 0.6 and 0.7% in the three previous months. Related Report US Investment StrategyChartbook Equities swooned after the release, but policymakers and economic participants should focus on data trends rather than data points. Though we share in the general disappointment that inflation remains elevated, we continue to expect that headline CPI growth will abate to around 4% over the coming months. The supply of goods and services will increase as COVID’s threat continues to recede, while demand will slacken as the Fed and other major central banks continue to tighten monetary policy. The end of COVID restrictions will help to facilitate the ongoing shift in demand from goods to services. All in all, the underlying trend toward decelerating inflation will not be upended by noisy one-off data points. Stubbornly high inflation prints increase the risk that inflation expectations will become unmoored, feeding a self-reinforcing cycle in which high prices beget even higher prices, but there is no sign yet that they are poised to break out. Persistent inflation also increases the risk that the Fed will overdo the tightening and induce a deeper recession than would otherwise occur. We remain vigilant on both fronts, but believe markets are overestimating the probability of each risk. The charts that follow – tracking COVID’s course, inflation expectations, the labor market, household balance sheets and the outlook for S&P 500 earnings – show the data underpinning our stance. We will abandon our sanguine tactical view if consumers show signs of retrenching, which would torpedo our better-than-consensus growth outlook, or if inflation expectations show signs of becoming unmoored, which would force the Fed to move to throttle the economy immediately. Neither condition has yet been met, however, and we continue to believe that the consensus is underestimating the potential for upside earnings surprises. Chart 1Omicron Has Come And Gone ...
Omicron Has Come And Gone ...
Omicron Has Come And Gone ...
Chart 2... With Much Less Of An Impact Than Delta
... With Much Less Of An Impact Than Delta
... With Much Less Of An Impact Than Delta
Chart 3The Picture Looks Even Better Outside The US ...
The Picture Looks Even Better Outside The US ...
The Picture Looks Even Better Outside The US ...
Chart 4... Though Ancillary Counts May Not Be So Rigorously Maintained
... Though Ancillary Counts May Not Be So Rigorously Maintained
... Though Ancillary Counts May Not Be So Rigorously Maintained
Chart 5Watch This Space
Watch This Space
Watch This Space
Chart 6Consumers Are Still Not Chasing Big-Ticket Items
Consumers Are Still Not Chasing Big-Ticket Items
Consumers Are Still Not Chasing Big-Ticket Items
Chart 7Near-Term Expectations Are Way Down ...
Near-Term Expectations Are Way Down ...
Near-Term Expectations Are Way Down ...
Chart 8... And Long-Term Expectations Remain Contained
... And Long-Term Expectations Remain Contained
... And Long-Term Expectations Remain Contained
Chart 9Steady As She Goes
Steady As She Goes
Steady As She Goes
Chart 10We're All Doomed!
We're All Doomed!
We're All Doomed!
Chart 11Oh, Wait, Never Mind
Oh, Wait, Never Mind
Oh, Wait, Never Mind
Chart 12Initial Claims Are Nearly 20% Below Their Mid-July Peak ...
Initial Claims Are Nearly 20% Below Their Mid-July Peak ...
Initial Claims Are Nearly 20% Below Their Mid-July Peak ...
Chart 13... And Openings Have Come Only Slightly Off Of Theirs
... And Openings Have Come Only Slightly Off Of Theirs
... And Openings Have Come Only Slightly Off Of Theirs
Chart 14Ready, Willing And Able To Keep The Economy Going
Ready, Willing And Able To Keep The Economy Going
Ready, Willing And Able To Keep The Economy Going
Chart 15Down, But Not Out
Down, But Not Out
Down, But Not Out
Chart 16Margins Remain Elevated ...
Margins Remain Elevated ...
Margins Remain Elevated ...
Chart 17... And Profit Warnings Are Few And Far Between
... And Profit Warnings Are Few And Far Between
... And Profit Warnings Are Few And Far Between
Doug Peta, CFA Chief US Investment Strategist dougp@bcaresearch.com
In August, total US industrial production declined by 0.2% m/m following a 0.5% m/m increase in July. However, the manufacturing sector’s output surprised to the upside, rising for the second consecutive month against expectations it would contract. Notably,…