United States

Listen to a short summary of this report Executive Summary GIS Projection For The EUR/USD
It’s Time To Buy The Euro
It’s Time To Buy The Euro
We went long the euro early last week, as EUR/USD hit our buy limit price of $0.99. Despite a near cut-off of Russian gas imports, European gas inventories have reached 84% of capacity – above the 80% target that the EU set for November 1st. The latest meteorological forecasts suggest that Europe will experience a warmer-than-normal winter. This will cut heating usage, likely making gas rationing unnecessary. Currencies fare best in loose fiscal/tight monetary environments. This is what Europe faces over the coming months, as governments boost income support for households and businesses, while ramping up spending on energy infrastructure and defense. For its part, the ECB has started hiking rates. Since mid-August, interest rate differentials have moved in favor of the euro at both the short and long end. Rising inflation expectations make it less likely that the ECB will be able to back off from its tightening campaign as it did in past cycles. A hawkish Fed is the biggest risk to our bullish EUR/USD view. We expect US inflation to trend lower over the coming months, before reaccelerating in the second half of 2023. However, as the August CPI report highlights, the danger is that any dip in inflation proves to be shallower and shorter-lived than previously anticipated. Bottom Line: Although significant uncertainty remains, the risk-reward trade-off favors being long EUR/USD. Our end-2022 target is $1.06. Dear Client, I will be meeting clients in Asia next week while also working on our Fourth Quarter Strategy Outlook, which will be published at the end of the month. In lieu of our regular report next Friday, you will receive a Special Report from my colleague, Ritika Mankar, discussing the sources of US equity outperformance over the past 14 years and the likely path ahead. Best Regards, Peter Berezin, Chief Global Strategist It’s Just a Clown Chart 1Investors Are Bullish The Dollar, Not The Euro
Investors Are Bullish The Dollar, Not The Euro
Investors Are Bullish The Dollar, Not The Euro
The scariest part of a horror movie is usually the one before the monster is revealed. No matter how good the special effects, the human brain can always conjure up something more frightening than anything Hollywood can dream up. Investors have been conjuring up all sorts of cataclysmic scenarios for the upcoming European winter. In financial markets, the impact has been most visible in the value of the euro, which has tumbled to parity against the US dollar. Only 23% of investors are bullish the euro at present, down from a peak of 78% in January 2021 (Chart 1). Conversely, 75% of investors are bullish the US dollar. More than half of fund managers cited “long US dollar” as the most crowded trade in the latest BofA Global Fund Manager Survey (“long commodities” was a distant second at 10%). As we discuss below, the outlook for the euro may be a lot better than most investors realize. While my colleagues, Chester Ntonifor, BCA’s chief FX strategist, and Mathieu Savary, BCA’s chief European strategist, are not quite ready to buy the euro just yet, we all agree that EUR/USD will rise over the long haul. Cutting Putin Loose Natural gas accounts for about a quarter of Europe’s energy supply. Prior to the Ukraine war, about 40% of that gas came from Russia (Chart 2). With the closure of the NordStream 1 pipeline, that number has fallen to 9% (some Russian gas continues to enter Europe via Ukraine and the TurkStream supply route). Yet, despite the deep drop in Russian natural gas imports, European natural gas inventories are up to 84% of capacity – roughly in line with past years and above the EU’s November 1st target of 80% (Chart 3). Chart 2Despite A Sharp Drop In Imports Of Russian Natural Gas…
It’s Time To Buy The Euro
It’s Time To Buy The Euro
Chart 3...Europeans Managed To Stock Up On Natural Gas For The Winter Season
...Europeans Managed To Stock Up On Natural Gas For The Winter Season
...Europeans Managed To Stock Up On Natural Gas For The Winter Season
Europe has been able to achieve this feat by aggressively buying natural gas on the open market. While this has caused gas prices to soar, it sets the stage for a retreat in prices in the months ahead. European spot natural gas prices have already fallen from over €300/Mwh in late August to €214/Mwh, and the futures market is discounting a further decline in prices over the next two years (Chart 4). Chart 4The Futures Market Is Discounting A Further Decline In Natural Gas Prices
It’s Time To Buy The Euro
It’s Time To Buy The Euro
Chart 5Futures Prices Of Energy Commodities Provide Some Limited Information On Where Spot Prices Are Heading
It’s Time To Buy The Euro
It’s Time To Buy The Euro
Follow the Futures? Futures prices are not a foolproof guide to where spot prices are heading. As Chart 5 illustrates, the correlation between the slope of the futures curve and subsequent changes in spot prices in energy markets is quite low. Nevertheless, future spot returns do tend to be negative when the curve is backwardated, as it is now, especially when assessed over horizons of around 12-to-18 months (Table 1). Table 1Energy Commodity Spot Price Returns Tend To Be Negative When The Futures Curve Is Backwardated
It’s Time To Buy The Euro
It’s Time To Buy The Euro
Our guess is that European natural gas prices will indeed fall further from current levels. The latest meteorological forecasts suggest that Europe will experience a milder-than-normal winter (Chart 6). This is critical considering that natural gas accounts for over 40% of EU residential heating use once electricity and heat generated in gas-fired plants are included (Chart 7). Chart 6Meteorological Models Suggest Above-Normal Temperatures In Europe This Winter
It’s Time To Buy The Euro
It’s Time To Buy The Euro
Chart 7Natural Gas Is An Important Source Of Energy For Heating Homes In The EU
It’s Time To Buy The Euro
It’s Time To Buy The Euro
A warm winter would bolster the euro area’s trade balance, which has fallen into deficit this year as the energy import bill has soared (Chart 8). An improving balance of payments would help the euro. Europe is moving quickly to secure new sources of energy supply. In less than one year, Europe has become America’s biggest overseas market for LNG (Chart 9). A new gas pipeline linking Spain with the rest of Europe should be operational by next spring. Chart 8Soaring Energy Costs Have Pushed The Euro Area Trade Balance Into Deficit
Soaring Energy Costs Have Pushed The Euro Area Trade Balance Into Deficit
Soaring Energy Costs Have Pushed The Euro Area Trade Balance Into Deficit
Chart 9Europe Is America's Largest LNG Customer
It’s Time To Buy The Euro
It’s Time To Buy The Euro
In the meantime, Germany is building two “floating” LNG terminals. It has also postponed plans to mothball its nuclear power plants and has restarted its coal-fired power plants, a decision that even the German Green Party has supported. France is aiming to boost nuclear capacity, which had fallen below 50% earlier this summer. Électricité de France has pledged to nearly double daily production by December. For its part, the Dutch government has indicated it will raise output from the massive Groningen natural gas field if the energy crisis intensifies. Fiscal Policy to the Rescue On the policy front, European governments are taking steps to buttress household balance sheets during the energy crisis, with nearly €400 billion in support measures announced so far (and surely more to come). Although these support measures will be offset with roughly €140 billion of windfall profit taxes on the energy sector, the net effect will be to raise budget deficits across the region. However, following the old adage that one should “finance temporary shocks but adjust to permanent ones,” a temporary spike in fiscal support may be just what the doctor ordered. The last thing Europe needs is a situation where energy prices fall next year, but the region remains mired in recession as households seek to rebuild their savings. Such an outcome would depress tax revenues, likely leading to higher government debt-to-GDP ratios. Get Ready For a V-Shaped Recovery Stronger growth in the rest of the world should give the euro area a helping hand. That would be good news for the euro, given its cyclical characteristics (Chart 10). The European economy is especially leveraged to Chinese growth. It is likely that the authorities will loosen the zero-Covid policy once the Twentieth Party Congress concludes next month, and new anti-viral drugs and possibly an Omicron-specific booster shot become widely available later this year. That should help jumpstart China’s economy. More stimulus will also help. Chart 11 shows that EUR/USD is highly correlated with the Chinese credit/fiscal impulse. Chart 10The Euro Is A Cyclical Currency
The Euro Is A Cyclical Currency
The Euro Is A Cyclical Currency
Chart 11EUR/USD Is Highly Correlated With The Chinese Credit & Fiscal Impulse
EUR/USD Is Highly Correlated With The Chinese Credit & Fiscal Impulse
EUR/USD Is Highly Correlated With The Chinese Credit & Fiscal Impulse
All this suggests that the prevailing view on European growth is too pessimistic. Even if Europe does succumb to a technical recession in the months ahead, it is likely to experience a V-shaped recovery. That will provide a nice tailwind for the euro. Loose Fiscal/Tight Monetary Policies: The Winning Combo for Currencies Chart 12Fiscal Policy Has Eased Structurally In The Euro Area More Than In Other Advanced Economies
It’s Time To Buy The Euro
It’s Time To Buy The Euro
A tight monetary and loose fiscal policy has historically been the most bullish combination for currencies. Recall that the US dollar soared in the early 1980s on the back of Paul Volcker’s restrictive monetary policy and Ronald Reagan’s expansionary fiscal policy, the latter consisting of huge tax cuts and increased military spending. While not nearly on the same scale, the euro area’s current configuration of loose fiscal/tight monetary policies bears some resemblance to the US in the early 1980s. Even before the war in Ukraine began, the IMF was forecasting a much bigger swing towards expansionary fiscal policy in the euro area than in the rest of the world (Chart 12). The war has only intensified this trend, triggering a flurry of spending on energy and defense – spending that is likely to persist for most of this decade. The ECB’s Reaction Function After biding its time, the ECB has joined the growing list of central banks that are hiking rates. On September 8th, the ECB jacked up the deposit rate by 75 bps. Investors expect a further 185 bps in hikes through to September 2023. While US rate expectations have widened relative to euro area expectations since the August US CPI report (more on that later), the gap is still narrower than it was on August 15th. Back then, investors expected euro area 3-month rates to be 233 bps below comparable US rates in June 2023. Today, they expect the gap to be only 177 bps (Chart 13). Real long-term bond spreads, which conceptually at least should be the more important driver of currency movements, have also moved in the euro’s favor. In the past, ECB rate hikes were swiftly followed by cuts as the region was unable to tolerate even moderately higher rates. While this very well could happen again, the odds are lower than they once were, at least over the next 12 months. Chart 13Interest Rate Differentials Have Moved In Favor Of The Euro Since Mid-August
Interest Rate Differentials Have Moved In Favor Of The Euro Since Mid-August
Interest Rate Differentials Have Moved In Favor Of The Euro Since Mid-August
Chart 14Euro Area: Inflation Expectations Have Risen Briskly
Euro Area: Inflation Expectations Have Risen Briskly
Euro Area: Inflation Expectations Have Risen Briskly
For one thing, median inflation expectations three years ahead in the ECB’s monthly survey have risen briskly (Chart 14). The Bundesbank’s own survey paints an even more alarming picture, with median expected inflation over the next five years having risen to 5% from 3% in mid-2021 (Chart 15). Expected German inflation over the next ten years stands at a still-elevated 4%. Whether this reflects Germans’ heightened historical sensitivity to inflation risks is unclear, but it is something the ECB cannot ignore. Structurally looser fiscal policy has raised the neutral rate of interest in the euro area, giving the ECB more leeway to lift rates. A narrowing in competitiveness gaps across the currency bloc has also mitigated the need for the ECB to set rates based on the needs of the weakest economies in the region. Chart 16 shows that collectively, unit labor costs among the countries most afflicted by the sovereign debt crisis a decade ago have completely converged with Germany. Chart 15German Inflation Expectations Are Elevated
German Inflation Expectations Are Elevated
German Inflation Expectations Are Elevated
Chart 16Europe's Periphery Has Closed The Competitiveness Gap With Germany
Europe's Periphery Has Closed The Competitiveness Gap With Germany
Europe's Periphery Has Closed The Competitiveness Gap With Germany
While Italy is still a laggard in the competitiveness rankings, the ECB’s new Transmission Protection Instrument (TPI) – which allows the central bank to buy sovereign debt with less stringent conditionality than under the Outright Monetary Transactions (OMT) program – should keep a lid on sovereign spreads. This, in turn, will allow the ECB to raise rates more than it otherwise could. Hawkish Fed is the Biggest Risk to Our Bullish EUR/USD View Chart 17Supplier Delivery Times Have Fallen Sharply
Supplier Delivery Times Have Fallen Sharply
Supplier Delivery Times Have Fallen Sharply
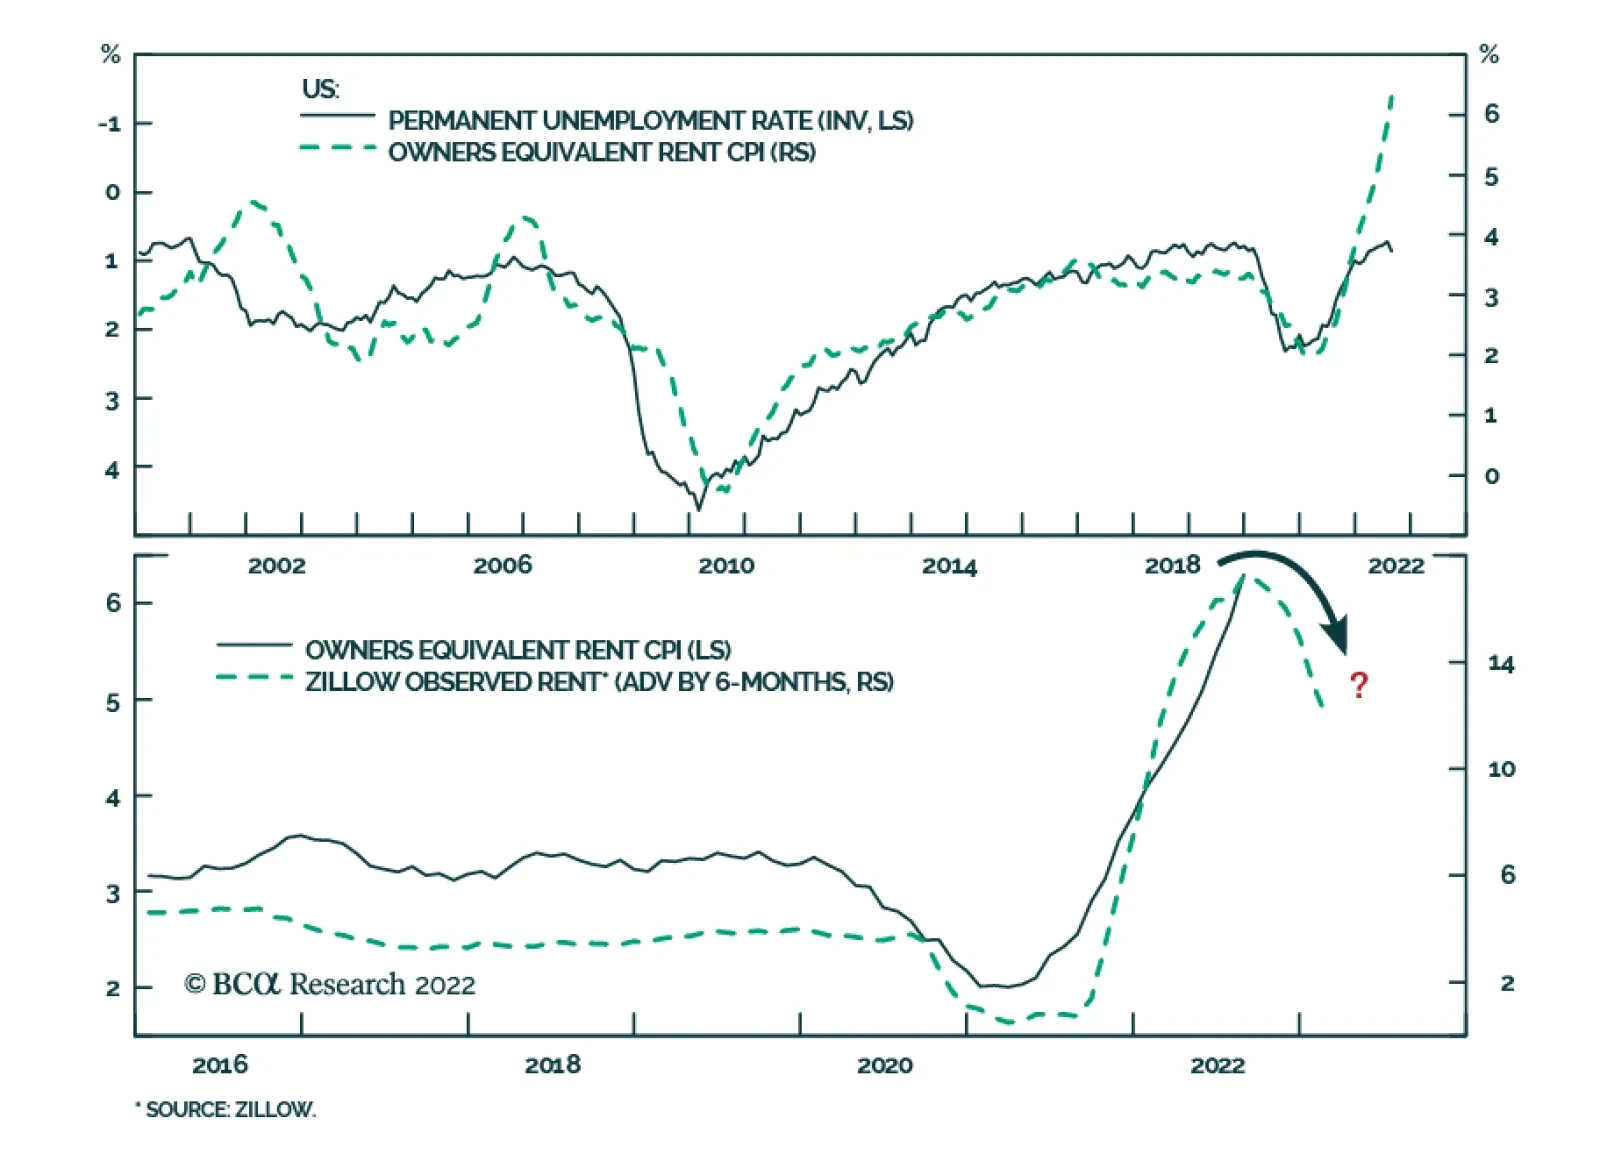
Tuesday’s hotter-than-expected August US CPI report pulled the rug from under the euro’s incipient rally, pushing EUR/USD back to parity. We have been flagging the risks of high inflation for several years (see, for example, our February 19, 2021 report, 1970s-Style Inflation: Yes, It Could Happen Again). Our thesis is that inflation will follow a “two steps up, one step down” pattern. We are probably near the top of those two steps now, with the next leg for inflation likely to be to the downside, driven by ebbing pandemic-related supply side-dislocations. Perhaps most notably, supplier delivery times have fallen sharply in recent months (Chart 17). These pandemic-related dislocations extend to the housing rental market. Rent inflation dropped after rent moratoriums were put in place, only to rebound forcefully once the moratoriums were lifted and the labor market tightened. Although official measures of rent inflation will remain elevated for some time, owing to lags in how they are constructed, timelier data on new rental units coming to market already point to a sharp decline in rent inflation (Chart 18). This is something that the Fed is sure to notice. Ironically, falling inflation could sow the seeds of its own demise. Nominal wage growth is currently very elevated, yet because of high inflation, real wages are still shrinking. As inflation comes down, real wage growth will turn positive. This will lift consumer sentiment, helping to buoy consumption (Chart 19). A pickup in consumer spending will cause the economy to overheat again, leading to a second wave of inflation in the back half of 2023. Chart 18Timelier Measures Of Rent Inflation Have Rolled Over
Timelier Measures Of Rent Inflation Have Rolled Over
Timelier Measures Of Rent Inflation Have Rolled Over
Chart 19Falling Inflation Will Boost Real Wages And Consumer Confidence
Falling Inflation Will Boost Real Wages And Consumer Confidence
Falling Inflation Will Boost Real Wages And Consumer Confidence
As we discussed in our August 18th Special Report Dispatches From The Future: From Goldilocks To President DeSantis, the Fed will respond to this second inflationary wave by hiking the Fed funds rate to 5%. This will temporarily push up the value of the dollar, a process that will only stop once the US falls into recession in 2024 and the Fed is forced to cut rates again. Our projected rollercoaster ride for EUR/USD is depicted in Chart 20. We see the euro rising to $1.06 by year-end, peaking at $1.11 in the spring of 2023, falling back to $1.05 by late 2023, and then beginning a prolonged rally in 2024. Chart 20GIS Projection For The EUR/USD
It’s Time To Buy The Euro
It’s Time To Buy The Euro
Chart 21The Dollar Is Very Overvalued Against The Euro Based On PPP
The Dollar Is Very Overvalued Against The Euro Based On PPP
The Dollar Is Very Overvalued Against The Euro Based On PPP
Chart 21 shows that the dollar is 30% overvalued against the euro based on its Purchasing Power Parity (PPP) exchange rate. Thus, there is significant long-term upside to EUR/USD. Implications for Other Currencies and Regional Equity Allocation Chart 22Stock Markets Outside The US Tend To Fare Best When The Dollar Is Weakening
Stock Markets Outside The US Tend To Fare Best When The Dollar Is Weakening
Stock Markets Outside The US Tend To Fare Best When The Dollar Is Weakening
The strengthening in the euro that we envision over the next six months or so will be part of a broad-based dollar decline. While BCA’s Foreign Exchange Strategy service sees more upside for the euro than the pound, GBP/USD will likely follow the same trajectory as EUR/USD. The yen is one of the cheapest currencies in the world and should finally gain some traction. If China abandons its zero-Covid policy and increases fiscal support for its economy, the RMB and other EM currencies should strengthen. Stock markets outside the US tend to fare best when the dollar is weakening. This includes Europe. As Chart 22 illustrates, there is a close correlation between EUR/USD and the relative performance of European versus US stocks. Thus, an above-benchmark exposure to international markets is appropriate during the coming months. Peter Berezin Chief Global Strategist peterb@bcaresearch.com Follow me on LinkedIn & Twitter Global Investment Strategy View Matrix
It’s Time To Buy The Euro
It’s Time To Buy The Euro
Special Trade Recommendations Current MacroQuant Model Scores
It’s Time To Buy The Euro
It’s Time To Buy The Euro
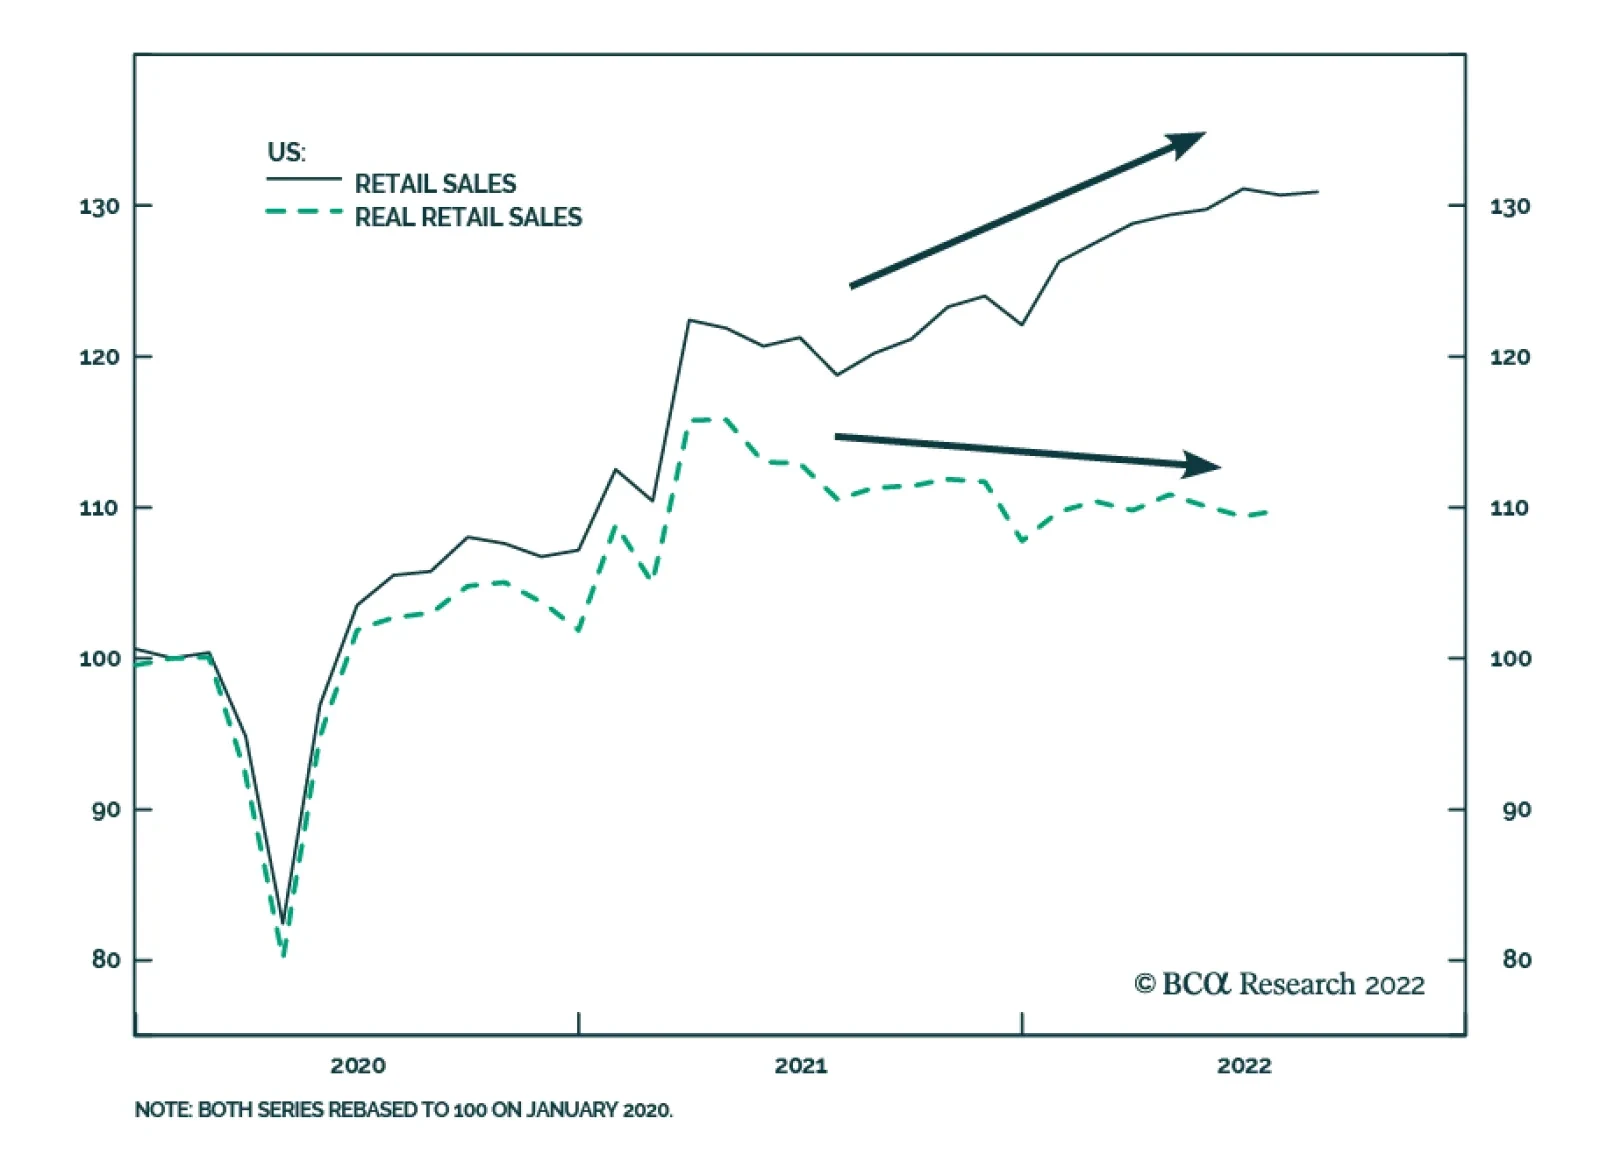
Preliminary estimates suggest that US retail sales increased by 0.3% m/m in August, from a downwardly revised 0.4% m/m contraction in July, beating expectations of a 0.1% m/m decline. Motor vehicles and parts drove the bulk of the increase (ex-auto, retail…
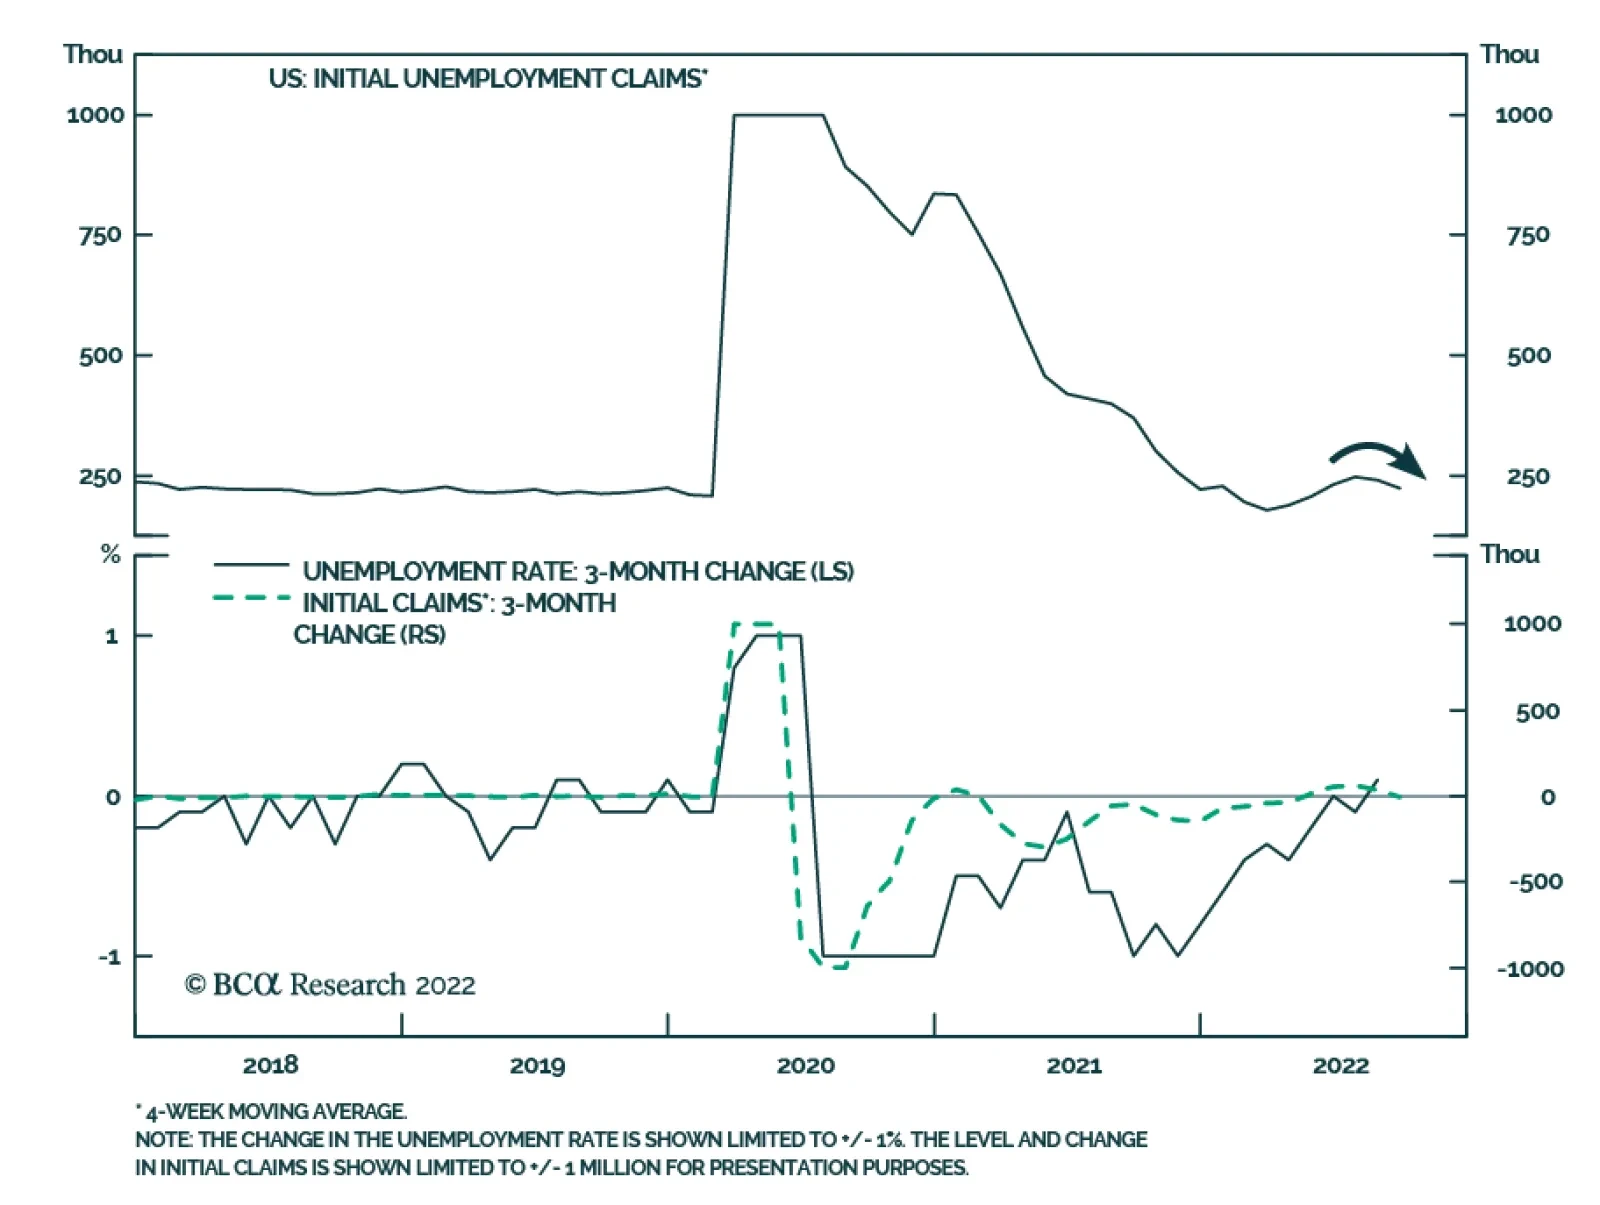
Recent employment data suggest that the US labor market remains extremely robust. Initial jobless claims in the week ended September 10 unexpectedly fell to the lowest level since late-May, marking the fifth consecutive weekly decline. Other employment…
We have highlighted that while the unwinding of supply-side dislocations will carve an easy path for inflation to moderate to an underlying 4%-5% range, bringing it further down towards the Fed’s 2% target is a more difficult task requiring the unraveling of…
Executive Summary Global Manufacturing / Trade Will Contract
Global Manufacturing / Trade Will Contract
Global Manufacturing / Trade Will Contract
The bar for the Fed to stop hiking rates is still very high. US inflation remains broad based. Core inflation is neither about oil and food prices nor is it about the prices of other individual items. The key variables that will determine inflation’s persistence are wages and unit labor costs. US wage growth is very elevated, and unit labor costs are soaring. Unless the US economy experiences a recession, core inflation will not drop below 3.5%. The Fed and the US stock market (and by extension global risk assets) remain on a collision course. The Fed will not make a dovish pivot until the stock market sell off, and equities cannot rally unless the Fed backs off. The imminent global trade contraction is bad news for EM stocks and currencies as well as global cyclicals. Bottom Line: A hawkish Fed amid a global trade/manufacturing recession is producing a bearish cocktail for global risk assets in general and EM risk assets in particular. Feature The majority of investors and strategists have been expecting an easing of US inflation to allow the Federal Reserve to completely halt or considerably slow the pace of its hiking cycle. For example, the Bank of America Global Fund Managers survey from September (taken before the release of the latest US CPI report) revealed that a net 79% of participants see lower inflation in the next 12 months. We at BCA’s Emerging Markets Strategy team have taken a different view. Even though we have been open to the idea that the annual rate of inflation (especially the headline measure) will drop in the months to come, we have been arguing that US core inflation will remain well above the 3.5-4% range for some time. What matters for the Fed’s policy is the level of core inflation, not just a decline in the inflation rate. With core inflation considerably above the Fed’s 2% target, we have maintained that the FOMC will uphold its hawkish bias. Consequently, global risk assets will continue selling off and the US dollar will overshoot. Analyzing the price dynamics of individual items − such as energy, food, shelter or cars – when assessing the outlook for inflation is akin to missing the forest for the trees. Chart 1US Core-Type Inflation Measures Are Very High
US Core-Type Inflation Measures Are Very High
US Core-Type Inflation Measures Are Very High
When inflation is limited to several individual components of the consumption basket, neither central banks nor financial markets should react. This is true both when the prices of these individual components are rising (inflation) and when they are falling (deflation). However, central banks and, hence, financial markets, should respond to broad-based inflation. Therefore, investors need to look at the forest rather than focus on individual trees. In our February 18, 2022 report, we wrote the following: “US inflation has become broad based. Not only is core CPI surging but also trimmed-mean, median and sticky core consumer price inflation has risen substantially. Median and trimmed-mean price indexes would not be rocketing if inflation was limited to select goods or services. Particularly, the aforementioned measures exclude components with extreme price changes. What might have started as a narrow-based relative price shock has evolved into broad-based genuine inflation. The key to the transition from one-off inflation spikes to persistent genuine inflation is wages, more specifically unit labor costs. Unit labor costs are calculated as nominal wages divided by productivity (the latter is output per hour per employee).” All of these points remain valid today. Chart 1 shows that core, median, trimmed-mean and sticky CPI are all rising at very fast annual rates, ranging from 6% to 7.2%. Hence, underlying inflationary pressures remain broad based and persistent in the US economy. As a result, the bar for the Fed to stop hiking rates is very high. Last week, FOMC member Christopher Waller stated that he would need to see month-on-month core inflation prints of around 0.2% for a period of five to six months before he is comfortable with backing off on rate hikes. In the past three months, the monthly rates of various measures of underlying core inflation have ranged between 0.5-0.65%. Even though oil and food prices have relapsed and freight rates have plunged, US core inflation has still surprised to the upside. The point being is that core inflation is neither about oil and food prices nor is it about the prices of other individual items. We have been arguing for some time that the key variables to watch to determine whether inflation will be persistent are wages and unit labor costs. US wage growth is elevated, and unit labor costs are soaring (Chart 2). Finally, companies have raised prices at an annual rate of 8-9% (Chart 3). Chart 2US Labor Costs Have Been Surging
US Labor Costs Have Been Surging
US Labor Costs Have Been Surging
Chart 3US Companies Have Raised Prices At An 8-9% Annual Rate
US Companies Have Raised Prices At An 8-9% Annual Rate
US Companies Have Raised Prices At An 8-9% Annual Rate
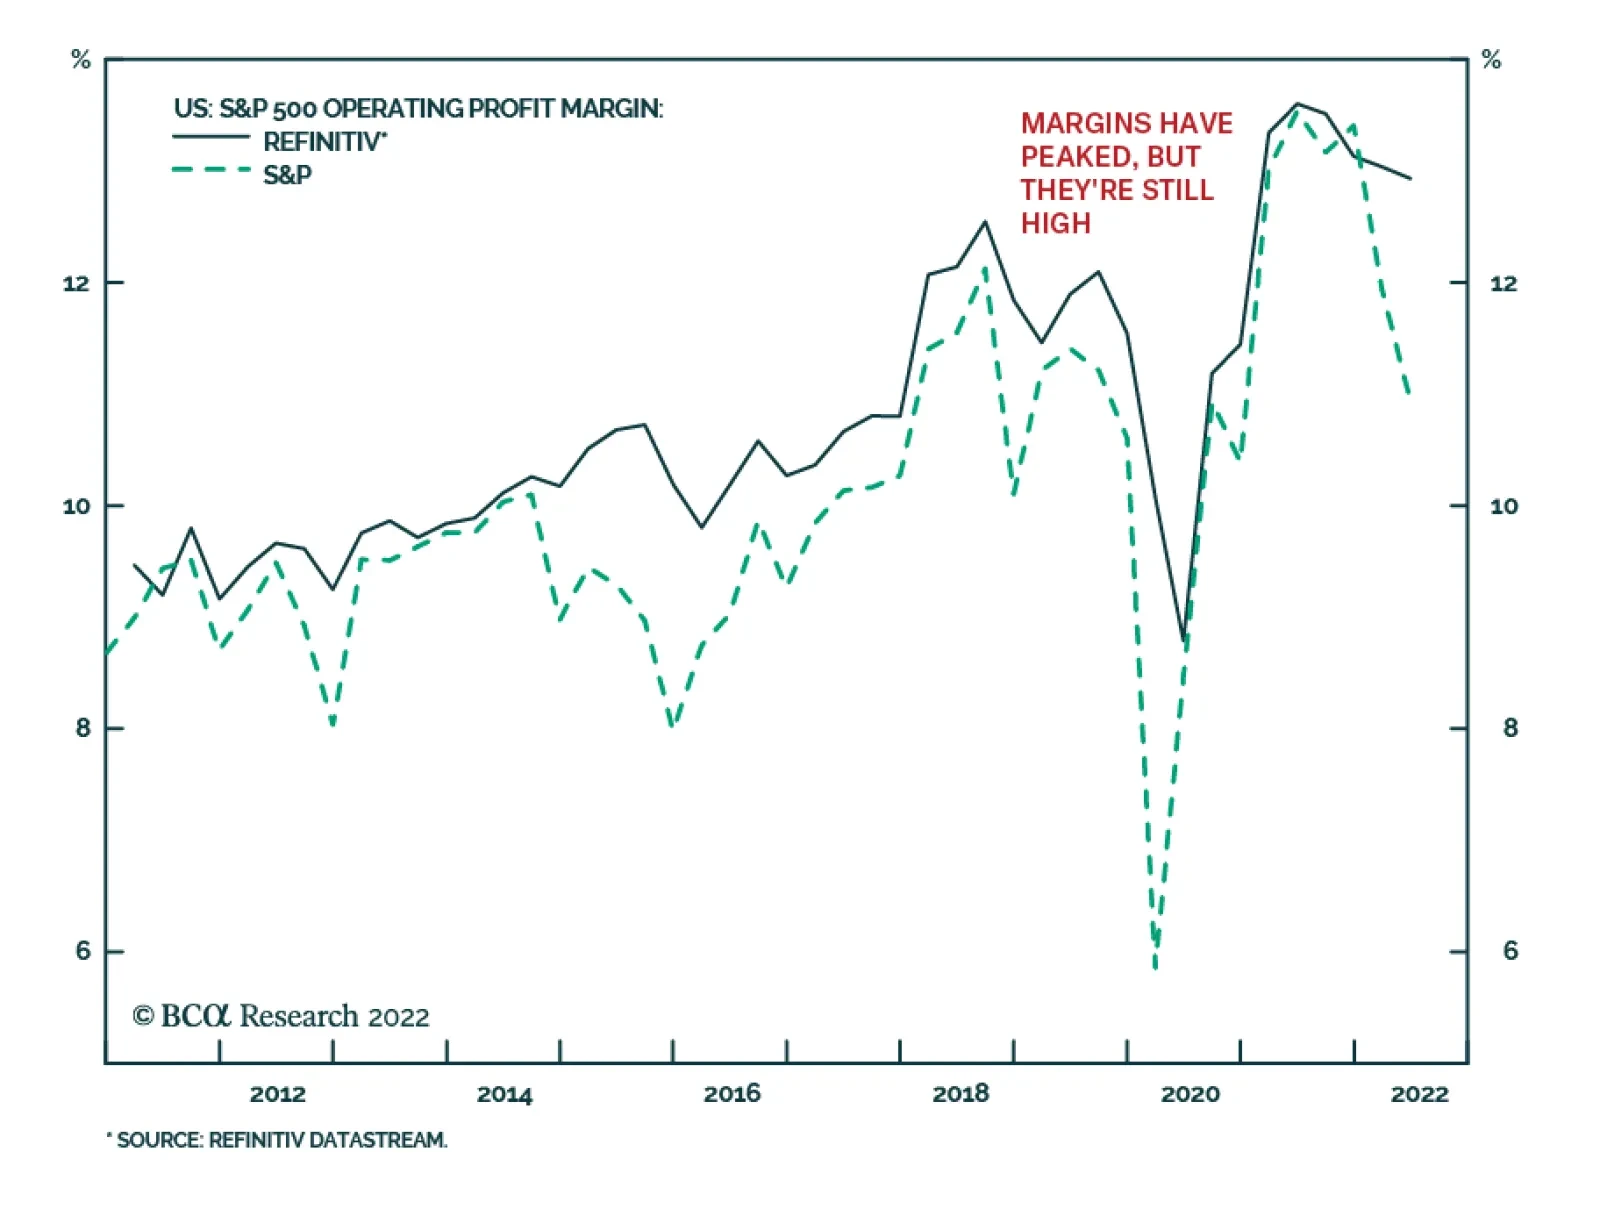
US Stagflation Or Recession? Is the US economy heading into stagflation or recession? How persistent will US inflation prove to be? Over the next several months, US core inflation will prove to be sticky. So, stagflation (weak real growth and high inflation) is the likely outcome over the near term. Beyond this period, say on a 12-month horizon, the US economic outlook is less clear. Chart 4US Corporate Profit Margins Have Peaked
US Corporate Profit Margins Have Peaked
US Corporate Profit Margins Have Peaked
One thing we are certain of is that faced with surging unit labor costs, US companies will attempt to raise their prices to protect their profit margins and profitability. Our proxy for US corporate profit margins signals that margins are already rolling over (Chart 4). Hence, business owners and CEOs will attempt to raise selling prices further. This will lead to one of two possible scenarios for the US economy in the months ahead. Scenario 1: If customers (households and businesses) are willing to pay considerably higher prices, nominal sales will remain very robust, and profits will not collapse, reducing the likelihood of a recession. Yet, this means that inflation will become even more entrenched, and employees will continue to demand higher wages. A wage-price spiral could unravel. The Fed will have to raise rates by much more than what is currently priced in financial markets. This is negative for US share prices. Scenario 2: If customers push back against higher prices and respond by curtailing their purchases, then sales and output volume will relapse, i.e., the economy will enter a recession. In this scenario, inflation will plummet, corporate margins will shrink (prices received will rise much less than unit labor costs) and profits will plunge. Suffering a profit squeeze, companies will lay off employees, and wage growth will decelerate sharply. Although bond yields will drop significantly, the benefit to equities will be offset by plunging corporate profits. We are not certain which of these two scenarios will prevail: it is hard to determine the point at which US consumers will push back against rising prices. Nevertheless, it is notable that in both scenarios, the outlook for stocks is poor. Bottom Line: Inflation is an inert and persistent phenomenon. The inflation genie has escaped from the bottle. When this happens, it is hard to put the genie back. In short, unless the US economy experiences a recession, core inflation will not drop below 3.5%. Still On A Collision Course On February 18 of this year, we published a piece titled A Collision In The Fog Of Inflation?, arguing that the Fed and the US equity market are on a collision course amidst the fog of inflation. Specifically, we noted that “the Fed will not make a dovish pivot until markets sell off, and markets cannot rally unless the Fed backs off.” This reasoning still applies. Barring a major US growth slump, US core inflation will not drop below 3.5%. Hence, the only way for the Fed to bring core inflation toward its 2% target is to tighten policy further. Financial conditions play a critical role in shaping the trajectory of the US economy. US domestic demand might not weaken sufficiently and, hence, US core inflation will not subside below 3.5% unless financial conditions tighten further (Chart 5). That is why a scenario in which US stocks and bonds rally despite the Fed’s continuous tightening is currently unlikely. Presently, there seems to be a dichotomy between the signal from the US yield curve and share prices. Despite the extremely inverted yield curve, US share prices have not yet fallen to new lows (Chart 6). Chart 5US Financial Conditions Have Room To Tighten Further
US Financial Conditions Have Room To Tighten Further
US Financial Conditions Have Room To Tighten Further
Chart 6The US Yield Curve Is In An Equity Danger Zone
The US Yield Curve Is In An Equity Danger Zone
The US Yield Curve Is In An Equity Danger Zone
Chart 7A Negative Bond Term Premium Amid High Volatility Is Paradoxical
A Negative Bond Term Premium Amid High Volatility Is Paradoxical
A Negative Bond Term Premium Amid High Volatility Is Paradoxical
If US share prices do not break below their June lows, US interest rate expectations will rise further. The basis is that the Fed will not cut rates next year unless the economy is in recession and equities are selling off. In addition, there is a paradox in US long-term bonds. Despite exceptional inflation volatility, the Fed’s QT (reducing its bond holdings) and heightened US bond volatility, the US Treasurys’ term premium − the risk premium on bonds − is close to zero (Chart 7). That is why we expect the US bond market’s selloff to persist with 30-year yields pushing toward 4%. Consequently, US share prices will likely break below the major technical support that held up in the past 12 years (Chart 8). If the S&P 500 breaks below its June low, the next technical support is around 3200. Meanwhile, the US dollar will continue overshooting, as we argued in our recent report. Chart 8The S&P 500: Between Support And Resistance Lines
The S&P 500: Between Support And Resistance Lines
The S&P 500: Between Support And Resistance Lines
Chart 9The EM Equity Index Is Still Above Its Long-Term Technical Support
The EM Equity Index Is Still Above Its Long-Term Technical Support
The EM Equity Index Is Still Above Its Long-Term Technical Support
As for EM share prices, they will likely drop another 13-15% to reach their long-term technical support, as illustrated in Chart 9. Bottom Line: The Fed and the US stock market, and by extension global risk assets, remain on a collision course. A Global Manufacturing Recession Is Looming The latest data have corroborated our theme that global manufacturing and trade are heading into recession: Korean and Taiwanese manufacturing PMI new export orders have plunged well below the important 50 lines (Chart 10). Chinese imports for re-export are already contracting. They lead Chinese exports by three months (Chart 11). Chart 10Global Manufacturing / Trade Will Contract
Global Manufacturing / Trade Will Contract
Global Manufacturing / Trade Will Contract
Chart 11Chinese Exports Are About To Shrink
Chinese Exports Are About To Shrink
Chinese Exports Are About To Shrink
Chart 12Emerging Asian Currencies And Global Cyclicals-To-Defensives Stock Performance
Emerging Asian Currencies And Global Cyclicals-To-Defensives Stock Performance
Emerging Asian Currencies And Global Cyclicals-To-Defensives Stock Performance
Chinese import volumes will continue shrinking, and EM ex-China domestic demand will relapse following the ongoing monetary tightening by their central banks. Finally, Emerging Asian currencies have been plunging, and such rapid and large-scale depreciation is a precursor to a global trade/manufacturing recession (Chart 12). Bottom Line: The imminent global trade contraction is bad for EM stocks and currencies as well as global cyclicals. Investment Strategy A hawkish Fed amid a global trade/manufacturing recession is producing a bearish cocktail for EM currencies and risk assets. Absolute-return investors should stay put on EM risk assets. Continue underweighting EM in global equity and credit portfolios. Emerging Asian currencies have more downside given the budding contraction in their exports and the interest rate differential moving further in favor of the US dollar. Commodity prices and commodity currencies remain at risk from the global manufacturing recession and the absence of a revival in Chinese demand. Overall, the US dollar will overshoot in the near term. We continue to short the following currencies versus the USD: ZAR, COP, PEN, PLN and IDR. In addition, we continue to recommend shorting HUF vs. CZK, KRW vs. JPY, and BRL vs. MXN. EM currency depreciation will cause EM credit spreads to widen. Odds are that EM sovereign and corporate bond yields will rise, which is a bearish signal for EM non-TMT stocks, as illustrated in Chart 13. Chart 13EM USD Bond Yields Are Instrumental For EM Share Prices
EM USD Bond Yields Are Instrumental For EM Share Prices
EM USD Bond Yields Are Instrumental For EM Share Prices
Chart 14Beware Of A Breakdown in EM Tech Stocks
Beware Of A Breakdown in EM Tech Stocks
Beware Of A Breakdown in EM Tech Stocks
EM technology stocks are also breaking down. The share prices of TSMC, Samsung and Tencent have all fallen below their long-term technical supports (Chart 14). This negative technical profile coupled with our fundamental assessment point to a further slide in these share prices. Arthur Budaghyan Chief Emerging Markets Strategist arthurb@bcaresearch.com Strategic Themes (18 Months And Beyond) Equities Cyclical Recommendations (6-18 Months) Cyclical Recommendations (6-18 Months)
In lieu of next week’s report, I will host the monthly Counterpoint Webcast on Thursday, September 22 (9:00 AM EDT, 2:00 PM BST). In this Webcast, I will discuss the near-term and longer-term prospects for all the major asset classes: stocks, bonds, sectors, commodities, currencies, and real estate. Please mark the date in your calendar, and I do hope you can join. Executive Summary Analysing the economy as the ‘non-linear system’ that it is leads to profound conclusions about how the economy and inflation are likely to unfold, and reveals that some outcomes are impossible to achieve. It is impossible to lift the unemployment rate by ‘just’ 1-2 percent. Therefore, it is impossible to depress wage inflation by ‘just’ 1 percent. The non-linear choice is to not depress wage inflation at all, or to make wage inflation slump. Presented with this non-linear choice, central banks will likely choose to make wage inflation slump, which will take core inflation well south of the 2 percent target within the next couple of years. The structural low in bond yields, the structural low in commodity prices, the structural high in stock market valuations, and the structural high in the US dollar are yet to come. It Is Impossible To Lift The Unemployment Rate By ‘Just’ 1-2 Percent
It Is Impossible To Lift The Unemployment Rate By 'Just' 1-2 Percent
It Is Impossible To Lift The Unemployment Rate By 'Just' 1-2 Percent
Bottom Line: Inflation will slump to well below 2 percent within the next couple of years. Feature Our non-linear world often surprises our linear minds. If we discover that a small cause produces a small effect, we think that double the cause produces double the effect, and that triple the cause produces triple the effect. But in our non-linear world, double the cause could produce no effect, or half the effect, or ten times the effect. Just as important, in a non-linear world, some outcomes turn out to be impossible. In a non-linear system, some outcomes are impossible to achieve. As I will now discuss, analysing the economy as the non-linear system that it is leads to profound conclusions about how the economy and inflation are likely to unfold, and reveals that some outcomes are impossible to achieve. In A Non-Linear System, Some Outcomes Are Impossible A good physical example of a non-linear system that we can apply to inflation is to attach an elastic band to the front of a brick. And then to try pulling the brick across a table at a constant speed, say 2 mph. It’s impossible! First, nothing happens. The brick is held in place by friction. Then, at a tipping point of pulling, it starts to accelerate. Simultaneously, the friction decreases, self-reinforcing the acceleration to well above 2 mph. Meanwhile, your response – to stop pulling – happens with a lag. The result is that, the brick refuses to budge, and then it hits you in the face. Try as you might, it is impossible to pull the brick at a constant 2 mph (Figure 1 and Figure 2). Figure 1The Forces On A Brick Pulled By An Elastic Band
Inflation’s ‘Non-Linearity’ Makes It Uncontrollable
Inflation’s ‘Non-Linearity’ Makes It Uncontrollable
Figure 2The Net Forces On A Brick Pulled By An Elastic Band
Inflation’s ‘Non-Linearity’ Makes It Uncontrollable
Inflation’s ‘Non-Linearity’ Makes It Uncontrollable
In mathematical terms, the reduction in friction as the brick starts to move is known as ‘self-reinforcing feedback’. The lag in applying the brakes is called ‘delayed corrective feedback’. Their combined effect is to make it impossible to pull the brick at a constant 2 mph. Now, to model inflation, attach an elastic band to both the front and the back of the brick, and find a friend. Your task, ‘policy loosening’, is to accelerate the stationary brick to a steady 2 mph. The analogy being to run inflation at 2 percent. On the opposite side, your friend’s task, call it ‘policy tightening’, is what central banks are desperate to do now – to rein back an out-of-control brick heading towards your face at 10 mph. But without slowing it to a standstill, or worse, reversing direction. The analogy being to avoid outright deflation. You will discover that you can move the brick sharply forwards (and sharply backwards), but you cannot move it forwards at a steady 2 mph! The brick-on-an-elastic-band analogy explains why it is impossible for policymakers to run inflation at a constant 2 percent. Inflation either careers out of control, as now, or stays stuck below 2 percent, as it did through the 2010s. Inflation cannot run ‘close to 2 percent’. It Is Impossible To Lift The Unemployment Rate By ‘Just’ 1-2 Percent Central to the non-linearity of inflation is the non-linearity of the jobs market, in which some outcomes are impossible. Specifically, it has proved impossible to lift the unemployment rate by ‘just’ 1-2 percent. It has proved impossible to lift the unemployment rate by ‘just’ 1-2 percent. Through the past 75 years, whenever the US unemployment rate has increased by 0.6 percent, it has then gone on to increase by at least 2.1 percent from the trough. In no case has the unemployment rate risen by ‘just’ 0.6-2.1 percent. In other words, the unemployment rate nudges up by 0.5 percent or less, or it surges by 2.1 percent or more. There is no middle ground. Indeed, through more recent history the surge has been 2.5 percent or more (Chart I-1 and Chart I-2). Chart I-1It Is Impossible To Lift The Unemployment Rate By 'Just' 1-2 Percent
It Is Impossible To Lift The Unemployment Rate By 'Just' 1-2 Percent
It Is Impossible To Lift The Unemployment Rate By 'Just' 1-2 Percent
Chart I-2It Is Impossible To Lift The Unemployment Rate By 'Just' 1-2 Percent
It Is Impossible To Lift The Unemployment Rate By 'Just' 1-2 Percent
It Is Impossible To Lift The Unemployment Rate By 'Just' 1-2 Percent
As with the brick-on-an-elastic-band, we can explain this non-linearity through the concepts of self-reinforcing feedback combined with delayed negative feedback. At a tipping point of rising unemployment, consumers pull in their horns and slow their spending, while banks slow their lending. This constitutes the self-reinforcing feedback which accelerates the downturn. Meanwhile, as it takes time for this downturn to appear in the data, policymakers respond with a lag, and when their response eventually comes, it also acts with a lag. This constitutes the delayed negative feedback, by which time the unemployment rate has surged, with every 1 percent rise in the unemployment rate depressing wage inflation by 0.5 percent (Chart I-3 and Chart I-4). Chart I-32001-02: Every 1 Percent Rise In The Unemployment Rate Depressed Wage Inflation By 0.5 Percent
2001-02: Every 1 Percent Rise In The Unemployment Rate Depressed Wage Inflation By 0.5 Percent
2001-02: Every 1 Percent Rise In The Unemployment Rate Depressed Wage Inflation By 0.5 Percent
Chart I-42008-09: Every 1 Percent Rise In The Unemployment Rate Depressed Wage Inflation By 0.5 Percent
2008-09: Every 1 Percent Rise In The Unemployment Rate Depressed Wage Inflation By 0.5 Percent
2008-09: Every 1 Percent Rise In The Unemployment Rate Depressed Wage Inflation By 0.5 Percent
All of which brings me to a crucial point: The non-linearity in the jobs market implies a non-linearity in inflation control. Given that it is impossible to lift the unemployment rate by ‘just’ 2 percent, it is also impossible to depress wage inflation by ‘just’ 1 percent. The choice is to not depress wage inflation at all, or to make wage inflation slump. This presents a major dilemma for policymakers in their current battle against inflation. If they choose to not depress wage inflation at all, core inflation will remain north of 3 percent and destroy central banks’ already tattered credibility to achieve and maintain price stability (Chart I-5). In the medium term, this would un-anchor long-term inflation expectations, push up bond yields, and further destabilise the financial and housing markets. Chart I-5Wage Inflation Is Running Too Hot For The 2 Percent Inflation Target
Wage Inflation Is Running Too Hot For The 2 Percent Inflation Target
Wage Inflation Is Running Too Hot For The 2 Percent Inflation Target
On the other hand, if central banks do choose to depress wage inflation, the non-linearity of the jobs market implies that wage inflation will slump, taking core inflation south of the 2 percent target. Central banks could pray that a surge in productivity growth might save their skins. If productivity growth surged, elevated wage inflation might still be consistent with 2 percent inflation, as it was in the early 2000s. But we wouldn’t bet on this outcome (Chart I-6). Chart I-6Don't Bet On A Repeat Of The Early 2000s Productivity Miracle
Don't Bet On A Repeat Of The Early 2000s Productivity Miracle
Don't Bet On A Repeat Of The Early 2000s Productivity Miracle
Inflation Will Not Run ‘Close To 2 Percent’ To summarise then, the economy is a non-linear system, and should be analysed as such. In uniquely doing so in this report, we reach a profound conclusion. The non-linearity of the jobs market and inflation control means that it is impossible for core inflation to run ‘close to 2 percent’. Depending on which of the non-linear options that policymakers choose – to not depress wage inflation at all, or to make wage inflation slump – inflation will either remain well above 2 percent, or slump to well below 2 percent within the next couple of years. Which option will the central banks choose? My answer is that they will make wage inflation slump. This is not just to save their own skins, but a genuine belief that the worse long-term outcome for the economy would be if central banks’ credibility to maintain price stability was destroyed. To prevent this outcome, a recession is a price that they are willing to pay. Central banks will choose to make wage inflation slump. Not just to save their own skins, but because the worse long-term outcome for the economy would be if price stability was destroyed. But what if I am wrong, and they choose not to depress wage inflation? In this case, long-term inflation expectations would become un-anchored, pushing up bond yields, and crashing the financial and housing markets. In turn, this would unleash a massive deflationary impulse which would end up creating an even deeper recession. So, we would end up at the same place, albeit later and via a more circuitous route. All of which confirms some long-held views. The structural low in bond yields, the structural low in commodity prices, the structural high in stock market valuations, and the structural high in the US dollar are yet to come. Chart 1Hungarian Bonds Are Oversold
Hungarian Bonds Are Oversold
Hungarian Bonds Are Oversold
Chart 2Copper Is Experiencing A Tactical Rebound
Copper Is Experiencing A Tactical Rebound
Copper Is Experiencing A Tactical Rebound
Chart 3US REITS Are Oversold Versus Utilities
US REITS Are Oversold Versus Utilities
US REITS Are Oversold Versus Utilities
Chart 4FTSE100 Outperformance Vs. Euro Stoxx 50 Is Vulnerable To Reversal
FTSE100 Outperformance Vs. Euro Stoxx 50 Is Vulnerable To Reversal
FTSE100 Outperformance Vs. Euro Stoxx 50 Is Vulnerable To Reversal
Chart 5Netherlands' Underperformance Vs. Switzerland Has Ended
Netherlands' Underperformance Vs. Switzerland Has Ended
Netherlands' Underperformance Vs. Switzerland Has Ended
Chart 6The Sell-Off In The 30-Year T-Bond At Fractal Fragility
The Sell-Off In The 30-Year T-Bond At Fractal Fragility
The Sell-Off In The 30-Year T-Bond At Fractal Fragility
Chart 7Food And Beverage Outperformance Is Exhausted
Food And Beverage Outperformance Is Exhausted
Food And Beverage Outperformance Is Exhausted
Chart 8German Telecom Outperformance Has Started To Reverse
German Telecom Outperformance Has Started To Reverse
German Telecom Outperformance Has Started To Reverse
Chart 9Japanese Telecom Outperformance Vulnerable To Reversal
Japanese Telecom Outperformance Vulnerable To Reversal
Japanese Telecom Outperformance Vulnerable To Reversal
Chart 10The Strong Trend In The 18-Month-Out US Interest Rate Future Has Ended
The Strong Trend In The 18-Month-Out US Interest Rate Future Has Ended
The Strong Trend In The 18-Month-Out US Interest Rate Future Has Ended
Chart 11The Strong Downtrend In The 3 Year T-Bond Has Ended
The Strong Downtrend In The 3 Year T-Bond Has Ended
The Strong Downtrend In The 3 Year T-Bond Has Ended
Chart 12The Outperformance Of Tobacco Vs. Cannabis Is Ending
The Outperformance Of Tobacco Vs. Cannabis Is Ending
The Outperformance Of Tobacco Vs. Cannabis Is Ending
Chart 13Biotech Is A Major Buy
Biotech Is A Major Buy
Biotech Is A Major Buy
Chart 14Norway's Outperformance Has Ended
Norway's Outperformance Has Ended
Norway's Outperformance Has Ended
Chart 15Cotton Versus Platinum Has Reversed
Cotton Versus Platinum Has Reversed
Cotton Versus Platinum Has Reversed
Chart 16Switzerland's Outperformance Vs. Germany Is Exhausted
Switzerland's Outperformance Vs. Germany Is Exhausted
Switzerland's Outperformance Vs. Germany Is Exhausted
Chart 17USD/EUR Is Vulnerable To Reversal
USD/EUR Is Vulnerable To Reversal
USD/EUR Is Vulnerable To Reversal
Chart 18The Outperformance Of MSCI Hong Kong Versus China Has Ended
The Outperformance Of MSCI Hong Kong Versus China Has Ended
The Outperformance Of MSCI Hong Kong Versus China Has Ended
Chart 19US Utilities Outperformance Vulnerable To Reversal
US Utilities Outperformance Vulnerable To Reversal
US Utilities Outperformance Vulnerable To Reversal
Chart 20The Outperformance Of Oil Versus Banks Is Exhausted
The Outperformance Of Oil Versus Banks Is Exhausted
The Outperformance Of Oil Versus Banks Is Exhausted
Dhaval Joshi Chief Strategist dhaval@bcaresearch.com Fractal Trading System Fractal Trades
Inflation’s ‘Non-Linearity’ Makes It Uncontrollable
Inflation’s ‘Non-Linearity’ Makes It Uncontrollable
Inflation’s ‘Non-Linearity’ Makes It Uncontrollable
Inflation’s ‘Non-Linearity’ Makes It Uncontrollable
6-Month Recommendations Structural Recommendations Closed Fractal Trades Indicators To Watch - Bond Yields Chart II-1Indicators To Watch - Bond Yields - Euro Area
Indicators To Watch - Bond Yields - Euro Area
Indicators To Watch - Bond Yields - Euro Area
Chart II-2Indicators To Watch - Bond Yields - Europe Ex Euro Area
Indicators To Watch - Bond Yields - Europe Ex Euro Area
Indicators To Watch - Bond Yields - Europe Ex Euro Area
Chart II-3Indicators To Watch - Bond Yields - Asia
Indicators To Watch - Bond Yields - Asia
Indicators To Watch - Bond Yields - Asia
Chart II-4Indicators To Watch - Bond Yields - Other Developed
Indicators To Watch - Bond Yields - Other Developed
Indicators To Watch - Bond Yields - Other Developed
Indicators To Watch - Interest Rate Expectations Chart II-5Indicators To Watch - Interest Rate Expectations
Indicators To Watch - Interest Rate Expectations
Indicators To Watch - Interest Rate Expectations
Chart II-6Indicators To Watch - Interest Rate Expectations
Indicators To Watch - Interest Rate Expectations
Indicators To Watch - Interest Rate Expectations
Chart II-7Indicators To Watch - Interest Rate Expectations
Indicators To Watch - Interest Rate Expectations
Indicators To Watch - Interest Rate Expectations
Chart II-8Indicators To Watch - Interest Rate Expectations
Indicators To Watch - Interest Rate Expectations
Indicators To Watch - Interest Rate Expectations
According to BCA Research’s US Investment Strategy service, investors are overly pessimistic about US corporate earnings prospects. The analyst consensus currently estimates that S&P 500 earnings per share over the next four quarters will exceed the…
Executive Summary Inflation Surprise Reinforces Gridlock And Fiscal Drag
A Politicized Fed? Another Blue Sweep? And Other Risks
A Politicized Fed? Another Blue Sweep? And Other Risks
A US recession is increasingly likely as the Fed will have to hike rates more aggressively in the short run to contain inflation. Recession would exacerbate US policy uncertainty during a period of peak polarization in the 2022-24 election cycle. The Fed’s struggle with inflation will become entangled in extreme US politics. The Fed will come under immense pressure to pause rate hikes earlier than warranted in 2023. The Fed could get blamed for both over-tightening and politicization. Investors should fade the risk of another Democratic sweep in the midterm elections. Republicans are still highly likely to gain control of the House, resulting in gridlock and a freeze to fiscal policy. If Democrats lose the House, their odds of retaining the White House will decline. A recession would greatly reduce their odds. In this context the US faces another tumultuous political cycle, as Republicans will stage a comeback. However, reform of the Electoral Count Act could reduce the risk of a catastrophic breakdown in the electoral system. Recommendation (Tactical) INITIATION DATE Return Long DXY (Dollar Index) Feb 23, 2022 12.6% Bottom Line: Stay long US dollar for now but prepare to downgrade to neutral. Feature BCA Research hosted our annual conference at the Plaza Hotel in New York last week. Clients heard a range of views on various topics, including US politics and policy. In this report we touch on some of the insights from the conference while providing our own views on what to expect going forward. A Politicized Federal Reserve? The real Fed funds rate stands at -2.2% today despite the Federal Reserve’s decision to hike rates by 225 basis points this year. The last time the real Fed funds rate was this low was in 1975, under the chairmanship of Arthur Burns – i.e. the epitome of a politicized Fed (Chart 1). Chart 1A Politicized Federal Reserve?
A Politicized Federal Reserve?
A Politicized Federal Reserve?
Is the Fed already politicized or will it become politicized in the coming years? What would that mean for monetary policy, the economy, and financial markets? The Fed waded into political territory when it began pursuing unorthodox policies in the wake of the 2008 financial crisis and again during the Covid-19 pandemic. Ideally monetary policy sets interest rates across the economy and applies equally to all economic actors. But once the Fed began quantitative easing (bond buying) and coordinating its actions with the fiscal authorities (which had bailed out major banks), it entered the game of income and wealth redistribution. Not least because asset price inflation favors asset owners over others. Now that the Fed and other central banks have pioneered these unorthodox policies, they will continue to use them in the face of future economic and political turmoil. They will also innovate new tools to deal with each crisis. As the pandemic response highlighted, the Fed will continue down the path of redistribution, which will continue to provoke political backlash from legislators and the public. At the same time, the Fed’s policy parameters today have been reined in and disciplined by the post-pandemic inflation overshoot. For example, there is not so much excited talk today about implementing Modern Monetary Theory – debt monetization – as there was in the heady days of 2019. Instead the Fed today is focused almost exclusively on fulfilling its price stability mandate, at least until inflation gets down into the 2%-3% range. The market appears over-eager for interest rate cuts in 2023 when the Fed is expecting to continue hiking rates throughout 2023 (Chart 2). The surprise in core and headline inflation in August reinforces this point. If the Fed cannot bring inflation below 3%, what will it do? Could it accept reality and modify the inflation target to 3%? A higher inflation target has long been discussed – it would enable the Fed to stimulate more effectively in the next recession. But Chairman Jerome Powell and his monetary policy strategy review rejected the idea of raising the long-term inflation target from 2% to 3% or above – and that rejection is likely to be sustained at least until the next review in 2024. Even then a higher inflation target seems unlikely as it would be very hard to achieve politically in the wake of the inflation overshoot. Chart 2Will Fed Cut Rates Next Year?
Will Fed Cut Rates Next Year?
Will Fed Cut Rates Next Year?
Of course, a lot can happen by 2024 and new deflationary shocks could conceivably force a change to the inflation target. What is clear to us is that the Fed still has a dovish bias that took a long time to develop and has not yet been entirely overturned by the inflation overshoot (Chart 3). Chart 3Dovish Consensus Built Up Over Time And Remains In Place For Now
A Politicized Fed? Another Blue Sweep? And Other Risks
A Politicized Fed? Another Blue Sweep? And Other Risks
Meanwhile the Fed’s single-minded focus on restoring price stability will bring an entirely different set of political problems – and accusations of politicization. For example, the Fed wants tighter financial conditions – since that will help to cool the economy and bring down inflation – but cannot well speak openly about deliberately driving down stock market prices and home values. The Fed also believes that a recession with unemployment ranging from 4%-5% would not be the end of the world but it cannot well speak openly about deliberately increasing unemployment. Especially because unemployment rarely stays so low in recessions. The Fed acknowledges that it will need to pause hiking interest rates at some point, hopefully before it tightens monetary conditions so much as to trigger a recession, but it does not want to call it a “pause” since financial markets will take that as a hard stop. It could cause a premature loosening of financial conditions and be blamed for a lack of vigilance when inflation revives. Will the Fed ultimately be prevented from tightening monetary policy enough because of the pressure that higher interest rates will put on the government’s fiscal sustainability? It is entirely possible. Sustaining social programs is more popular than paying bond holders. Since the Fed pays market interest rates on reserve balances, it will stop making a profit if it hikes rates to 3.25% or above (which is slated to happen this month). Very soon the Fed will be turning a loss on its holdings, rather than remitting profits to the Department of Treasury, and it will be amply criticized for spending taxpayer money. In that case there will be plenty of ammunition from critics on all sides. When it comes to the Fed’s specific predicament in 2022-24, Chairman Powell does not want to be the next Arthur Burns, i.e. he does not want to go down in history as the chairman who made a historic mistake by not forcing inflation back into an acceptable and containable range of say 2%-3.5%. Neither he nor the Fed can afford to lose control of price stability, which would damage the US economy and the Fed’s credibility. The implication is that Powell will need to hike rates until price stability is obtained. Yet even a conservative estimate would suggest that hiking rates until inflation falls beneath 3% will require the unemployment rate to rise by more than the estimated 0.5-1.0 percentage points, likely considerably more than this, which historically implies a recession in 2023-24. Recession odds have already risen sharply as priced by the bond market, according to Jonathan LaBerge at our Bank Credit Analyst flagship service (Chart 4). Of course, recession odds have an important implication for the 2022-24 political cycle, implying that the Fed’s handling of the economy will become entangled once again in America’s extreme political polarization. Chart 4Recession Odds Rising
Recession Odds Rising
Recession Odds Rising
Our past research has shown that the Fed does not pay close attention to midterm elections. The Fed is more likely to hike rates than cut rates during a midterm election year – and more likely to hike rates during a president’s first midterm election as opposed to his second. Whereas the Fed is about equally likely to cut rates as to hike them during a presidential election year. Most importantly, the Fed is more likely to hike rates during a non-election year than otherwise (Table 1). Table 1The Fed Doesn’t Care About Midterms … But Prefers To Hike In Off-Years
A Politicized Fed? Another Blue Sweep? And Other Risks
A Politicized Fed? Another Blue Sweep? And Other Risks
While the Fed had no choice but to hike in 2022, supporting these data, a critical decision will emerge in 2023, when the Fed is still expected to hike but the risk of recession grows. Recessions sharply reduce the odds of the incumbent political party staying in the White House (Table 2). Moreover a recession could bring back President Trump or a Trumpist Republican candidate bent on revenge against the political establishment. The result is that the FOMC will be under immense political pressure not to overtighten monetary policy in 2023-24. In normal times, a Fed chair appointed by a Republican president could conceivably have the license to hike rates aggressively to whip inflation, knowing that if a recession occurs and a Republican comes to power, he would be likely to be reappointed. But Powell can have no such assurance from the erratic President Trump, who is still favored for the Republican nomination as things stand. Even aside from Trump, Powell and the FOMC will fear that a populist Republican Party would seek to audit the Fed or curtail its powers. Table 2Biden’s Odds Fall If Recession Occurs
A Politicized Fed? Another Blue Sweep? And Other Risks
A Politicized Fed? Another Blue Sweep? And Other Risks
In sum, the Washington political establishment believes it is under attack from right-wing insurrectionists and will put immense pressure on the FOMC to avoid triggering a recession in 2023-24. This could produce an inflationary surprise. Bottom Line: A recession is likely to occur as the Fed continues hiking rates to bring inflation below 3%. This increases political uncertainty for the 2022-24 cycle. But a politicized Fed may compromise when inflation is closer to 4% for fear of a populist win in 2024. That would likely prove to be a historic monetary policy mistake, enabling long-term inflation expectations to rise substantially. Midterm Elections: Fade The “Blue Sweep” Risk While the Fed ignores midterm elections, investors are increasingly uncertain over fiscal policy and the outcome of the midterms. Will Congress become gridlocked, as we expect, or will Democrats retain control of Congress and continue the federal spending splurge that has played a large role in the inflation overshoot? Clearly the midterm races have tightened since President Biden changed his tone and started prioritizing the fight against inflation back in June. As inflation has abated, online betting markets have discounted Republican odds of victory, particularly in the Senate where they are now 36% (Chart 5). We anticipated that Biden’s approval ratings would stabilize on the passage of legislation and that the election would tighten in the final months, particularly on the back of women voters turning out to support Democrats in the wake of the Supreme Court’s decision to reduce abortion access. However, we also argued that gridlock would still be the most likely result based on the high odds that the House would flip to Republican control regardless of Roe. This is a consensus view that should be challenged and reassessed as November approaches. Chart 5Bookies Still Expect Gridlock In Midterms
A Politicized Fed? Another Blue Sweep? And Other Risks
A Politicized Fed? Another Blue Sweep? And Other Risks
Senate elections are held statewide and are therefore more susceptible to a shift in suburban and women voters. State-level polls leave much to be desired but the overall picture is that the races are closer than they were earlier this year – and closer than the Republicans would want them to be (Charts 6A & 6B). Persistent high inflation should be the clincher in favor of Republicans but the Senate is simply too close to call at this stage. Chart 6ANeck-And-Neck Races In Senate
A Politicized Fed? Another Blue Sweep? And Other Risks
A Politicized Fed? Another Blue Sweep? And Other Risks
Chart 6BNeck-And-Neck Races In Senate
A Politicized Fed? Another Blue Sweep? And Other Risks
A Politicized Fed? Another Blue Sweep? And Other Risks
Yet the Senate is overrated in this election because if Democrats lose either chamber, gridlock will be the result. Gridlock is what matters most for fiscal policy and hence for investors. The gridlock view rests on the House of Representatives. While the president’s party almost always loses seats in the midterm election, losing seats is not the same as losing control. In fact, over the past 120 years, a party that controls the House and/or Senate is more likely than not to retain control in a midterm election (Chart 7). But in the post-WWII era, the president’s party is slightly more likely to lose control of the House. And in almost all midterms, the president’s party loses seats in the House. Chart 7Presidents Do Not Always Lose Control, But Dems Have Small Cushion In 2022
A Politicized Fed? Another Blue Sweep? And Other Risks
A Politicized Fed? Another Blue Sweep? And Other Risks
The key point about 2022 is that the Democrats only have a six-seat buffer in the House. In other words, losing seats is very likely to be equivalent to losing control this year. To save the House, Biden’s Democrats would have to perform as well as John F. Kennedy’s Democrats in 1962, when they only lost four House seats. Our House model predicts they will lose 21 seats (Appendix). While Democrats could beat this prediction, they would be hard pressed to lose fewer than six seats on a net basis: inflation is high and sticky, real wages and incomes have fallen, consumer confidence has fallen, the president’s approval rating is low, and approval of Congress is low. If a president’s party loses control of the House, its odds of keeping the White House in 2024 also fall (Chart 8). This is another reason for investors to expect that fiscal policy will freeze, policy uncertainty will remain high, and the Fed will be under political pressure not to hike rates aggressively in 2023-24. Chart 8Biden’s 2024 Odds Fall If He Loses The House
A Politicized Fed? Another Blue Sweep? And Other Risks
A Politicized Fed? Another Blue Sweep? And Other Risks
Bottom Line: Fade the “Blue Sweep” risk in 2022. The midterm election is tightening but Republicans are still likely to win the House. Fiscal policy will remain a drag on growth and the 2024 election will become even more uncertain, putting political pressure on the Fed to avoid overtightening. Limited Big Government Another Democratic sweep would greatly reinforce the new US policy trajectory of Big Government: a trajectory that points away from the Washington Consensus and Reagan revolution toward a future of higher taxes, larger budget deficits, higher tariffs, and more extensive regulation (Chart 9).1 But Democrats will be forced to share power. This is why we call the new policy paradigm “Limited Big Government.” It is still a shift in the direction of a larger government role in the economy and society, but it is taking place within the context of the US constitutional system of checks and balances and two-party politics. We do not expect the latter two factors to disappear. Looking at the Obama, Trump, and Biden administrations together we can see that the turn toward Big Government is also compromised by vested interests: Democrats failed to increase corporate taxes, though they did put a floor under the effective tax rate by imposing a new 15% minimum tax on corporate book income. The budget deficit is normalizing after the gargantuan pandemic stimulus. But Democratic legislation will not reduce the deficit substantially over time, contrary to Biden administration propaganda. But Republicans are fiscally profligate themselves, which is clear from Trump’s term in office as well as previous periods of single-party GOP rule. Republicans joined Democrats in passing the infrastructure bill and the Chips and Science Act, which revives US industrial policy in an era of great power competition. Biden has now accepted Trump’s tariff hikes on China. While Republican leadership may push deregulation in future, they may also believe that government regulation will be required to fight back against “woke” or socially left-wing corporations. Chart 9Buenos Aires Consensus equal Spending, Taxes, Tariffs, Regulations
A Politicized Fed? Another Blue Sweep? And Other Risks
A Politicized Fed? Another Blue Sweep? And Other Risks
Thus the US’s new policy paradigm is bipartisan in nature. Of course, if Republicans take the House they will turn fiscally conservative for tactical reasons. That will put a halt to the spending splurge of 2020-22. But it will not signal a new fiscally austere paradigm since full Republican control in 2025 would be highly likely to lead to another fiscal blowout. This is even more likely to be the case now that Republicans have adopted a populist and pro-working class approach. Bottom Line: The US shift away from limited government toward Big Government is entrenched even if it suffers a setback due to gridlock from 2022-24. Given that partisan checks will prevent the US from moving too radically in any direction, we dub this paradigm “Limited Big Government.” It is marginally inflationary due to the rise in taxes, spending, regulations, and tariffs. US Electoral System: A Possible Positive Surprise Our expectation that the Fed will be politicized and that populist policies will persist stems from the underlying inequality and political polarization in the United States. Yet these same factors serve to increase overall political instability and threaten to cause a fundamental breakdown in political order. Will US institutions be able to handle the strain in the coming election cycle? There can be no doubt that polarization is reaching dangerous extremes. The US has suffered two out of five contested elections in the past 22 years. The last two Republican presidential victories have occurred without gaining the popular vote. The Biden administration’s low approval creates the risk of another tight election in 2024, implying controversy over the vote count and procedure (see Appendix). Another tight election could lead to a single state’s controversy determining the outcome of the entire election. Or it could lead to an electoral college tie in which Congress would decide the election result and could decide against the popular verdict. It is not hard to think of scenarios where contested elections and social unrest get out of hand. For example, one important consequence of the January 6 rebellion is that future governments will suppress protests with force if they attempt to interfere with the electoral process or the workings of the legislature. But imagine if a Republican administration comes to power through a contested election in Congress and then suppresses the resulting protests against it? Or imagine if Democrats retain power and push their “domestic war on terrorism” far enough to provoke a low-level militant insurgency from disaffected nationalists? It is easy to think of scenarios on either side that could lead to a much greater breakdown in public order than what occurred in 2020. It is unlikely that an institutional fix will occur in time for the 2024 election. However, there is one exception on the congressional agenda: a possible revision of the Electoral Count Act of 1887. This law was designed to prevent a failure of the electoral system in the wake of the “Stolen Election” of 1876. Its main achievement was to have the governor of each state certify the electoral votes of that state before sending them to Washington. However, the law also leaves open the door for state legislatures, secretaries of state, and governors to influence their state’s electoral votes. Democrats have written a revised version of the law that would close some of the loopholes and ambiguities. So far 10 Senate Republicans have co-sponsored the bill, making it very likely they will vote for it (Table 3). If these Republicans do not change their minds in the critical hour, and if all Democrats can be brought to vote for the measure, then a 60-vote, filibuster-proof majority will exist to pass the law. Table 3Republican Senators Who Support Revising The Electoral Count Act
A Politicized Fed? Another Blue Sweep? And Other Risks
A Politicized Fed? Another Blue Sweep? And Other Risks
The original Electoral Count Act took ten years to pass, so there is no reason to be overly optimistic. But if 60 votes can be found in the Senate, then the electoral system will be fortified ahead of the 2024 election and structural US political risks will be at least somewhat reduced. Bottom Line: The US faces serious social and political instability in the coming years and remains at “peak polarization.” But a bipartisan law could help solidify the electoral system prior to 2024, which would reduce some of the risk of election controversies spiraling out of control. Investment Takeaways Headline consumer price inflation for August came in at 8.3% year-on-year versus an expected 8.1%, while core inflation accelerated from 5.9% to 6.3%. Financial markets took it on the chin, with the S&P500 falling by 4.3%, due to the disappointed expectation that inflation had already peaked. This disappointment is the second of its kind this year: investors have been over-eager to call the peak in inflation. Market volatility is likely to continue through the fall as investors now expect that the Fed will hike interest rates by another 75-100 basis points in September and continue hiking until inflation falls more convincingly. Twice-bitten investors will be hesitant to endorse a third rally until they are certain that inflation is coming down – but by then a recession may already be upon them. A significant increase in unemployment is likely necessary to cool inflation, which implies recession. Higher inflation will drive real wages further into the red, which is negative for the Biden administration’s midterm campaign. Otherwise the economy looked to be improving just in time for the vote. Manufacturing and non-manufacturing employment is perking up, labor force participation is reaching pre-Covid levels, and consumer confidence ticked up in the latest data, albeit still much lower than in 2021 (Chart 10). Now the tightening of financial conditions will cool the economy and sentiment in the advance of the election, reinforcing the opposition party and the expected gridlock. Inflation may indeed be peaking but not in time for the election. Throughout this year we bet on the US dollar index. This trade is getting very toppy and net speculative positions have rolled over (Chart 11). The dollar is overvalued but its momentum remains strong given extreme macroeconomic and geopolitical uncertainty. We have put this trade on watch for a downgrade to neutral but we expect the momentum to be sustained at least through the US election and Chinese party congress this fall. Chart 10Small Bounce In Economy Will Not Save Democrats
Small Bounce In Economy Will Not Save Democrats
Small Bounce In Economy Will Not Save Democrats
Chart 11Dollar Is Overvalued But Has Momentum
Dollar Is Overvalued But Has Momentum
Dollar Is Overvalued But Has Momentum
Matt Gertken Senior Vice President Chief US Political Strategy mattg@bcaresearch.com Footnotes 1 This trajectory is the opposite of the Washington Consensus. As such, Marko Papic, the founder of BCA’s Geopolitical Strategy, has dubbed it the “Buenos Aires Consensus,” as it resembles Argentine economic policy more so than the Thatcher/Reagan policy mix. Strategic View Open Tactical Positions (0-6 Months) Open Cyclical Recommendations (6-18 Months) Table A2Political Risk Matrix
A Politicized Fed? Another Blue Sweep? And Other Risks
A Politicized Fed? Another Blue Sweep? And Other Risks
Table A3US Political Capital Index
A Politicized Fed? Another Blue Sweep? And Other Risks
A Politicized Fed? Another Blue Sweep? And Other Risks
Chart A1Presidential Election Model
A Politicized Fed? Another Blue Sweep? And Other Risks
A Politicized Fed? Another Blue Sweep? And Other Risks
Chart A2Senate Election Model
A Politicized Fed? Another Blue Sweep? And Other Risks
A Politicized Fed? Another Blue Sweep? And Other Risks
Table A4House Election Model
A Politicized Fed? Another Blue Sweep? And Other Risks
A Politicized Fed? Another Blue Sweep? And Other Risks
Table A5APolitical Capital: White House And Congress
A Politicized Fed? Another Blue Sweep? And Other Risks
A Politicized Fed? Another Blue Sweep? And Other Risks
Table A5BPolitical Capital: Household And Business Sentiment
A Politicized Fed? Another Blue Sweep? And Other Risks
A Politicized Fed? Another Blue Sweep? And Other Risks
Table A5CPolitical Capital: The Economy And Markets
A Politicized Fed? Another Blue Sweep? And Other Risks
A Politicized Fed? Another Blue Sweep? And Other Risks
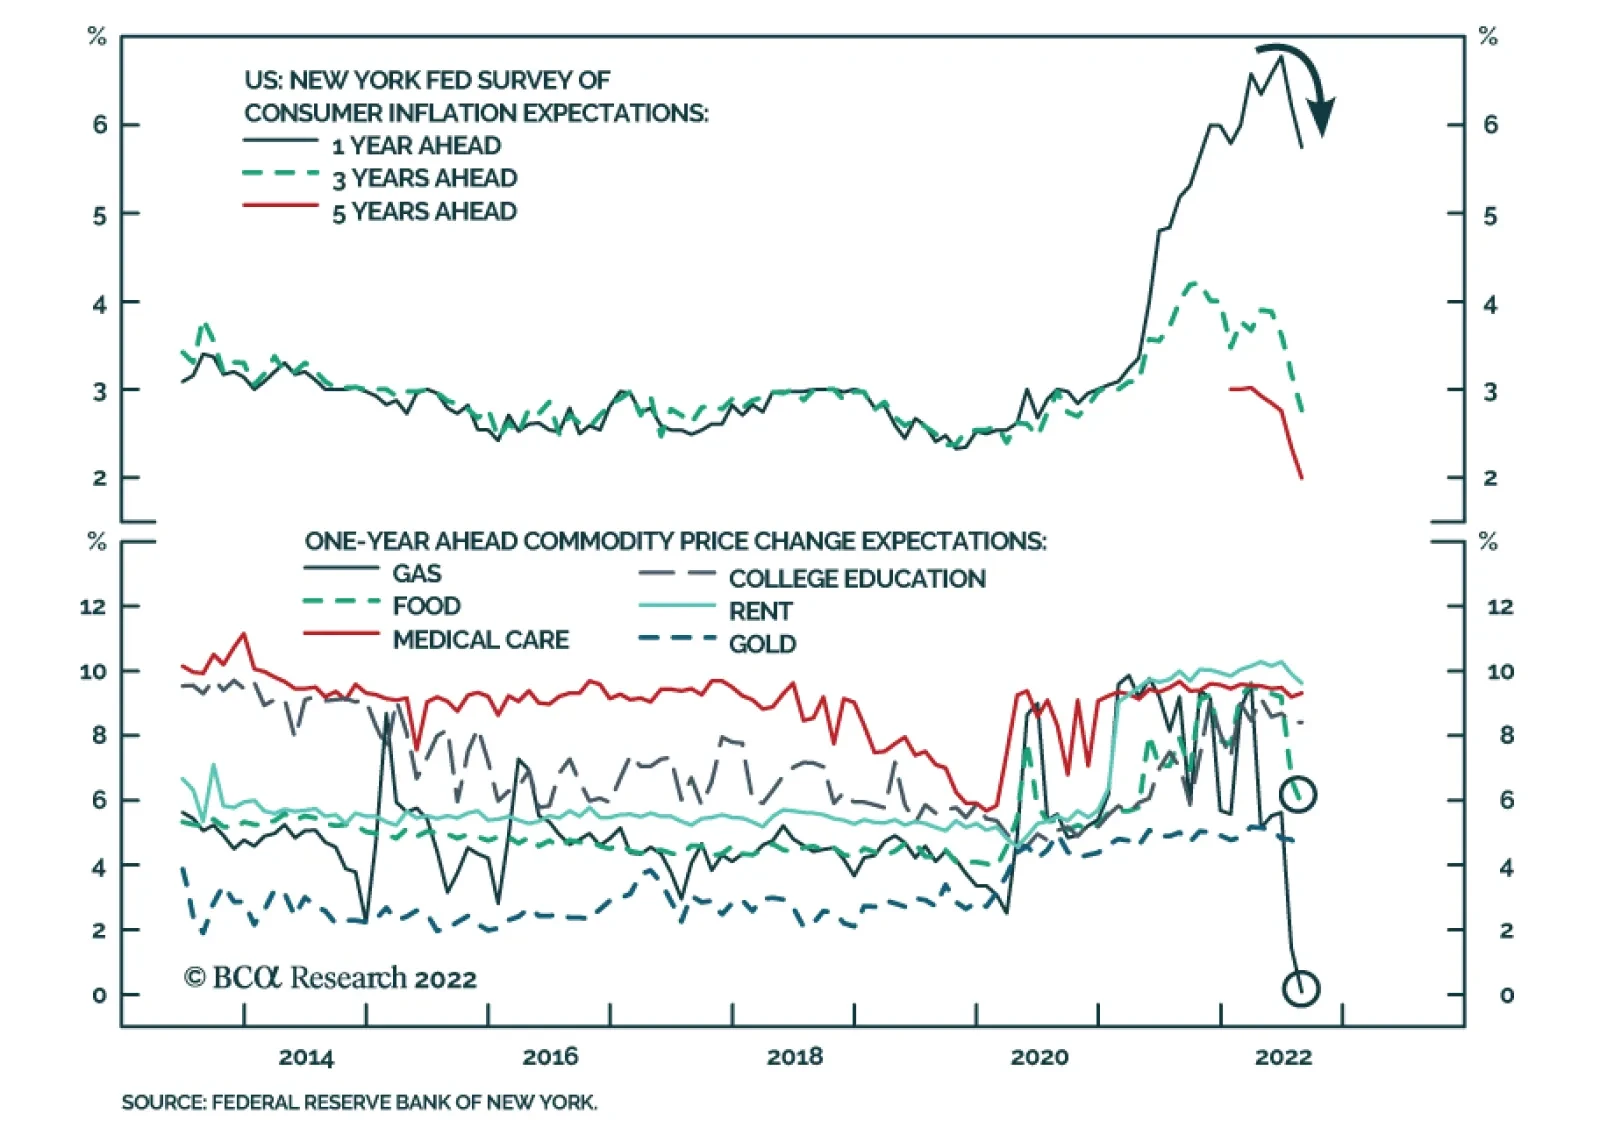
Stubbornly elevated US CPI inflation complicates the Fed’s task (see The Numbers). On the one hand, a failure to squash inflation risks de-anchoring inflation expectations and unleashing a vicious wage-price spiral, raising the costs associated with bringing…
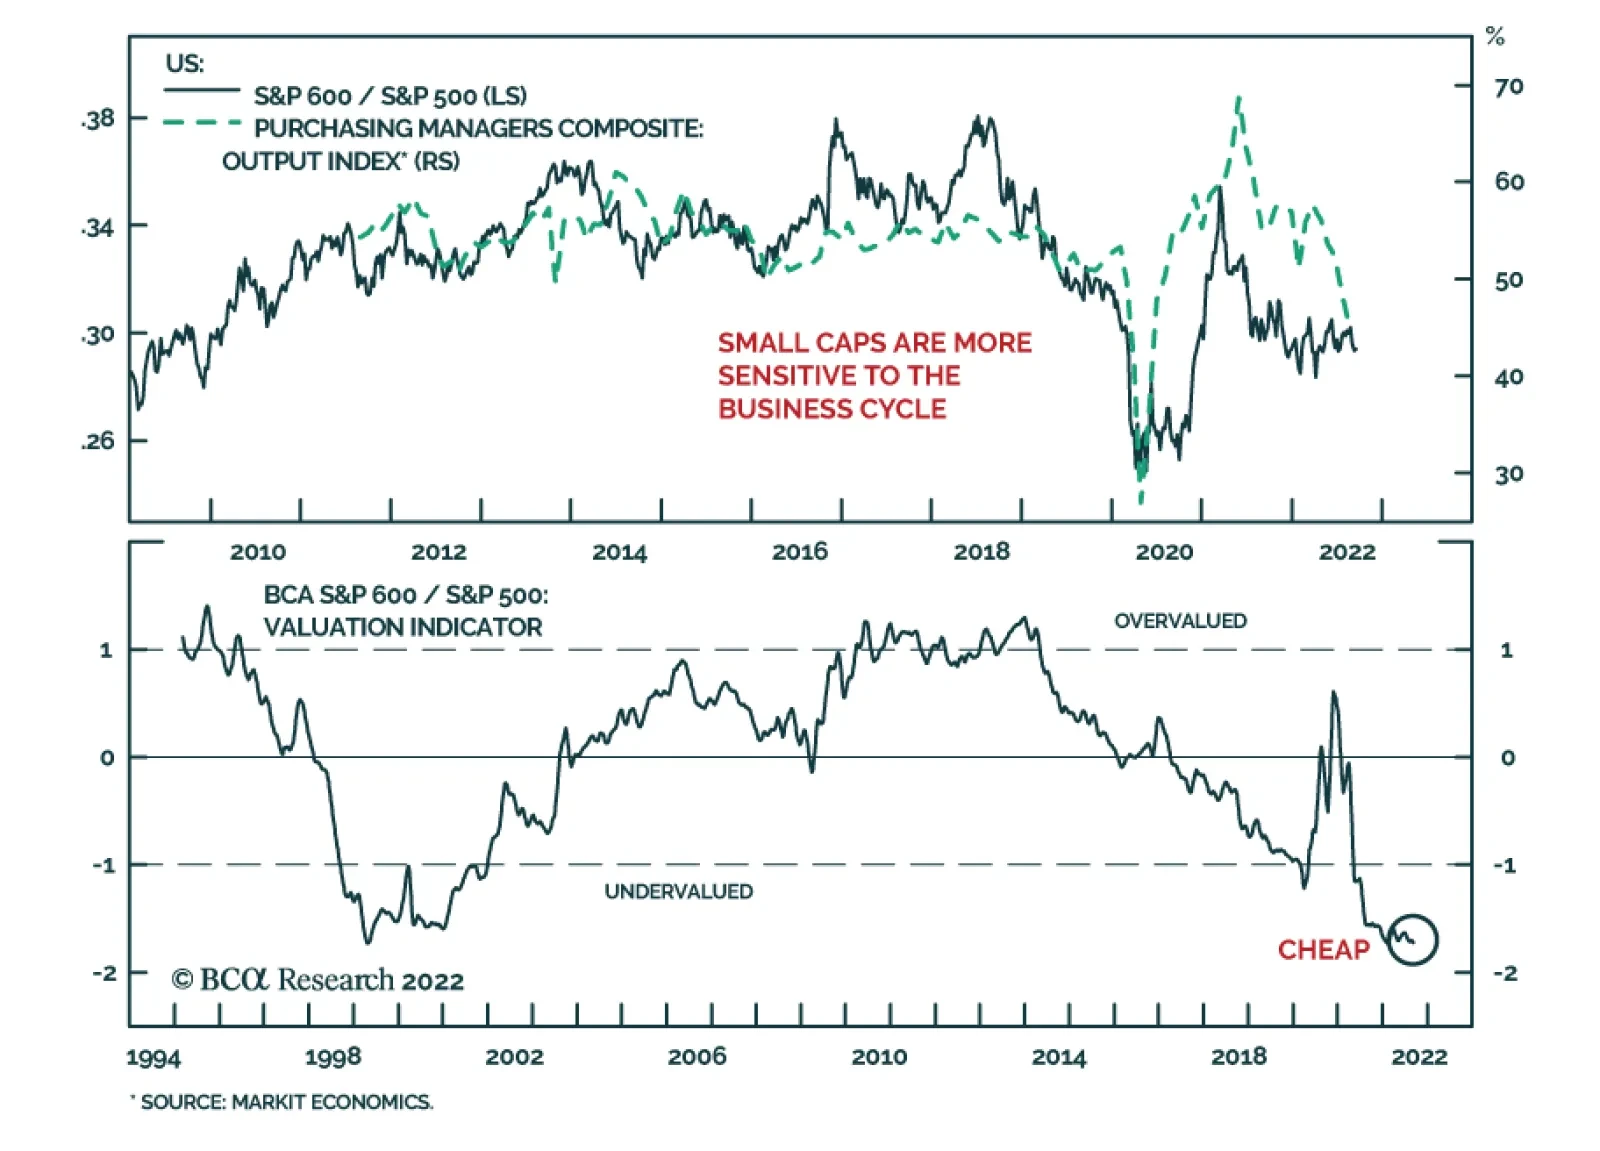
US small cap equities have performed broadly in line with their large cap peers so far this year, with both the S&P 500 and S&P 600 down nearly 14% by Monday’s close. Small caps are typically more sensitive to the business cycle. Indeed, in the…