United States
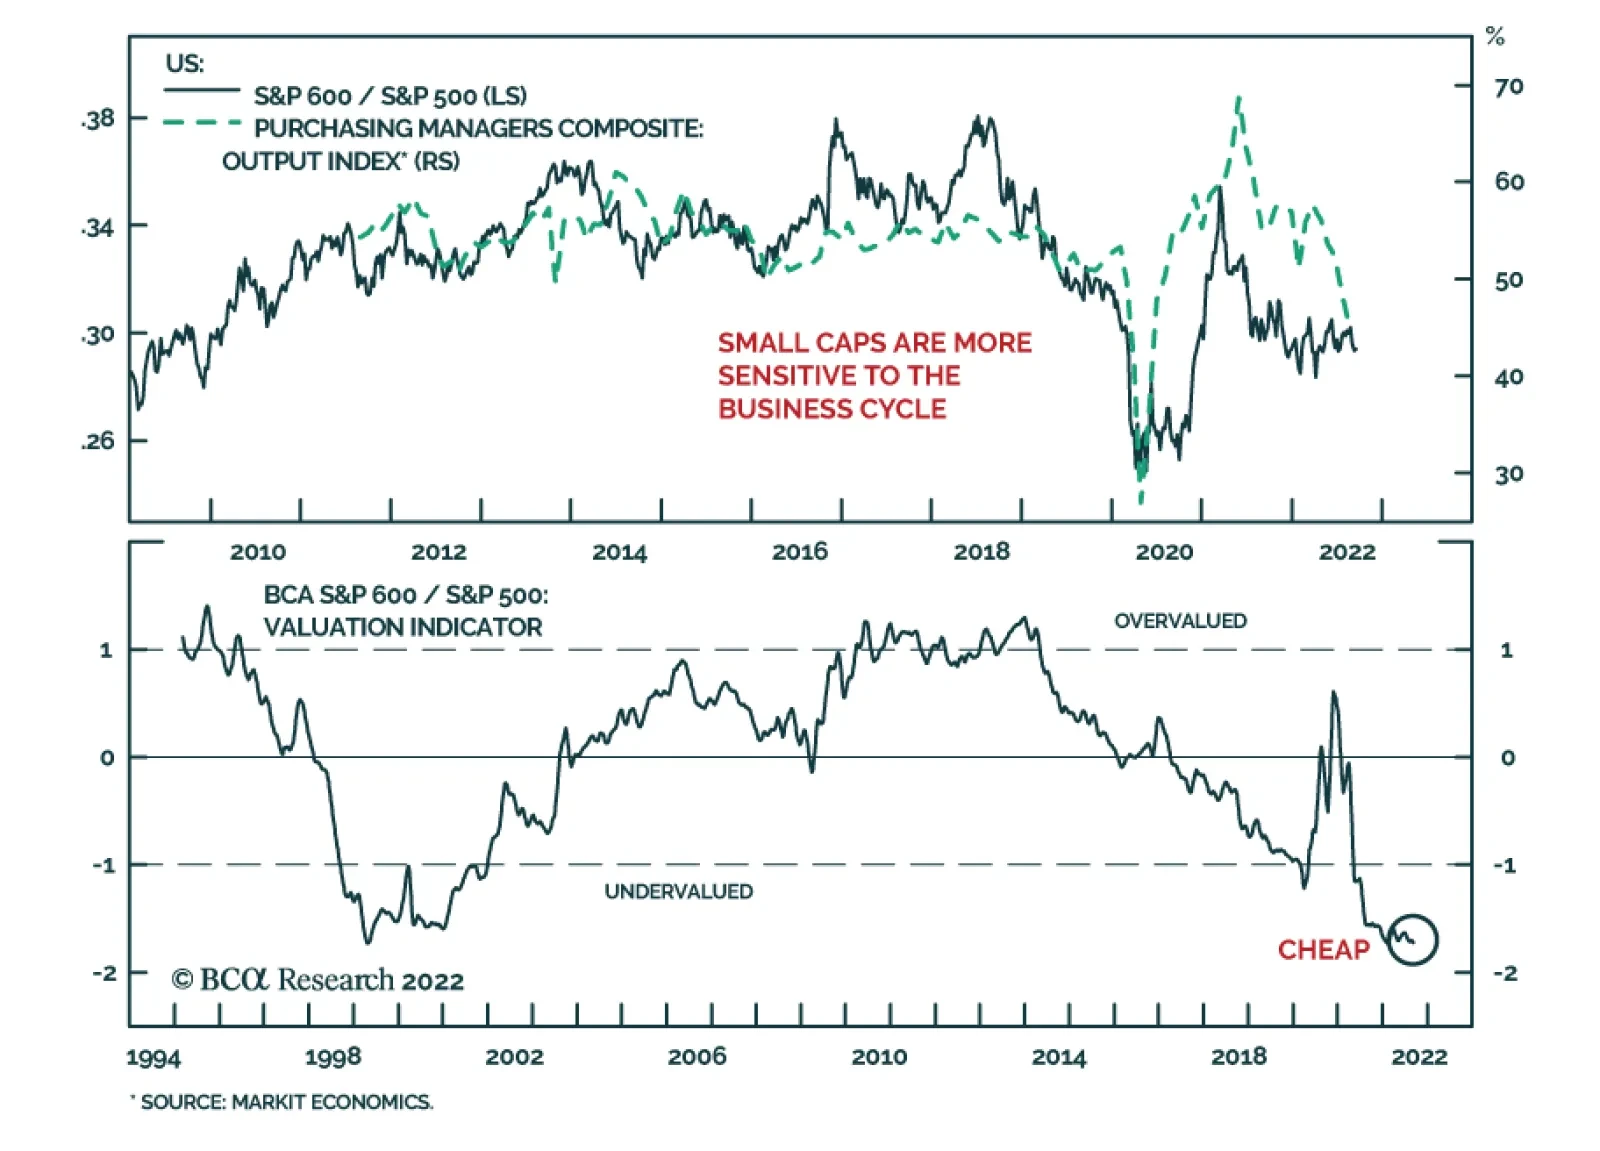
US small cap equities have performed broadly in line with their large cap peers so far this year, with both the S&P 500 and S&P 600 down nearly 14% by Monday’s close. Small caps are typically more sensitive to the business cycle. Indeed, in the…
BCA Research’s US Bond Strategy service looks back at seven recent Fed tightening cycles and summarizes evidence concerning how the US Treasury curve behaves relative to the length and magnitude of the tightening cycle. First, both the level of the 10-year…

Executive Summary This report looks back at seven recent Fed tightening cycles and summarizes evidence concerning how the US Treasury curve behaves relative to the length and magnitude of the tightening cycle. We document a few consistent relationships. For example, the 10-year Treasury yield tends to peak 1-2 months before the last rate hike of the tightening cycle. We also notice that the Treasury slope is usually inverted by the time it troughs and that the 5-year/30-year slope tends to trough before the 2-year/5-year slope. Given our view that the peak fed funds rate may not occur until the second half of 2023, we expect another leg higher in bond yields before we reach the cyclical peak. We also anticipate further flattening of the 5-year/30-year Treasury curve. Timing Fed Tightening Cycles
A Brief History Of Fed Tightening Cycles
A Brief History Of Fed Tightening Cycles
Bottom Line: Investors should keep portfolio duration close to benchmark for the time being and should position in 5-year/30-year curve flatteners by selling the 10-year bullet versus a duration-matched 5/30 barbell. While we maintain neutral portfolio duration for now, our bias is to be short duration on a medium-to-long run horizon and we may re-evaluate our recommended duration positioning after this month’s important CPI release and September FOMC meeting. Feature BCA’s Annual Investment Conference was held last week, and we heard a wide variety of views about the outlook for US bonds. Unsurprisingly, the main difference between those with bond-bullish and bond-bearish views was that the bullish panelists anticipated a much quicker end to the Fed’s tightening cycle prompted by a US recession starting late this year or early next year. This week’s report takes a more formal look at the historical linkages between Fed tightening cycles and trends in US Treasury yields. Our goal is to provide some firm evidence that investors can use to translate their views about the length and magnitude of the Fed tightening cycle into concrete positions across the US Treasury curve. Specifically, we look at seven Fed tightening cycles – the five most recent cycles and the two periods of tightening that occurred during the inflationary surge of the early-1980s. The 1977-80 Cycle Chart 1The 1977-80 Cycle
The 1977-80 Cycle
The 1977-80 Cycle
The Fed raised the funds rate by 11.75% between August 1977 and March 1980 in response to sky-high inflation. Then, despite core CPI inflation still running at 12%, it cut rates by 5.5% in 1980 in response to an unemployment rate that had climbed above 6%. This proved to be only a brief reprieve from monetary tightening. With inflation still a problem, the Fed pivoted back to rate hikes later in 1980 even as the unemployment rate continued its ascent. Turning to markets, we see that the Treasury index lost 22% versus a position in cash during the 1977-80 tightening cycle and that index returns troughed in March 1980, around the same time as the last rate hike. The 10-year Treasury yield peaked one month before the last rate hike at 12.72%, 378 bps below the peak fed funds rate that would be attained one month later (Chart 1). As for the shape of the yield curve, the 2-year/10-year Treasury slope troughed at -201 bps one month before the last rate hike of the cycle (panel 4). The 2-year/5-year Treasury slope troughed at -132 bps in the same month as the peak in the funds rate and the 5-year/30-year slope troughed at -123 bps, one month before the last hike (bottom panel). The 1980-81 Cycle After a brief period of cuts in mid-1980, having still not conquered inflation the Fed changed course and lifted the funds rate to a new high in 1981. It did this even with the unemployment rate above 7%. One interesting aspect of this tightening cycle is that the bond market continued to sell off even after the Fed delivered its last rate increase. While the period of Fed tightening spanned from October 1980 until May 1981, excess Treasury index returns versus cash continued to fall until September 1981, losing 20% in the process (Chart 2). The 10-year Treasury yield also peaked four months after the last rate hike at 15.84%, 316 bps below the peak funds rate that was attained four months earlier. Chart 2The 1980-81 Cycle
The 1980-81 Cycle
The 1980-81 Cycle
Looking at the Treasury curve, the 2-year/10-year slope troughed at -132 bps three months after the last rate hike (panel 4). The 2-year/5-year and 5-year/30-year slopes also troughed three months after the last rate hike, at -62 bps and -133 bps, respectively (bottom panel). The 1988-89 Cycle The Fed lifted rates from 6.5% in March 1988 to 9.8% in May 1989. Peak-to-trough, the Treasury index lost 7.7% versus cash during this period but returns did trough two months before the last rate hike. The 10-year Treasury yield peaked three months before the last rate hike at 9.32%, 48 bps below the peak fed funds rate (Chart 3). Chart 3The 1988-89 Cycle
The 1988-89 Cycle
The 1988-89 Cycle
On the Treasury curve, the 2-year/10-year slope troughed two months before the last rate hike at -43 bps (panel 4). The 2-year/5-year and 5-year/30-year slopes also troughed two months before the last rate hike, at -20 bps and -42 bps, respectively (bottom panel). The 1994-95 Cycle The Fed doubled the funds rate from 3% in February 1994 to 6% in February 1995. Peak-to-trough, the Treasury index lost 9.4% versus cash during this period but returns did trough three months before the last rate hike. The 10-year Treasury yield peaked three months before the last rate hike at 7.91%, 191 bps above the peak fed funds rate (Chart 4). Chart 4The 1994-95 Cycle
The 1994-95 Cycle
The 1994-95 Cycle
On the Treasury curve, the 2-year/10-year slope troughed two months before the last rate hike at +15 bps (panel 4). The 2-year/5-year and 5-year/30-year slopes also troughed two months before the last rate hike, at +14 bps and +6 bps, respectively (bottom panel). In contrast to earlier cycles, it’s notable that the yield curve never inverted during the 1994-95 tightening cycle and that the 10-year Treasury yield peaked at a level significantly above the fed funds rate. The most likely reason for this is that the Fed’s pivot from rate hikes to cuts in early 1995 occurred abruptly and came as a surprise to market participants. A quick look at the economic data makes it easy to see why. The core PCE and core CPI inflation rates were elevated at the time, at 2.3% and 3.0% respectively, and the unemployment rate was significantly down from a year earlier. The 1999-2000 Cycle The Fed lifted rates from 4.75% in June 1999 to 6.5% in May 2000. Peak-to-trough, the Treasury index lost 8.2% versus cash during this period but returns did trough four months before the last rate hike. The 10-year Treasury yield also peaked four months before the last rate hike at 6.68%, 18 bps above the peak fed funds rate (Chart 5). Chart 5The 1999-2000 Cycle
The 1999-2000 Cycle
The 1999-2000 Cycle
On the Treasury curve, the 2-year/10-year slope troughed two months before the last rate hike at -47 bps (panel 4). The 5-year/30-year slope troughed one month before the last rate hike at -59 bps but the 2-year/5-year slope didn’t trough until three months after the last rate hike at -15 bps (bottom panel). The 2004-06 Cycle The Fed lifted rates in steady increments of 25 bps per meeting from 1% in June 2004 to 5.25% in June 2006. Peak-to-trough, the Treasury index lost 5.3% versus cash during this period and returns troughed around the same time as the funds rate reached its peak. The peak in the 10-year Treasury yield also occurred at the same time as the peak in the funds rate, though the peak 10-year was 10 bps below the peak funds rate (Chart 6). Chart 6The 2004-06 Cycle
The 2004-06 Cycle
The 2004-06 Cycle
On the Treasury curve, the 2-year/10-year slope troughed five months after the last rate hike of the cycle at -16 bps (panel 4). The 2-year/5-year slope also troughed five months after the last rate hike at -20 bps, while the 5-year/30-year slope troughed much earlier, four months before the last rate hike at -10 bps (bottom panel). The 2015-18 Cycle Finally, in the most recent tightening cycle before the current one, the Fed lifted rates off the zero-lower-bound in December 2015, went on hold for 12 months and then delivered a string of rate hikes bringing the funds rate up to 2.5% by December 2018. Peak-to-trough, the Treasury index lost 6.7% versus cash during this period and returns troughed two months before the peak in the fed funds rate. The peak in the 10-year Treasury yield also occurred two months before the last rate hike at 3.15%, 65 bps above the peak funds rate (Chart 7). Chart 7The 2015-18 Cycle
The 2015-18 Cycle
The 2015-18 Cycle
On the Treasury curve, the 2-year/10-year slope troughed eight months after the last rate hike of the cycle at 0 bps (panel 4). The 2-year/5-year slope also troughed eight months after the last rate hike at -17 bps, while the 5-year/30-year slope troughed much earlier, five months before the last rate hike at +23 bps (bottom panel). Summarizing The Evidence Tables 1 and 2 summarize the data from the seven tightening cycles that we examined. Four main points jump out. Table 1Timing Fed Tightening Cycles
A Brief History Of Fed Tightening Cycles
A Brief History Of Fed Tightening Cycles
Table 2Fed Tightening Cycles: Peak And Trough Levels
A Brief History Of Fed Tightening Cycles
A Brief History Of Fed Tightening Cycles
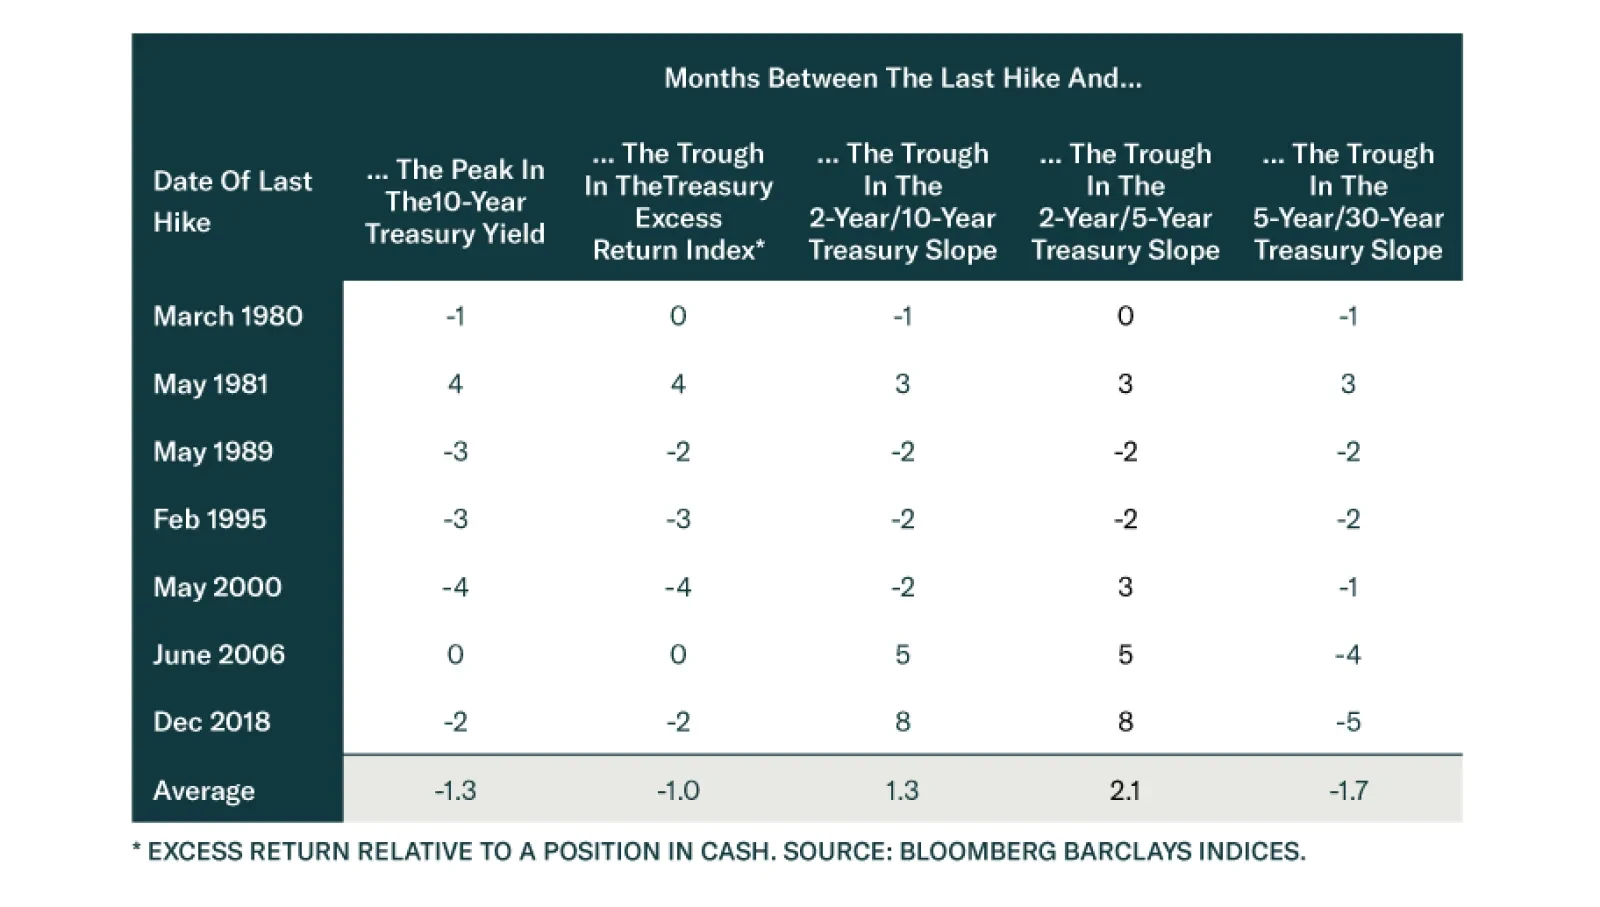
First, both the level of the 10-year Treasury yield and the Bloomberg Barclays Treasury Excess Return Index tend to hit inflection points around the time of the last rate hike of the cycle. On average, the 10-year Treasury yield peaks 1.3 months before the last rate hike of the cycle, and it has always hit its peak within a window spanning four months before the last hike and four months after. The timing of the trough in index excess returns versus cash looks similar. Second, the 2-year/10-year Treasury slope also tends to trough near the end of the Fed tightening cycle, but the timing of this inflection point varies a lot more than the timing of the peak in yields. In fact, during the last two cycles the 2-year/10-year slope didn’t trough until well after the last rate hike. Third, the 5-year/30-year Treasury slope always troughs at the same time or earlier than the 2-year/5-year Treasury slope. This is consistent with our intuition that the long end of the yield curve will respond more quickly to changes in the economic outlook than the front end of the curve, which remains more tied to the current policy rate. Fourth, there isn’t much consistency in where the 10-year Treasury yield peaks relative to the peak fed funds rate. On average, the 10-year yield tops out 120 bps below the peak fed funds rate, but there is a wide range of outcomes. The 10-year yield peaked 378 bps below the peak fed funds rate in the 1977-80 tightening cycle and it peaked 65 bps above the peak fed funds rate in the 2015-18 cycle. The same holds true for the slope of the Treasury curve. The trough in the slope exhibits a wide range of outcomes, though it is fair to say that we typically expect the slope to be negative when it bottoms. The 2-year/10-year Treasury slope only failed to invert in two tightening cycles (1994-95 and 2015-18) and in both of those cases the Fed was not expected to deliver a large number of rate cuts. In fact, it could have easily been argued that rate cuts were unnecessary based on the inflation and employment data at the time. Investment Implications In applying the lessons from this analysis to the current environment, the first conclusion we reach is that we should only look to extend portfolio duration to above-benchmark when we think that the last rate hike of the cycle will occur in 1-2 months. Currently, the market is priced for the fed funds rate to peak in June 2023 and we expect that peak could occur even later (Chart 8). For this reason, we anticipate another significant leg higher in Treasury yields before the cyclical peak is reached. Chart 8Rate Expectations
Rate Expectations
Rate Expectations
Our historical analysis of past tightening cycles also supports our recommended short 10-year bullet, long 5-year/30-year barbell positioning along the Treasury curve.1 Given that the 5-year/30-year Treasury slope has always troughed within a window spanning five months before the last rate hike and three months after, it makes sense to position for another leg down. This is a particularly attractive trade on the 5-year/30-year portion of the curve because that slope remains in positive territory. Ryan Swift US Bond Strategist rswift@bcaresearch.com Footnotes 1 For more details on this trade please see US Bond Strategy Weekly Report, “The Great Soft Landing Debate”, dated August 9, 2022. Recommended Portfolio Specification Other Recommendations Treasury Index Returns Spread Product Returns
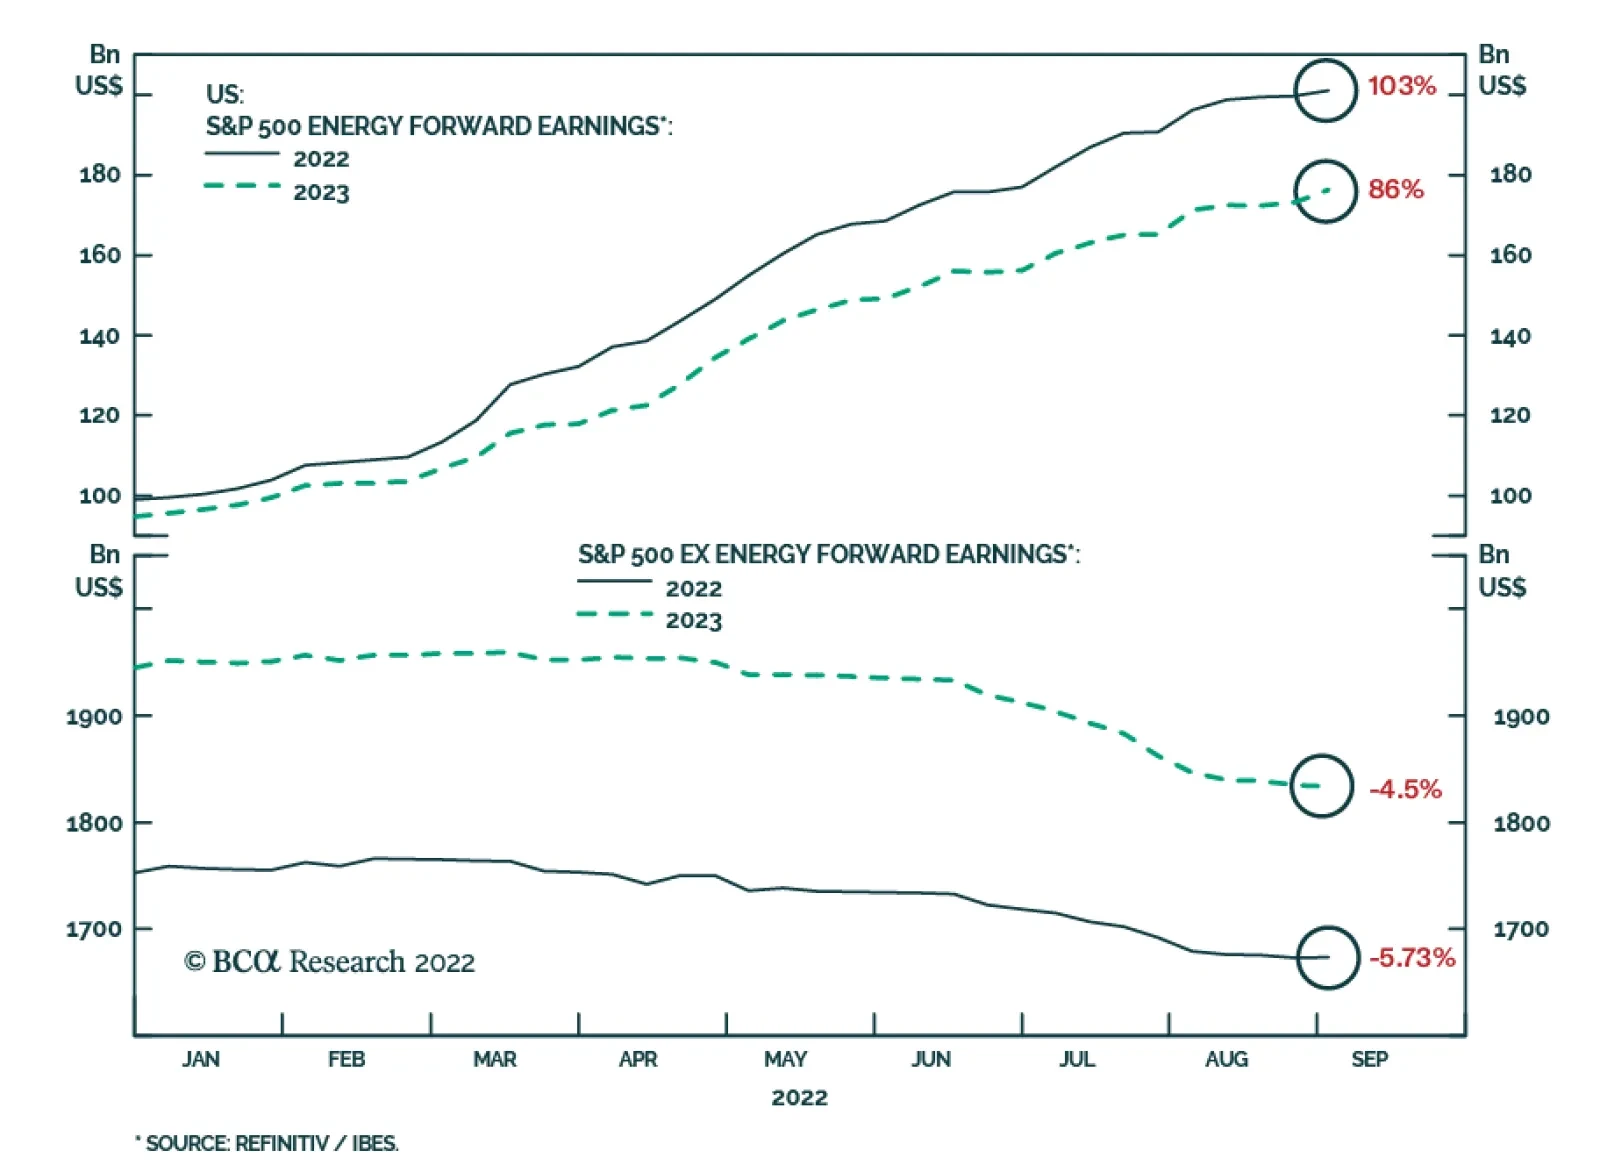
Analysts have been downgrading their S&P 500 earnings expectations for the past three months. Ongoing upwards revisions to estimates for the energy sector – which are currently 103% and 86% above where they stood at the start of the year for 2022 and…
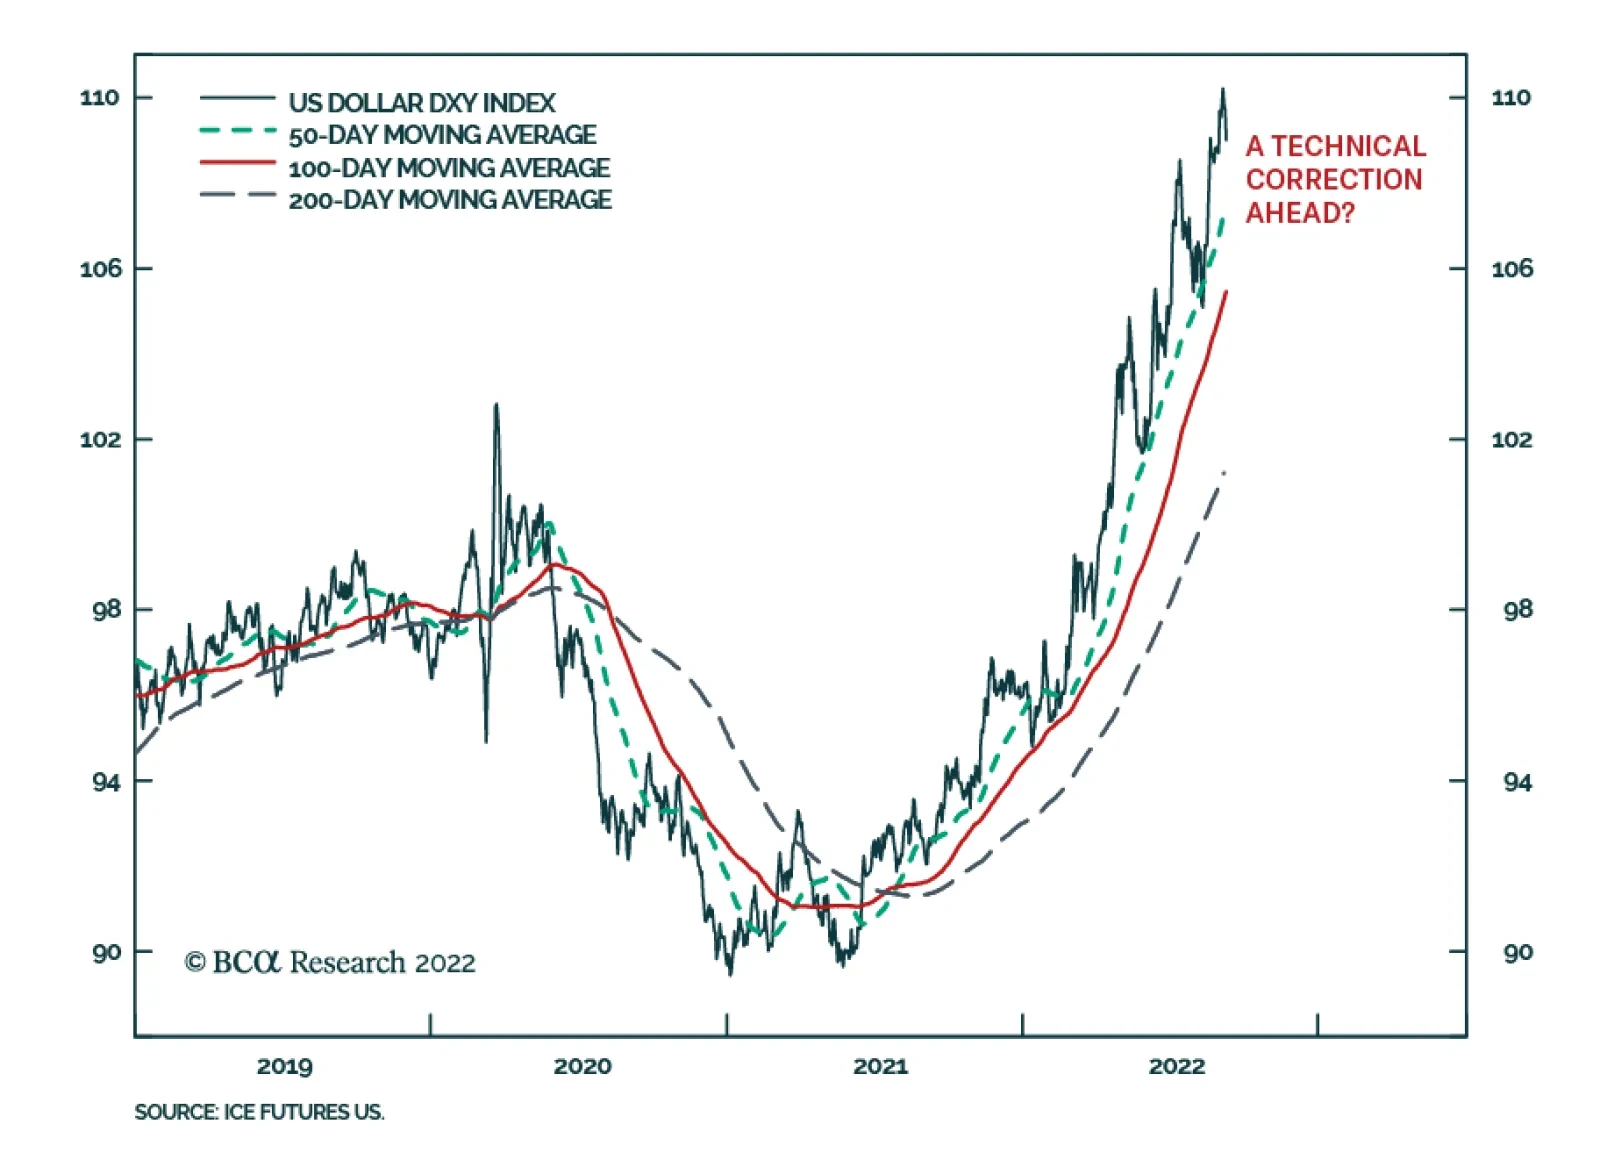
The DXY has fallen for the past four consecutive trading days, sliding 1.7% since last Tuesday’s close. The move has coincided with a hawkish outcome from last week’s ECB meeting. Does this mark the beginning of a sustained period of weakness for the dollar? …
Executive Summary Assessing the future scenarios discounted in asset prices is always a challenge, but investors need a consensus baseline so they can formulate their own investment strategy decisions. The conversations we had at BCA’s annual investment conference last week reinforced our view that investors are overly pessimistic about corporate earnings prospects. Fears about runaway compensation growth are unfounded. The money markets, on the other hand, appear to be overly blasé about the fed funds rate. We think terminal rate expectations will have to be revised higher and that investors will have to wait longer for rate cuts than the OIS curve currently projects. Margins Have Peaked, But They're Still High
Margins Have Peaked, But They're Still High
Margins Have Peaked, But They're Still High
Bottom Line: We remain more optimistic than the consensus over the immediate term and continue to recommend a risk-friendly tilt in multi-asset portfolios over the next six months. We are more cautious about the twelve-month outlook and recommend neutral positioning over that timeframe. Feature BCA held its first in-person conference in three years last week at The Plaza Hotel in New York. The agenda offered attendees a smorgasbord of thought-provoking discussions with recognized experts inside and outside of BCA. We enjoyed the programmed content as well as the impromptu interactions with speakers, attendees, our colleagues and the financial media. Again and again, our unplanned conversations homed in on questions about the expectations embedded in stock prices and bond yields. The future scenarios that securities prices are discounting cannot be directly observed and therefore can never be known definitively in real time. If investors do not continuously approximate them, however, they will be unable to evaluate the likelihood that actual outcomes will be better or worse than expected. Our view that markets and the economy can surprise on the upside has been built on the idea that expectations are overly gloomy. That is still our view on balance, as we think the S&P 500 is pricing in a worse near-term earnings outlook than is likely to occur, though we expect the Fed to surprise markets hawkishly before this rate hiking cycle ends. The combination of positive earnings surprises over the next few quarters and a negative monetary policy surprise coming sometime by the second half of next year leaves us optimistic about risk assets over the next six months but wary of them over the next twelve months and beyond. Earnings The analyst consensus currently estimates that S&P 500 earnings per share over the next four quarters will exceed the second quarter’s annualized run rate by just 0.3% and the trailing four quarters by 5.5% (Table 1). Modest as those expectations may be, we do not sense that investors are counting on them. Financial media reports and our discussions with clients and colleagues suggest that investors are braced for peak-to-trough earnings declines in the double digits, consistent with past recessions (Chart 1). Those bandying about estimates of a 10-20% decline are not necessarily calling for them to occur in the next four quarters, but we think it is clear that the forward S&P 500 whisper number is below the official I/B/E/S consensus. Table 1The Official Bar Is Low, The Whisper Bar Is Lower
What Are Markets Discounting?
What Are Markets Discounting?
Chart 1Recessions Are Hard On Earnings
Recessions Are Hard On Earnings
Recessions Are Hard On Earnings
For nominal earnings growth to miss such meager expectations while inflation is high, profit margins will have to contract sharply, but we would also expect declining revenues to play a major role, as in the 2001 and 2007-2009 recessions (Chart 2). That expectation follows from our view that nominal GDP growth is a solid proxy for S&P 500 sales growth (Chart 3), with nominal GDP explaining 41% of the variation in S&P 500 sales since 1997 (64% correlation). Nominal GDP grew at close to a 10% clip in the first half, and if inflation is around 6% in the second half, we would expect 8% growth over the next two quarters and about 6% growth in the first half of next year.1 Chart 2Sales Fall In Downturns, Too
Sales Fall In Downturns, Too
Sales Fall In Downturns, Too
Chart 3As Goes GDP, So Go Corporate Revenues
As Goes GDP, So Go Corporate Revenues
As Goes GDP, So Go Corporate Revenues
Despite the revenue buffer provided by 7% nominal GDP growth, we expect S&P 500 profit margins will extend their decline from the 2Q21 peak (Chart 4). Investors nearly unanimously expect that margins are imperiled, but we are more sanguine about the pace of the decline than the consensus and suspect the difference comes down to the pace of wage growth. Compensation is the largest expense category by a wide margin and has the capacity to move the aggregate margin needle on its own. Just as the US growth outlook may rest on consumption, compensation may be the key to margins’ future path. Chart 4A Slower-Than-Expected Decline
A Slower-Than-Expected Decline
A Slower-Than-Expected Decline
Much has been made of the shortage of available workers and its impact on wages, which are rising at the fastest pace in decades (Chart 5). In real terms, however, wage growth has been deeply negative ever since frontline workers stopped receiving hazard pay early in the pandemic (Chart 6). Real wages should find a footing as inflation cools and may eventually break into positive territory, but rampant talk of a wage-price spiral suggests that the consensus is factoring in much more. We think the prospects of a wage-price spiral like the one in the late seventies are being dramatically overestimated. Chart 5The Nominal Gains Have Been Great ...
The Nominal Gains Have Been Great ...
The Nominal Gains Have Been Great ...
Chart 6... But They're Way Behind Consumer Prices
... But They're Way Behind Consumer Prices
... But They're Way Behind Consumer Prices
We will not revisit the rationale for our wage-price spiral view in detail, but it is founded on the notion that workers’ current advantage, even if it were to persist for the rest of the Biden administration’s term, will not be sufficient to offset four decades of employers’ structural gains. Labor surely has the upper hand from a cyclical perspective – demand for workers exceeds supply – but we do not think it can convert its near-term advantage into durable gains. Private sector union membership has dwindled from over 30% at its mid-sixties peak to less than 7% today, leaving workers badly outgunned when trying to assemble a sellers’ cartel to counter the formidable buyers’ cartel enabled by 40 years of lax anti-trust enforcement. Even the “most pro-labor president leading the most pro-labor administration you’ve ever seen” isn’t likely to be able to counter several decades of weakened state-level labor protections.2 History says that employers will take as hard a line with their employees as is socially acceptable and what is deemed kosher has moved so far in their favor since President Reagan crushed the air traffic controllers’ union early in his first term that the seventies template does not apply. Monetary Policy If the earnings mood is unduly glum, however, it would seem to be offset by what strikes us as unfounded expectations that the Fed will stand down from its inflation fight before too long. Perhaps BCA strategists are a bit too credulous, but we are inclined to take the Fed at its word that, as former Vice Chair Richard Clarida put it at the conference, “failure [to subdue inflation] is not an option.” While we side with the consensus in our expectation that inflation will soon recede to 4% of its own accord as COVID bottlenecks are cleared, we judge that monetary and fiscal policymakers overstimulated aggregate demand in their efforts to shelter the economy from the pandemic. As a result, we expect that the Fed will have to administer much harsher monetary medicine to achieve its inflation mandate than markets are currently discounting. We have two objections to the money market’s fed funds rate expectations as derived from the overnight index swap curve (Chart 7). We think the fed funds rate will peak well north of 4% in this hiking cycle and there is almost no chance that the Fed will cut rates at any point in 2023. While markets have gotten more realistic about the monetary policy path than they were after the FOMC’s July meeting, we think they are still clinging to a vain hope. All financial assets will have to be repriced once it is snuffed out, and that repricing represents a significant risk to our constructive six-month view if it occurs before underweight asset managers are forced back into risk assets to protect their funds’ relative performance. Chart 7Magical Thinking
Magical Thinking
Magical Thinking
The wide range of views about the neutral, or equilibrium, rate that demarcates the line where the fed funds rate flips from accommodative to restrictive explains the terminal rate uncertainty. The neutral rate cannot be directly observed and everyone from investors to central bankers is left to infer its location from the variables that they can see. We think the neutral rate is north of 4%, possibly as high as 4.5-5%, especially given our view that inflation will likely linger at 4%. New York Fed president John Williams suggested in a Wall Street Journal interview two weeks ago that it may be in the mid-3s. “We need to get the interest rate, relative to where inflation is expected to be over the next year, into a positive space and probably even higher.” The article said Williams expects inflation to range between 2.5 and 3% next year, suggesting that the real funds rate is on course to turn positive this fall. Melting one-year inflation expectations as implied by TIPS break-evens suggest that it’s been rising in sizable chunks week after week since the FOMC’s July meeting (Chart 8). We would take the over on Thursday’s 1.71% close if only it were available on New York’s newly legalized online sports books but someone who does expect sub-2% inflation next year might logically conclude that the Fed will be cutting rates soon. Chart 8Garbage In, Garbage Out
Garbage In, Garbage Out
Garbage In, Garbage Out
Investment Implications Our conversations at the conference and its margins left us essentially where we began. We think investors are underestimating the economy’s ability to grow at a rate that will support continued corporate earnings growth over the next four quarters, albeit at a decelerating rate. On the other hand, we think markets face a reckoning when they are forced to price in a longer and more extensive rate hiking campaign than they currently expect. We square the circle from an investment strategy perspective by conditioning our views on investor timeframes. Because we think the earnings whisper numbers will be meaningfully revised higher before monetary policy expectations are reset more hawkishly, we remain tactically bullish. If rate expectations were to reset sooner than we currently expect (sometime early next year), our tactical call would be at significant risk and we would likely become as cautious over the six-month timeframe as we are over the twelve-month timeframe. As it stands now, we continue to recommend overweighting equities in balanced portfolios over the next six months while pursuing neutral risk asset positioning over timeframes of twelve months or more. Doug Peta, CFA Chief US Investment Strategist dougp@bcaresearch.com Footnotes 1 Our nominal growth expectations assume the US economy maintains real growth at close to its 2% trend level, as consumption is supported by households’ considerable excess savings, but we do not repeat our case here. 2 The weather is fine, and the Saturday football unmatched, but it is flimsy labor protections that drew Boeing’s Dreamliner assembly work and a slew of foreign automakers to the Southeastern Conference’s legacy Deep South footprint and the other states competing for good factory jobs have taken notice.
Executive Summary Central banks are aggressively tightening policy around the world. Their ability to rein in inflation without causing a recession depends upon the level of the real neutral rates. Australia, Canada, New Zealand, and Sweden have elevated r-stars, but the picture changes drastically when their large debt loads are factored in. While real policy rates remain below r-star across DM economies for now, a more rapid decline in supply-driven inflation would correct this situation. Consequently, a global recession does not constitute our base case for the next six months, although it is a growing threat. The ECB is front-loading interest rate increases while it can, but the destination of travel is not changing significantly. Global R-Star
Neutral Rates Around The World
Neutral Rates Around The World
Bottom Line: The global r-star varies greatly around the world and debt sustainability concerns weigh on the real neutral rates of Australia, Canada, New Zealand, and Sweden. The US economy remains best capable of handling higher interest rates. Chart 1Rising Global Inflation
Rising Global Inflation
Rising Global Inflation
Inflation around G10 economies has been very strong and much more durable than originally hoped. As a result, inflation now averages 7.1% on a headline CPI basis and 4.6% based on core CPI across among G10 economies (Chart 1). Central banks are tightening policy aggressively to prevent this elevated inflation from becoming entrenched. Essentially, they are aiming to avert the emergence of the kind of inflationary mentality that prevailed in the 1970s, which caused stubborn inflation during that decade. This exercise is fraught with difficulty. The objective is to achieve a policy setting that is slightly above the neutral rate of interest, but not too much so. On the one hand, keeping policy too accommodative will increase the chances that an inflationary mentality will emerge; on the other hand, if policy is tightened too much, a recession will become unavoidable and deflationary risks will escalate. A sense of where the neutral rate for major economies lies is therefore necessary to draw that line in the sand. To do so, we estimate the real neutral rate of interest for major DM economies using the methodology we introduced seven weeks ago, when we evaluated the neutral rates for the major Eurozone economies. This exercise shows that, at the current level of interest rates and inflation, policy among major economies remains accommodative. However, if inflation decelerates sharply in the coming months in response to declining global supply constraints and lower commodity prices, the recent increase in policy rates will have already gone a long way to normalizing monetary policy around the world. A Simple Approach The methodology we use is based on the approach developed by Holston, Laubach, and Williams (HLW) to estimate the neutral real interest rate – or “r-star.” Specifically, we run regressions between the real interest rates in the US, Japan, the UK, New Zealand, Canada, Australia, Sweden, and Switzerland versus trend GDP growth and current account balances, which approximate the savings-investment balance. Mimicking the HLW methodology, the inflation expectations used to extract real interest rates from nominal short rates reflect an adaptative framework whereby inflation expectations are a function of the ten-year moving average of core CPI.1 Table 1Unadjusted R-Stars
Neutral Rates Around The World
Neutral Rates Around The World
The results are shown in Table 1. New Zealand, Australia, and Canada have the highest real-neutral rate of the major economies. They have had stronger growth over the past 20 years because of their rapid population growth caused by high immigration rates. Moreover, their commodity-based economies and their booming construction sectors pushed up investment rates, which requires high interest rates to attract sufficient savings to finance. Sweden and the US follow. These two economies have lower population growth rates than the commodity producers; nonetheless, they outperform Japan and the other European nations in the survey on that dimension. Moreover, they fare comparatively well in terms of productivity growth, which implies that their trend growth – a key driver of the neutral rate – is also higher than that of the UK, Japan, Switzerland, or the Euro Area. The US’s r-star shows up as being slightly below what would be expected based on its potential GDP growth. This surprising outcome most likely reflects the role of the dollar in global FX reserves and its standing at the core of the global financial system. These two characteristics of the greenback create an important demand for dollar-denominated assets that is dissociated from US domestic economic fundamentals. This additional demand biases downward the US real neutral rate and suggests that weak trend growth abroad and global excess savings remain important forces for US financial markets. Chart 2Japan's Dissociated Real Rates
Japan's Dissociated Real Rates
Japan's Dissociated Real Rates
Japan displays a surprisingly elevated real neutral rate of 0.1%. This result reflects the limitation of the approach. Japanese interest rates have been at zero since the late 1990s and real rates have been negatively correlated with inflation because of this nominal rigidity (Chart 2). However, while Japanese inflation has averaged a paltry 0.2% since 1997, it has nonetheless fluctuated with commodity prices and global economic activity. As a result, real rates have been essentially dissociated from Japanese domestic drivers. Hence, an empirical approach based on the evolution of domestic economic variables yields poor results for Japan. Instead, the lack of inflation when public debt has increased by 200% of GDP over the past 32 years and Japan’s large net international investment position imply that its r-star is inferior to that of the other countries in the sample, and thus should lie below -1%. For the Eurozone, we use the average result of our July study, which estimated the neutral rates of Germany, France, Italy, and Spain independently. Germany flatters this estimate since its real neutral rate stands near 0%. An average, excluding Germany, would be closer to -0.5%, or well below the US r-star. Meanwhile, the Swiss r-star is depressed by both a low population growth and the Swiss exceptional savings generation, as highlighted by its current account surplus that has averaged 8% of GDP over the past 20 years. Finally, the UK’s r-star stands at the bottom of the pack. The UK’s productivity growth has been very poor over the past ten years, averaging 0.7% per annum. This points to a weak potential GDP for that economy. Moreover, the hurdles to UK growth have only increased in recent years with the implementation of Brexit, which is hurting the availability of labor in the country, while putting the UK at an even greater disadvantage in European markets, its largest export destination. What About Debt? This approach to estimating r-star ignores a key dimension: debt sustainability. If we factor in this crucial variable, the level of interest rates causing economic activity to decelerate changes drastically for many countries. Chart 3Massive Real Estates Bubbles
Massive Real Estates Bubbles
Massive Real Estates Bubbles
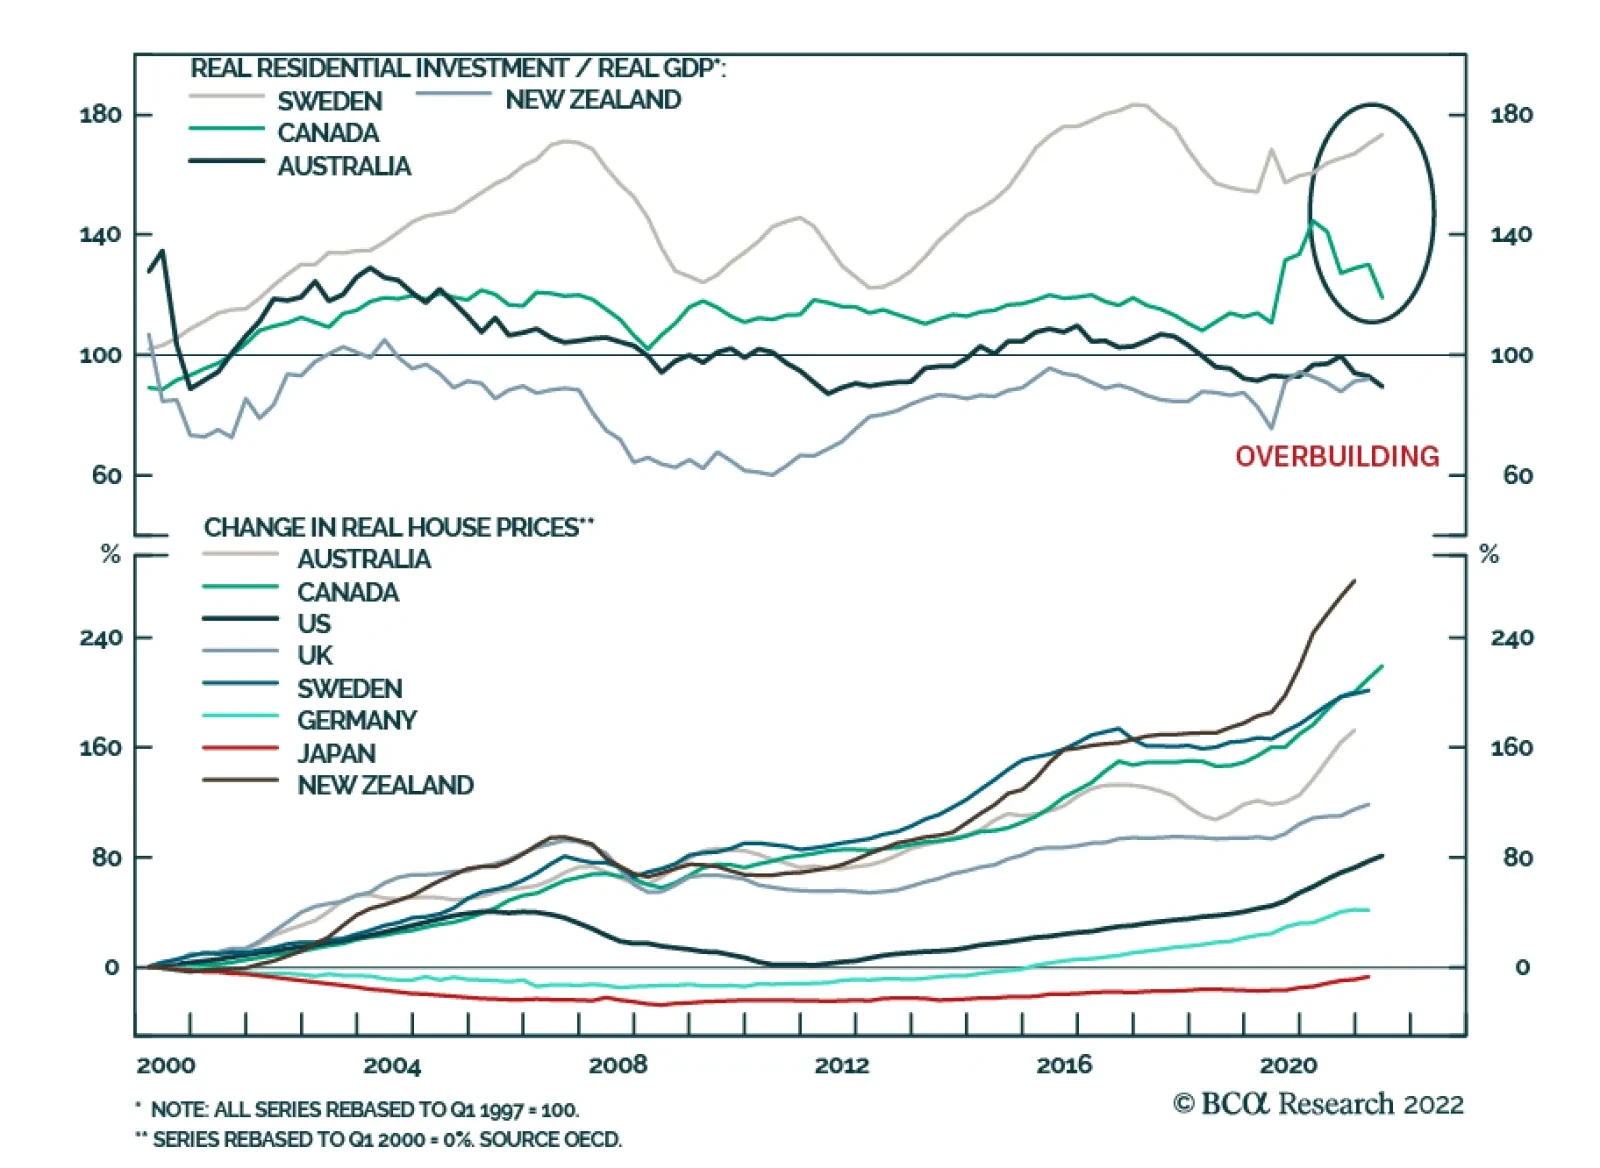
Since 2000, real estate prices have surged by 280%, 220%, 170%, and 200% in New Zealand, Canada, Australia, and Sweden, respectively. These gains dwarf the house price appreciation observed in the US, the UK, Japan, or Germany (Chart 3, top panel). This outperformance of house prices is particularly problematic because it does not reflect more rapid underlying cash-flow growth from the assets. Instead, the main driver of the stronger house prices in New Zealand, Canada, Australia, and Sweden has been the explosion of their price-to-rent and price-to-income ratios (Chart 3, bottom two panels). Rising real estate prices boosted economic activity relative to the underlying trend GDP of these countries. As a result, the long-term growth numbers of these four nations potentially overstate their underlying rate of growth. Even more importantly, real estate prices and activity are extremely sensitive to interest rates. Therefore, the risk of bursting bubbles in New Zealand, Canada, Australia, and Sweden limits how high interest rates may rise there without causing growth to plunge and deflationary spirals to emerge. Chart 4Rapidly Rising Debt Loads
Rapidly Rising Debt Loads
Rapidly Rising Debt Loads
The accumulation of debt in these four countries accentuates the threats to growth created by real estate activity. The private-sector debt of New Zealand, Canada, Australia, and Sweden has risen much more quickly than has been the case in Germany and the US (Chart 4). Ultimately, these debt burdens create major headwinds against higher interest rates and suggest that the effective r-star of these nations lies well below the estimates constructed using only trend growth and the savings/investment balance. Table 2Drastic Changes Once Debt Is Accounted For
Neutral Rates Around The World
Neutral Rates Around The World
To account for the private-sector leverage, we estimated new debt-adjusted r-stars. The impact of high debt loads on r-star estimates is evident in Table 2. The average real neutral rate of New Zealand, Australia, and Canada drops from 1.9% to -1.9%. In fact, Australia and Canada would sport the lowest r-star estimates of the nations under study. Sweden’s neutral rate also experienced a big decline from 0.6% to 0.2%. The US r-star estimate is also lowered by the addition of debt metrics in its equation, declining from 0.2% to -0.4%. The Eurozone average r-star experiences a significant decrease as well, driven mostly by Spain and France. The Swiss economy also sports a large private debt load, and its r-star is therefore curtailed from -0.75% to -1.3%. Finally, Japan’s r-star estimate barely changes, which confirms that the approach does not work well for that country. The greatest drawback of the method is that it is backward-looking. The main force that has brought down the global r-star over the past 20 years is the collapse in trend growth among most advanced economies (Chart 5). Consequently, neutral rates could improve from their current low levels if trend growth were to pick up in the coming years. On the positive side, the current age of the capital stock in both Europe and the US is extremely advanced (Chart 6), which suggests that a capex upturn is likely. Such an upturn would boost productivity and lift the r-star among most major economies. On the negative side, the growth of human capital is deteriorating as educational attainment stalls among most DM nations. The decline in the growth rate of human capital is a large threat to productivity over the coming decades. These problems are magnified in the Eurozone, as its high degree of economic fragmentation, lack of common fiscal policy, and higher regulatory burden create further handicaps to trend growth. Chart 5R-star And Global Growth
R-star and Global Growth
R-star and Global Growth
Chart 6A Capex Revival?
A Capex Revival?
A Capex Revival?
Bottom Line: Estimating the real neutral rates for the global economy often relies on trend growth and the savings/investment balance. However, such an approach often misses the vulnerability to higher interest rates created by high private-sector indebtedness. If this constraint is considered, the high r-star recorded in countries like New Zealand, Australia, or Canada is reduced dramatically. The US r-star also declines but significantly less so. As we already showed seven weeks ago, the same phenomenon is also visible in the Eurozone, albeit driven by France and Spain, not Germany or Italy. Investment Implications There are three main conclusions from the analysis above. First, the risk of a financial accident in commodity-producing economies is growing increasingly large. On the one hand, economies like New Zealand, Australia, and Canada are buoyed by the recent surge in commodity prices, with agricultural prices up 90% since their 2020 lows, metal prices up 68%, and energy prices up 340% since April 2020. On the other hand, the inflationary pressures created by robust commodity sectors invite the RBNZ, the RBA, and the BoC to lift interest rates quickly, which is hurting massively indebted private sectors. Already, in response to the 275bps and 300bps of hikes implemented by the RBNZ and the BoC, house prices in New Zealand have begun to buckle, down 12% and since their more recent peaks, and they are expected to plunge by as much as 25% in Canada by the end of next year. Chart 7NZD And CAD At A Disadvantage
Neutral Rates Around The World
Neutral Rates Around The World
This suggests that non-commodity equities in Canada, Australia, and New Zealand, especially financials, could experience significant periods of underperformance, both against their domestic equity benchmark and global market averages. Additionally, while the NZD, AUD, and CAD all benefit from improving terms of trades, the potential for domestic weakness is such that these currencies are likely to lag their historical sensitivity to commodity price fluctuations. In fact, according to BCA’s foreign exchange strategist, the New Zealand and Canadian dollars are among the most expensive currencies in the G10 (Chart 7), and thus, it is likely to underperform other pro-cyclical currencies once the USD bull market reverses. Second, the neutral rate in the US has risen by 200bps relative to the rest of the world over the past seven years. The US economy has undergone a long deleveraging period in the wake of the GFC, which means that its private-debt-to-GDP ratio has declined relative to other advanced economies. Consequently, the vulnerability of the US economy to higher interest rates has decreased, even if relative US trend growth has not improved meaningfully. The market implications of this pickup in the neutral rate are manifold. To begin with, it allows US rates to rise further relative to other DM economies. BCA’s Global Fixed Income Strategy team continues to underweight US Treasurys in global fixed-income portfolios, especially relative to German Bunds (Chart 8). As a corollary, it also means that US financials are likely to continue to outperform their foreign peers, especially Canadian and Australian ones which will bear the brunt of the negative consequences of their debt bubbles. The increase in the US r-star relative to the rest of the world has been a key contributor to the dollar rally. It helps explain why the recent dollar strength has not hurt relative profit growth (Chart 9). However, the dollar is trading at a 32% premium to its purchasing power parity, or the same overvaluation as in 1985 and 2001. Thus, with the worsening US balance of payment picture, the US dollar is vulnerable to an eventual improvement in global growth next year. Chart 8US Rate Differentials Have Upside
Neutral Rates Around The World
Neutral Rates Around The World
Chart 9The US Fares Better
The US Fares Better
The US Fares Better
Chart 10Easy Or Not?
Easy Or Not?
Easy Or Not?
Finally, despite the recent increase in rates, the high level of inflation recorded around the world implies that real policy rates are still well below r-star for major global economies, whether one uses actual inflation or the smooth formulation recommended by the HLW paper (Chart 10). This suggests that a recession is unlikely, especially in the US. The recession threat is higher in Europe but has little to do with policy. It is mostly a consequence of the massive terms of trade shock caused by the sudden jump in European energy prices in the wake of the Ukrainian war. However, because policy remains accommodative even in Europe, it follows that the Eurozone economy will rebound quickly once the worst of the energy shock is over next spring. Some humility is required. It is hard to gauge how much of the inflation surge over the past 18 months reflects supply factors. If inflation suddenly becomes much weaker because the easing in supply constraints has a greater-than-anticipated impact on inflation, real interest rates would jump rapidly around the world. In this scenario, policy rates could rise quickly and overtake r-star. This would mean that the disinflation impulse could rapidly morph into an outright deflationary environment, which implies that the odds of a deflationary bust like the one experienced in 1921 is greater than the market currently prices in. Bottom Line: The debt-fueled real estate bubbles in the dollar-bloc economies suggests that they are at a greater risk of a financial accident than the US or the Eurozone. As a result, their financial sector looks vulnerable. Meanwhile, the higher US r-star compared to that of the rest of the world will continue to support higher yields in the US rather than in Europe or Japan. This phenomenon has been hugely positive for the US dollar, but it has likely run its course. Finally, global real interest rates remain below r-star estimates. Hence, the current slowdown is likely to prove to be a mid-cycle slowdown and Europe will rebound quickly from a potential recession caused by the recent surge in its energy prices. The ECB Joins The 75bps Club Last week, the ECB increased interest rates by 75bps, which brought its deposit rate to 0.75%. Interestingly, the euro did not rally much in response to this policy decision, even though it has not been fully discounted by the market. At first glance, the lack of responsiveness from European assets seems strange, especially since the vote for a 75bps rate hike was unanimous. The ECB is taking advantage of strong economic numbers to push up rates rapidly. The Eurozone Q2 GDP growth was robust at 0.6%, while the unemployment rate hit an all-time low of 6.6%. Meanwhile, inflation continues to beat consensus forecasts, with Eurozone core CPI and headline CPI standing at 4.3% and 9.1%, respectively in August. Chart 11Big ECB Revisions
Big ECB Revisions
Big ECB Revisions
The market believes that more rapid interest rate hikes now will not translate into a much higher terminal rate, with the expected rates for June 2023 moving from 2.2% on September 7th to 2.4% after last Thursday’s decision. The ECB may have increased its inflation forecasts for the whole horizon, but it has also brought down GDP forecasts to 0.9% and 1.9% in 2023 and 2024, respectively (Chart 11). Moreover, ECB President Christine Lagarde went out of her way to telegraph to investors that the number of upcoming hikes was finite. The jumbo hike does not spell the start of a euro rally—for now. First, the lack of major change in the ECB’s terminal deposit rate is more important than the more rapid pace of hikes for the remainder of 2022. Second, the Fed is also lifting rates faster than investors expected ahead of the Jackson Hole meeting three weeks ago. Third, the euro remains vulnerable to any flare-ups in the energy market. True, natural gas and electricity prices have recently fallen, but the situation in Ukraine continues to be highly fluid, which suggests that volatility will linger in the energy market over the coming weeks. Despite the near-term hurdles, the euro’s medium-term outlook is brightening. We are gaining confidence in our thesis that energy prices will peak once natural gas inventories have reached approximately 90% by November. Additionally, the support of the Governing Council’s doves for a 75bps hike suggests that they received something in exchange for their votes. In our view, this “something” is an activation of the Transmission Protection Instrument (TPI) before year-end. The TPI activation will allow for a normalization of the risk premia in the Italian debt market and will support the ECB’s ability to increase interest rates further down the road, despite the much lower r-star in Italy, Spain, and France than in Germany (Table 3). Table 3The Eurozone’s Different R-Stars Will Force The TPI’s Activation
Neutral Rates Around The World
Neutral Rates Around The World
Bottom Line: The ECB may have delivered a jumbo hike last week, but its market impact was muted. Investors understand full well that the ECB is taking advantage of the recent bout of robust economic activity to front-load interest rate increases ahead of a likely economic contraction in Q4 2022 and Q1 2023. As a result, the terminal rate estimates have scarcely moved. Ultimately, we expect the ECB deposit rate to settle between 1.5% and 2% in the summer of 2023. While the move may not provide much of a boost to the euro in the near term, conditions are falling into place for a euro rally later this year. Mathieu Savary, Chief European Strategist Mathieu@bcaresearch.com Footnotes 1 For the US, we opted for core PCE, since it is the benchmark inflation measure the Federal Reserve uses.
The softening housing market in the US is unlikely to tip the overall economy into a recession, or to worsen it significantly. We’ve highlighted that the scarcity of homes in the US will put a floor under the decline in home prices and will continue to…
According to BCA Research’s Global Investment Strategy service, although a drop in home prices would have adverse effects on aggregate consumer spending, the impact this time around will be far smaller than during the Great Recession. As occurred with…
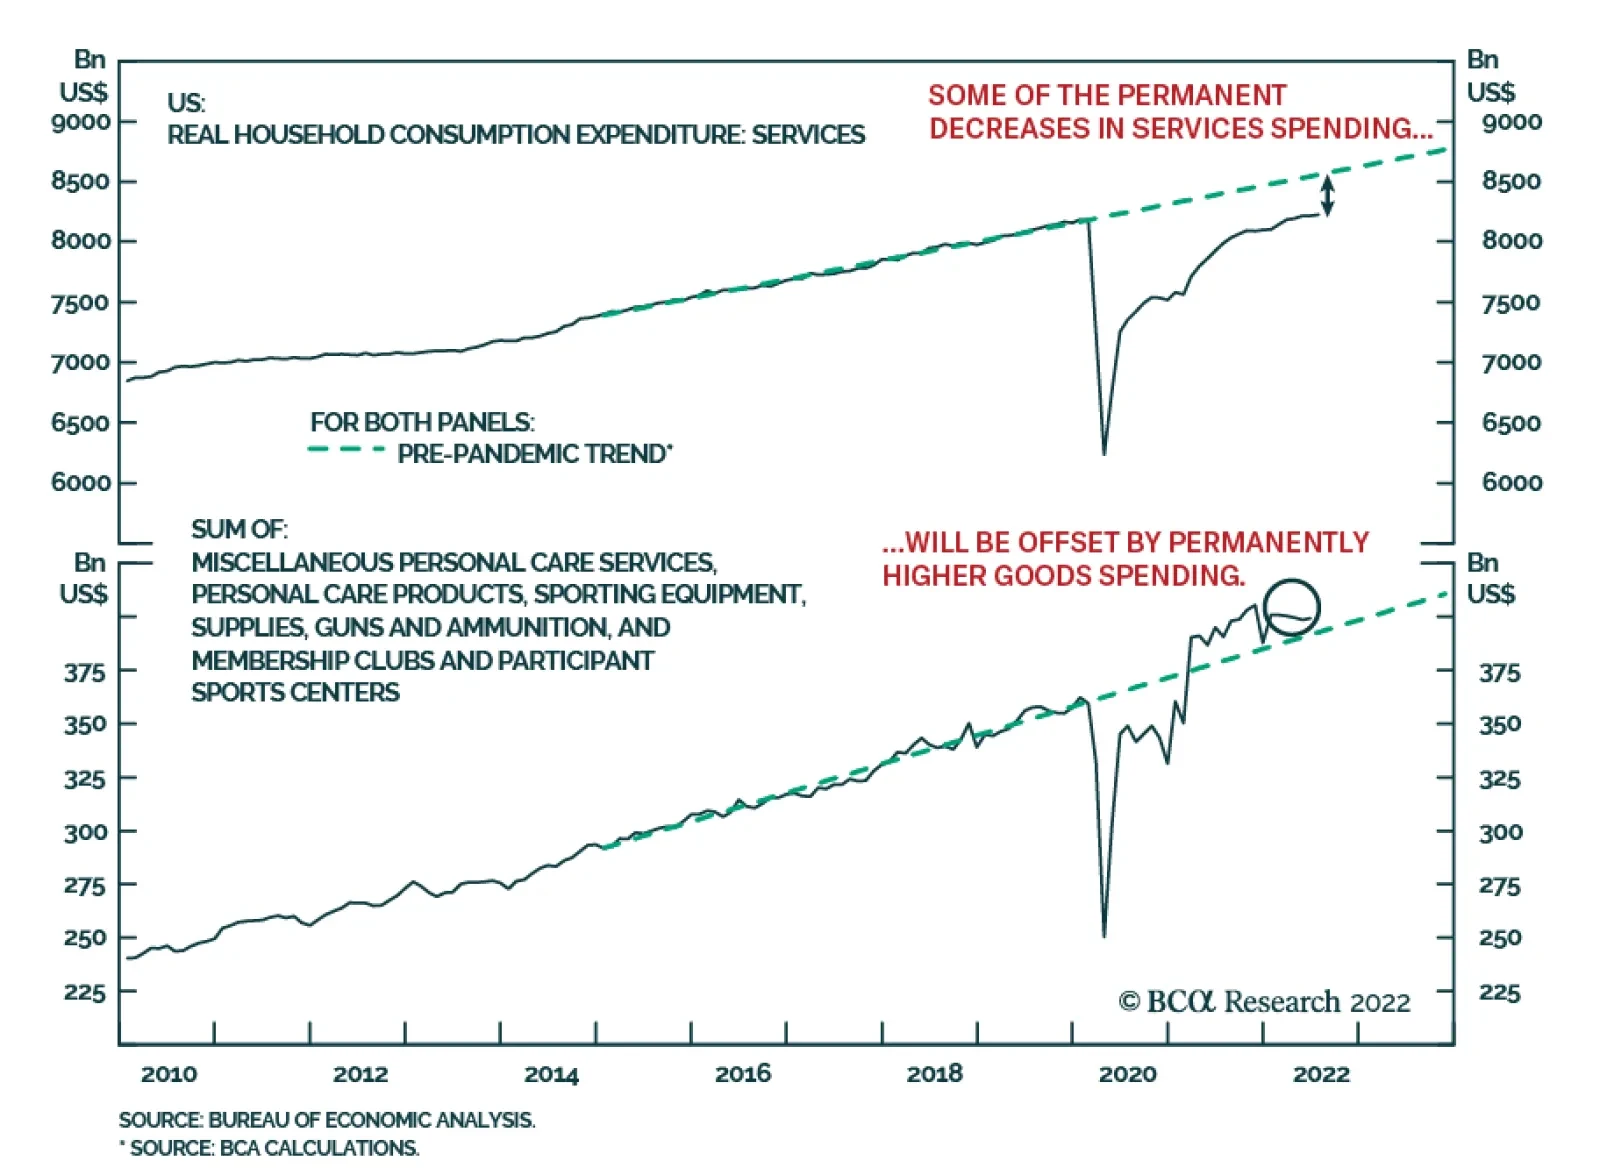
The demand normalization away from goods – which have been subject to intense price pressures – to services, is one of the factors that will contribute to lower overall inflation. However, a case can be made that services spending may…