United States

Next week, on September 7-8, is the BCA New York Conference, the first in-person version since 2019. I look forward to seeing many of you there, and if you haven’t already booked your place, you still can! (a virtual version is also available). As such, the next Counterpoint report will come out on September 15. Executive Summary The 2022-23 = 1981-82 template for markets is working well. If it continues to hold, these are the major investment implications: Bonds: The 30-year T-bond (price) will trend sideways for the next few months, albeit with a potential correction that lifts the yield to 3.5 percent. However, bond prices will enter a sustained rally in 2023, in which the 30-year T-bond yield will fall to sub-2.5 percent. Stocks: A coordinated global recession will depress profits, causing the S&P 500 to test 3500. However, once past the worst of the recession, a strong rally will lift it through 5000 later in 2023. Sector allocation: Longer duration defensive sectors (such as healthcare) will strongly outperform shorter duration cyclical sectors (such as basic resources) until mid-2023, after which it will be time to flip back into cyclicals. Industrial metals: A tactical rebound in copper could lift it to $8500/MT after which the structural downtrend will resume, taking it to sub-$7000/MT in 2023. Oil: Just as in 1981-82, supply shortages will provide near-term support. But ultimately, demand destruction will dominate, depressing the price to, at best, $85, though our central case is $55 in 2023. If 2022-23 = 1981-82, Then This Is What Happens To The Copper Price
If 2022-23 = 1981-82, Then This Is What Happens To The Copper Price
If 2022-23 = 1981-82, Then This Is What Happens To The Copper Price
Bottom Line: The 2022-23 = 1981-82 template for markets is working well, and should continue to do so. Feature History doesn’t repeat, but it does rhyme. And the period that rhymes closest with the current episode in the global economy and markets is 1981-82, a rhyming which we first highlighted four months ago in Markets Echo 1981, When Stagflation Morphed Into Recession, and then developed in More On 2022-23 = 1981-82, And The Danger Ahead. In those reports, we presented three compelling reasons why 2022-23 rhymes with 1981-82: 1981-82 is the period that rhymes closest with the current episode in the global economy and markets. First, the simultaneous sell-off in stocks, bonds, inflation protected bonds, industrial commodities, and gold in the second quarter of 2022 is uniquely linked with an identical ‘everything sell-off’ in the second quarter of 1981. It is extremely rare for stocks, bonds, inflation protected bonds, industrial commodities, and gold to sell off together. Such a simultaneous sell-off has happened in just these 2 calendar quarters out of the last 200. Meaning a ‘1-in-a-100’ event conjoins 2022 with 1981 (Chart I-1 and Chart I-2). Chart I-1A 1-In-A-100 Event: The 'Everything Sell-Off' In 2022...
A 1-In-A-100 Event: The 'Everything Sell-Off' In 2022...
A 1-In-A-100 Event: The 'Everything Sell-Off' In 2022...
Chart I-2...And The 'Everything Sell-Off' In 1981
...And The 'Everything Sell-Off' In 1981
...And The 'Everything Sell-Off' In 1981
Second, the Jay Powell Fed equals the Paul Volcker Fed. Now just as then, the world’s central banks are obsessed with ‘breaking the back’ of inflation. And now, just as then, the central banks are desperate to repair their badly battered credibility in managing inflation. Third, the Russia/Ukraine war that started in February 2022 equals the Iraq/Iran war that started in September 1980. Now, just as then, a war between two commodity producing neighbours has unleashed a supply shock which is adding to the inflation paranoia. To repeat, it is a 1-in-a-100 event for all financial assets to sell off together. This is because it requires an extremely rare star alignment. Inflation fears first morph to stagflation fears and then to recession fears. Leaving investors with nowhere to hide, as no mainstream asset performs well in inflation, stagflation, and recession. So, the once-in-a-generation star alignment conjoining 2022 with 1981 is as follows: Inflation paranoia is worsened by a major war between commodity producing neighbours, forcing reputationally damaged central banks to become trigger-happy in their battle against inflation, dragging the world economy into a coordinated recession. September 2022 Equals August 1981 If 2022-23 = 1981-82, then where exactly are we in the analogous episode? There are two potential synchronization points. One potential synchronization is that the Russia/Ukraine war which started on February 24, 2022 equals the Iraq/Iran war which started on September 22, 1980. In which case, September 2022 equals April 1981. But given that inflation is public enemy number one, a better synchronization is the Fed’s preferred measure of underlying inflation, the US core PCE deflator. Aligning the respective peaks in core PCE inflation, we can say that February 2022 equals January 1981. Meaning that our original report in May 2022 aligned with April 1981, and September 2022 equals August 1981 (Chart I-3 and Chart I-4). Chart I-3The Peak In Core PCE Inflation In ##br##February 2022
The Peak In Core PCE Inflation In February 2022
The Peak In Core PCE Inflation In February 2022
Chart I-4...Aligns With The Peak In Core PCE Inflation In ##br##January 1981
...Aligns With The Peak In Core PCE Inflation In January 1981
...Aligns With The Peak In Core PCE Inflation In January 1981
In which case, how has the template worked since we introduced it on May 19th? The answer is, very well. The template predicted that the long bond price would track sideways, which it has. The template predicted that the S&P 500 would decline from 4200 to 4000, which it has. The template predicted that the copper price would decline from $9250/MT to $8500/MT. In fact, it has fallen even further to $8200/MT. In the case of oil, the better synchronization is the starts of the respective wars. This template predicted that the Brent crude price would decline sharply from a knee-jerk peak in the $120s, which it has. Not a bad set of predictions! If 2022-23 = 1981-82, Here’s What Happens Next Assuming the template continues to hold, here are the major implications for investors: Bond prices will enter a sustained rally in 2023. Bonds: The 30-year T-bond (price) will trend sideways for the next few months, albeit with a potential tactical correction that takes its yield to 3.5 percent. However, bond prices will enter a sustained rally in 2023 in which the 30-year T-bond yield will fall to sub-2.5 percent (Chart I-5). Chart I-5If 2022-23 = 1981-82, Then This Is What Happens To Bond Prices
If 2022-23 = 1981-82, Then This Is What Happens To Bond Prices
If 2022-23 = 1981-82, Then This Is What Happens To Bond Prices
Stocks: A coordinated global recession will depress profits, causing the S&P 500 to test 3500 in the coming months. However, once past the worst of the recession, a strong rally will lift it through 5000 later in 2023 (Chart I-6). Chart I-6If 2022-23 = 1981-82, Then This Is What Happens To Stock Prices
If 2022-23 = 1981-82, Then This Is What Happens To Stock Prices
If 2022-23 = 1981-82, Then This Is What Happens To Stock Prices
Sector allocation: Longer duration defensive sectors (such as healthcare) will strongly outperform shorter duration cyclical sectors (such as basic resources) until mid-2023, after which it will be time to flip back into cyclicals (Chart I-7). Chart I-7If 2022-23 = 1981-82, Then This Is What Happens To Sector Allocation
If 2022-23 = 1981-82, Then This Is What Happens To Sector Allocation
If 2022-23 = 1981-82, Then This Is What Happens To Sector Allocation
Industrial metals: A tactical rebound in copper could lift it to $8500/MT after which the structural downtrend will resume, taking it to sub-$7000/MT in 2023 (Chart I-8). Chart I-8If 2022-23 = 1981-82, Then This Is What Happens To The Copper Price
If 2022-23 = 1981-82, Then This Is What Happens To The Copper Price
If 2022-23 = 1981-82, Then This Is What Happens To The Copper Price
Oil: Just as in 1981-82, supply shortages will provide near-term support. But ultimately, demand destruction will dominate, depressing the price to, at best, $85 (Chart I-9) though our central case is $55 in 2023. Chart I-9If 2022-23 = 1981-82, Then This Is What Happens To The Oil Price
If 2022-23 = 1981-82, Then This Is What Happens To The Oil Price
If 2022-23 = 1981-82, Then This Is What Happens To The Oil Price
But What If 2022-23 Doesn’t = 1981-82? And yet, and yet…what if the Jay Powell Fed doesn’t equal the Paul Volcker Fed? What if central banks lose their nerve before inflation is slayed? Long bond yields could gap much higher, or at least not come down, causing a completely different set of investment outcomes. In this case, the correct template would not be 1981-82, but the 1970s. If central banks lose the stomach to slay inflation, then the consequent housing market crash will do the job for them. However, there is one huge difference between now and the 1970s, which makes that template highly unlikely. In the 1970s, the global real estate market was worth just one times world GDP, whereas today it has become a monster worth four times world GDP, and whose value is highly sensitive to the long bond yield. In the US, the mortgage rate has surged to well above the rental yield for the first time in 15 years. Simply put, it is now more expensive to buy than to rent a home, causing a disappearance of would be homebuyers, a flood of home-sellers, and an incipient reversal in home prices (Chart I-10). Chart I-10If Bond Yields Don't Come Down, Then House Prices Will Crash
If Bond Yields Don't Come Down, Then House Prices Will Crash
If Bond Yields Don't Come Down, Then House Prices Will Crash
Hence, if long bond yields were to gap much higher, or even stay where they are, it would trigger a housing market crash whose massive deflationary impulse would swamp any inflationary impulse. The upshot is that the 2022-23 = 1981-82 template would suffer a hiatus. Ultimately though, it would come good, because a crash in the $400 trillion global housing market would obliterate inflation. In other words, if central banks lose the stomach to slay inflation, then the consequent housing market crash will do the job for them. Fractal Trading Watchlist As just discussed, copper’s tactical rebound is approaching exhaustion. This is confirmed by the 130-day fractal structure of copper versus tin reaching the point of extreme fragility that has consistently marked turning-points in this pair trade (Chart I-11). Chart I-11Copper's Tactical Rebound Is Exhausted
Copper's Tactical Rebound Is Exhausted
Copper's Tactical Rebound Is Exhausted
Hence, this week’s recommendation is to short copper versus tin, setting the profit target and symmetrical stop-loss at 12 percent. Chart 1Expect Hungarian Bonds To Rebound
Expect Hungarian Bonds To Rebound
Expect Hungarian Bonds To Rebound
Chart 2Copper Is Experiencing A Tactical Rebound
Copper Is Experiencing A Tactical Rebound
Copper Is Experiencing A Tactical Rebound
Chart 3US REITS Are Oversold Versus Utilities
US REITS Are Oversold Versus Utilities
US REITS Are Oversold Versus Utilities
Chart 4FTSE100 Outperformance Vs. Euro Stoxx 50 Is Vulnerable To Reversal
FTSE100 Outperformance Vs. Euro Stoxx 50 Is Vulnerable To Reversal
FTSE100 Outperformance Vs. Euro Stoxx 50 Is Vulnerable To Reversal
Chart 5Netherlands' Underperformance Vs. Switzerland Has Ended
Netherlands' Underperformance Vs. Switzerland Has Ended
Netherlands' Underperformance Vs. Switzerland Has Ended
Chart 6The Sell-Off In The 30-Year T-Bond At Fractal Fragility
The Sell-Off In The 30-Year T-Bond At Fractal Fragility
The Sell-Off In The 30-Year T-Bond At Fractal Fragility
Chart 7Food And Beverage Outperformance Is Exhausted
Food And Beverage Outperformance Is Exhausted
Food And Beverage Outperformance Is Exhausted
Chart 8German Telecom Outperformance Has Started To Reverse
German Telecom Outperformance Has Started To Reverse
German Telecom Outperformance Has Started To Reverse
Chart 9Japanese Telecom Outperformance Vulnerable To Reversal
Japanese Telecom Outperformance Vulnerable To Reversal
Japanese Telecom Outperformance Vulnerable To Reversal
Chart 10The Strong Trend In The 18-Month-Out US Interest Rate Future Has Ended
The Strong Trend In The 18-Month-Out US Interest Rate Future Has Ended
The Strong Trend In The 18-Month-Out US Interest Rate Future Has Ended
Chart 11The Strong Downtrend In The 3 Year T-Bond Has Ended
The Strong Downtrend In The 3 Year T-Bond Has Ended
The Strong Downtrend In The 3 Year T-Bond Has Ended
Chart 12A Potential Switching Point From Tobacco Into Cannabis
A Potential Switching Point From Tobacco Into Cannabis
A Potential Switching Point From Tobacco Into Cannabis
Chart 13Biotech Is A Major Buy
Biotech Is A Major Buy
Biotech Is A Major Buy
Chart 14Norway's Outperformance Has Ended
Norway's Outperformance Has Ended
Norway's Outperformance Has Ended
Chart 15Cotton Versus Platinum Has Reversed
Cotton Versus Platinum Has Reversed
Cotton Versus Platinum Has Reversed
Chart 16Switzerland's Outperformance Vs. Germany Is Exhausted
Switzerland's Outperformance Vs. Germany Is Exhausted
Switzerland's Outperformance Vs. Germany Is Exhausted
Chart 17USD/EUR Is Vulnerable To Reversal
USD/EUR Is Vulnerable To Reversal
USD/EUR Is Vulnerable To Reversal
Chart 18The Outperformance Of MSCI Hong Kong Versus China Has Ended
The Outperformance Of MSCI Hong Kong Versus China Has Ended
The Outperformance Of MSCI Hong Kong Versus China Has Ended
Chart 19US Utilities Outperformance Vulnerable To Reversal
US Utilities Outperformance Vulnerable To Reversal
US Utilities Outperformance Vulnerable To Reversal
Chart 20The Outperformance Of Oil Versus Banks Is Exhausted
The Outperformance Of Oil Versus Banks Is Exhausted
The Outperformance Of Oil Versus Banks Is Exhausted
Dhaval Joshi Chief Strategist dhaval@bcaresearch.com Fractal Trading System Fractal Trades
Markets Still Echoing 1981-82, So Here’s What Happens Next
Markets Still Echoing 1981-82, So Here’s What Happens Next
Markets Still Echoing 1981-82, So Here’s What Happens Next
Markets Still Echoing 1981-82, So Here’s What Happens Next
6-12 Month Recommendations Structural Recommendations Closed Fractal Trades Indicators To Watch - Bond Yields Chart II-1Indicators To Watch - Bond Yields - Euro Area
Indicators To Watch - Bond Yields - Euro Area
Indicators To Watch - Bond Yields - Euro Area
Chart II-2Indicators To Watch - Bond Yields - Europe Ex Euro Area
Indicators To Watch - Bond Yields - Europe Ex Euro Area
Indicators To Watch - Bond Yields - Europe Ex Euro Area
Chart II-3Indicators To Watch - Bond Yields - Asia
Indicators To Watch - Bond Yields - Asia
Indicators To Watch - Bond Yields - Asia
Chart II-4Indicators To Watch - Bond Yields - Other Developed
Indicators To Watch - Bond Yields - Other Developed
Indicators To Watch - Bond Yields - Other Developed
Indicators To Watch - Interest Rate Expectations Chart II-5Indicators To Watch - Interest Rate Expectations
Indicators To Watch - Interest Rate Expectations
Indicators To Watch - Interest Rate Expectations
Chart II-6Indicators To Watch - Interest Rate Expectations
Indicators To Watch - Interest Rate Expectations
Indicators To Watch - Interest Rate Expectations
Chart II-7Indicators To Watch - Interest Rate Expectations
Indicators To Watch - Interest Rate Expectations
Indicators To Watch - Interest Rate Expectations
Chart II-8Indicators To Watch - Interest Rate Expectations
Indicators To Watch - Interest Rate Expectations
Indicators To Watch - Interest Rate Expectations
Executive Summary The US dollar has become expensive, but it is not unusual for currencies to overshoot or undershoot their fair value. Valuation is not an effective market timing tool. In the US, high interest rates and a strong exchange rate are needed to bring down inflation. The US dollar will remain firm as long as the Fed maintains its credibility in the fight against inflation. China needs lower interest rates and a weaker currency to battle deflationary pressures. The PBoC will continue cutting interest rates. Persistent divergence between Chinese and US monetary policies heralds further yuan depreciation against the dollar. For a number of EM countries, exchange rate fluctuations have historically determined trends in their interest rates rather than the other way around (i.e., interest rates dictating EM currency trends). Shrinking global trade will boost the US dollar while EM currencies will depreciate further. The US Dollar Is Expensive But Could Still Overshoot
The US Dollar Is Expensive But Could Still Overshoot
The US Dollar Is Expensive But Could Still Overshoot
Bottom Line: We continue to short the following currencies versus the USD: ZAR, COP, PEN, PLN and IDR. In addition, we recommend shorting HUF vs. CZK, KRW vs. JPY, and BRL vs. MXN. Macro forces that are bullish for the US dollar are bearish for global equities and other risk assets. A defensive investment stance is still warranted. Feature The US dollar is now in expensive territory (Chart of the week above) but we maintain our view that the US dollar is poised to overshoot. Chart 1EM Currencies Are Breaking Down
EM Currencies Are Breaking Down
EM Currencies Are Breaking Down
BCA’s Emerging Markets Strategy team has been structurally bullish on the US dollar since 2011, with a brief period during which we sidestepped our positive view from July 9, 2020 until late March 2021 (Chart 1). We then re-instated short positions in select EM currencies versus the US dollar on March 25, 2021. This strategy has paid off. In this report, we discuss reasons why we expect the greenback to continue overshooting in the near run. Currency Valuations In Appendix 1 we present our valuation models for various currencies using the real effective exchange rate (REER) based on unit labor costs. In our opinion, the REER based on unit labor costs is the most accurate measure of exchange rate valuation. The basis is that it takes into account both wages and productivity. Labor costs are the largest cost component for many companies, and unit labor costs are critical to competitiveness. Hence, this measure is superior to the ones based on CPI and PPI. Table 1Currency Valuation Ranking Using Real Effective Exchange Rate Based on Unit Labor Costs*
The US Dollar Will Overshoot, EM Currencies Will Undershoot
The US Dollar Will Overshoot, EM Currencies Will Undershoot
The underlying data for the REER based on unit labor costs are from the IMF and OECD. Unfortunately, the IMF and OECD do not provide REER based on unit labor costs for many emerging economies. Appendix 1 contains valuation indicators for those EM exchange rates (MXN, CLP, COP, KRW, SING, PLN, HUF and CZK) for which IMF or OECD data is available. Charts 15-17 in the appendix show that the US dollar is currently more than one standard deviation above its fair value. Meanwhile, the euro and yen are extremely cheap – each standing at more than one standard deviation below their respective fair value. Table 1 shows the valuation ranking of various currencies using REER based on unit labor costs. For mainstream EM currencies, excluding China, Russia, Korea and Taiwan, we have built valuation aggregates using an average REER based on CPI and PPI measures. Chart 2 presents an equal-weighted aggregate REER based on CPI and PPI for 15 EM currencies. This indicator does not suggest that mainstream EM currencies are cheap. Finally, the same indicator − REER based on CPI and PPI – for the Chinese yuan reveals that the currency is modestly cheap (0.8 standard deviation below its mean) (Chart 3). Chart 2Mainstream EM Currencies Are Not Cheap
Mainstream EM Currencies Are Not Cheap
Mainstream EM Currencies Are Not Cheap
Chart 3The RMB Is Modestly Cheap But Might Undershoot
The RMB Is Modestly Cheap But Might Undershoot
The RMB Is Modestly Cheap But Might Undershoot
While we acknowledge that the US dollar is expensive, we continue to expect the greenback to overshoot over the coming months. First, valuations matter only at extremes. Most currencies (other than the yen and the euro) are not cheap. For example, Charts 21-24 (in the Appendix) demonstrate that commodity currencies including AUD, NZD, and NOK are on the expensive side, while the Canadian dollar is fairly valued. Second, our macro themes – a hawkish Fed and contracting global trade (discussed below) − call for a stronger greenback. Finally, our Foreign Exchange Strategy team has shown that momentum indicators work well for currency trading in the short term. Bottom Line: The US dollar has become expensive, but it is not unusual for currencies to overshoot or undershoot their fair value. Valuation is not an effective market timing tool. Presently, the US dollar's momentum is strong and it will likely continue supporting the currency's upward trajectory. Monetary Policy Divergence Chart 4US Core Inflation Is Well Above 2%
US Core Inflation Is Well Above 2%
US Core Inflation Is Well Above 2%
The US economy is relatively less exposed to headwinds from rising interest rates than the rest of the world. This dynamic favors the US dollar against other currencies. US: We view US inflation as genuine and entrenched. The average of seven measures of underlying inflation remains very elevated at 5.5% (Chart 4). In the US, high interest rates and a strong exchange rate are needed to bring down inflation. As long as the Fed remains committed to bringing down inflation, the US dollar will be firm. The US dollar will plummet if the Fed turns dovish prematurely. The basis is that US inflation expectations will spike and real interest rates will tumble, which will weigh on the dollar. Although the Fed might eventually pivot earlier than needed, this policy shift is not imminent. China: In contrast with the US, China’s inflation is too low: core and services CPI inflation have rolled over and are below 1% (Chart 5). The mainland economy is extremely weak, and the property market is struggling. China needs lower interest rates and a weaker currency to battle deflationary pressures. The PBoC will continue cutting interest rates. Persistent divergence between Chinese and US monetary policies heralds further yuan weakness against the dollar (Chart 6). Chart 5China's Inflation Is Too Low And Falling
China's Inflation Is Too Low And Falling
China's Inflation Is Too Low And Falling
Chart 6The CNY Will Depreciate Versus The USD
The CNY Will Depreciate Versus The USD
The CNY Will Depreciate Versus The USD
A weakening RMB versus the US dollar is typically associated with declining commodity prices (Chart 7). Falling commodity prices will weigh on commodity currencies. The yuan depreciation will also continue reinforcing the downtrend in emerging Asian currencies. Mainstream EM: For many emerging markets, interest rates do not explain fluctuations in their currencies. In developing countries that run current account deficits and/or rely on foreign capital, interest rates rise when their exchange rates plummet (Chart 8). Chart 7CNY Depreciation = Lower Commodity Prices
CNY Depreciation = Lower Commodity Prices
CNY Depreciation = Lower Commodity Prices
Chart 8Interest Rates Do Not Drive EM FX
Interest Rates Do Not Drive EM FX
Interest Rates Do Not Drive EM FX
On the flip side, appreciating EM currencies unleash disinflationary pressures in their domestic economies, giving room for central banks to cut rates. Therefore, for EM economies that are dependent on global capital, it is exchange rates that have historically dictated interest rate dynamics, rather than the other way around. Continental Europe: The European economy is hamstrung by extremely high energy prices and rising interest rates. Importantly, wages in Europe are not rising as fast as they are in the US. Household real disposable income is falling faster in Europe than it is in the US. Plus, the continental European economy is more exposed than the US to global trade − which is about to contract (more on this below). Thus, the European economy has a reduced capacity to absorb higher borrowing costs vis-a-vis the US. Consequently, the real interest rate differential will continue moving in favor of the US, supporting the greenback versus the euro. The Anglo-Saxon block: The US economy will prove to be more resilient to higher borrowing costs than many other DM economies such as the UK, Australia, New Zealand and Canada. As a result, the interest rate differential will move in favor of the US dollar. Chart 9US Households Have Deleveraged
US Households Have Deleveraged
US Households Have Deleveraged
In many of these countries, the household debt burden is higher than it is in the US. In fact, US consumer debt and debt servicing have fallen significantly over the past 15 years (Chart 9). Importantly, a considerable portion of outstanding mortgages in the UK, Australia, New Zealand and Canada have either a floating rate or a fixed rate for only a few years. As borrowing costs rise, consumer finances in these countries will experience material distress. By comparison, the majority of outstanding US mortgages are fixed for 30 years or so. Hence, rising borrowing costs hurt new American homebuyers but do not impact existing mortgage holders. Bottom Line: On a relative basis, the US is in a better position to absorb higher interest rates than many other economies. As a result, the interest rate differential will move in favor of the US over the rest of the world, hence, supporting the greenback in the near run. Shrinking Global Trade Is Bullish For The US Dollar The US dollar is a counter-cyclical currency, and it will continue to appreciate as the global manufacturing cycle slows (Chart 10). The rationale is that manufacturing and exports constitute a smaller share of GDP in the US than in many other major economies. What if Fed over-tightening, causes a recession and pushes down US interest rates considerably? Would the US dollar plunge in this case? We do not believe so. Instead, a recession could be positive for the broad trade-weighted dollar. As US domestic demand and consumption shrink, its imports will also drop. The US dollar often rallies when the nation’s imports are contracting (Chart 11). Chart 10The US Dollar Is A Counter-Cyclical Currency
The US Dollar Is A Counter-Cyclical Currency
The US Dollar Is A Counter-Cyclical Currency
Chart 11Shrinking US Imports = Rising US Dollar
Shrinking US Imports = Rising US Dollar
Shrinking US Imports = Rising US Dollar
Dwindling imports mean that the US will be emitting fewer dollars to the rest of the world. Global US dollar liquidity will continue to shrink, and the greenback will rally further, including against EM currencies (Chart 12). Bottom Line: As global trade shrinks, the US dollar will extend its rally. Mainstream EM Currencies In the long run, return on capital – not interest rate differentials – drive mainstream EM currencies. Chart 12 illustrates that EM currencies depreciate when their return on equity differential versus the US is negative and vice versa. In turn, the key driver of return on capital is productivity. Productivity growth has been downshifting across mainstream EMs since 2007 (Chart 13). Chart 12Tightening Global USD Liquidity = A Strong US Dollar
Tightening Global USD Liquidity = A Strong US Dollar
Tightening Global USD Liquidity = A Strong US Dollar
Chart 13EM vs. US: Relative Return On Capital And Exchange Rates
EM vs. US: Relative Return On Capital And Exchange Rates
EM vs. US: Relative Return On Capital And Exchange Rates
Weak productivity growth and lower return on capital (versus the US) explain EM currency and equity underperformance since 2010. We have not yet detected a major change in EM fundamentals. Investment Strategy Chart 14Weak EM Productivity = EM Currency Depreciation
Weak EM Productivity = EM Currency Depreciation
Weak EM Productivity = EM Currency Depreciation
The US dollar will overshoot in the near term. We continue to short the following currencies versus the USD: ZAR, COP, PEN, PLN and IDR. In addition, we recommend shorting HUF vs. CZK, KRW vs. JPY, and BRL vs. MXN. When the dollar appreciates it is neither the time to be long EM risk assets in absolute terms nor to be overweight EM in global equity and fixed-income portfolios. We continue underweighting EM in global equity and credit portfolios. EM local currency bonds offer value, but further currency depreciation and more rate hikes by their central banks are near-term risks to EM domestic bonds. Arthur Budaghyan Chief Emerging Markets Strategist arthurb@bcaresearch.com Appendix Chart 15The US Dollar
The US Dollar
The US Dollar
Chart 16The Japanese Yen
The Japanese Yen
The Japanese Yen
Chart 17The Euro
The Euro
The Euro
Chart 18The British Pound
The British Pound
The British Pound
Chart 19The Swiss Franc
The Swiss Franc
The Swiss Franc
Chart 20The Swedish Krona
The Swedish Krona
The Swedish Krona
Chart 21The Norwegian Krone
The Norwagain Krone
The Norwagain Krone
Chart 22The Canadian Dollar
The Canadian Dollar
The Canadian Dollar
Chart 23The Australian Dollar
The Australian Dollar
The Australian Dollar
Chart 24The New Zealand Dollar
The New Zealand Dollar
The New Zealand Dollar
Chart 25The Korean Won
The Korean Won
The Korean Won
Chart 26The Singapore Dollar
The Singapore Dollar
The Singapore Dollar
Chart 27The Mexican Peso
The Mexican Peso
The Mexican Peso
Chart 28The Chilean Peso
The Chilean Peso
The Chilean Peso
Chart 29The Colombian Peso
The Colombian Peso
The Colombian Peso
Chart 30The Polish Zloty
The Polish Zloty
The Polish Zloty
Chart 31The Hungarian Forint
The Hungarian Forint
The Hungarian Forint
Chart 32The Czech Koruna
The Czech Koruna
The Czech Koruna
Footnotes Strategic Themes (18 Months And Beyond) Equities Cyclical Recommendations (6-18 Months) Cyclical Recommendations (6-18 Months)
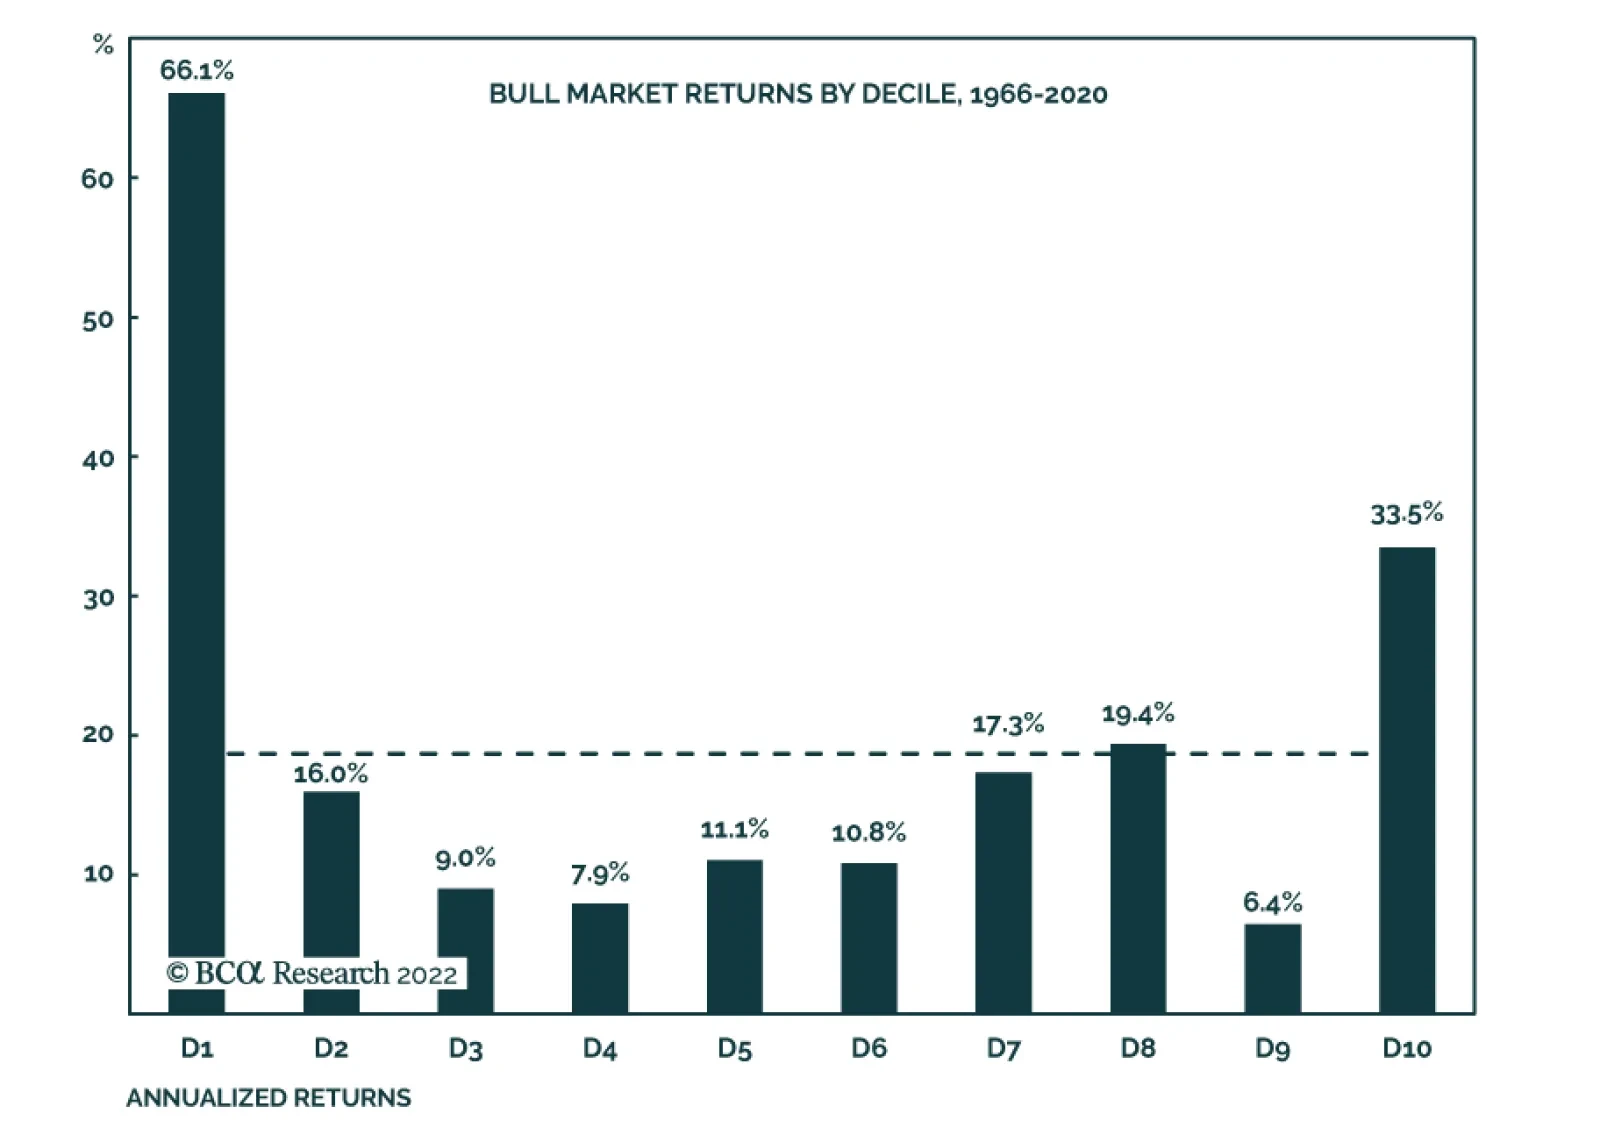
Our US Investment strategists have shown that bull markets – defined as the period between two NBER-designated recessions – have the tendency to start off with a bang, and sprint to the finish line. A decomposition into deciles of the nine bull markets…
Dear Clients, Next week we will attend the BCA Investment Conference in New York. Therefore we will not publish our regular report. We will resume regular publication in the week of September 12. We apologize in advance for any inconvenience. Thank you, Matt Gertken, Senior Vice President US Political Strategy Executive Summary Top Issues On Voters’ Minds
Waiting On The Biden Doctrine
Waiting On The Biden Doctrine
President Biden has a foreign policy but not yet a foreign policy doctrine. The Biden Doctrine will emerge after critical tests. These tests are likely to be imminent, signaling more volatility and negative surprises for global investors. The three key foreign policy tests are: the Russia-EU energy crisis, the Iran nuclear crisis, and the fourth Taiwan Strait crisis. Of these, only Iran is looking like it could become a win for Biden – and a boon for markets – but even there deal is not yet confirmed. Biden’s foreign policy is domestically focused given the looming midterm elections. The result is likely to be high or higher volatility in the short run. Recommendation (Tactical) INITIATION DATE Return Long DXY (Dollar Index) Feb 23, 2022 13.1% Bottom Line: Stay defensive and long US dollar in the short run. The fourth quarter could be a turning point but for now political risk remains negative for risk assets. Feature Successful US presidents establish a foreign policy doctrine. The doctrine should not be defined by ideas and ideals but rather by the test of reality and experience – i.e. the decisions the president makes during crises. The Biden administration has a foreign policy and it has been tested in Ukraine. The focal point is to strengthen US alliances – even if that means deferring to allies’ interests on critical points. For example, while the US wanted to sell natural gas to Europe at the expense of Russia, Biden approved of Germany’s decision to finish building and operate the Nord Stream 2 pipeline to Russia in summer 2021. He condoned this decision even though Russia was already threatening Ukraine with invasion. Once Russia invaded, Germany froze the pipeline. The US had given its ally a choice, the choice ended badly, and now the ally is more certain that its interest lies with the United States. Bottom Line: The Biden administration’s foreign policy aims to restore US alliances and thus looks for the common denominator among allies. Biden’s Reactive Foreign Policy Biden’s foreign policy is fundamentally defensive, not offensive like that of the Trump administration. Trump initiated a trade war with China and others, revoked several international deals, tried to build a wall on the Mexican border, and imposed “maximum pressure” sanctions on Iran. By contrast, Biden, who entered office with a weak grip on Congress and a rebellion at the capitol, preferred to focus on domestic politics and social issues. He preferred to be reactive rather than proactive abroad, slapping sanctions on Russia only after it invaded Ukraine and so far avoiding major new sanctions on Iran or China. Biden’s foreign policy has also been reactive in the sense that it aims to win the approval of his domestic audience. Biden is a first-term US president, he faces midterm elections and the potential for re-election in 2024 – and the odds for him and his party are not great (Chart 1). Elections encourage him to maximize domestic legislation and minimize risks on the international scene. Chart 1Midterm Election Odds From The Street
Waiting On The Biden Doctrine
Waiting On The Biden Doctrine
The second term – when the president is no longer eligible for re-election and could become a “lame duck” – is opportune for prioritizing national interests over partisan interests and taking risks abroad. The 2022 midterm election fits into this rubric: Biden’s foreign policy this year has been domestically focused and will continue to be through November. Biden’s goal must be balanced: to pursue his foreign policies but avoid worsening the Democratic Party’s difficulties at the voting booth. Our quantitative election models show that Democrats are likely to lose 21 seats in the House of Representatives (Table 1) and two seats in the Senate (Chart 2), thus losing control of all Congress to Republicans. The Senate is uncertain but the House is not. Given that the Senate is highly competitive, Biden must tread carefully to avoid worsening the economy or suffering a policy humiliation. Table 1BCA’s US House Election Quant Model
Waiting On The Biden Doctrine
Waiting On The Biden Doctrine
Chart 2BCA’s US Senate Election Quant Model
Waiting On The Biden Doctrine
Waiting On The Biden Doctrine
Hence while sanctions on Russia have pushed up energy prices and given ammunition to critics at home, Biden has encouraged Europe to take a pragmatic and gradual approach so as to soften the blow. The EU agrees for its own reasons and the oil embargo will not fully kick in until December 5, after the midterm election. Bottom Line: The Biden administration’s foreign policy is focused on its domestic audience, which means that midterm elections will continue to drive US foreign policy this year. Taking Risks Before The Midterms Since May we have observed that the Ukraine war and Biden’s midterm woes have stirred the administration into taking greater risks in its foreign policy. If American interests are asserted, Biden will look stronger at home. If a crisis erupts, Americans will rally around the flag. For example, Biden agreed to sell long-range artillery rockets (HIMARS) to Ukraine and provide higher value targeting intelligence to Ukraine. Biden expanded export controls on China and agreed to send legislators and eventually a new arms package to Taiwan. The current crisis in the Taiwan Strait arose because of the Biden administration’s initiatives – House Speaker Nancy Pelosi’s trip. Similarly Biden has not, as of August 31, provided Iran with the concessions necessary to clinch a nuclear agreement, raising the risk of rising tensions across the Middle East. He has slightly expanded sanctions, though, to be fair, the odds of an Iran deal are not low.1 We are contrarians on this issue and have put the odds of a deal at 40%, but rumors are swirling in the news media that a deal is at hand. In short, with his job approval rating falling to a net negative 13 percentage points (net negative 18 percentage points on his handling of the economy), Biden is increasingly willing to take foreign policy risks. The domestic focus of foreign policy is overwhelming its initial defensiveness. Biden’s policy is becoming more offensive, albeit still not to the same degree as the Trump administration’s. This shift in foreign policy does not line up well with what voters want. Voter priorities for the midterms are shaping up as follows: Economy: Voters are far more concerned about the economy than anything else (Chart 3, first panel). Biden’s foreign policy actions – sanctions on oil producers like Russia and Iran and tariffs on manufacturers like China – add to inflation, which is the top concern for voters within the economic sphere. Society: Voters are concerned about a range of social grievances such as gun policy, health care, crime, the electoral system. Abortion access and gun rights have become more important over the year, while foreign policy and energy policy have become less important (Chart 3, second panel). Foreign Policy: True, Biden’s foreign policy can tap into unfavorable views of Russia, Iran, and China (Chart 3, third panel). But voters are not demanding a more hawkish foreign policy in this election, so Biden’s decision to take more foreign policy risks this year must come from somewhere else. That somewhere else is the need to respond to foreign events, such as Russian invasions, but there is also the political expediency of stirring up nationalism, as is clear in the case of China. Chart 3Top Issues On Voters’ Minds
Waiting On The Biden Doctrine
Waiting On The Biden Doctrine
Bottom Line: Voters are focused on the economy and social issues but Biden must respond to international challenges. In doing so, Biden is increasingly willing to take risks as the Democrats could benefit from any crisis that leads to an outburst of nationalism and patriotism. Biden’s Foreign Policy And Anti-Inflation Drive Back in June the Biden administration unveiled an anti-inflation plan that consisted of (1) Fed rate hikes (2) a reconciliation bill (3) budget discipline. We pointed out that the first option was the only one that would truly reduce inflation – but that it would also bring recession within a year or two. Once the reconciliation bill passed, we showed how the Inflation Reduction Act would increase budget deficits and inflation, especially when taken along with other new legislation like the Chips and Science Act. More recently Biden’s $500 billion plan for student debt forgiveness has underscored the continuing inflationary bent of his policies. Gasoline prices have come down slightly over the summer but not to the extent that Democrats can declare victory (Chart 4). Midterm voters will feel the year-on-year increase in headline inflation. Chart 4Prices At The Pump
Prices At The Pump
Prices At The Pump
Market-based inflation expectations are rising again and consumers still report very high expectations for the one-year period, which is most relevant this fall (Chart 5). This brings us to Biden’s three foreign policy options for reducing inflation: reduce tensions with Russia, lift sanctions on Iran, and lift tariffs on China. Back in June we doubted that any of these would come to fruition. Now Biden faces a series of tests that will define his foreign policy doctrine: Chart 5Inflation Expectations Unabated
Inflation Expectations Unabated
Inflation Expectations Unabated
European Energy Crisis: Biden faces a European energy crisis stemming from Russia’s clash with NATO. Biden is providing Ukraine with extensive support in the form of money and weapons. That will continue in the short run as the Ukrainians are launching a counter-offensive against Russia. There are some signs of Russia signaling a willingness to negotiate but until Russia defeats the new counter-offensive it is highly unlikely to offer any serious concessions, or to relieve the pressure on Europe. The Biden administration has not yet accepted Russia’s broader demands, namely on the topic of NATO enlargement and whether NATO will ever try to station military bases in Finland or Sweden when they join the alliance (Table 2). Russia’s reaction to western policy is to constrict Europe’s energy supply further – namely shutting down the Nord Stream 1 pipeline – which will also tighten American energy supply via exports and exacerbate energy price inflation and expectations (Chart 6). Table 2US Response To Russia’s Demands On Finland, Sweden
Waiting On The Biden Doctrine
Waiting On The Biden Doctrine
Biden can allow slippage on sanction enforcement prior to the midterm but still his Russia policy will be a source of both conflict and inflation. Chart 6Russia Squeezes Europe Harder
Russia Squeezes Europe Harder
Russia Squeezes Europe Harder
Iranian Nuclear Crisis: Biden faces an Iranian nuclear crisis but it could be resolved quickly through a return to the 2015 nuclear deal. Apparently Biden is closer to clinching a deal. But the US and Iran do not trust each other, as shown in Chart 3 above. Biden could unilaterally relieve sanctions and allow Iranian their oil exports to pick up substantially (Chart 7). He can overcome Congress after a 30-day delay. But any deal will alienate the Saudi Arabians, who are threatening to cut oil production and reverse the oil price drop that Biden is seeking on behalf of US voters. So Iran is an option for Biden but it is not very compelling: the oil can be traded regardless of any deal. Biden’s capitulation would hurt politically without helping much economically. However, the failure of a deal poses a greater risk of instability in the Middle East and inflationary energy price shocks. So Biden faces an immediate and critical foreign policy test on this issue. Chart 7Iranian Oil Exports By Destination
Waiting On The Biden Doctrine
Waiting On The Biden Doctrine
Fourth Taiwan Strait Crisis: Biden also faces a crisis in relations with China over the One China Policy and the status quo in the Taiwan Strait. This is the fourth such crisis since 1954. In previous crisis the US sent aircraft carriers through the strait, including in 1995-96. But it is not clear that Biden will do so given that China’s capabilities are much greater today (Map 1). The crisis probably will not be resolved before the midterm election since China will remain firm given its own domestic concerns this fall. Recently there emerged a tentative deal on the US auditing Chinese firms that list on US stock exchanges and an attempt to restart talks on climate change cooperation. The US and China are still talking despite tensions. But Biden has ruled out the option of reducing tariffs … which would only marginally have reduced inflation anyway. Map 1US Aircraft Carriers Suggest Taiwan Risk Is Substantial
Waiting On The Biden Doctrine
Waiting On The Biden Doctrine
Bottom Line: Biden faces three foreign policy crises that threaten to exacerbate inflation. In each case he will likely uphold US security interests at the expense of higher inflation expectations in the short run. Investment Takeaways The Biden administration has a foreign policy but it does not yet have a foreign policy doctrine. The Biden Doctrine will be forged in the crucible of experience. The critical tests look to be coming soon. It will be difficult for Biden to pass the tests without fanning inflation expectations, at least in the short run. While bold action on Iran will not reduce oil prices as much as the consensus holds, a deal could avoid a worse scenario in which the Middle East destabilizes and energy shocks multiply. Investors should brace for more volatility, at least through the November 8 midterm election. Investors will need to see US-Russia, US-China, and US-Iran relations improve concretely and verifiably before determining that the geopolitical and macroeconomic backdrop are turning more favorable for risk assets. Matt Gertken Senior Vice President Chief US Political Strategist mattg@bcaresearch.com Footnotes 1 See Ivana Saric, “Biden administration ramps up Iran sanctions as nuclear talks falter,” Axios, June 16, 2022, axios.com; Ellen Nakashima, “Biden administration slaps export controls on Chinese firms for aiding PLA weapons development,” Washington Post, April 8, 2021, washingtonpost.com; see also Karen Freifeld, “Biden administration reviewing China chip export policies, official says,” Reuters, July 14, 2022, reuters.com. Strategic View Open Tactical Positions (0-6 Months) Open Cyclical Recommendations (6-18 Months) Table A2Political Risk Matrix
Waiting On The Biden Doctrine
Waiting On The Biden Doctrine
Table A3US Political Capital Index
Waiting On The Biden Doctrine
Waiting On The Biden Doctrine
Chart A1Presidential Election Model
Third Quarter US Political Outlook: Last Ditch Effort
Third Quarter US Political Outlook: Last Ditch Effort
Chart A2Senate Election Model
Third Quarter US Political Outlook: Last Ditch Effort
Third Quarter US Political Outlook: Last Ditch Effort
Table A4House Election Model
Waiting On The Biden Doctrine
Waiting On The Biden Doctrine
Table A5APolitical Capital: White House And Congress
Waiting On The Biden Doctrine
Waiting On The Biden Doctrine
Table A5BPolitical Capital: Household And Business Sentiment
Waiting On The Biden Doctrine
Waiting On The Biden Doctrine
Table A5CPolitical Capital: The Economy And Markets
Waiting On The Biden Doctrine
Waiting On The Biden Doctrine
Executive Summary Low-Yielding Countries Facing High USD Hedging Costs
Low-Yielding Countries Facing High USD Hedging Costs
Low-Yielding Countries Facing High USD Hedging Costs
The US dollar will remain strong alongside continued Fed rate hikes. Interest rate differentials will remain positive for the greenback, alongside other USD-positive factors like slowing global growth and rising investor risk aversion. Relatively high US interest rates have made hedging away US currency risk very expensive for some of the largest holders of US Treasuries like Japan. US Treasury yields, on an FX-hedged basis, look unattractive relative to local currency denominated bonds across the developed world. Increased foreign demand for US Treasuries evident in the US TIC data appears to reflect a re-establishment of positions unwound by global hedge funds and mutual funds dating back to the 2020 “dash for cash” in global financial markets. UST yields must rise even further versus non-US yields to attract more fundamental buyers like Japanese and European institutional investors, given elevated volatility in both US Treasury prices and the dollar. Bottom Line: Global investors should continue to underweight US Treasuries in global bond portfolios, on both a currency-unhedged and USD-hedged basis. Feature Dear Client, The schedule for the next two Global Fixed Income Strategy reports will be impacted by the upcoming Labor Day holiday and next week’s BCA’s annual conference in New York (I hope to see you there!). This Friday, September 2, we will be publishing a joint report with our colleagues at Foreign Exchange Strategy discussing Japan. On Monday, September 12, we will be publishing another joint report with our colleagues at European Investment Strategy, covering estimates of global neutral interest rates. -Rob Robis The title of our report from four weeks ago was “Dovish Central Bank Pivots Will Come Later Than You Think.” This could have also been the title for Fed Chair Jerome Powell's Jackson Hole speech. He reiterated the Fed’s commitment to tighten policy further and “keep at it” until the US economy slows enough to bring down inflation. Other central bankers who spoke at the conference had a similar tone to Powell, talking up an ongoing inflation fight that will require much slower growth and higher unemployment. Related Report Global Fixed Income StrategyRecent USD Strength Is Not Bond Bullish By quickly and bluntly dispensing any notion that the Fed could soon pause its rate hiking cycle, Powell poured ice cold water on the risk asset rally that boosted the S&P 500 by nearly 17% between mid-June and mid-August. The S&P 500 plunged 3.4% after Powell’s speech, a tightening of US financial conditions that was likely welcomed by the Fed, as it helps their goal of slowing the US economy. Minneapolis Fed President Neil Kashkari even said he was “happy” to see the negative market reaction to Powell’s speech. Powell, Kashkari and the rest of the FOMC are probably happy over the strength of the US dollar, which is also helping tighten US financial conditions – while also having a major impact on global bond returns and currency hedging decisions for investors. A Collision Of A USD Bull Market & Global Bond Bear Market Chart 1A Big Move In The USD
A Big Move In The USD
A Big Move In The USD
The current strength of the US dollar is becoming increasingly broad-based. The EUR/USD exchange rate has fallen below parity, while USD/JPY continues to flirt with the 140 level (Chart 1). The British pound is trading at a 2-year low versus the US dollar, many important emerging market (EM) currencies are struggling, and the Chinese renminbi is set to retest the 7.0 level. The strength of the US dollar is no recent phenomenon. The current uptrend dates back to the start of 2021, with the DXY dollar index up 21% since then. The dollar bull market has been supported by several factors, most critically rising US interest rates. The 2-year US Treasury yield started 2021 just above 0% and now sits at 3.4%. Higher US interest rates have raised the benefit of hedging currency risk into US dollars for global bond investors. The Bloomberg Global Aggregate Bond Index in USD-hedged terms has outperformed the unhedged version of the index by 6.3% over the past year, one of the largest such increases dating back to 2000 (Chart 2). This means that global bond investors have been paid handsomely to simply swap non-US bond exposures into US dollars – in some cases, making low-yielding assets like Japanese government bonds (JGBs), hedged from yen into dollars, comparable to US Treasury yields. Chart 2Big Gains From Hedging Global Bond Exposure Into USD
Big Gains From Hedging Global Bond Exposure Into USD
Big Gains From Hedging Global Bond Exposure Into USD
This wedge between USD-hedged and unhedged bond returns is unlikely to reverse soon, as the fundamental drivers of the dollar remain biased to more dollar strength. The US dollar is not only supported by more favorable interest rate differentials versus other currencies (both in nominal and inflation-adjusted terms), but is also benefitting from its safe haven status at a time of considerable uncertainty on the future of the global economy (Chart 3). Global growth expectations are depressed and showing no signs of turning around anytime soon, particularly in Europe and the UK where electricity and gas prices are climbing at a record pace. The dollar not only typically appreciates during periods of slowing growth, but also during episodes of investor risk aversion. Investors remain cautious, according to indicators like the US equity put/call ratio which shows greater demand for downside protection via puts – an outcome that also typically coincides with a stronger US dollar. In this current environment of broad-based US dollar strength, the gap between hedged and unhedged bond returns has varied widely depending on the base currency of the investor. For a euro-based investor, the performance gap between the unhedged Global Aggregate index and the EUR-hedged index has been 6% over the past year (Chart 4). Chart 3USD Strength Supported By Key Fundamental Drivers
USD Strength Supported By Key Fundamental Drivers
USD Strength Supported By Key Fundamental Drivers
Chart 4FX Hedging Decisions Mean Everything In A Global Bond Bear Market
FX Hedging Decisions Mean Everything In A Global Bond Bear Market
FX Hedging Decisions Mean Everything In A Global Bond Bear Market
Chart 5Low-Yielding Countries Facing High USD Hedging Costs
Low-Yielding Countries Facing High USD Hedging Costs
Low-Yielding Countries Facing High USD Hedging Costs
The gap has been even larger for yen-based investors, with the unhedged index beating the JPY-hedged index by a whopping 13% over the past twelve months. Although Japanese fixed income investors are not typically known for taking unhedged currency risk on foreign bond holdings, doing so would have turned an awful year of global bond returns into a great year, simply due to yen weakness. When looking at current levels of interest rate differentials versus the US, which are the main determinant of currency hedging costs, the low yielding currencies like the euro, yen and Swiss franc see the greatest gain on returns versus the high-yielding US dollar (Chart 5). Hedging euros into dollars results in an annualized pickup of 252bps, while hedging yen into dollars produces an even bigger gain of 327bps. At the same time, the USD-hedging gains for relatively higher yielders are much lower. Hedging Australian dollars into US dollars only produces an annualized gain of 48bps, while hedging Canadian dollars into US dollars produces an annualized loss of -18bps. These varying hedging costs matter for global bond investors, as they impact the attractiveness of an individual country’s bond yields, depending on the investor’s base currency. We show the unhedged yield levels, and currency-hedged yield levels for six main developed market base currencies (USD, EUR, JPY, GBP, CAD, AUD) in the tables on the next two pages. Table 1 shows 2-year government bond yields, Table 2 shows 5-year government bond yields, Table 3 shows 10-year government bond yields and Table 4 shows 30-year government bond yields. Unsurprisingly, hedging into euros and yen, where short-term interest rates are the lowest, produces the smallest yields. Meanwhile, hedging into higher-rate currencies like US dollars and Canadian dollars generates the highest yields. Table 1Currency-Hedged 2-Year Government Bond Yields
Currency Hedging Matters More Than Ever For Bond Investors
Currency Hedging Matters More Than Ever For Bond Investors
Table 2Currency-Hedged 5-Year Government Bond Yields
Currency Hedging Matters More Than Ever For Bond Investors
Currency Hedging Matters More Than Ever For Bond Investors
Table 3Currency-Hedged 10-Year Government Bond Yields
Currency Hedging Matters More Than Ever For Bond Investors
Currency Hedging Matters More Than Ever For Bond Investors
Table 4Currency-Hedged 30-Year Government Bond Yields
Currency Hedging Matters More Than Ever For Bond Investors
Currency Hedging Matters More Than Ever For Bond Investors
We take the analysis a step further in the next set of tables on pages 9-11. Here, we take the hedged yields for each currency and compare them to the yields of the base currency. For example, in Table 5, it can be seen that a 2-year US Treasury yield of 3.4%, hedged into euros, produces a yield of 0.82% that is -17bps below the 2-year German yield (which is obviously denominated in euros). In other words, from the point of view of a euro-based investor who wants to hedge away the currency risk in a global bond portfolio, he gets paid a bit more to own a German bond over a US Treasury. Table 5Currency-Hedged 2-Year Govt. Bond Yield Spreads
Currency Hedging Matters More Than Ever For Bond Investors
Currency Hedging Matters More Than Ever For Bond Investors
Similar results are shown in the subsequent tables for 5-year yields (Table 6), 10-year yields (Table 7) and 30-year yields (Table 8). From these tables, we can make the following broad conclusions: Table 6Currency-Hedged 5-Year Govt. Bond Yield Spreads
Currency Hedging Matters More Than Ever For Bond Investors
Currency Hedging Matters More Than Ever For Bond Investors
Table 7Currency-Hedged 10-Year Govt. Bond Yield Spreads
Currency Hedging Matters More Than Ever For Bond Investors
Currency Hedging Matters More Than Ever For Bond Investors
Table 8Currency-Hedged 30-Year Govt. Bond Yield Spreads
Currency Hedging Matters More Than Ever For Bond Investors
Currency Hedging Matters More Than Ever For Bond Investors
For USD-based bond investors, all non-US markets except Canada have a yield pickup over US Treasuries on an FX-hedged basis For EUR-based investors, all non-euro area markets except Australia produce yields lower than those of Germany on an FX-hedged basis For GBP-based investors, all non-UK bond markets except the US and Canada have yields greater than those of Gilts for maturities from 5-30 years (the results are more mixed across countries for 2-year yields) For JPY-based investors, euro area and Australian bonds are clearly more attractive than JGBs on an FX-hedged basis, while US Treasuries, UK Gilts and Canadian government bonds offer FX-hedged yields below puny JGB yields. This is true up to the 10-year maturity point, as 30-year JGB yields – which are not targeted by the Bank of Japan in its yield curve control program – are much higher than those on the rest of the JGB curve For CAD-based investors, hedging virtually all non-Canadian bonds into CAD results in yields that are higher than Canadian government bond yields, with the largest hedged yield advantage for euro area and Australian bonds For AUD-based investors, only euro area bonds offer a consistent yield pickup over Australian government bonds on an FX-hedged basis. Broadly speaking, government bonds in the euro area and Australia offer consistently attractive FX-hedged yield pickups over the unhedged bonds for all currencies shown in the tables. On the other hand, Canadian government bonds have consistently less attractive FX-hedged yields across all currencies shown. Perhaps most importantly, US Treasuries look unattractive on an FX-hedged basis to all but CAD-based investors – a result that has meaningful implications for the potential of foreign buying to help stem the rise of US bond yields. Bottom Line: The US dollar bull market is having a huge influence on global bond returns. US Treasury yields, on an FX-hedged basis, look unattractive relative to most local currency denominated bonds across the developed world. Who Are The Foreign Buyers Of US Treasuries? When simply looking at currency-unhedged yield spreads, US Treasury yields offer particularly inviting yields over low-yielding (and low “beta” to US yields) markets like Germany and Japan. The unhedged 10-year US-Germany spread is now 160bps, while the unhedged US-Japan spread is up to 286bps (Chart 6). Meanwhile, among high-beta markets, the US-Canada 10-year spread is flat on an FX-unhedged basis, while an unhedged Australian 10-year bond yields 56bps more than a 10-year US Treasury. Chart 6UST Yields Only Look Attractive In FX-Unhedged Terms
UST Yields Only Look Attractive In FX-Unhedged Terms
UST Yields Only Look Attractive In FX-Unhedged Terms
Yet after factoring in the currency hedging costs shown earlier, US Treasuries look consistently unattractive versus the other major developed economy bond markets. Chart 7UST Yields Look Unattractive After Hedging Out USD Exposure
UST Yields Look Unattractive After Hedging Out USD Exposure
UST Yields Look Unattractive After Hedging Out USD Exposure
A 10-year US Treasury hedged into euros now yields -77bps less than a 10-year German bund, at the low end of the historical range for this spread dating back to 2000 (Chart 7). A 10-year Treasury hedged into GBP and JPY also offers lower yields versus 10-year UK Gilts (-11bps) and 10-year JGBs (-50bps), respectively. The 10-year hedged US-Australia spread (with the US yield hedged into AUD) is also at a stretched negative extreme at -114bps (Chart 8). Despite these broadly unattractive hedged US yield spreads, the US Treasury market has seen significant foreign inflows this year, according to the US Treasury Department’s capital flow (TIC) data. Total net purchases of US Treasuries by foreign buyers accelerated to $470bn (on a 12-month rolling total basis) as of the latest data for June (Chart 9). When broken down by type of buyer, private buyers bought a net $619bn, while official buyers were net sellers to the tune of -$149bn. Chart 8No Compelling Yield Advantage To Owning FX-Hedged USTs
No Compelling Yield Advantage To Owning FX-Hedged USTs
No Compelling Yield Advantage To Owning FX-Hedged USTs
When looking at the TIC data by country, China was an important net seller of -$18bn of Treasuries. This is consistent with the reduced demand for US dollar assets from China, where policymakers are actively targeting a weaker renminbi. Chart 9TIC Data Shows USTs Seeing Foreign Buying (Ex-China)
TIC Data Shows USTs Seeing Foreign Buying (Ex-China)
TIC Data Shows USTs Seeing Foreign Buying (Ex-China)
There was also net selling from many EM countries that have seen reduced trade surpluses and, hence, fewer US dollars to recycle into Treasuries. Chart 10Even Higher UST Yields Needed To Entice Japanese & European Buyers
Even Higher UST Yields Needed To Entice Japanese & European Buyers
Even Higher UST Yields Needed To Entice Japanese & European Buyers
The largest net buying (Chart 10) was seen from the UK (+$306bn) and Cayman Islands (+$154bn) – the latter being a large source of Treasury buying through hedge funds and offshore investment funds located there. Those two countries accounted for almost all of the net foreign inflows into Treasuries, despite the fact they only hold a combined 12% of all foreign US Treasury holdings. There was modest net buying from the euro area (+$37bn) and small net selling by the country with the largest stock of US Treasury holdings, Japan. The relatively subdued inflows from Europe, and lack of inflows from Japan, are consistent with the unattractive hedged US-Europe and US-Japan yield spreads shown earlier, particularly at a time of elevated US bond yield volatility. The huge inflows from the UK and Cayman Islands are harder to explain on a fundamental basis, but are likely due to a continued normalization of Treasury market liquidity after the spring 2020 “dash for cash”. In a report published back in January, Fed researchers analyzed foreign demand for US Treasuries around the worst of the COVID pandemic shock in 2020. The report concluded that the huge collapse in private inflows into Treasuries – from a peak of +$238bn at the start of 2020 to a trough of -$373bn at the end of 2020 – was the result of aggressive net selling by hedge funds and global mutual funds. These are exactly the types of investors that would be domiciled in the Cayman Islands and UK (London). Specifically, the Fed report noted that: “In short, two prominent reasons for the large sales are the unwind of the Treasury basis trade by hedge funds (including foreign-domiciled funds) and the sudden, massive investor outflows from mutual funds that caused these funds to sell their most liquid assets, U.S. Treasury securities, to meet these redemptions.” The “basis trade” mentioned likely involved buying cash Treasuries versus selling Treasury futures, attempting to exploit unsustainable price differences between the two. As market liquidity conditions dried up in the spring of 2020 during the first wave of global lockdowns, leveraged bond investors needed to frantically unwind positions. For Treasury basis trades, that would have involved selling cash Treasuries, which was likely what is being picked up in the TIC data from the Cayman Islands which showed a huge plunge in net buying in 2020. The mutual fund outflows were likely a global phenomenon, but given the large fund management presence in London, the huge net selling of Treasuries from the UK in 2020 were almost certainly related to global fund managers, not purely UK investors. As Treasury market liquidity conditions normalized in 2021 and 2022, those large sellers in the UK and Cayman Islands (and other offshore investment locations) have likely turned into big net buyers, as evidenced from the TIC data. However, the modest inflows from Europe, and outflows from Japan, tell a more important story about the fundamental demand for US Treasuries. Treasury yields must rise further, widening both currency-hedged and unhedged spreads versus non-US government bonds to more historically attractive levels, to entice more foreign buying. Bottom Line: UST yields must rise even further versus non-US yields to attract more fundamental buyers like Japanese and European institutional investors, given elevated volatility in both US Treasury prices and the dollar. Global investors should underweight US Treasuries in global bond portfolios, on both a currency-unhedged and USD-hedged basis. Robert Robis, CFA Chief Fixed Income Strategist rrobis@bcaresearch.com GFIS Model Bond Portfolio Recommended Positioning Active Duration Contribution: GFIS Recommended Portfolio Vs. Custom Performance Benchmark
Currency Hedging Matters More Than Ever For Bond Investors
Currency Hedging Matters More Than Ever For Bond Investors
The GFIS Recommended Portfolio Vs. The Custom Benchmark Index Global Fixed Income - Strategic Recommendations*
Currency Hedging Matters More Than Ever For Bond Investors
Currency Hedging Matters More Than Ever For Bond Investors
Tactical Overlay Trades
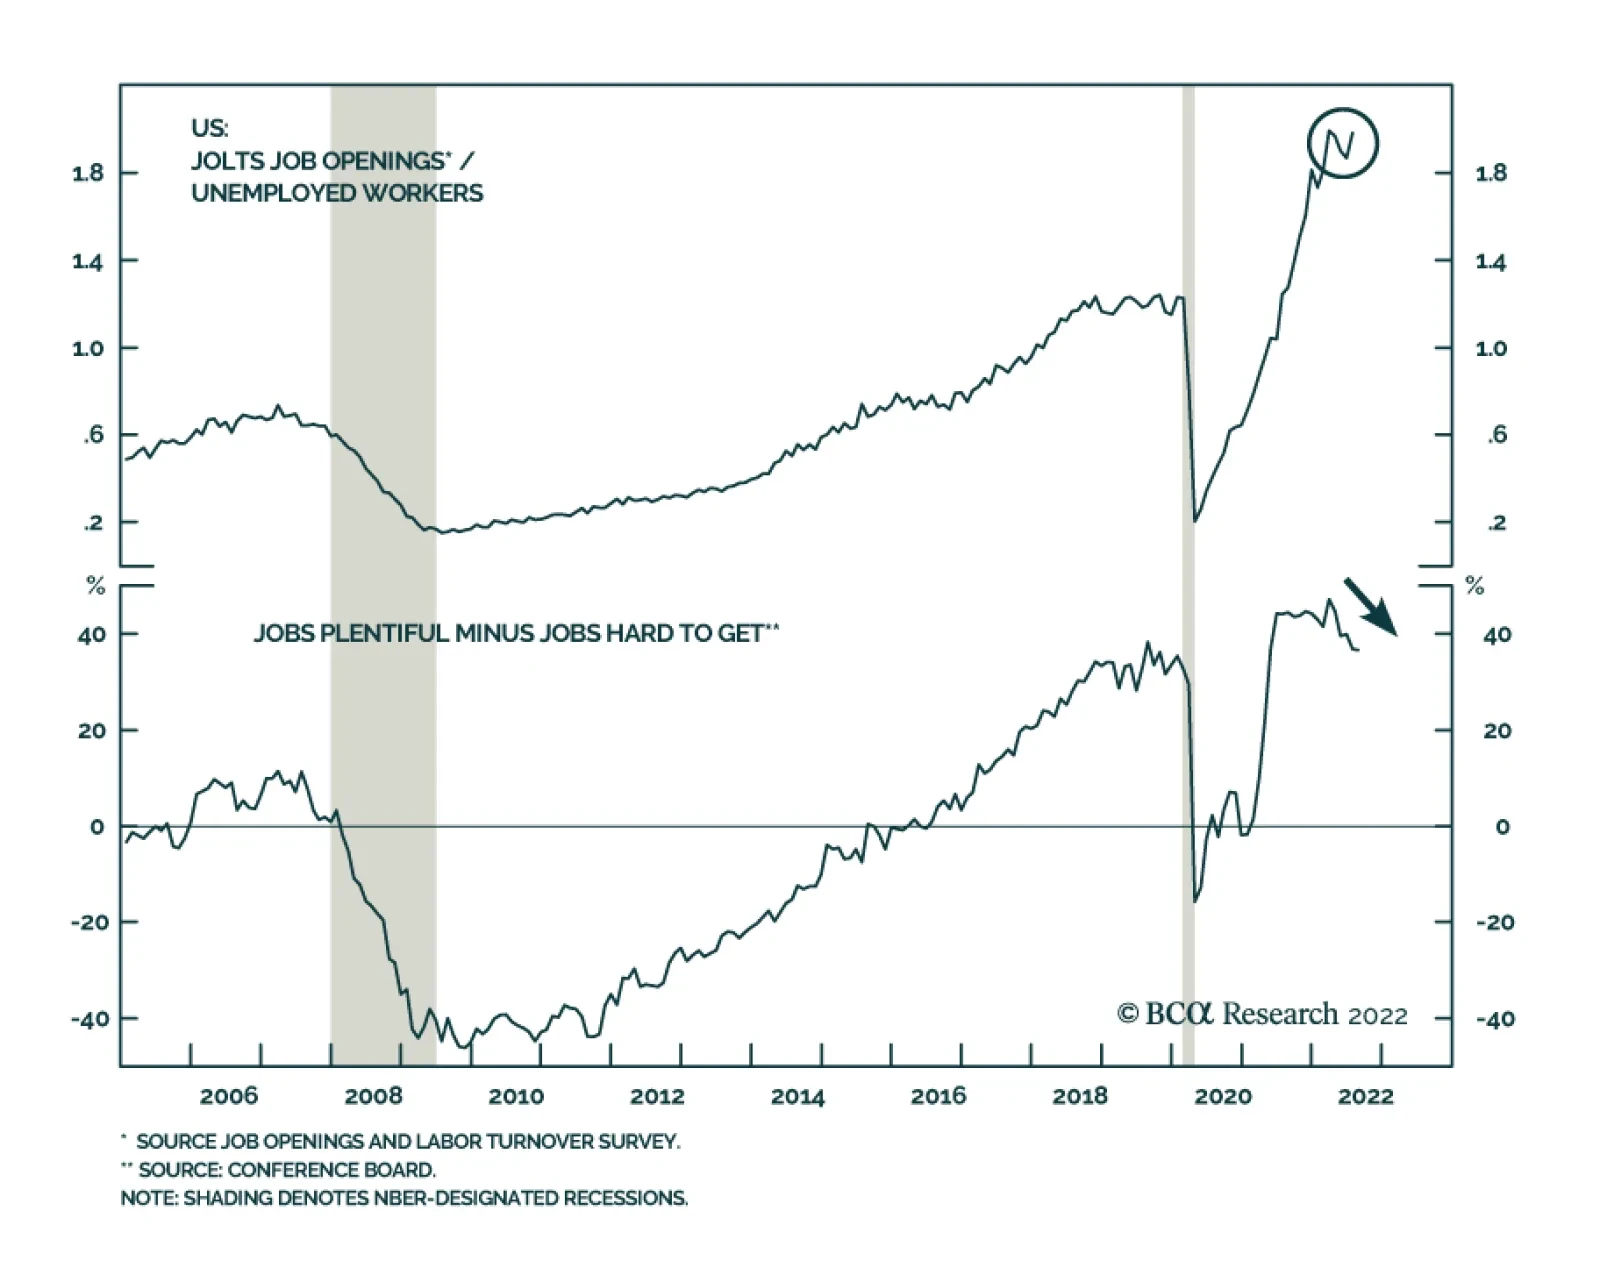
After having declined for three consecutive months, job openings unexpectedly rose to 11.2 million in July, from an upwardly revised 11 million in June, beating expectations they would continue to decrease. Transportation, warehousing and utilities, as well…
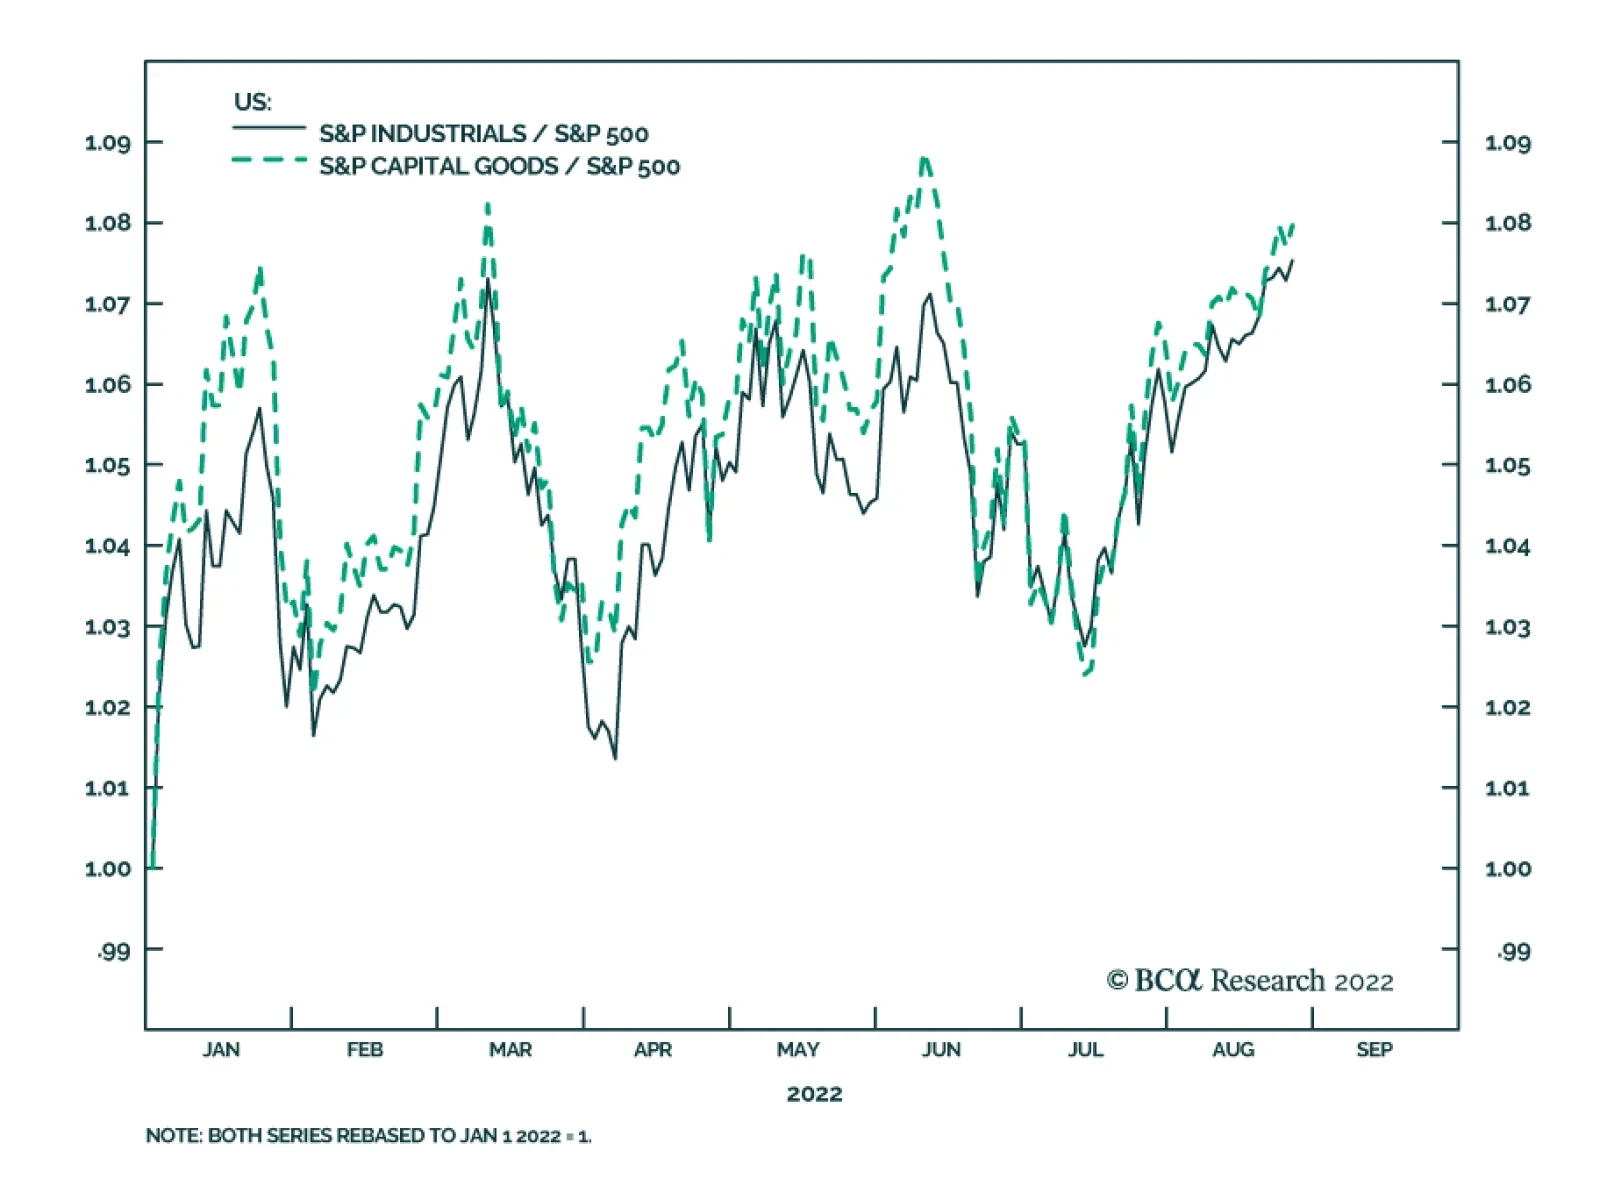
US industrial stocks face conflicting forces. On the one hand, the macroeconomic environment poses challenges to this sector. Industrial stocks typically underperform when economic growth conditions deteriorate. Our US Equity strategists recently showed…
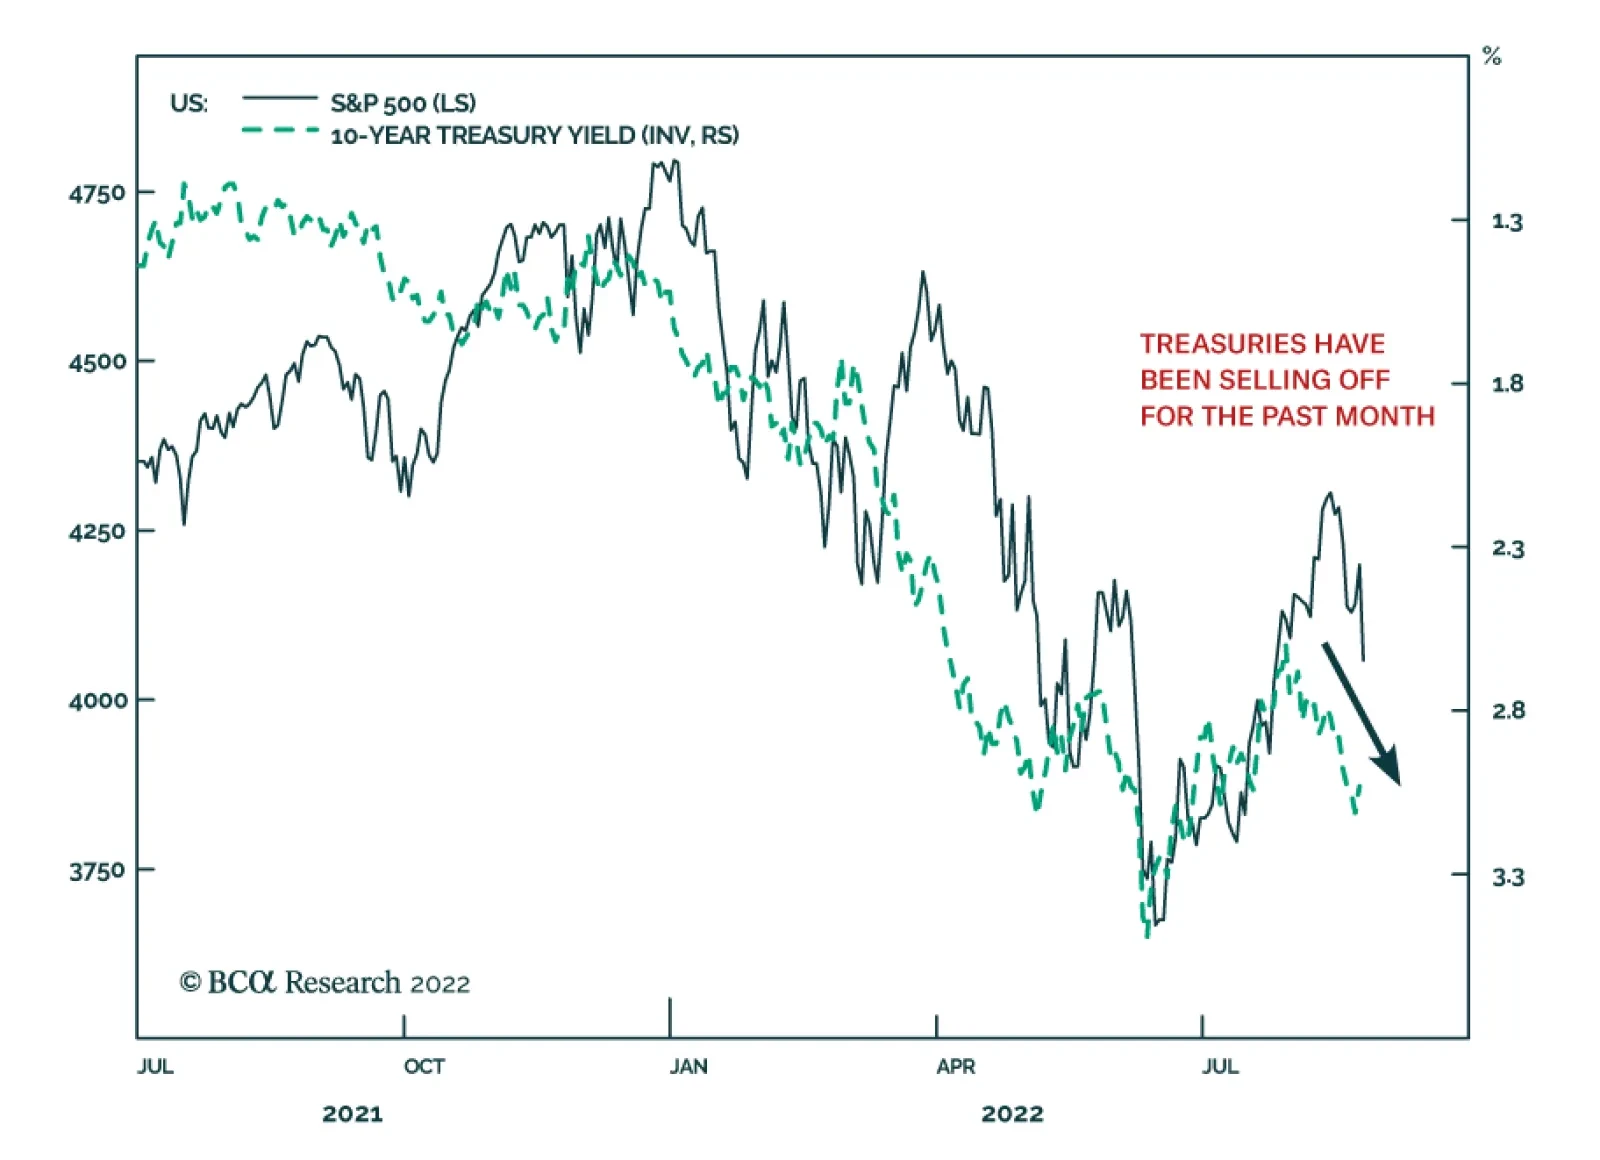
Over the past couple of trading sessions, equities around the world have been under downwards pressure as they digest the hawkish commentary from central bankers at the Jackson Hole Symposium. The S&P 500 and Euro Stoxx 50 are down by 4% and 2.8%…
Executive Summary Reshoring And FDI Job Creation Have Accelerated After The Pandemic
Industrials: A Trifecta Of Positives
Industrials: A Trifecta Of Positives
The US is entering a period of an industrial boom thanks to limited manufacturing capacity paired with strong demand for industrial and consumer goods. In addition, a trifecta of positive developments is further boosting US manufacturing: Onshoring, automation, and fiscal stimulus. Onshoring has accelerated after the onset of the pandemic and reshoring announcements are growing steadily. Automation and robotization allow industrial companies to circumvent labor shortages and rising wages and, hence, boost their profit margins. The domestic political landscape in the US is also favorable for industrial stocks given the three major legislative Acts (Infrastructure Investment & Jobs, Inflation Reduction, and National Defense Authorization) that will secure a healthy demand pipeline. While long-term trends are favorable for the sector, a macroeconomic backdrop of slowing growth is a headwind. However, thanks to a confluence of positive long-term trends, most companies are optimistic. Bottom Line: The US industrial sector is in the middle of a boom fueled by onshoring, automation, and favorable government policy. This trifecta of positives helps the sector to defy the gravity of the slowing economy. We remain overweight Industrials on both tactical and strategical time horizons but will continue to monitor it closely, watching out for potential cracks in operating performance. Feature A little over a year ago EMS, GIS, and USES co-published a report “Industrials as equity sector winner in the coming years”. In that report, we posited that the Industrial sector is poised for outperformance as it enjoys a boom thanks to strong new trends in onshoring and automation. In addition to the tectonic shifts described above, the sector has also found itself at the epicenter of the US legislative activity, which will provide a significant tailwind for its performance. Since we published the report on July 30, 2021, Industrials have performed in line with the S&P 500. However, since the beginning of the year, Industrials and Capital Goods outperformed the index by 7%, showing impressive resilience (Chart 1 and Table 1). Chart 1A Resilient Cyclical Sector
A Resilient Cyclical Sector
A Resilient Cyclical Sector
In this week’s report, we take a close look at the trends highlighted above and conduct a deep dive to evaluate whether the sector is still attractive on a tactical basis considering the backdrop of rising rates and slowing economic activity. Our focus is on the Industrial sector in general, and the Capital Goods Industry Group, in particular. We will also assess which industries are best positioned for outperformance. Table 1Industrials Outperformed On The Way Down And During The Summer Rally
Industrials: A Trifecta Of Positives
Industrials: A Trifecta Of Positives
Sneak Preview: The US industrial sector is in the middle of a boom fueled by onshoring, automation, and favorable government policy. This trifecta of positives helps the sector to defy the gravity of the slowing economy. For now, we are both strategically and tactically bullish on the sector but remain vigilant. US Manufacturing Capacity Has Been Severely Limited For Years US manufacturing capacity has been stagnant over the past 20 years, and the level of US manufacturing employment has declined by 30% since 2000 (Charts 2 & 3). Presently, manufacturing employment accounts for only 8% of total US employment. Chart 2US Manufacturing Employment Has Been Shrinking For Decades
US Manufacturing Employment Has Been Shrinking For Decades
US Manufacturing Employment Has Been Shrinking For Decades
Chart 3US Manufacturing Capacity Has Not Expanded In The Past Two Decades
US Manufacturing Capacity Has Not Expanded In The Past Two Decades
US Manufacturing Capacity Has Not Expanded In The Past Two Decades
The reason for the lack of capacity expansion over the past 20 years has been the outsourcing and shifting of production to other countries, especially China. The peak in US manufacturing capacity and employment occurred after the massive Asian currency devaluation in 1998 and China’s WTO admission in 2001. The semiconductor sector, which has recently come into the limelight, is a case in point: From 1990 to 2020, the percentage of chips manufactured in the US has fallen from 37% to 10%, with the lion’s share of chips manufactured in Asia. This trend has brought about The Chips Act which seeks to reverse the trend for national security reasons. Notably, more recently, the decline in manufacturing capacity and employment has started to reverse. More about this later. American Manufacturing Is Booming Again Limited manufacturing capacity paired with a strong demand for industrial and consumer goods translates into an industrial boom. Industrial companies are incentivized to expand given they are already operating at nearly full capacity (Chart 4) and enjoying considerable pricing power. Building industrial capacity in itself lifts demand for industrial goods and the US may be in the early innings of the new Capex cycle, unless the trend is derailed by headwinds from a significantly tighter monetary policy. After all, the age of US capital stock, at 24 years, is two years older than at previous peaks, indicating that many companies are overdue for replacing some of their equipment and machinery (Chart 5). Chart 4Industrial Companies Operate At Nearly Full Capacity
Industrial Companies Operate At Nearly Full Capacity
Industrial Companies Operate At Nearly Full Capacity
Chart 5The US Capital Stock Has To Be Renewed
The US Capital Stock Has To Be Renewed
The US Capital Stock Has To Be Renewed
Indeed, this may already be happening. According to S&P Dow Jones Indices, which analyzed second-quarter earnings season data, capital expenditures of the companies in the S&P 500, have been growing at a faster pace than stock repurchases for the first time since the first quarter of 2021, rising by 20% from a year earlier. Companies from Pepsi to Google to GM are investing in their production capacity, which in itself may be an encouraging sign that they are comfortable with the demand outlook. Of course, the caveat here is that industrials are late in cycle performance, as companies usually wait towards the end of the cycle to expand, only to find waning demand for their products. You Say “Reshoring,” I Say “Onshoring” A multi-decade decline in US manufacturing employment has started to reverse after the GFC, with the onset of the pandemic and geopolitical tensions accelerating the pace of reshoring and Foreign Direct Investing (FDI). Reshoring and FDI job announcements have increased from 6K in 2010 to 345K in 2022 (Chart 6). The resulting cumulative 950,000 incremental hires represent about 7% of US manufacturing employment. The acceleration of jobs coming back combined with the decline in the rate of offshoring has resulted in a 12-year steady uptrend in US manufacturing jobs. Truly amazing! Onshoring remains on top of mind for companies’ management. According to Statista, mentions of onshoring buzzwords in earnings calls and presentations of US public companies have increased from about 100 throughout 2020 to nearly 200 in Q2-2020. Chart 6Reshoring And FDI Job Creation Have Accelerated After The Pandemic
Industrials: A Trifecta Of Positives
Industrials: A Trifecta Of Positives
According to Morgan Stanley’s survey of more than 400 executives of large corporations from the US to Germany to Japan, the most important factor in supply chain decisions is geopolitical stability, followed by skilled labor, physical infrastructure, and a developed supply chain ecosystem. On nearly every count, the US outranked Europe, China, and Mexico. Some 18% of the companies planned to significantly expand US manufacturing in the next 12 months, while 36% anticipated doing so within three years. More than 40% of US companies were taking steps to “onshore” supply chains. The reasons are well publicized: The COVID crisis has revealed over-dependence on imports. China’s decoupling from the US, tensions in the Taiwan Strait, and the Russian/Ukraine war have invoked concerns about the reliability of the existing supply chains. Supply chain disruptions have highlighted corporate vulnerabilities and had made companies realize that “just-in-case” trumps “just-in-time.” The US is pursuing protectionist policies that are to benefit companies operating in the US, Mexico, and Canada. According to Reshoring Initiative,1 Industrial and Tech companies are at the forefront of reshoring: Electrical Equipment, Chemicals, Transportation Equipment, Computer, and Electronic Products, and Medical Equipment suppliers are the leaders in onshoring (Table 2). Many large manufacturers such as Caterpillar have implemented or announced plans to bring offshore manufacturing back to the US. Table 2Reshoring Jobs By Top 5 Industries
Industrials: A Trifecta Of Positives
Industrials: A Trifecta Of Positives
Will onshoring benefit some of the former manufacturing hubs? We believe it will, as Kentucky, North Carolina, Georgia, Ohio, and Alabama are the top five destinations (Table 3). However, there is a hitch. The US unemployment rate, which is at an all-time low of 3.5%, is certainly a speed limit. Moreover, companies that bring their businesses back home do realize that labor costs in this country are many times higher than, say, in Asia. Hence, one of the solutions they pursue is automation. After many years in the making, onshoring is finally gaining pace, benefiting the US manufacturing base. Table 32022 Projected Reshoring Jobs By Top 10 States
Industrials: A Trifecta Of Positives
Industrials: A Trifecta Of Positives
Automation To The Rescue! The Pace of Robotization And Automation Is Accelerating A critical constraint for the expansion of US manufacturing is the labor shortage. Open vacancies in manufacturing are now at a record high, 100% above the 2018 peak (Chart 7, top panel). Notably, industrial companies have been experiencing difficulties hiring qualified staff over the past 10 years which has led to high wage growth (Chart 7, bottom panel). Chart 7US Manufacturers Cannot Fill Vacant Positions, Wages Are Surging
US Manufacturers Cannot Fill Vacant Positions, Wages Are Surging
US Manufacturers Cannot Fill Vacant Positions, Wages Are Surging
Chart 8Automation Expands Profits Margins Of Global Industrials
Automation Expands Profits Margins Of Global Industrials
Automation Expands Profits Margins Of Global Industrials
One remedy is automation. Replacing labor with automation/robots allows companies to produce more and avoid a profit margin squeeze (Chart 8). In a recent report published by the International Federation of Robotics, industrial robots reported record preliminary sales in 2021 with 486,800 units shipped globally, a 27% increase from 2020. The US has been lagging behind other developed countries in terms of automation and robotization (Chart 9). However, labor shortages brought about by the pandemic appear to have “moved the needle.” According to the Association for Advancing Automation (A3),2 the number of robots sold in the US in 2021 rose by 27% over 2020 with 49,900 units installed. 2022 is on pace to exceed previous records, with North American companies ordering a record 11,595 robots. Chart 9US Has Been Lagging Other Developed Nations In Robot Installations
Industrials: A Trifecta Of Positives
Industrials: A Trifecta Of Positives
Non-automotive sales now represent 58% of the total, demonstrating a broadening reach of automation. Metals, Auto, and Food and Consumer Goods have the highest growth in the purchase of robots (Chart 10). Chart 10In 2021 The Pace Of Robot Installation Has Picked Up
Industrials: A Trifecta Of Positives
Industrials: A Trifecta Of Positives
Implications For Industrial Companies The Industrials sector is home to companies that create robots and offer automation solutions as well as companies on the receiving end of the trend. Both sellers and buyers are to benefit: Buyers Of Robots: Manufacturing companies automating production and enlisting robots into their operations will enjoy higher operating leverage, lower labor costs, and more resilient margins. It is easier to automate processes in manufacturing than in service sectors. Consequently, we believe profit margins in manufacturing will outperform those of service sector companies, where automation will be slower. Sellers Of Robots: The sizzling demand for robots demonstrates that technological breakthroughs are no longer just about the Tech companies, and many industrial companies are to benefit from these nascent trends. Rockwell Automation, Eaton, and Caterpillar are the leaders in industrial automation. These companies also reach across the aisle to software companies to leverage their expertise in data storage, computing, and artificial intelligence. Rockwell has just recently partnered with Microsoft, while others are acquiring software companies. Deere has acquired GUSS Automation, a pioneer in semi-autonomous springs for high-value crops. These companies are to benefit from strong demand for their products and should exhibit strong sales and profit growth. To meet strong demand, industrial/manufacturing companies will automate their processes. This will allow them to boost volume and cap costs resulting in widening profit margins. Uncle Sam Loves American Manufacturing Both Biden and Trump before him, have stated that their overarching objective is to revive America’s manufacturing. However, their methods were drastically different, with Trump introducing tax cuts and tariffs, while Biden leans heavily on fiscal stimulus. The following is a recap of some of the recent laws passed by Congress and signed by President Biden. Infrastructure Investment And Jobs Act The $1.2-trillion Infrastructure Investment and Jobs Act will increase US government non-defense spending to bring it to around 3% of GDP, a level comparable to the 1980s-90s and larger than the 2010s. The bill’s focus is on traditional infrastructure – roads, bridges, ports, and electrical grid modernization – but also includes more modern elements such as $65 billion for 5G broadband Internet and $36 billion for electric vehicles and environmental remediation (Table 4). Implementation of the bill is delayed to 2023-24. Table 4Itemized Infrastructure Plan
Industrials: A Trifecta Of Positives
Industrials: A Trifecta Of Positives
However, the market is forward-looking and companies in Construction & Engineering, and Building Products industries are already winners, and are up 12% in relative terms since the bill was passed on November 15, 2021. The potential increase in public construction will help offset a slump in residential construction on the back of the softening housing market (Chart 11). Chart 11The Increase In Public Construction Will Help Offset A Slump In Residential Construction
The Increase In Public Construction Will Help Offset A Slump In Residential Construction
The Increase In Public Construction Will Help Offset A Slump In Residential Construction
Inflation Reduction Act (IRA) The bill earmarks $370 billion for clean energy spending as well as EV tax credits for both new and used cars. We have written on the topic of “Green and Clean” and the effect of the IRA on renewable energy and EV industries, two industries that are major beneficiaries of the bill. However, the bill also creates an enormous opportunity for industrial companies, which can build and service renewable infrastructure, such as Quanta Services (PWR) and Eaton (ETN). Companies that produce and service wind turbines (GE) and solar batteries will also get a revenue boost from the package. Chips Act Congress has passed the CHIPS+ bill to alleviate the chip shortage and shore up US competitiveness with China. Money is earmarked for domestic semiconductor production and research, and factory construction. While the key beneficiaries are chip foundries, construction of new factories will require equipment and services of a wide range from industrial companies from Construction to Machinery. National Defense Authorization Act In December, the House and Senate Armed Services Committee leadership released the Fiscal Year 2022 National Defense Authorization Act (NDAA). This bill introduces an overall discretionary authorization of $768.2 billion including $740.3 billion for base Department of Defense programs and $27.8 billion for national security programs in the Department of Energy. At a later date, another $37 billion was amended to the bill to include $2.5 billion to help pay higher fuel costs; $550 million for Ukraine, funding for five ships, eight Boeing Co-made F-18 Super Hornet fighter jets, and five Lockheed Martin C-130 Hercules planes; and about $1 billion for four Patriot missile units. For FY 2023, the House has already passed $839 billion, which is $37 billion above the White House request. The Senate will work on the bill after the summer recess. But it is already clear that defense spending has become a bipartisan issue. The increase in the defense budget, as well as additional allocation of funds towards Ukraine, have been a major boost for the Aerospace and Defense industry. We overweighted the sector back in January and it is up 24% in relative terms. Overweight Or Not, That Is The Question Macroeconomic Backdrop Business Cycle: Performance of the Industrial sector tends to lag the business cycle, as sector customers tend to wait until they are sure of recovery and have high utilization of their existing capacity before they expand their own production. However, demand is not entirely cyclical, as the need to replace obsolete or aging equipment or machines is relatively stable. There is also a stark difference in behavior of the largest industrial companies and smaller companies in their ecosystems. Larger manufacturers are long-cycle as it takes months to build machines, planes, or equipment. These companies are less sensitive to the business cycle. On the other hand, their suppliers are “short cycle” as they sell parts to many customers, turn their inventory frequently, and are very sensitive to the economic condition. At present, as economic growth is slowing, long-cycle industrial companies are preferable to short-cycle ones. Despite a bifurcation in demand, Industrials tend to underperform in a generic economic slowdown (Chart 12). This is unsurprising as the relative performance of Industrials is correlated to industrial production and the ISM PMI (Chart 13). Chart 12Historically, Industrials Underperformed During The Slowdown Stage Of The Business Cycle
Industrials: A Trifecta Of Positives
Industrials: A Trifecta Of Positives
Chart 13Industrials Usually Underperform When IP And ISM PMI Decline
Industrials Usually Underperform When IP And ISM PMI Decline
Industrials Usually Underperform When IP And ISM PMI Decline
Chart 14Survey Of Capex Intentions Is Weakening
Survey Of Capex Intentions Is Weakening
Survey Of Capex Intentions Is Weakening
And while we touted the beginning of the new industrial boom in the US, and a brand new Capex cycle, we need to monitor it carefully, as multiple surveys of Capex intentions are decelerating (Chart 14). Tighter Monetary Policy: Another potential headwind comes from rising rates. After all, the higher cost of corporate borrowing may weigh on demand for industrial goods. However, historically, US industrial stocks outperformed the S&P 500 Index in the past 70 years during periods of rising bond yields, including the inflation decade of the 1970s (Chart 15). Industrial companies are well positioned to withstand inflation as strong pricing power allows them to pass on their costs to customers. Chart 15When Rates Rise, Industrials Outperform
When Rates Rise, Industrials Outperform
When Rates Rise, Industrials Outperform
The macroeconomic backdrop presents challenges to Industrial companies Fundamentals Are Strong Significant Pricing Power: While dangers are looming in the macroeconomic backdrop, so far industrial companies have been doing well thanks to their significant pricing power (Chart 16), which they enjoy due to high capacity utilization. The relationship between capacity utilization and selling prices is not linear but exponential. When capacity reaches its limit and shortages arise, potential buyers will likely be willing to pay considerably higher prices to secure the supply of goods that they require. High Operating Leverage: In addition to high pricing power, industrial companies enjoy high operating leverage, which implies that while the economy is growing, even if at a slower pace, they can easily convert sales into profits. This will not be the case when the economy is outright contracting – then high operating leverage will become a liability. Chart 16Industrials Enjoy Substantial Pricing Power
Industrials Enjoy Substantial Pricing Power
Industrials Enjoy Substantial Pricing Power
Strong Q2-2022 Earnings And Sales Results: This explains the strong Q2-2022 sales and earnings results of the Industrial sector. Industrial earnings grew at 17.4%, while its sales increased by 13.3% – a remarkable feat, considering that many companies, especially consumer-facing ones, are struggling with shrinking profitability – earnings growth of the Consumer Discretionary sector was down 12.6%. Clearly, business-to-business companies are faring much better than consumer-facing ones, whose demand was pulled forward by the pandemic, and whose customers are reeling from rising prices and are tightening their belts. Looking ahead, margins are expected to shrink by 0.5% (Chart 17), which is modest compared to the 2.5% contraction expected for the S&P 500. In terms of earnings growth expectations, they have fallen but still exceed the market by an impressive 10% even after a series of downgrades. Importantly, earnings growth in real terms is also positive (Charts 18 & 19). Chart 17Operating Margins Are Expected To Hold Up Well
Operating Margins Are Expected To Hold Up Well
Operating Margins Are Expected To Hold Up Well
Chart 18Industrial Earnings Will Grow Faster Than The Market
Industrial Earnings Will Grow Faster Than The Market
Industrial Earnings Will Grow Faster Than The Market
Chart 19Earnings Expectations Have Been Re-calibrated
Earnings Expectations Have Been Re-calibrated
Earnings Expectations Have Been Re-calibrated
What Companies Are Saying All the charts and numbers align well with what we have heard from companies during the earnings season. For instance, nearly every major player within its own respective sub-industry reported healthy demand, low inventories, and a hefty backlog this quarter. Here are a few quotes from the largest players: Caterpillar (CAT): “We expect production and utilization levels will remain elevated, and our autonomous solutions continued to gain momentum … overall demand remained healthy across our segments … was unable to completely satisfy strong customer demand for our machines and engines.” MMM: “Continued strong demand for our solutions in semiconductor, factory automation, and automotive end markets.” GE: “In Renewables, … we are making progress. Our pricing has substantially improved onshore … we're growing our higher-margin businesses, such as grid automation, which delivered double-digit orders growth.” Honeywell (HON): “Orders were up 12% year over year and closing backlog was also up 12% year over year.” The profitability of the Industrial sector is expected to be resilient and to better the market. Valuations And Technicals The Industrial sector and the Capital Goods Industry group trade on par with the S&P 500 on a forward earnings basis (17.7x and 17.9x to 18.0x). The BCA Valuations Indicator signals a neutral level of valuation which is roughly in line with the 10-year average. From the BCA Technical Indicator standpoint, Capitals Goods are also in the neutral zone (Chart 20). Valuations and technicals are moderate for the sector. Chart 20Valuations And Technicals
Valuations And Technicals
Valuations And Technicals
Investment Implications The US industrial sector is in the middle of a boom fueled by a trifecta of positives: Onshoring, automation, and favorable government policy. And while it is hard to fight the Fed and the business cycle, it appears that for now, the sector is defying gravity despite slowing manufacturing surveys and tighter monetary policy. So far fundamentals appear strong, and earnings expectations are robust thanks to the high pricing power and operating leverage of the sector. Within Capital Goods, we favor industries and companies that benefit from these tailwinds: Aerospace and Defense which is to benefit from increased federal defense spending; Robotics and Automation which is overrepresented in the Electrical Equipment industry; and Renewables, i.e., companies that manufacture and service wind turbines and solar panels. Construction and building materials will have a second breath when Infrastructure spending projects will actually get selected and approved. We are both strategically and tactically bullish on the sector but will monitor it closely from a tactical standpoint. After all, industrial surveys are at odds with the resilient earnings expectations. ETFs There are a number of very inexpensive and highly liquid ETFs from Vanguard, iShares, and State Street, that capture the performance of the Industrial sector (Table 5). Table 5Industrial Sector ETFs
Industrials: A Trifecta Of Positives
Industrials: A Trifecta Of Positives
Bottom Line The US industrial sector is in the middle of a boom fueled by onshoring, automation, and favorable government policy. This trifecta of positives helps the sector to defy the gravity of the slowing economy. Companies are optimistic and earnings growth expectations are both robust and resilient. We are both strategically and tactically bullish on the sector but will continue to monitor it closely, watching out for potential cracks in operating performance. Irene Tunkel Chief Strategist, US Equity Strategy irene.tunkel@bcaresearch.com Footnotes 1 Reshoring Initiative reshorenow.org 2 https://www.automate.org/ Recommended Allocation Recommended Allocation: Addendum
What Our Clients Are Asking: The Bear Market 2.0 Webcast Follow Up
What Our Clients Are Asking: The Bear Market 2.0 Webcast Follow Up
Executive Summary Reshoring And FDI Job Creation Have Accelerated After The Pandemic
Industrials: A Trifecta Of Positives
Industrials: A Trifecta Of Positives
The US is entering a period of an industrial boom thanks to limited manufacturing capacity paired with strong demand for industrial and consumer goods. In addition, a trifecta of positive developments is further boosting US manufacturing: Onshoring, automation, and fiscal stimulus. Onshoring has accelerated after the onset of the pandemic and reshoring announcements are growing steadily. Automation and robotization allow industrial companies to circumvent labor shortages and rising wages and, hence, boost their profit margins. The domestic political landscape in the US is also favorable for industrial stocks given the three major legislative Acts (Infrastructure Investment & Jobs, Inflation Reduction, and National Defense Authorization) that will secure a healthy demand pipeline. While long-term trends are favorable for the sector, a macroeconomic backdrop of slowing growth is a headwind. However, thanks to a confluence of positive long-term trends, most companies are optimistic. Bottom Line: The US industrial sector is in the middle of a boom fueled by onshoring, automation, and favorable government policy. This trifecta of positives helps the sector to defy the gravity of the slowing economy. We remain overweight Industrials on both tactical and strategical time horizons but will continue to monitor it closely, watching out for potential cracks in operating performance. Feature A little over a year ago EMS, GIS, and USES co-published a report “Industrials as equity sector winner in the coming years”. In that report, we posited that the Industrial sector is poised for outperformance as it enjoys a boom thanks to strong new trends in onshoring and automation. In addition to the tectonic shifts described above, the sector has also found itself at the epicenter of the US legislative activity, which will provide a significant tailwind for its performance. Since we published the report on July 30, 2021, Industrials have performed in line with the S&P 500. However, since the beginning of the year, Industrials and Capital Goods outperformed the index by 7%, showing impressive resilience (Chart 1 and Table 1). Chart 1A Resilient Cyclical Sector
A Resilient Cyclical Sector
A Resilient Cyclical Sector
In this week’s report, we take a close look at the trends highlighted above and conduct a deep dive to evaluate whether the sector is still attractive on a tactical basis considering the backdrop of rising rates and slowing economic activity. Our focus is on the Industrial sector in general, and the Capital Goods Industry Group, in particular. We will also assess which industries are best positioned for outperformance. Table 1Industrials Outperformed On The Way Down And During The Summer Rally
Industrials: A Trifecta Of Positives
Industrials: A Trifecta Of Positives
Sneak Preview: The US industrial sector is in the middle of a boom fueled by onshoring, automation, and favorable government policy. This trifecta of positives helps the sector to defy the gravity of the slowing economy. For now, we are both strategically and tactically bullish on the sector but remain vigilant. US Manufacturing Capacity Has Been Severely Limited For Years US manufacturing capacity has been stagnant over the past 20 years, and the level of US manufacturing employment has declined by 30% since 2000 (Charts 2 & 3). Presently, manufacturing employment accounts for only 8% of total US employment. Chart 2US Manufacturing Employment Has Been Shrinking For Decades
US Manufacturing Employment Has Been Shrinking For Decades
US Manufacturing Employment Has Been Shrinking For Decades
Chart 3US Manufacturing Capacity Has Not Expanded In The Past Two Decades
US Manufacturing Capacity Has Not Expanded In The Past Two Decades
US Manufacturing Capacity Has Not Expanded In The Past Two Decades
The reason for the lack of capacity expansion over the past 20 years has been the outsourcing and shifting of production to other countries, especially China. The peak in US manufacturing capacity and employment occurred after the massive Asian currency devaluation in 1998 and China’s WTO admission in 2001. The semiconductor sector, which has recently come into the limelight, is a case in point: From 1990 to 2020, the percentage of chips manufactured in the US has fallen from 37% to 10%, with the lion’s share of chips manufactured in Asia. This trend has brought about The Chips Act which seeks to reverse the trend for national security reasons. Notably, more recently, the decline in manufacturing capacity and employment has started to reverse. More about this later. American Manufacturing Is Booming Again Limited manufacturing capacity paired with a strong demand for industrial and consumer goods translates into an industrial boom. Industrial companies are incentivized to expand given they are already operating at nearly full capacity (Chart 4) and enjoying considerable pricing power. Building industrial capacity in itself lifts demand for industrial goods and the US may be in the early innings of the new Capex cycle, unless the trend is derailed by headwinds from a significantly tighter monetary policy. After all, the age of US capital stock, at 24 years, is two years older than at previous peaks, indicating that many companies are overdue for replacing some of their equipment and machinery (Chart 5). Chart 4Industrial Companies Operate At Nearly Full Capacity
Industrial Companies Operate At Nearly Full Capacity
Industrial Companies Operate At Nearly Full Capacity
Chart 5The US Capital Stock Has To Be Renewed
The US Capital Stock Has To Be Renewed
The US Capital Stock Has To Be Renewed
Indeed, this may already be happening. According to S&P Dow Jones Indices, which analyzed second-quarter earnings season data, capital expenditures of the companies in the S&P 500, have been growing at a faster pace than stock repurchases for the first time since the first quarter of 2021, rising by 20% from a year earlier. Companies from Pepsi to Google to GM are investing in their production capacity, which in itself may be an encouraging sign that they are comfortable with the demand outlook. Of course, the caveat here is that industrials are late in cycle performance, as companies usually wait towards the end of the cycle to expand, only to find waning demand for their products. You Say “Reshoring,” I Say “Onshoring” A multi-decade decline in US manufacturing employment has started to reverse after the GFC, with the onset of the pandemic and geopolitical tensions accelerating the pace of reshoring and Foreign Direct Investing (FDI). Reshoring and FDI job announcements have increased from 6K in 2010 to 345K in 2022 (Chart 6). The resulting cumulative 950,000 incremental hires represent about 7% of US manufacturing employment. The acceleration of jobs coming back combined with the decline in the rate of offshoring has resulted in a 12-year steady uptrend in US manufacturing jobs. Truly amazing! Onshoring remains on top of mind for companies’ management. According to Statista, mentions of onshoring buzzwords in earnings calls and presentations of US public companies have increased from about 100 throughout 2020 to nearly 200 in Q2-2020. Chart 6Reshoring And FDI Job Creation Have Accelerated After The Pandemic
Industrials: A Trifecta Of Positives
Industrials: A Trifecta Of Positives
According to Morgan Stanley’s survey of more than 400 executives of large corporations from the US to Germany to Japan, the most important factor in supply chain decisions is geopolitical stability, followed by skilled labor, physical infrastructure, and a developed supply chain ecosystem. On nearly every count, the US outranked Europe, China, and Mexico. Some 18% of the companies planned to significantly expand US manufacturing in the next 12 months, while 36% anticipated doing so within three years. More than 40% of US companies were taking steps to “onshore” supply chains. The reasons are well publicized: The COVID crisis has revealed over-dependence on imports. China’s decoupling from the US, tensions in the Taiwan Strait, and the Russian/Ukraine war have invoked concerns about the reliability of the existing supply chains. Supply chain disruptions have highlighted corporate vulnerabilities and had made companies realize that “just-in-case” trumps “just-in-time.” The US is pursuing protectionist policies that are to benefit companies operating in the US, Mexico, and Canada. According to Reshoring Initiative,1 Industrial and Tech companies are at the forefront of reshoring: Electrical Equipment, Chemicals, Transportation Equipment, Computer, and Electronic Products, and Medical Equipment suppliers are the leaders in onshoring (Table 2). Many large manufacturers such as Caterpillar have implemented or announced plans to bring offshore manufacturing back to the US. Table 2Reshoring Jobs By Top 5 Industries
Industrials: A Trifecta Of Positives
Industrials: A Trifecta Of Positives
Will onshoring benefit some of the former manufacturing hubs? We believe it will, as Kentucky, North Carolina, Georgia, Ohio, and Alabama are the top five destinations (Table 3). However, there is a hitch. The US unemployment rate, which is at an all-time low of 3.5%, is certainly a speed limit. Moreover, companies that bring their businesses back home do realize that labor costs in this country are many times higher than, say, in Asia. Hence, one of the solutions they pursue is automation. After many years in the making, onshoring is finally gaining pace, benefiting the US manufacturing base. Table 32022 Projected Reshoring Jobs By Top 10 States
Industrials: A Trifecta Of Positives
Industrials: A Trifecta Of Positives
Automation To The Rescue! The Pace of Robotization And Automation Is Accelerating A critical constraint for the expansion of US manufacturing is the labor shortage. Open vacancies in manufacturing are now at a record high, 100% above the 2018 peak (Chart 7, top panel). Notably, industrial companies have been experiencing difficulties hiring qualified staff over the past 10 years which has led to high wage growth (Chart 7, bottom panel). Chart 7US Manufacturers Cannot Fill Vacant Positions, Wages Are Surging
US Manufacturers Cannot Fill Vacant Positions, Wages Are Surging
US Manufacturers Cannot Fill Vacant Positions, Wages Are Surging
Chart 8Automation Expands Profits Margins Of Global Industrials
Automation Expands Profits Margins Of Global Industrials
Automation Expands Profits Margins Of Global Industrials
One remedy is automation. Replacing labor with automation/robots allows companies to produce more and avoid a profit margin squeeze (Chart 8). In a recent report published by the International Federation of Robotics, industrial robots reported record preliminary sales in 2021 with 486,800 units shipped globally, a 27% increase from 2020. The US has been lagging behind other developed countries in terms of automation and robotization (Chart 9). However, labor shortages brought about by the pandemic appear to have “moved the needle.” According to the Association for Advancing Automation (A3),2 the number of robots sold in the US in 2021 rose by 27% over 2020 with 49,900 units installed. 2022 is on pace to exceed previous records, with North American companies ordering a record 11,595 robots. Chart 9US Has Been Lagging Other Developed Nations In Robot Installations
Industrials: A Trifecta Of Positives
Industrials: A Trifecta Of Positives
Non-automotive sales now represent 58% of the total, demonstrating a broadening reach of automation. Metals, Auto, and Food and Consumer Goods have the highest growth in the purchase of robots (Chart 10). Chart 10In 2021 The Pace Of Robot Installation Has Picked Up
Industrials: A Trifecta Of Positives
Industrials: A Trifecta Of Positives
Implications For Industrial Companies The Industrials sector is home to companies that create robots and offer automation solutions as well as companies on the receiving end of the trend. Both sellers and buyers are to benefit: Buyers Of Robots: Manufacturing companies automating production and enlisting robots into their operations will enjoy higher operating leverage, lower labor costs, and more resilient margins. It is easier to automate processes in manufacturing than in service sectors. Consequently, we believe profit margins in manufacturing will outperform those of service sector companies, where automation will be slower. Sellers Of Robots: The sizzling demand for robots demonstrates that technological breakthroughs are no longer just about the Tech companies, and many industrial companies are to benefit from these nascent trends. Rockwell Automation, Eaton, and Caterpillar are the leaders in industrial automation. These companies also reach across the aisle to software companies to leverage their expertise in data storage, computing, and artificial intelligence. Rockwell has just recently partnered with Microsoft, while others are acquiring software companies. Deere has acquired GUSS Automation, a pioneer in semi-autonomous springs for high-value crops. These companies are to benefit from strong demand for their products and should exhibit strong sales and profit growth. To meet strong demand, industrial/manufacturing companies will automate their processes. This will allow them to boost volume and cap costs resulting in widening profit margins. Uncle Sam Loves American Manufacturing Both Biden and Trump before him, have stated that their overarching objective is to revive America’s manufacturing. However, their methods were drastically different, with Trump introducing tax cuts and tariffs, while Biden leans heavily on fiscal stimulus. The following is a recap of some of the recent laws passed by Congress and signed by President Biden. Infrastructure Investment And Jobs Act The $1.2-trillion Infrastructure Investment and Jobs Act will increase US government non-defense spending to bring it to around 3% of GDP, a level comparable to the 1980s-90s and larger than the 2010s. The bill’s focus is on traditional infrastructure – roads, bridges, ports, and electrical grid modernization – but also includes more modern elements such as $65 billion for 5G broadband Internet and $36 billion for electric vehicles and environmental remediation (Table 4). Implementation of the bill is delayed to 2023-24. Table 4Itemized Infrastructure Plan
Industrials: A Trifecta Of Positives
Industrials: A Trifecta Of Positives
However, the market is forward-looking and companies in Construction & Engineering, and Building Products industries are already winners, and are up 12% in relative terms since the bill was passed on November 15, 2021. The potential increase in public construction will help offset a slump in residential construction on the back of the softening housing market (Chart 11). Chart 11The Increase In Public Construction Will Help Offset A Slump In Residential Construction
The Increase In Public Construction Will Help Offset A Slump In Residential Construction
The Increase In Public Construction Will Help Offset A Slump In Residential Construction
Inflation Reduction Act (IRA) The bill earmarks $370 billion for clean energy spending as well as EV tax credits for both new and used cars. We have written on the topic of “Green and Clean” and the effect of the IRA on renewable energy and EV industries, two industries that are major beneficiaries of the bill. However, the bill also creates an enormous opportunity for industrial companies, which can build and service renewable infrastructure, such as Quanta Services (PWR) and Eaton (ETN). Companies that produce and service wind turbines (GE) and solar batteries will also get a revenue boost from the package. Chips Act Congress has passed the CHIPS+ bill to alleviate the chip shortage and shore up US competitiveness with China. Money is earmarked for domestic semiconductor production and research, and factory construction. While the key beneficiaries are chip foundries, construction of new factories will require equipment and services of a wide range from industrial companies from Construction to Machinery. National Defense Authorization Act In December, the House and Senate Armed Services Committee leadership released the Fiscal Year 2022 National Defense Authorization Act (NDAA). This bill introduces an overall discretionary authorization of $768.2 billion including $740.3 billion for base Department of Defense programs and $27.8 billion for national security programs in the Department of Energy. At a later date, another $37 billion was amended to the bill to include $2.5 billion to help pay higher fuel costs; $550 million for Ukraine, funding for five ships, eight Boeing Co-made F-18 Super Hornet fighter jets, and five Lockheed Martin C-130 Hercules planes; and about $1 billion for four Patriot missile units. For FY 2023, the House has already passed $839 billion, which is $37 billion above the White House request. The Senate will work on the bill after the summer recess. But it is already clear that defense spending has become a bipartisan issue. The increase in the defense budget, as well as additional allocation of funds towards Ukraine, have been a major boost for the Aerospace and Defense industry. We overweighted the sector back in January and it is up 24% in relative terms. Overweight Or Not, That Is The Question Macroeconomic Backdrop Business Cycle: Performance of the Industrial sector tends to lag the business cycle, as sector customers tend to wait until they are sure of recovery and have high utilization of their existing capacity before they expand their own production. However, demand is not entirely cyclical, as the need to replace obsolete or aging equipment or machines is relatively stable. There is also a stark difference in behavior of the largest industrial companies and smaller companies in their ecosystems. Larger manufacturers are long-cycle as it takes months to build machines, planes, or equipment. These companies are less sensitive to the business cycle. On the other hand, their suppliers are “short cycle” as they sell parts to many customers, turn their inventory frequently, and are very sensitive to the economic condition. At present, as economic growth is slowing, long-cycle industrial companies are preferable to short-cycle ones. Despite a bifurcation in demand, Industrials tend to underperform in a generic economic slowdown (Chart 12). This is unsurprising as the relative performance of Industrials is correlated to industrial production and the ISM PMI (Chart 13). Chart 12Historically, Industrials Underperformed During The Slowdown Stage Of The Business Cycle
Industrials: A Trifecta Of Positives
Industrials: A Trifecta Of Positives
Chart 13Industrials Usually Underperform When IP And ISM PMI Decline
Industrials Usually Underperform When IP And ISM PMI Decline
Industrials Usually Underperform When IP And ISM PMI Decline
Chart 14Survey Of Capex Intentions Is Weakening
Survey Of Capex Intentions Is Weakening
Survey Of Capex Intentions Is Weakening
And while we touted the beginning of the new industrial boom in the US, and a brand new Capex cycle, we need to monitor it carefully, as multiple surveys of Capex intentions are decelerating (Chart 14). Tighter Monetary Policy: Another potential headwind comes from rising rates. After all, the higher cost of corporate borrowing may weigh on demand for industrial goods. However, historically, US industrial stocks outperformed the S&P 500 Index in the past 70 years during periods of rising bond yields, including the inflation decade of the 1970s (Chart 15). Industrial companies are well positioned to withstand inflation as strong pricing power allows them to pass on their costs to customers. Chart 15When Rates Rise, Industrials Outperform
When Rates Rise, Industrials Outperform
When Rates Rise, Industrials Outperform
The macroeconomic backdrop presents challenges to Industrial companies Fundamentals Are Strong Significant Pricing Power: While dangers are looming in the macroeconomic backdrop, so far industrial companies have been doing well thanks to their significant pricing power (Chart 16), which they enjoy due to high capacity utilization. The relationship between capacity utilization and selling prices is not linear but exponential. When capacity reaches its limit and shortages arise, potential buyers will likely be willing to pay considerably higher prices to secure the supply of goods that they require. High Operating Leverage: In addition to high pricing power, industrial companies enjoy high operating leverage, which implies that while the economy is growing, even if at a slower pace, they can easily convert sales into profits. This will not be the case when the economy is outright contracting – then high operating leverage will become a liability. Chart 16Industrials Enjoy Substantial Pricing Power
Industrials Enjoy Substantial Pricing Power
Industrials Enjoy Substantial Pricing Power
Strong Q2-2022 Earnings And Sales Results: This explains the strong Q2-2022 sales and earnings results of the Industrial sector. Industrial earnings grew at 17.4%, while its sales increased by 13.3% – a remarkable feat, considering that many companies, especially consumer-facing ones, are struggling with shrinking profitability – earnings growth of the Consumer Discretionary sector was down 12.6%. Clearly, business-to-business companies are faring much better than consumer-facing ones, whose demand was pulled forward by the pandemic, and whose customers are reeling from rising prices and are tightening their belts. Looking ahead, margins are expected to shrink by 0.5% (Chart 17), which is modest compared to the 2.5% contraction expected for the S&P 500. In terms of earnings growth expectations, they have fallen but still exceed the market by an impressive 10% even after a series of downgrades. Importantly, earnings growth in real terms is also positive (Charts 18 & 19). Chart 17Operating Margins Are Expected To Hold Up Well
Operating Margins Are Expected To Hold Up Well
Operating Margins Are Expected To Hold Up Well
Chart 18Industrial Earnings Will Grow Faster Than The Market
Industrial Earnings Will Grow Faster Than The Market
Industrial Earnings Will Grow Faster Than The Market
Chart 19Earnings Expectations Have Been Re-calibrated
Earnings Expectations Have Been Re-calibrated
Earnings Expectations Have Been Re-calibrated
What Companies Are Saying All the charts and numbers align well with what we have heard from companies during the earnings season. For instance, nearly every major player within its own respective sub-industry reported healthy demand, low inventories, and a hefty backlog this quarter. Here are a few quotes from the largest players: Caterpillar (CAT): “We expect production and utilization levels will remain elevated, and our autonomous solutions continued to gain momentum … overall demand remained healthy across our segments … was unable to completely satisfy strong customer demand for our machines and engines.” MMM: “Continued strong demand for our solutions in semiconductor, factory automation, and automotive end markets.” GE: “In Renewables, … we are making progress. Our pricing has substantially improved onshore … we're growing our higher-margin businesses, such as grid automation, which delivered double-digit orders growth.” Honeywell (HON): “Orders were up 12% year over year and closing backlog was also up 12% year over year.” The profitability of the Industrial sector is expected to be resilient and to better the market. Valuations And Technicals The Industrial sector and the Capital Goods Industry group trade on par with the S&P 500 on a forward earnings basis (17.7x and 17.9x to 18.0x). The BCA Valuations Indicator signals a neutral level of valuation which is roughly in line with the 10-year average. From the BCA Technical Indicator standpoint, Capitals Goods are also in the neutral zone (Chart 20). Valuations and technicals are moderate for the sector. Chart 20Valuations And Technicals
Valuations And Technicals
Valuations And Technicals
Investment Implications The US industrial sector is in the middle of a boom fueled by a trifecta of positives: Onshoring, automation, and favorable government policy. And while it is hard to fight the Fed and the business cycle, it appears that for now, the sector is defying gravity despite slowing manufacturing surveys and tighter monetary policy. So far fundamentals appear strong, and earnings expectations are robust thanks to the high pricing power and operating leverage of the sector. Within Capital Goods, we favor industries and companies that benefit from these tailwinds: Aerospace and Defense which is to benefit from increased federal defense spending; Robotics and Automation which is overrepresented in the Electrical Equipment industry; and Renewables, i.e., companies that manufacture and service wind turbines and solar panels. Construction and building materials will have a second breath when Infrastructure spending projects will actually get selected and approved. We are both strategically and tactically bullish on the sector but will monitor it closely from a tactical standpoint. After all, industrial surveys are at odds with the resilient earnings expectations. ETFs There are a number of very inexpensive and highly liquid ETFs from Vanguard, iShares, and State Street, that capture the performance of the Industrial sector (Table 5). Table 5Industrial Sector ETFs
Industrials: A Trifecta Of Positives
Industrials: A Trifecta Of Positives
Bottom Line The US industrial sector is in the middle of a boom fueled by onshoring, automation, and favorable government policy. This trifecta of positives helps the sector to defy the gravity of the slowing economy. Companies are optimistic and earnings growth expectations are both robust and resilient. We are both strategically and tactically bullish on the sector but will continue to monitor it closely, watching out for potential cracks in operating performance. Irene Tunkel Chief Strategist, US Equity Strategy irene.tunkel@bcaresearch.com Footnotes 1 Reshoring Initiative reshorenow.org 2 https://www.automate.org/ Strategic View Open Tactical Positions (0-6 Months) Open Cyclical Recommendations (6-18 Months) Table A2Political Risk Matrix
Industrials: A Trifecta Of Positives
Industrials: A Trifecta Of Positives
Table A3US Political Capital Index
Industrials: A Trifecta Of Positives
Industrials: A Trifecta Of Positives
Chart A1Presidential Election Model
Third Quarter US Political Outlook: Last Ditch Effort
Third Quarter US Political Outlook: Last Ditch Effort
Chart A2Senate Election Model
Third Quarter US Political Outlook: Last Ditch Effort
Third Quarter US Political Outlook: Last Ditch Effort
Table A4House Election Model
Biden's Midterm Tactics Bear Fruit… But There's A Snake
Biden's Midterm Tactics Bear Fruit… But There's A Snake
Table A5APolitical Capital: White House And Congress
Industrials: A Trifecta Of Positives
Industrials: A Trifecta Of Positives
Table A5BPolitical Capital: Household And Business Sentiment
Industrials: A Trifecta Of Positives
Industrials: A Trifecta Of Positives
Table A5CPolitical Capital: The Economy And Markets
Industrials: A Trifecta Of Positives
Industrials: A Trifecta Of Positives