United States
Although the BCA house view calls for a neutral equity allocation on a cyclical 12-month investment horizon, some of our more optimistic colleagues remain tactically overweight. Specifically, our Global Investment strategists have highlighted three key…

Executive Summary The Fed Versus The Market
The Fed Versus The Market
The Fed Versus The Market
In today’s report, we summarize the arguments of bulls and bears to examine the possible longevity of the rally. The Bulls’ view is centered around several key themes: Inflation has turned. The Fed is less hawkish than initially assumed, and Jay Powell is not Paul Volcker. The economy is resilient, and consumers are spending. Corporate earnings will surprise on the upside thanks to consumer strength. Meanwhile, the bears argue that: Growth is slowing and a soft landing is elusive, which will lead to earnings disappointment. Valuations and Technicals are no longer attractive – the best part of the rally is likely over, and risk-reward is skewed to the downside. Inflation is embedded and broad-based and it will take many months to reach the level that is palatable to the Fed. Bottom Line: The rally was expected, but its force and durability took us by surprise. Now, after a strong rebound, risks are skewed to the downside and the markets are fragile, but the rally may continue. We offer our take on what can bring this rally to a halt, and the “danger” signs investors need to be on the lookout for. Feature The fast and furious rally off the June 16 lows has taken many investors by surprise. Over the past two months, the S&P 500 has rebounded by 17%, the NASDAQ is up 22%, while Growth has outperformed Value by 9%. Thematic small-cap growth ETFs have fared even better (Chart 1) with Cathie Wood’s ARKG and ARKK up nearly 50%. The Technology and Consumer Discretionary sectors are up 23% and 28% respectively, while Energy and Materials are relatively flat, showcasing a rotation away from the inflation winners to losers. In this week’s report, we will “dissect” the rally and its key drivers to better understand what can bring this rally to a halt. We will also summarize the arguments of the bulls and present our “bearish” rebuttal to some of the assumptions. Sneak Preview: After the powerful rebound, the market is fragile, and risks are skewed to the downside. By summarizing the arguments of bulls and bears, we are offering our take on what can bring this rally to a halt, i.e., hawkish Fed speeches, disappointing inflation readings, rising rates, and bad earnings. However, a positive surprise along each of these dimensions may also result in the next leg up. Chart 1ETF Universe Overview
What Can Bring This Rally To A Halt?
What Can Bring This Rally To A Halt?
Anatomy Of The Rally To understand what fuels the rally, we need to understand what its key catalysts are. Oversold: First and foremost, in mid-June, US equities were severely oversold – the BCA Capitulation Indicator hit levels last seen in the spring of 2020 (Chart 2). The BoA institutional survey has also reported an extreme level of bearishness. Pull back in the price of energy: This created fertile ground for a rebound, but the catalyst came from the turn in commodities and energy prices. Extreme pessimism about global growth after the Fed’s aggressive response to a disappointing inflation print has triggered a sell-off in oil and metals. Since mid-June, the GSCI Commodities and the GSCI Energy index are in a bear market downtrend, 21% and 25% off their peaks. Inflation moderating: This disinflationary development has unleashed a positive reinforcement loop: Lower energy prices led to a turn in the CPI print. And many still believe that, after all, inflation is transitory: With supply disruptions clearing and prices of energy and commodities turning, inflation will dissipate just as fast as it arrived. We know this because inflation breakevens are currently at levels last seen a year ago (Chart 3). Chart 2Capitulated
Capitulated
Capitulated
Chart 3Cooling Off : Back To 2021
Cooling Off : Back to 2021
Cooling Off : Back to 2021
Gentler Fed: That is when the market decided that easing price pressures in concert with slowing growth would compel the Fed to pursue a shallower and shorter path of interest rate increases than initially expected – rate increases derived from OIS started to undershoot the “dot plot” (Chart 4). Effectively, the bond market started to forecast that the Fed will end the year at 3.5% and ease as soon as early 2023. In other words, the Fed is nearing the end of the hiking cycle. Naturally, the long end of the Treasury curve has pulled back to April levels, despite a much higher Fed rate. One way or another, yields have stabilized. Lower rates are a boon for equities: As a long-duration asset, equity valuations are inversely correlated with long yields (Chart 5). A better-than-expected Q2 earnings season was the icing on the cake. Chart 4The Market Expects Cuts As Soon As Early 2023
The Market Expects Cuts As Soon As Early 2023
The Market Expects Cuts As Soon As Early 2023
Chart 5Falling Yields Propelled Equities Higher
Falling Yields Propelled Equities Higher
Falling Yields Propelled Equities Higher
Was The Rally Surprising? The rally itself did not surprise us – after all, we did expect the market to turn on a dime at the earliest whiff of falling inflation (Chart 6). Admittedly, we were taken aback by its strength and longevity. With inflation turning, we also expected a change in leadership from the Energy and Materials sectors to Technology and Consumer Discretionary (Chart 7). We also predicted back in January in our “Are We There Yet?!” report that, based on the previous hiking cycles, Tech would rebound roughly three months after the first rate hike (Chart 8), which was taking us to June. Chart 6When Inflation Turns, Equities Rebound
What Can Bring This Rally To A Halt?
What Can Bring This Rally To A Halt?
Chart 7Turn in Inflation Triggers A Change In Sector Leadership
What Can Bring This Rally To A Halt?
What Can Bring This Rally To A Halt?
Chart 8A Closer Look At Technology
What Can Bring This Rally To A Halt?
What Can Bring This Rally To A Halt?
In early July, we upgraded Growth to overweight as an asset that would benefit from an anticipated turn in CPI, rate stabilization, and slowing growth (Chart 9). We have also reaffirmed our overweight in Software and Services as a way to play Growth on a sector level. We have downgraded Energy to underweight to reduce exposure to Value. Chart 9Growth And Quality Lead Markets Higher When Inflation Abates
What Can Bring This Rally To A Halt?
What Can Bring This Rally To A Halt?
What The Bulls Think Let’s summarize what the bulls think are the catalysts for the next leg up: Inflation has turned. Looking for further signs that inflation is easing. The Fed is less hawkish than initially assumed, and Jay Powell is not Paul Volcker. Looking for signs that the Fed is getting closer to the end of the hiking cycle. So far, the economy is resilient, and consumers are spending – excess savings and excess demand for labor will soften the blow. Looking for signs that the recession can be avoided. Corporate earnings will surprise on the upside thanks to consumer strength. In the next section, I will juxtapose these optimistic expectations with those of a bear, i.e., of yours truly. A full disclosure – I am not a perma-bear but even eight weeks into the best recovery rally ever, I can’t shake off my pessimism. After all, I am used to the markets going up on injections of liquidity and expect them to shudder when liquidity is mopped out of the system. What The Bears Think, Or A Litany Of Worries Inflation is embedded and broad-based Broad-based: While headline inflation is turning, mostly thanks to prices of energy and materials, it will take a long time for core inflation to revert to the desired 2% as it is broad-based. This is evident from trimmed and median CPI metrics, which continue their ascent. Inflation has also spilled into sticky service items, such as rent (Chart 10). Wage-price spiral: Then there is that pesky wage-price spiral that is manifesting itself in soaring labor costs (Chart 11), which companies pass on to their customers. In the meantime, productivity is falling, and unit labor costs are increasing at 9.5% per year, a rate of growth last seen in 1980s (Chart 12). Demand for labor still exceeds supply with 1.8 job openings for every job seeker, and much more tightening is required to bring supply and demand into balance. Chart 10Entrenched?
Entrenched?
Entrenched?
Chart 11Wage-price Spiral
Wage-price Spiral
Wage-price Spiral
Chart 12ULC Soaring
ULC Soaring
ULC Soaring
Wages and service inflation are more important to structural inflation than energy. Rent and its equivalents constitute 30% of the CPI basket, while wages are roughly 50% of corporate sales and by far the largest component of the cost structure. Inflation is embedded and broad-based and it will take many months to reach the level that is palatable to the Fed. What Does The Fed Think? Fed minutes: Fortunately, we don’t need to guess. The Fed minutes state that "participants agreed that there was little evidence to date that inflation pressures were subsiding" and that inflation “would likely stay uncomfortably high for some time.” Further, “though some inflation reduction might come through improving global supply chains or drops in the prices of fuel and other commodities … Participants emphasized that a slowing in aggregate demand would play an important role in reducing inflation pressures," the minutes said. The Fed minutes state that in moving expeditiously to neutral and then into restrictive territory, “the Committee was acting with resolve to lower inflation to 2% and anchor inflation expectations at levels consistent with that longer-run goal.” In its previous communications, the Fed emphasized that its commitment to a 2% target is unconditional. Is powell more like burns or volcker? In addition, there is an ongoing debate between bulls and bears on the character of the Fed – is Jay Powell a strong-willed hawk like Paul Volker, or more of a waverer like Arthur Burns, who presided over the relentless march of inflation in the seventies? We think that the Chairman can channel Paul Volcker. After all, the Fed has surprised investors by acting swiftly and decisively. Back in March, the Fed dot plot indicated that by the end of the year, the target rate will reach a mere 1.75%. However, we hit a 2.25%-2.50% rate range as soon as July. Jay Powell is concerned about his legacy: He would not want to be remembered as a Chair who mishandled inflation by keeping rates too low despite historically low unemployment and resilient consumers whose accounts are padded with excess post-pandemic savings. The Fed is more hawkish than what the majority of market participants, unscathed by the inflation of the seventies and eighties, believe. The Fed dot plot, to which the Chairman referred on multiple occasions, projects a Fed funds rate of 4% at year-end and of 4.5-5.0% next year (Chart 13). Meanwhile, Fed funds futures are only pricing a rate of about 3.4% for December 2022, even after the hawkish talk from both ex-dove Kashkari and a hawk Bullard (3.75%-4.0% by year-end and 4.4% by the end of 2023). Further, the Fed itself states in its minutes that rates would have to reach a "sufficiently restrictive level" and remain there for "some time" to control inflation that was proving far more persistent than anticipated. The Chicago Fed President Charles Evans has also affirmed that the Fed is definitely not cutting rates in March 2023. Chart 13The Fed Versus The Market
The Fed Versus The Market
The Fed Versus The Market
Doves latch on to comments from the meeting that the Fed will be data-driven, and that it is concerned about overtightening. To us, these are just the musings of the “responsible grown-ups.” Quantitative Tightening: Now let’s not forget another leg of the stool – Quantitative Tightening. QT has been very tame so far and, since the program commenced, the size of the Fed’s balance sheet, $8.9 trillion, has barely budged. In September, the Fed is scheduled to step up QT to a maximum pace of $95 billion from $47.5 billion— running off up to $60 billion in Treasuries, and $35 billion of mortgage securities. Shortages of securities available for run-off due to a dearth of refinancing may trigger a shift to outright selling, further tightening financial conditions. Equities are at odds with the Fed: Last, but not least, equity markets are on a collision course with the Fed. Since June, financial conditions have eased as opposed to tightened, making the Fed’s job so much harder (Chart 14). Chart 14The Rally Eased Financial Conditions
The Rally Eased Financial Conditions
The Rally Eased Financial Conditions
The Fed may prove to be more hawkish than in the past as it is on a quest to combat inflation and takes its mission very seriously. “Don’t fight the Fed” the adage holds. Economic Growth Is Slowing The BCA Business Cycle Indicator signals that economic growth is slowing (Chart 15), which is also evident from a host of economic data releases, ranging from GDP growth to business surveys to housing data. One of the few data series that has defied gravity so far is the jobs report, but the job creation rate is a coincidental indicator at best, and a lagging one at worst. Jobs are usually lost after the start of a recession (Chart 16). Chart 15Economy Is Slowing
Economy Is Slowing
Economy Is Slowing
Chart 16Unemployment Never "Just Ticks Up"
Unemployment Never "Just Ticks Up"
Unemployment Never "Just Ticks Up"
Can consumers save the day? After all, $2.2 trillion in excess savings should help to handle the pressures of negative real wage growth and income growth that is below trend. Yes and no. Gasoline savings can certainly support increases in discretionary spending, all else equal. As for excess savings – adding this money back into the economy may ignite another bout of inflation, working against the Fed, and triggering more rate increases. Many clients ask us if we anticipate a recession. Broadly speaking we do, as the Fed has an arduous task ahead of it in balancing the supply and demand of labor. However, we do not expect a recession in 2022 or even early 2023. Can the Fed succeed by only reducing excess job openings from 1.8 to 1, thus avoiding a rise in unemployment? This is possible, but the probability of such an outcome is low as unemployment never “just ticks up” (Chart 16). However, what the market is pricing is also important. At the moment, the rally shows that it considers the current growth slowdown just a growth scare to be shrugged off. Will there be more disappointments? We think so, as the US economy is facing multiple headwinds from slowing demand for exports due to geopolitical turbulence and payback of overstimulated consumer demand at home. And it is not a recession per se, but a growth disappointment, that may take equities on the next leg down. Growth is slowing and a soft landing is illusive. Earnings Growth Will Continue Its March Towards Zero We believe that earnings growth will continue to slow into year-end – flagging consumer demand at home and abroad, a strong dollar, and soaring unit labor costs that can no longer be fully passed on to stretched consumers, as corporate pricing power is decelerating. Even in Q2-2022, ex-Energy EPS growth is already negative at -1.5%, with Consumer Discretionary, Financials, Communications, and Utilities reporting an earnings contraction. As we predicted back in October, the S&P 500 margins are also compressing, currently at 50bps off their peak, with consensus expecting them to lose another two points within the next 12 months as companies are grappling with rising costs (Chart 17). Analysts are finally in a downgrading mode (Chart 18), with growth over the next 12 months now expected to be 7.7% compared to 10% earlier this summer. Analyst downgrades will continue, and an earnings recession is highly probable as early as Q4-2022. Chart 17Profitability Is Under Pressure
Profitability Is Under Pressure
Profitability Is Under Pressure
Chart 18Earnings Are Finally Being Downgraded
Earnings Are Finally Being Downgraded
Earnings Are Finally Being Downgraded
In terms of the durability of the rally – earnings growth disappointment will be enough to cause equities to pull back. Earnings growth is slowing and more disappointments may be in store. Valuations And Technicals The S&P 500 is currently trading at 18x forward earnings, which is nearly a two-point rebound off the market trough of 15.8x. This is roughly where PE NTM was in April when the 10-year yield stood at 2.80%. Therefore, the multiple reverted on the back of falling rates, and the market is fairly valued considering where rates are now. And another factor to consider: Analysts are slashing earnings expectations, and with E in a P/E likely to be downgraded further – the “true” forward multiple is likely higher than it appears. The BCA Valuation Indicator is also flashing “overvalued” (Chart 19). From the equity risk premium standpoint, 3% is low by historical standards (Chart 20). And if we consider Shiller PE, it has come down from an eye-watering 38x to a still elevated 29x. Chart 19Pricey Again?
Pricey Again?
Pricey Again?
Chart 20Equities Are No Longer Cheap By ERP Or Shiller PE Metrics
Equities Are No Longer Cheap By ERP Or Shiller PE Metrics
Equities Are No Longer Cheap By ERP Or Shiller PE Metrics
Therefore, it is hard to call equities cheap at this point. But being generous, we will call them “fairly priced.” Regardless – at these levels of valuations, the best part of the rally is likely over, and risk-reward is no longer favorable. From a technical standpoint, this rally is broad-based with nearly 90% of the S&P 500 industries trading above their 50-day moving average (Chart 21). But according to the BCA Technical Indicator, equities are no longer oversold and have just crossed into neutral territory (Chart 22). Interestingly, once the Technical indicator starts to rise, it usually ascends for a while, making us wary to boldly call an immediate end to this rally. Chart 21Thrusting
Thrusting
Thrusting
Chart 22No Longer Oversold?
No Longer Oversold?
No Longer Oversold?
Valuations and Technicals are no longer attractive – the best part of the rally is likely over and risk-reward is skewed to the downside. Investment Implications Or Can This Rally Continue? Timing the market is hard at best, impossible at worst. After a 17% rise from the bottom, the S&P 500 is no longer cheap or oversold. Buying equities for valuations or technical reasons is too late – risks are skewed to the downside. Our working assumption is that the rally will pause waiting for the new data that will trigger a new leg up or down. Further, as we pointed out in the Fat and Flat report, the current period is reminiscent of the 1980-1982 Volcker era. So far, the market is following this pattern to a T (Chart 23). The problem is that each leg of the up-and-down market may take months. As such, being (eventually) right and principled does not pay off. After all, the economy is not a market. Therefore, until one of the following happens, the music will continue and the markets can keep dancing, which may be for a while. Chart 23Volcker Era Redux
Volcker Era Redux
Volcker Era Redux
The rally will continue until: There is a communication from the Fed re-emphasizing its hawkish stance and determination to get inflation back to 2%. It may be as one of the FOMC member’s speeches broadcast at Jackson Hole. Long-term Treasury yields pick up either because of the Fed’s actions or speeches or because the economy is overheating. Negative inflation surprise – it may come as either a higher-than-expected inflation reading or evidence that inflation is entrenched, such as rising service or rent inflation, soaring wages, a pick-up in the price of oil or commodities, or a growth surprise out of China, to name but a few. Negative earnings surprise – guidance from a number of companies indicating that economic growth is slowing, and earnings will disappoint. A negative economic surprise may be perceived by the market as “bad news is good news.” We recommend the following: Maintain a well-diversified portfolio, with sufficient allocation to both cyclicals and defensives. Increase exposure to Growth sectors, such as Technology. We particularly favor Software and Services as it leverages the pervasive theme of digitization and migration to the cloud. Reduce allocation to Energy and Materials – these sectors tend to underperform when inflation turns. They are also quintessential value sectors. Maintain some allocation to cyclicals – we are overweight the Industrial sector as it leverages a long-term theme of onshoring and automation. We may be upgrading the Consumer Discretionary sector in the near future. We are also overweight Banks and Insurance for portfolio diversification – these sectors benefit from rising rates and positive growth surprise. Markets turn on a dime and it is good to be prepared. Allocate capital to long-term investment themes: Green and Clean and EV, benefiting from the funds allocated by the IRA bill, Cyber Security, and Defense. Bottom Line: The rally was expected, but its force and durability took us by surprise. Now, after a strong rebound, risks are skewed to the downside and the markets are fragile, but the rally may still continue. We offer our take on what can bring this rally to a halt, and the “danger” signs investors need to be on the lookout for. In the meantime, overweight Growth and maintain a well-diversified portfolio. Irene Tunkel Chief Strategist, US Equity Strategy irene.tunkel@bcaresearch.com Recommended Allocation Recommended Allocation: Addendum
What Our Clients Are Asking: The Bear Market 2.0 Webcast Follow Up
What Our Clients Are Asking: The Bear Market 2.0 Webcast Follow Up
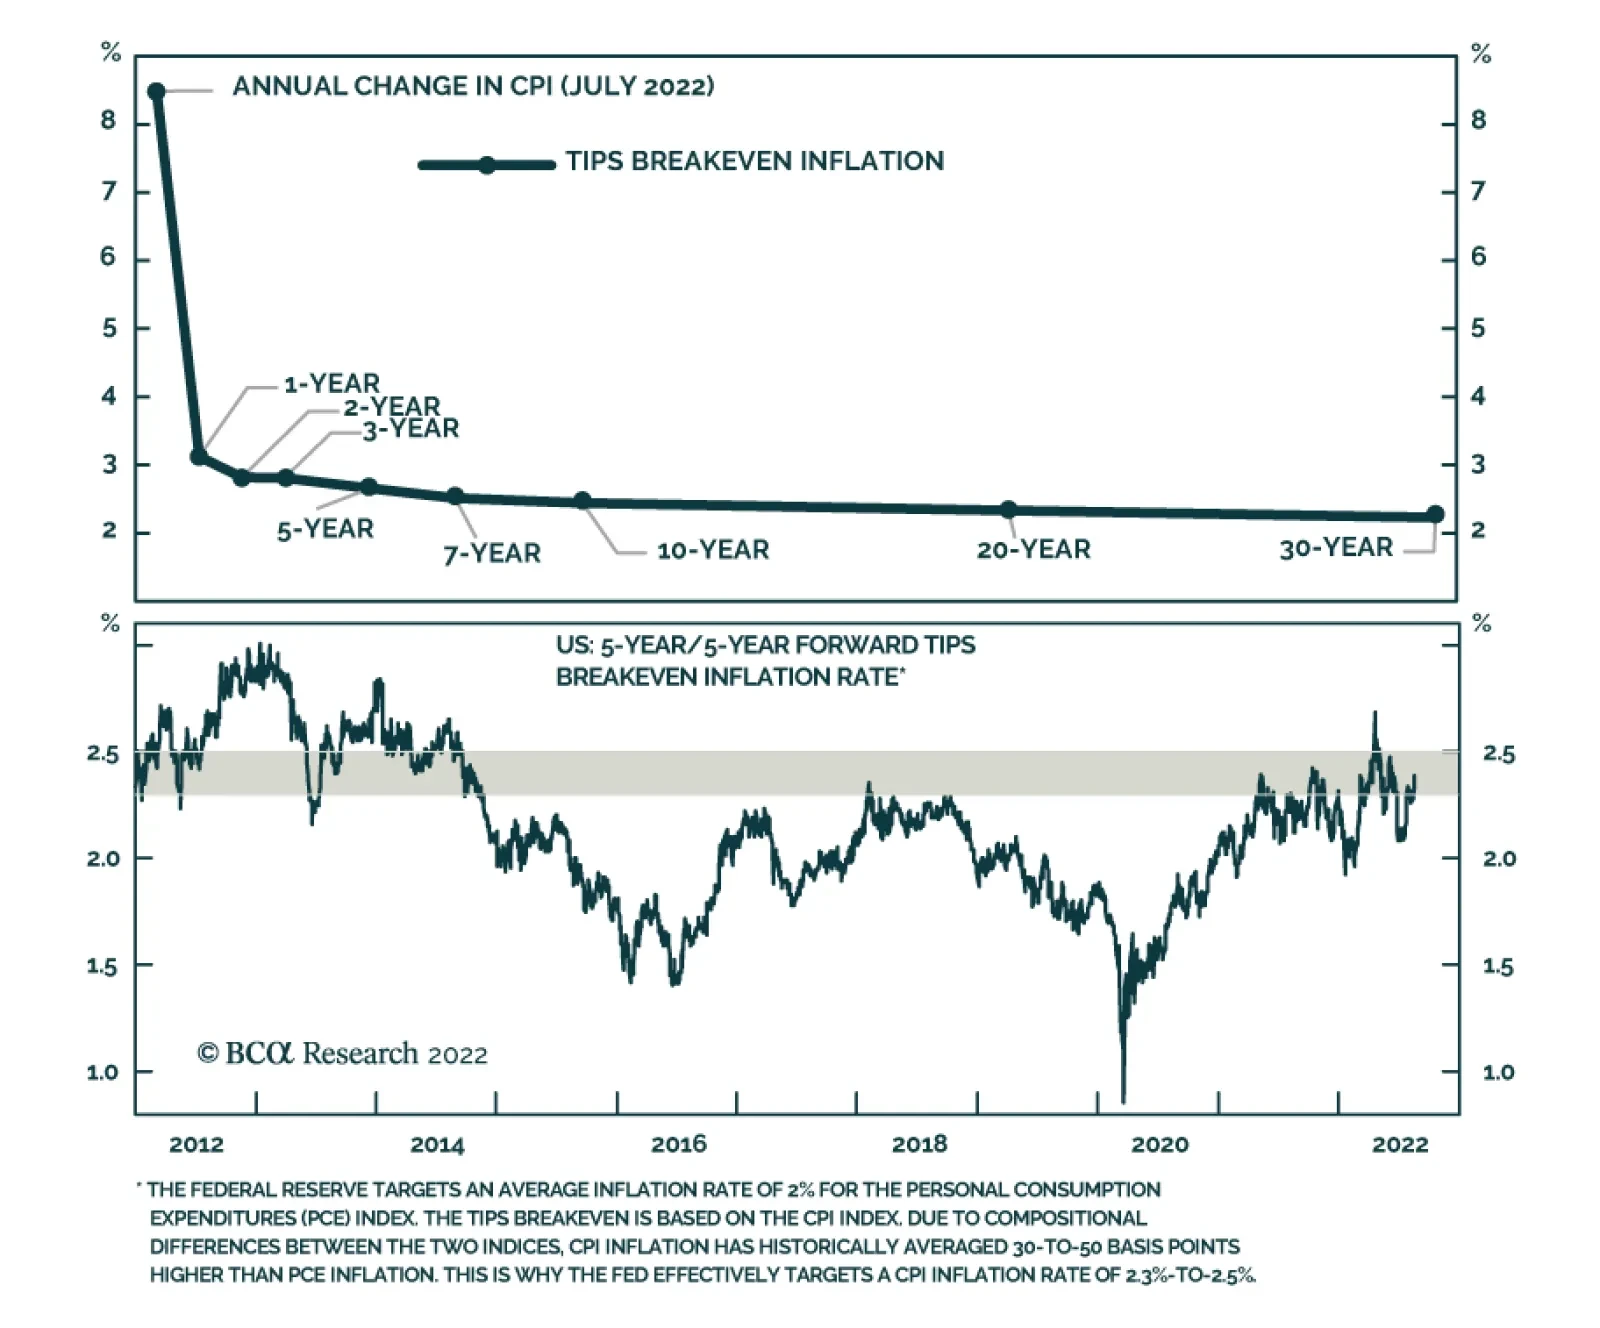
Executive Summary We continue to recommend overweighting risk assets in multi-asset portfolios over the next six months because we believe financial markets have prematurely priced in too much pessimism. Against a particularly uncertain macroeconomic backdrop, we think all investors should have reduced conviction in their views. Asking how one could be getting it wrong is especially relevant today. We identify seven prominent risks to our view, with unanchored inflation expectations and consumer retrenchment posing the biggest threats to our risk-friendly recommendations. The former would imply economic overheating that would prompt the Fed to squash the expansion; the latter would herald a period of insufficient growth. Inflation Expectations Are Still Contained
Inflation Expectations Are Still Contained
Inflation Expectations Are Still Contained
Bottom Line: We are on the alert for several ways our glass-half-full view could be disappointed but none of them has yet emerged. We continue to recommend positioning a portfolio in line with it. Feature We will be taking our summer vacation this week and will not publish next Monday, August 29th. We will resume our regular publication schedule on September 5th. Chart 1Overdone
Overdone
Overdone
We held our quarterly webcast last week, in which we reiterated three main points that will be familiar to US Investment Strategy readers. One, the demise of the American consumer has been greatly exaggerated. Two, monetary policy works with a lag. Three, stubbornly high inflation will bring about the end of the expansion and the bull markets in equities and credit, but not just yet. Those points reinforce our view that equities and credit will outperform Treasuries and cash over the rest of the year and place us at the more bullish end of the continuum inside and outside of BCA for the near term, though we are much more circumspect about the prospect for risk assets over the next twelve months and beyond. We also spent some time digging into the reasons that we are more constructive than the average bear. Those reasons largely revolved around the idea that financial markets prematurely discounted the negative effects that will follow sometime after the Fed flips monetary policy settings from easy to tight. After tightening sharply over the first half of the year (Chart 1, top panel), we think financial conditions are due for a break as Treasury yields settle into a well-defined range (Chart 1, second panel), credit spreads consolidate their retracement after sharply widening (Chart 1, third panel), the S&P 500 finds a footing and retraces more of its first half losses (Chart 1, fourth panel) and the dollar, cooling off after a torrid run (Chart 1, bottom panel), prepares to weaken over the intermediate term. We did not have time to answer all the questions from the webcast Q&A before the hour was up and we spent much of the week replying to them over email. Several of the questions asked what we are most worried about, or which indicators are most likely to signal that we are getting the outlook wrong. We ask ourselves these questions continuously and they are an ideal way to conclude a gathering like last Monday’s. Although we didn’t get to address them live, examining the biggest risks to our view as a coda in this week's bulletin is the next best thing. Risk #1: Unanchored Inflation Expectations We view a breakout in inflation expectations as the biggest risk to our view. If households, businesses and investors were to expect that inflation would inflect meaningfully higher over the long term, they would adjust their behavior in ways that could make high inflation beget still higher inflation. The ensuing self-reinforcing cycle would become much more difficult for the Fed to break and would presumably involve a stark repricing of Treasury securities and risk assets. Related Report US Investment StrategyRisks To Our View We have been warily monitoring inflation expectations over the near term (0-2 years, top panel in Charts 2 and 3), the intermediate term (3-5 years, middle panel) and the long term (6-10 years, bottom panel), as has the Fed. We have become increasingly emboldened by the stability of the intermediate- and long-term series, even in the face of the highest measured inflation in 40-plus years. Now that near-term expectations have rolled over, some of the risk that elevated current inflation will begin to bleed into long-run expectations is fading. We remain relieved that businesses, investors and consumers (Chart 4) have not yet assumed high inflation will persist but if longer-run inflation expectations threaten to become unanchored, we will abandon our constructive take on the economy and risk assets. Chart 2High Reported Inflation ...
High Reported Inflation ...
High Reported Inflation ...
Chart 3... Has Yet To Translate Into ...
... Has Yet To Translate Into ...
... Has Yet To Translate Into ...
Chart 4... Meaningfully Higher Long-Run Inflation Expectations
... Meaningfully Higher Long-Run Inflation Expectations
... Meaningfully Higher Long-Run Inflation Expectations
Risk #2: A Renewed COVID Breakout The other risks are not as significant as unmoored inflation expectations but they are meaningful nonetheless. A renewed COVID breakout that imposed the de facto equivalent of rolling blackouts in production and transportation would partially undo the supply chain improvements that have helped relieve some of the upward pressure on goods inflation while hampering global growth. That could have the doubly negative impact of squeezing S&P 500 earnings while rekindling inflation pressures, nudging the US and global economies toward stagflation. Effective vaccinations and treatments have rendered COVID little more than a nuisance in the States (Chart 5) and other developed nations, but if the pandemic surges back to life elsewhere in the world, we would have to reconsider our more constructive take. Chart 5Initially A Scourge, COVID Is Now An Annoyance
Initially A Scourge, COVID Is Now An Annoyance
Initially A Scourge, COVID Is Now An Annoyance
Risk #3: Geopolitical Pressures Our in-house geopolitical experts were among the first to sound the alarm on Ukraine early in the year. A worsening of the conflict there, or anything that imperils Europe’s access to energy supplies or further restricts global supplies of grain, will also cloud the picture for risk assets. Our geopolitical team has long viewed the Taiwan Strait as a potential major geopolitical flashpoint and a sharp increase in Sino-American tensions would make us reconsider our thesis as well. Our in-house team warns that Iran could be another source of instability and we will have to remain aware of the potential for geopolitics to throw a wrench into otherwise neutral-to-bullish macro conditions. Risk #4: US Consumers Lose Their Nerve Though we haven’t tried to rank the risks beyond a breakout in inflation expectations, a big pickup in the savings rate is the second largest risk on our list. If households reverse field and start saving their disposable income at a rate above their post-crisis/pre-pandemic average (Chart 6), it would signal that their aggregate consumption decisions were beginning to match their gloomy responses to confidence surveys. That would erode our conviction that they will deploy their excess pandemic savings to keep consumption – and the US economy – expanding near its trend rate. If consumers begin to circle the wagons in paradox-of-thrift fashion, it would present a nearly insurmountable obstacle for our thesis. Chart 6A Massive Savings Cushion To Support Consumption ...
A Massive Savings Cushion To Support Consumption ...
A Massive Savings Cushion To Support Consumption ...
Risk #5: Consumer Credit Deterioration As SIFI bank executives noted in last month’s second quarter earnings calls, consumer credit has performed spectacularly well. Credit card net charge-offs are hovering at all-time lows, mortgage foreclosure rates are microscopic, and the only signs of stress have emerged, faintly, at the lowest ends of the wealth and income distributions. The very gentle softening in consumer credit that lenders have seen so far (Chart 7) could turn into something more worrisome if inflation fails to moderate and/or the jobs market goes south. If consumer credit begins palpably deteriorating, it would signal that the excess savings buffer does not offer as much protection as we thought. Chart 7... And Consumer Credit
Risks To Our View (Again)
Risks To Our View (Again)
Risk #6: A Softening Labor Market Chart 8Still A Lot Of Help Wanted
Still A Lot Of Help Wanted
Still A Lot Of Help Wanted
An extremely robust labor market has helped solidify our conviction that a sizable moat protects the US economy from unwelcome near-term surprises. Despite evident deceleration in growth over the first half of the year, net payrolls have continued to grow at a rapid clip and ongoing demand for additional hires (Chart 8) remains strong. The labor market could soften more rapidly than it has so far or than we project it will in the near term. Risk assets’ window for outperformance will shorten the faster the labor demand moat shrinks. Risk #7: Technical Support Could Prove Fleeting We have been further encouraged by the ease with which the S&P 500 sliced through resistance around 4,175 on its second try last week and has remained above that level (Chart 9). We see 4,175 providing tactical support to the index, limiting its near-term downside. If the support were to fail a test, we will be forced to re-evaluate US equities’ near-term risk-reward profile. Chart 9The S&P 500 Appears To Have Some Near-Term Technical Support
Risks To Our View (Again)
Risks To Our View (Again)
A client alerted us last week to a longer-term technical pattern that might serve to put a bottom under equities. Since 1950, no bear market has made new lows after retracing at least 50% of its decline. We explored the pattern beginning with the November 1968-May 1970 bear market and found that tests of the 50% retracement level were few and far between. The bear market action of the last 50-plus years by no means guarantees that the S&P 500 will encounter difficulty punching back through the 50% threshold (4,231.67) it crossed on Friday August 12th, but the index has gathered some positive technical omens during its two-month rally. Investment Implications There is no shortage of potential risks right now and we reiterate our heightened vigilance. Investors must contend with the combination of a once-in-a-century global pandemic, the unprecedented fiscal and monetary responses to its outbreak, the first major cross-border war in Europe since 1945 and four-decade highs in inflation across major developed economies. Our conviction levels are lower than normal and our inherent compulsion to ask where we could be getting it wrong now verges on paranoia. Though we are continuously looking over our shoulder, we are comforted by nearly unanimous glass-half-empty sentiment. We still believe that it won’t take much for corporate earnings and the economy to surprise to the upside. The latest iteration of the Bank of America Merrill Lynch portfolio manager survey revealed that sentiment is no longer “apocalyptically bearish,” but we still expect that relative performance pressures will prod many bearishly positioned managers to cover their risk asset underweights. We remain constructive on risk assets over the next six months, though we will likely take some chips off the table if the S&P 500 rallies into the 4,500-to-4,600 range as we expect. It is a core part of our process to seek out information that may invalidate our hypotheses and we don’t even have to venture beyond the confines of BCA to gather it right now. Our differences with our colleagues are not as large as they might seem in our daily BCA Live and Unfiltered live stream, however, as they boil down to timing. We are neutral-to-bearish twelve months out, as we anticipate another equity bear market will begin around the second half of next year once it becomes apparent that the FOMC will not stand down from its 2% inflation goal. We simply think there’s money to be made from the long side in the interim. Doug Peta, CFA Chief US Investment Strategist dougp@bcaresearch.com
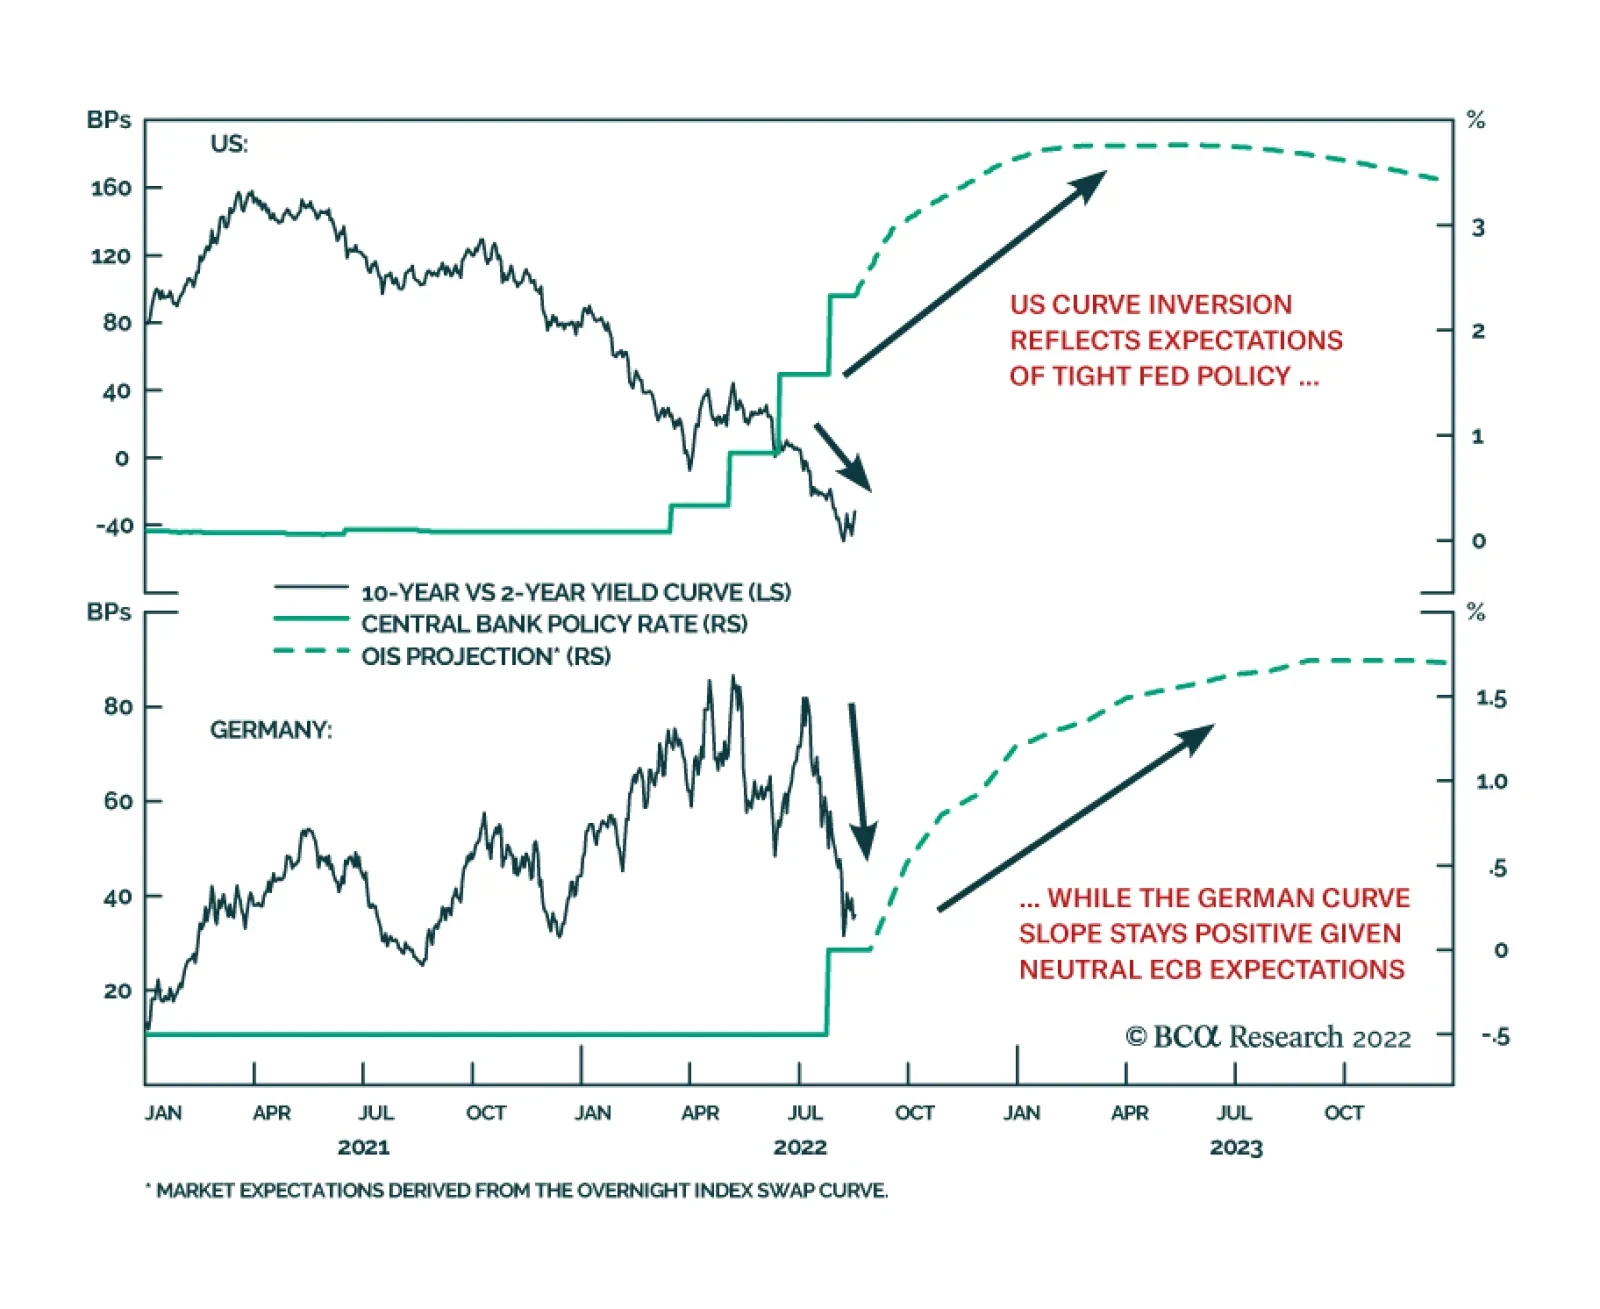
As of Thursday’s close, the 2-year/10-year US Treasury curve is inverted, with the 10-year yield trading -35bps below the 2-year yield. In Europe, there is no inversion, with the 10-year German yield trading 37bps above the 2-year yield. Why the…
BCA Research’s US Political Strategy service concludes that negative surprises in the form of social unrest, political violence, and domestic terrorism usually cause only a short-term spike in financial market volatility. A major crisis that affects election…
Executive Summary US Support For A Military Coup?
Trump Raid Heightens Political Risk
Trump Raid Heightens Political Risk
A confluence of structural and cyclical factors makes the US highly prone to social and political instability, as in 2020. Today’s stagflationary economic environment further amplifies domestic political risk. The Biden administration’s decision to pursue a criminal investigation of former President Trump will drive political polarization higher, as will the overall 2022-24 political cycle. Investors should expect negative surprises from US politics, including social unrest, political violence, and domestic terrorism of whatever stripe. Such crisis events usually cause only a short-term spike in financial market volatility. A major crisis that affects election results could have a more lasting impact. The base case for US policy in 2023-24 is gridlock, which is marginally disinflationary. It would take an extraordinary surprise to change that. On a relative basis, US assets benefit from domestic political risk because geopolitical risk rises even faster. Recommendation (Tactical) INITIATION DATE Return Long DXY (Dollar Index) Feb 23, 2022 10.8% Bottom Line: Investors should expect volatility and negative “October surprises” in the short term, at least through the midterm elections. US domestic political risk is high and will also amplify global geopolitical risk. Feature The US’s rolling political crisis is escalating again and political violence is likely to rise in the lead up to the midterm elections on November 8 and the presidential election in November 2024. The Department of Justice (DoJ) refused on August 15 to release the affidavit underpinning the Federal Bureau of Investigation’s (FBI) raid on former President Trump’s Mar-a-Lago residence in Florida. Never before has a US president suffered a raid on his home by the country’s federal law enforcement agencies – though presidents have been investigated before. It is not yet clear what charges will be brought against Trump but it is highly likely that he will be indicted for something. The Justice Department released a redacted version of the search warrant suggesting that Trump may be accused of having kept state secrets at his home in violation of the Presidential Records Act and possibly also the 1917 Espionage Act. Speculation says that some information he took back from the White House relates to nuclear weapons.1 The DoJ is pursuing a criminal investigation. The former president could very well end up on trial, or even in jail, but it is also possible that changes in political power will prevent him from going. What are the investment implications, if any? The US will see significant social and political upheaval but the main investment implication is that the US will continue to play an unpredictable and disruptive role abroad, perpetuating a flight to safety in financial markets, at least until the midterm elections are over. Drivers Of US Political Instability The US political crisis should first be seen through the lens of geopolitics: The US is a continent-sized nation that is separated from the other world powers by large oceans. It is therefore highly defensible and economically insulated, with total exports accounting for only 10.2% of GDP. However, this insularity and relative security create space for a fast growing and evolving society that is primarily focused on doing business rather than strengthening the state. The rapid creation of wealth is good but also produces large disparities in region, class, and race that periodically undermine stability. Maintaining domestic stability across the continent would be a constant challenge even if the government were not a federal republic with short political cycles driven by fickle popular opinion. Freedom is a source of political contention as well as wealth creation. Over the past 70 years the society has become less religious and more secular, while the economy has become less manufacturing-oriented and more service-oriented. The shift to a high-tech and information-driven society has empowered the highly educated at the expense of the less educated. Capital owners have benefited from rising asset values, deregulation, and globalization, while labor has witnessed stagnant real wages. Agricultural and manufacturing regions have fallen behind. Social stability is especially hard to maintain during cyclical periods of economic distress, highlighted today by the rising Misery Index (Chart 1). While inflation may subside in the short run, it will probably persist in the long run, and unemployment has nowhere to go but up. There is a demographic and generational factor that is also driving US instability today: The Baby Boom generation did not begin their adult lives with a robust policy consensus, like their parents’ generation, which shared sacrifices during the Great Depression and World War II. Instead the Boomers began with deep divisions due to the Vietnam War and social revolution of the 1960s. As they grew in wealth and power in the 1980s-90s, pro-growth tax policy, deregulation, and rapid socioeconomic changes aggravated these divisions. Inequality surged (Chart 2). The Iraq War and 2008 financial crisis made matters worse. Chart 1US: High Misery Index
US: High Misery Index
US: High Misery Index
Chart 2US: High Inequality
US: High Inequality
US: High Inequality
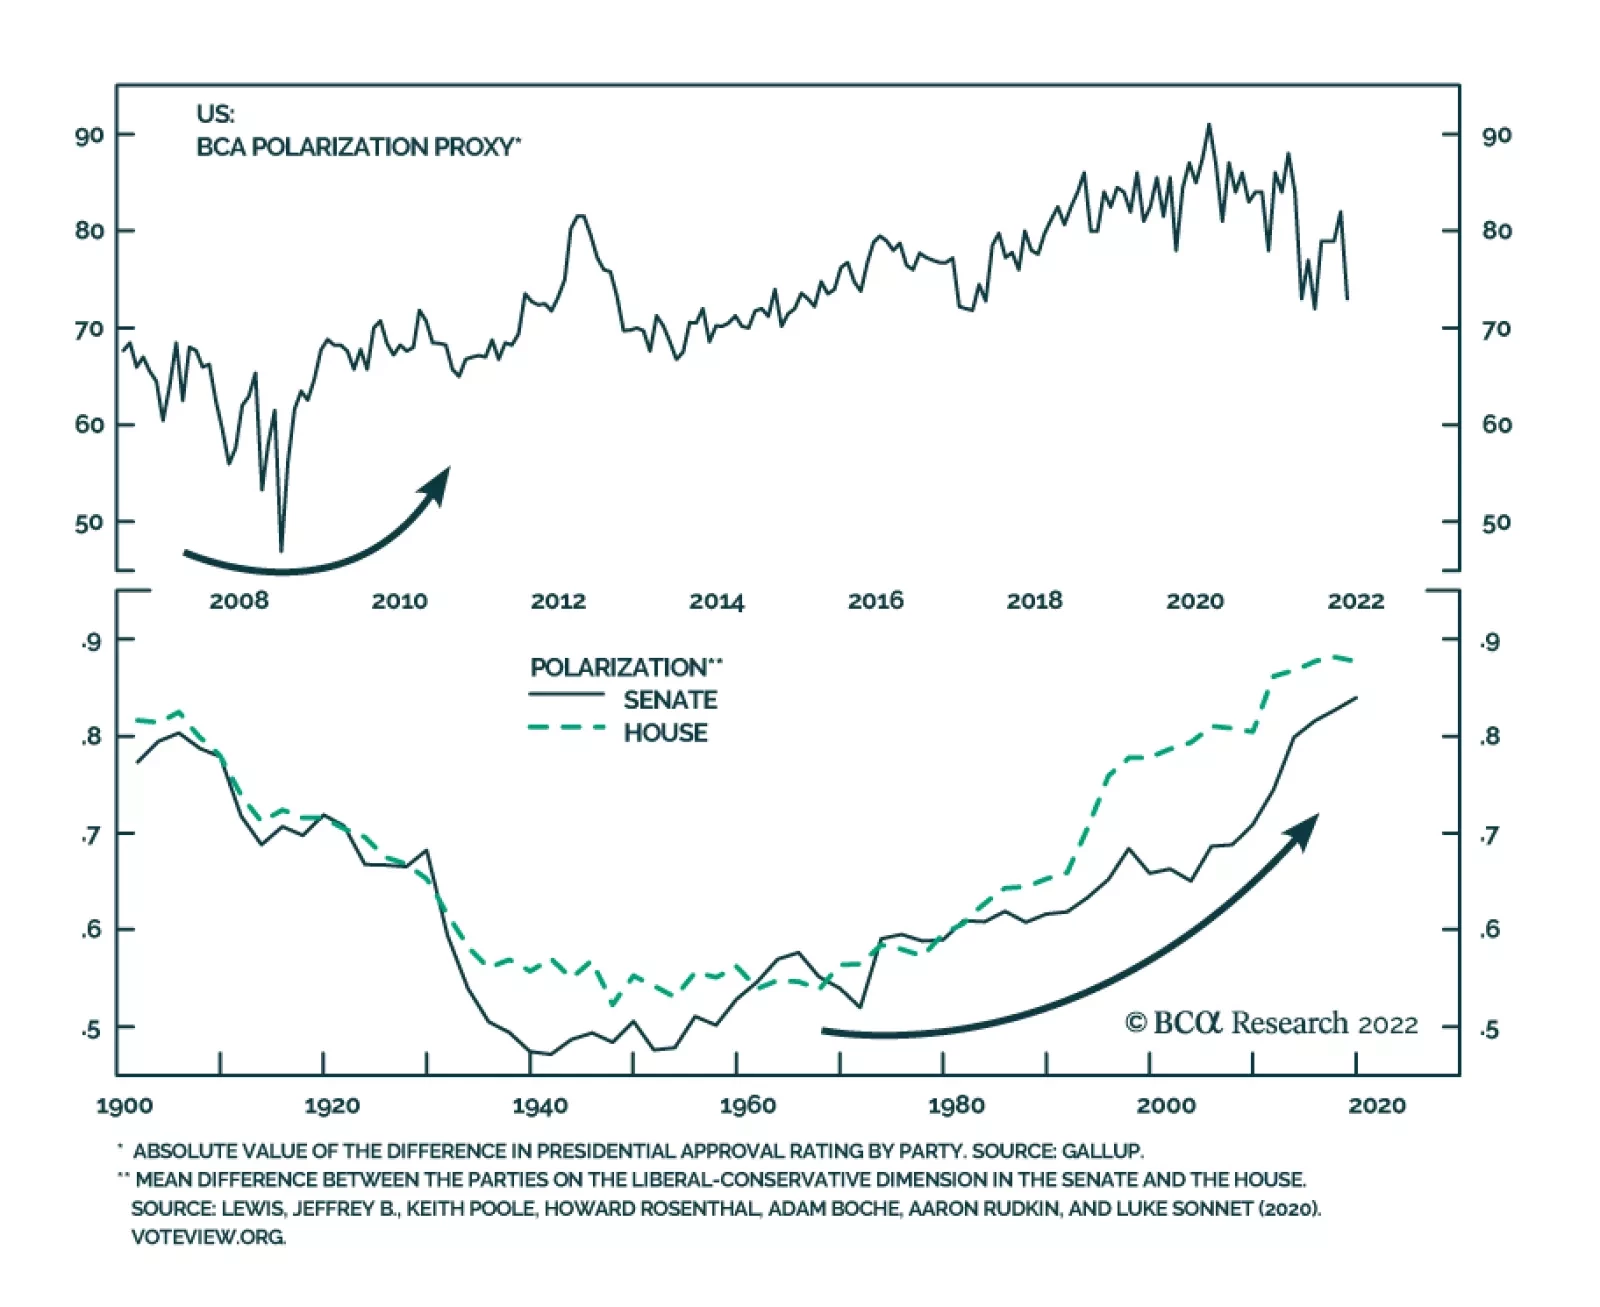
Now the elites of this generation, who lead the two major parties, are trying to secure their economic and political interests before retirement and death. Bluntly, the pro-business faction is trying to prevent the pro-government faction from clawing back its wealth. Political polarization has reached the highest level since the early twentieth century (Chart 3). While polarization has subsided from the peaks of 2020, it could still exceed those peaks in the 2022-24 political cycle. The US will remain at or near “peak polarization” until generational change and geopolitical conflicts forge a new policy consensus. Bottom Line: The US is geopolitically secure but periodically struggles to maintain domestic stability. Today it is witnessing a confluence of structural and cyclical factors that generate social unrest and historic levels of political polarization. The 2022-24 election cycle will be tumultuous. Chart 3US: Peak Polarization
US: Peak Polarization
US: Peak Polarization
Disaffection Can Lead To Violence Any kind of fanaticism can lead to violent extremism. Militants have emerged from secular movements on the right and left, from communism to fascism, as well as from religious movements.2 In recent years the US has seen a rise in violence, including crime and terrorism. Mass shootings have spiked since the 2008 financial crisis. Terrorism has revived to the highest levels since the 1980s, 96% of which is domestic terrorism (Chart 4). Recent improvements to the social safety net may or may not reduce violence. The stagflationary economic backdrop bodes ill. Opinion polls are of dubious accuracy when they ask people to admit to militant or criminal inclinations, but they still take the temperature of society. Several recent polls suggest that as many as 25% of Americans are willing to consider violence as a means of resolving political problems (Chart 5). Chart 4US: Domestic Terrorism, Political Violence
Trump Raid Heightens Political Risk
Trump Raid Heightens Political Risk
Chart 5US Support For Political Violence?
Trump Raid Heightens Political Risk
Trump Raid Heightens Political Risk
In addition, 55% of Republicans and 40% of independents claim that a military coup could be justified when there is “a lot of corruption,” a subjective standard to say the least (Chart 6). While this number has spiked over the 2020 election cycle, it also shows a substantial pre-existing willingness to entertain authoritarian solutions to political disputes. We do not take these polls at face value given the difficult subject matter. When a major violent event occurs and real people die, popular “support” for political violence will collapse across the United States. Nevertheless these data suggest a high level of disaffection and discontent, which is supported by the structural socioeconomic problems cited above. Chart 6US Support For A Military Coup?
Trump Raid Heightens Political Risk
Trump Raid Heightens Political Risk
The January 6, 2021 incident at the US Capitol was the crescendo of an explosion of social unrest that occurred across the country in 2020, triggered by the aforementioned structural factors, the Covid-19 pandemic, race riots, and political conflict over the 2020 election. The number of homicides rose to 7.4 per hundred thousand people, the highest annual number since the 1990s, higher than in 2001 when the 9/11 terrorist attacks occurred, and reminiscent of the turbulent late 1960s. This year’s midterm elections will be the first major electoral test since the chaotic events of 2020 and none of the underlying drivers of unrest have been resolved. On the contrary, recent signs are pointing to another escalation of social and political upheaval. The 2024 election will also spark unrest and violence. Bottom Line: The number of violent incidents is rising while a substantial minority of public opinion appears willing to entertain violent means of resolving political disputes. From Reality TV To Real Rebellion? The FBI’s raid on Trump’s Mar-a-Lago estate is naturally triggering a backlash from Trump supporters and Republicans. These groups were already distrustful of the federal government and particularly the FBI for spying on the Trump presidential campaign in the 2016 election.3 Republican support for the FBI and DoJ will fall sharply from its current level in opinion polling taken in 2019 (Chart 7, top panel). Trump opponents will argue that Trump is being investigated because of wrongdoing while Trump supporters will think that the Biden administration is trying to prevent him from running for re-election in 2024. Any lack of transparency by the Justice Department will heighten suspicion and acrimony. Chart 7US Views On 2021 Rebellion
Trump Raid Heightens Political Risk
Trump Raid Heightens Political Risk
A fraction of radicalized Trump supporters could be motivated by this extraordinary event to conduct attacks. Already an armed suspect, allegedly linked to a right-wing extremist group and to the January 6 rebellion at the Capitol, attempted to storm an FBI field office in Cincinnati, Ohio. The Department of Homeland Security and FBI have warned about the risk of domestic terrorism for several years and have issued a new warning since the FBI raid on Mar-a-Lago.4 There is no easy way to resolve the dispute over the 2020 election or the January 6 rebellion because these events have taken on mythic status in the eyes of the different factions. For about half of Republicans, the January 6 incident was a patriotic defense of freedom – rather than an insurrection or attempt to prevent the peaceful and democratic transfer of power (Chart 7, bottom panel). Some small portion of those who view the election as stolen could become radicalized and act out violently. Trump received 46% of the popular vote in 2016 and 47% in 2020 (Chart 8). His favorability has suffered since the January 6 events but not as much as one might think. Among Republicans, Trump’s favorability remains largely unperturbed (Chart 9). While the vast majority of these voters are law-abiding, the decision to raid Trump’s home, and any future decision to press criminal charges, will drastically increase the risk of radicalization on the fringes. Chart 8Trump’s Share Of Popular Vote
Trump Raid Heightens Political Risk
Trump Raid Heightens Political Risk
Chart 9Trump’s Popular Support Post-2020
Trump Raid Heightens Political Risk
Trump Raid Heightens Political Risk
It does not take a social scientist to recognize the potential for an increase in political violence if the federal government is perceived as using the arm of the law to prevent a popular candidate from contesting past or future elections. The risk of political violence cannot be dismissed because the US is a particularly well-armed country. There were 120 civilian-held firearms per 100 persons in the United States as of 2017. By contrast, the nearest country is France, with only 20 firearms per 100 persons (Chart 10). That does not mean that a major incident of violence will necessarily stem from the right wing. Only five years ago an extremist left-wing gunman tried to assassinate a whole group of Republican lawmakers while they were playing baseball. Earlier this year the Department Homeland Security warned about violent reactions to the Supreme Court’s overturning of the Roe v. Wade decision on abortion.5 If and when a major incident of political violence occurs, the public reaction will be a powerful rejection of violence across the political spectrum. For example, President Bill Clinton’s administration benefited from the Oklahoma City bombing in 1995 (Chart 11). Much will depend on the nature of the attack and which faction is most able to capitalize on its victimization. Chart 10Right To Bear Arms Shall Not Be Infringed
Trump Raid Heightens Political Risk
Trump Raid Heightens Political Risk
Chart 11OKC Bombing Spurred Rally Round The Flag
OKC Bombing Spurred Rally Round The Flag
OKC Bombing Spurred Rally Round The Flag
Ultimately instability will generate a popular consensus opposed to political violence and supportive of law and order, just as it did in previous periods of American upheaval. The future policy consensus will be “federalist” in orientation due to America’s geopolitics: there will be an increasing need to unify the states to achieve other strategic imperatives like prosperity and national security. We call this theme “Limited Big Government.” This re-centralization process will involve the federal government intervening to stabilize the society. It is not obvious which political party will first capture this consensus. It depends on the nature and timing of any crisis events and the cyclical rotation of parties. Bottom Line: The US is a heavily armed country that is currently prone to social and political instability. The risk of political violence and domestic terrorism of whatever stripe is already very high. In addition, a substantial portion of the country’s right-wing faction believes that the 2020 election was stolen, that the January 6 rebellion was justified, and that the federal government is now abusing its law enforcement powers to prevent a candidate from running in 2024. Domestic terrorism risk will increase. Implications For The 2024 Election Federal agencies were well aware of the risk of a domestic backlash when they decided to raid Mar-a-Lago. Investigators may or may not produce ironclad evidence of wrongdoing by Trump, but polarization will continue to be the overriding dynamic in the short run. It is unlikely that any evidence will convince the different parties to change their opinions of Trump. Assuming Republicans retake the House of Representatives this fall, they will likely impeach Biden, though they will lack the votes in the Senate to remove him from office. US domestic policy will be effectively paralyzed as the partisan conflict continues. The 2024 election will be required to settle the Trump saga and the future direction of US national policy. Trump’s legal troubles could be a blessing or a curse for the Republican Party in the 2024 cycle: If Trump is disqualified or put in jail, then he will become a political martyr for his populist base, motivating Republican voter turnout. At the same time, the Republican Party establishment will gain the advantage of nominating a more favorable candidate who will be eligible to hold the presidency for eight years. Republicans would benefit. If Trump is not disqualified, then he will be even more incentivized to run for the Republican nomination to avoid legal prosecution. In that case he will hinder Republican appeal among moderate and independent voters – leaving them vulnerable to a party split or third-party challenge. Even if he wins, he will only be eligible for the presidency for four years, limiting his party’s prospects. Republicans would suffer. The takeaway from the above is that Trump’s interests continue to be at odds with the interests of the Republican Party elite. If the Democrats aggressively prosecute Trump and try to put him behind bars, they will in fact help unify and motivate the Republican Party opposition. Two further conclusions can be drawn: First, because of the January 6 incident and the political fallout, any future attempt by protesters or rioters to storm a major federal power center will likely be met with overwhelming force rather than accommodation. If that occurs, and state violence is seen as partisan, then the party that uses force will suffer in public opinion. As with domestic terrorism, a major crisis is likely to occur. But it will ultimately be conducive to a new national policy consensus. Second, US domestic instability will incentivize foreign powers to take advantage of US distraction to pursue their national interests aggressively in their own region. At the same time, the US government will also pursue a reactive foreign policy to attempt to divide the opposition and suppress domestic dissent. Therefore US domestic political instability increases global geopolitical instability. Market Response Will Be Volatility What are the investment ramifications of the above? US corporate earnings are heavily insulated from political crises that do not affect either US policy or the structure of the government and economy. Volatility sometimes pops briefly during domestic terrorist events but not in a way that affects the investment outlook (Chart 12). Investors should bear this in mind since another crisis event is coming. True, if the Mar-a-Lago raid affects the midterm election – and hence the composition of the US government in 2023-24 – then financial markets will respond to some extent. However, investors can safely ignore this risk because the stagflationary economy will be the chief factor in the midterms and already favors the opposition party. For the same reason it remains highly likely that Republicans will retake the House of Representatives, producing legislative gridlock in 2023. The result is disinflationary in the short run, though inflation will be a persistent problem over the long run. If Democrats somehow retain control of both houses of Congress, i.e. the “Blue sweep risk,” then investors would see a substantial change in the policy outlook, as Democrats would have a second chance to raise taxes and social spending. But the odds of a blue sweep are low. Our House election model implies that Democrats will lose 22 seats when they only need to lose a net of five seats to lose control. Our Senate model gives 47.5% chance of Democrats retaining control, too close to call at this point (Appendix). The odds of another blue sweep are only 20% according to online betting market PredictIt. Chart 12Market Historically Ignores Domestic Terrorism
Market Historically Ignores Domestic Terrorism
Market Historically Ignores Domestic Terrorism
US political instability has, if anything, supported the US dollar and US equity and bond outperformance for many years. The more unstable the US, the more unstable the world. Indeed, because of the US’s geopolitical position, the US often exports domestic instability to the rest of the world. That is the situation today as the Biden administration’s domestic-focused, reactive foreign policy exacerbates the conflicts with Russia and China. The Biden administration is willing to escalate strategic tensions with both China and Russia in the lead-up to the midterm elections – and this tendency will likely become the Biden Doctrine, lasting into 2024. Investors should remain defensively positioned, and overweight US assets, at least until the midterm election is over. Matt Gertken Senior Vice President Chief Geopolitical Strategist mattg@bcaresearch.com Footnotes 1 Read the warrant behind FBI search of Trump’s Mar-a-Lago,” PBS, August 12, 2022, pbs.org. 2 See Katarzyna Jasko et al, “A comparison of political violence by left-wing, right-wing, and Islamist extremists in the United States and the world,” PNAS [Proceedings of the National Academy of Sciences of the United States of America] 119:30 (2022), July 18, 2022, pnas.org. See also Herbert McClosky and Dennis Chong, “Similarities and Differences between Left-Wing and Right-Wing Radicals,” British Journal of Political Science 15:3 (1985), pp. 329-63, jstor.org. 3 See Jessica Lee, “Did Obama Get Caught ‘Spying’ on Trump’s 2016 Campaign?” Snopes, September 29, 2020, snopes.com. See also Wall Street Journal Editorial Board, “Trump Really Was Spied On,” February 14, 2022, wsj.com. 4 See Department of Homeland Security, “Strategic Intelligence Assessment and Data on Domestic Terrorism,” July 11, 2022, dhs.gov; Christopher Wray, “Worldwide Threats to the Homeland,” Federal Bureau of Investigation, September 17, 2020, fbi.gov. See also Ryan Lucas, “FBI, Homeland Security warn about threats to law enforcement after Trump search,” NPR, August 15, 2022, npr.org. 5 See Stef W. Kight, “DHS memo: Violent extremism ‘likely’ in wake of Roe v. Wade decision,” Axios, June 24, 2022, axios.com. Strategic Themes Open Tactical Positions (0-6 Months) Open Cyclical Recommendations (6-18 Months) Regional Geopolitical Risk Matrix
Dispatches From The Future: From Goldilocks To President DeSantis
Listen to a short summary of this report. Executive Summary Back From The Future: An Investor’s Almanac
Dispatches From The Future: From Goldilocks To President DeSantis
Dispatches From The Future: From Goldilocks To President DeSantis
Stocks will rally over the next six months as recession risks abate but then begin to swoon as it becomes clear the Fed will not cut rates in 2023. A second wave of inflation will begin in mid-2023, forcing the Fed to raise rates to 5%. The 10-year US Treasury yield will rise above 4%. While financial conditions are currently not tight enough to induce a recession, they will be by the end of next year. In the past, the US unemployment rate has gone through a 20-to-22 month bottoming phase. This suggests that a recession will start in early 2024. The US dollar will soften over the next six months but then get a second wind as the Fed is forced to turn hawkish again. Over the long haul, the dollar will weaken, reflecting today’s extremely stretched valuations. Bottom Line: Investors should remain tactically overweight global equities but look to turn defensive early next year. Somewhere in Hilbert Space I have long believed that anything that can possibly happen in financial markets (as well as in life) will happen. Sometimes, however, it is useful to focus on a “base case” or “modal” outcome of what the world will look like. In this week’s report, we do just that, describing the evolution of the global economy from the perspective of someone who has already seen the future unfold. September 2022 – Goldilocks! US headline inflation continues to decline thanks to lower food and gasoline prices (Chart 1). Supply-chain bottlenecks ease, as evidenced by falling transportation costs and faster delivery times (Chart 2). Most measures of economic activity bottom out and then begin to rebound. The surge in bond yields earlier in 2022 pushed down aggregate demand, but with yields having temporarily stabilized, demand growth returns to trend. The S&P 500 moves up to 4,400. Chart 1ALower Food And Gasoline Prices Will Drag Down Headline Inflation (I)
Lower Food And Gasoline Prices Will Drag Down Headline Inflation (I)
Lower Food And Gasoline Prices Will Drag Down Headline Inflation (I)
Chart 1BLower Food And Gasoline Prices Will Drag Down Headline Inflation (II)
Lower Food And Gasoline Prices Will Drag Down Headline Inflation (II)
Lower Food And Gasoline Prices Will Drag Down Headline Inflation (II)
October 2022 – Europe’s Prospects of Avoiding a Deep Freeze Improve: Economic shocks are most damaging when they come out of the blue. With about half a year to prepare for a cut-off of Russian gas, the EU responds with uncharacteristic haste: Coal-fired electricity production ramps up; the planned closure of Germany’s nuclear power plants is postponed; the French government boosts nuclear capacity, which had been running at less than 50% earlier in 2022; and, for its part, the Dutch government agrees to raise output from the massive Groningen natural gas field after the EU commits to establishing a fund to compensate the surrounding community for any damage from increased seismic activity. EUR/USD rallies to 1.06. November 2022 – Divided Congress and Trump 2.0: In line with pre-election polling, the Democrats retain the Senate but lose the House (Chart 3). Markets largely ignore the outcome. To no one’s surprise, Donald Trump announces his candidacy for the 2024 election. Over the following months, however, the former president has trouble rekindling the magic of his 2016 bid. His attacks on his main rival, Florida governor Ron DeSantis, fall flat. At one rally in early 2023, Trump’s claim that “Ron is no better than Jeb” is greeted with boos. Chart 2Supply-Chain Pressures Are Easing
Supply-Chain Pressures Are Easing
Supply-Chain Pressures Are Easing
Chart 3Democrats Will Lose The House But Retain The Senate
Dispatches From The Future: From Goldilocks To President DeSantis
Dispatches From The Future: From Goldilocks To President DeSantis
December 2022 – China’s “At Least One Child Policy”: The 20th Party Congress takes place against the backdrop of strict Covid restrictions and a flailing housing market. In addition to reaffirming his Common Prosperity Initiative, President Xi stresses the need for actions that promote “family formation.” The number of births declined by nearly 30% between 2019 and 2021 and all indications suggest that the birth rate fell further in 2022 (Chart 4). Importantly for investors, Xi says that housing policy should focus not on boosting demand but increasing supply, even if this comes at the expense of lower property prices down the road. Base metal prices rally on the news. Chart 4China's Baby Bust
China's Baby Bust
China's Baby Bust
January 2023 – Putin Declares Victory: Faced with continued resistance by Ukrainian forces – which now have wider access to advanced western military technology – Putin declares that Russia’s objectives in Ukraine have been met. Following the playbook in Crimea and the Donbass, he orders referenda to be held in Zaporizhia, Kherson, and parts of Kharkiv, asking the local populations if they wish to join Russia. The legitimacy of the referenda is immediately rejected by the Ukrainian government and the EU. Nevertheless, the Russian military advance halts. While the West pledges to maintain sanctions against Russia, the geopolitical risk premium in oil prices decreases. February 2023 – Credit Spreads Narrow Further: At the worst point for credit in early July 2022, US high-yield spreads were pricing in a default rate of 8.1% over the following 12 months (Chart 5). By late August, the expected default rate has fallen to 5.2%, and by January 2023, it has dropped to 4.5%. Perceived default risks decline even more in Europe, where the economy is on the cusp of a V-shaped recovery following the prior year’s energy crunch. Chart 5The Spread-Implied Default Rate Has Room To Fall If Recession Fears Abate
The Spread-Implied Default Rate Has Room To Fall If Recession Fears Abate
The Spread-Implied Default Rate Has Room To Fall If Recession Fears Abate
March 2023 – Wages: The New Core CPI? US inflation continues to drop, but a heated debate erupts over whether this merely reflects the unwinding of various pandemic-related dislocations or whether it marks true progress in cooling down the economy. Those who argue that higher interest rates are cooling demand point to the decline in job openings. Skeptics retort that the drop in job openings has been matched by rising employment (Chart 6). To the extent that firms have been converting openings into new jobs, the skeptics conclude that labor demand has not declined. In a series of comments, Jay Powell stresses the need to focus on wage growth as a key barometer of underlying inflationary pressures. Given that wage growth remains elevated, market participants regard this as a hawkish signal (Chart 7). The 10-year Treasury yield rises to 3.2%. The DXY index, having swooned from over 108 in July 2022 to just under 100 in February 2023, moves back to 102. After hitting a 52-week high of 4,689 the prior month, the S&P 500 drops back below 4,500. Chart 6Drop In Job Openings Is Matched By Rise In Employment
Drop In Job Openings Is Matched By Rise In Employment
Drop In Job Openings Is Matched By Rise In Employment
Chart 7Wage Growth Remains Strong
Wage Growth Remains Strong
Wage Growth Remains Strong
April 2023 – Covid Erupts Across China: After successfully holding back Covid for over three years, the dam breaks. When lockdowns fail to suppress the outbreak, the government shifts to a mitigation strategy, requiring all elderly and unvaccinated people to isolate at home. It helps that China’s new mRNA vaccines, launched in late 2022, prove to be successful. By early 2023, China also has sufficient supplies of Pfizer’s Paxlovid anti-viral drug. Nevertheless, the outbreak in China temporarily leads to renewed supply-chain bottlenecks. May 2023 – Biden Confirms He Will Stand for Re-Election: Saying he is “fit as a fiddle,” President Biden confirms that he will seek a second term in office. Little does he know that the US will be in a recession during most of his re-election campaign. Chart 8Consumer Confidence And Real Wages Tend To Move Together
Consumer Confidence And Real Wages Tend To Move Together
Consumer Confidence And Real Wages Tend To Move Together
June 2023 – Inflation: The Second Wave Begins: The decline in inflation between mid-2022 and mid-2023 sows the seeds of its own demise. As prices at the pump and in the grocery store decline, real wage growth turns positive. Consumer confidence recovers (Chart 8). Household spending, which never weakened that much to begin with, surges. The economy starts to overheat again, leading to higher inflation. After having paused raising rates at 3.5% in early 2023, the Fed indicates that further hikes may be necessary. The DXY index strengthens to 104. The S&P 500 dips to 4,300. July 2023 – Tech Stock Malaise: Higher bond yields weigh on tech stocks. Making matters worse, investors start to worry that many of the most popular US tech names have gone “ex-growth.” The evolution of tech companies often follows three stages. In the first stage, when the founders are in charge, the company grows fast thanks to the introduction of new, highly innovative products or services. In the second stage, as the tech company matures, the founders often cede control to professional managers. Company profits continue to grow quickly, but less because of innovation and more because the professional managers are able to squeeze money from the firm’s customers. In the third stage, with all the low-lying fruits already picked, the company succumbs to bureaucratic inertia. As 2023 wears on, it becomes apparent that many US tech titans are entering this third stage. August 2023 – Long-term Inflation Expectations Move Up: Unlike in 2021-22, when long-term inflation expectations remained well anchored in the face of rising realized inflation, the second inflation wave in 2023 is accompanied by a clear rise in long-term inflation expectations. Consumer expectations of inflation 5-to-10 years out in the University of Michigan survey jump to 3.5%. Whereas back in August 2022, the OIS curve was discounting 100 basis points of Fed easing starting in early 2023, it now discounts rate hikes over the remainder of 2023 (Chart 9). The 10-year yield rises to 3.8%. The 10-year TIPS yield spikes to 1.2%, as investors price in a higher real terminal rate. The S&P 500 drops to 4,200. The financial press is awash with comparisons to the early 1980s (Chart 10). Chart 9The Markets Expect The Fed To Cut Rates By Over 100 Basis Points Starting In 2023
The Markets Expect The Fed To Cut Rates By Over 100 Basis Points Starting In 2023
The Markets Expect The Fed To Cut Rates By Over 100 Basis Points Starting In 2023
Chart 10The Early-1980s Playbook
The Early-1980s Playbook
The Early-1980s Playbook
October 2023 – Hawks in Charge: After a second round of tightening, featuring three successive 50 basis-point hikes, the Fed funds rate reaches a cycle peak of 5%. The 10-year Treasury yield gets up to as high as 4.28%. The 10-year TIPS yield hits 1.62%. The DXY index rises to 106. The S&P 500 falls to 4,050. November 2023 – Housing Stumbles: With mortgage yields back above 6%, the US housing market weakens anew. The fallout from rising global bond yields is far worse in some smaller developed economies such as Canada, Australia, and New Zealand, where home price valuations are more stretched (Chart 11). Chart 11Rising Rates Will Weigh On Developed Economies With Pricey Housing Markets
Rising Rates Will Weigh On Developed Economies With Pricey Housing Markets
Rising Rates Will Weigh On Developed Economies With Pricey Housing Markets
January 2024 – Unemployment Starts to Rise: After moving sideways since March 2022, the US unemployment rate suddenly jumps 0.2 percentage points to 3.6%, with payrolls contracting for the first time since the start of the pandemic. The 22-month stretch of a flat unemployment rate is broadly in line with the historic average (Table 1). Table 1In Past Cycles, The Unemployment Rate Has Moved Sideways For Nearly Two Years Before A Recession Began
Dispatches From The Future: From Goldilocks To President DeSantis
Dispatches From The Future: From Goldilocks To President DeSantis
February 2024 – The US Recession Begins: Although there was considerable debate about whether the US was entering a recession at the time, in early 2025, the NBER would end up declaring that February 2024 marked the start of the recession. The 10-year yield falls back below 4% while the S&P 500 drops to 3,700. Lower bond yields are no longer protecting stocks. March 2024 – The Fed Remains in Neutral: Jay Powell says further rate hikes are unwarranted in light of the weakening economy, but with core inflation still running at 3.5%, the Fed is in no position to ease. April 2024 – The Global Recession Intensifies: The US unemployment rate rises to 4.7%. The economic downdraft is especially sharp in America’s neighbor to the north, where the Canadian housing market is in shambles. Back in June 2022, the Canadian 10-year yield was 21 basis points above the US yield. By April 2024, it is 45 basis points below. Europe and Japan also fall into recession. Commodity prices continue to drop, with Brent oil hitting $60/bbl. May 2024 – The Fed Cuts Rates: Reversing its position from just two months earlier, the Federal Reserve cuts rates for the first time since March 2020, lowering the Fed funds rate from 5% to 4.5%. The Fed funds rate will ultimately bottom at 2.5%, below the range of 3.5%-to-4% that most economists will eventually recognize as neutral. August 2024 – Republican National Convention: Unwilling to spend much of his own money on the campaign, and with most donations flowing to DeSantis, Trump’s bid to reclaim the White House fizzles. While the former president never formally bows out of the race, the last few months of his primary campaign end up being a nostalgia tour of his past accomplishments, interspersed with complaints about all the ways that he has been wronged. In the end, though, Trump makes a lasting imprint on the Republican party. During his acceptance speech, in typical Trumpian style, Ron DeSantis attacks Joe Biden for “eating ice cream while the economy burns” and declares, to thunderous applause, that “Americans are sick and tired of having woke nonsense hurled in their faces and then being dared to deny it at the risk of losing their jobs.” Chart 12The Dollar Is Very Overvalued
The Dollar Is Very Overvalued
The Dollar Is Very Overvalued
October 2024 – The Stock Market Hits Bottom: While the unemployment rate continues to rise for another 12 months, ultimately reaching 6.4%, the S&P troughs at 3,200. The 10-year Treasury yield settles at 3.1% before starting to drift higher. The US dollar, which began to weaken anew after the Fed starts cutting rates, enters a prolonged bear market. As in past cycles, the dollar is unable to defy the gravitational force from extremely stretched valuations (Chart 12). November 2024 – President DeSantis: Against the backdrop of rising unemployment, uncomfortably high inflation, and a sinking stock market, Ron DeSantis cruises to victory in the 2024 presidential election. Unlike Trump, DeSantis deemphasizes corporate tax cuts and deregulation during his presidency, focusing instead on cultural issues. With the Democrats still committed to progressive causes, big US corporations discover that for the first time in modern history, neither of the two major political parties are willing to champion their interests. Peter Berezin Chief Global Strategist peterb@bcaresearch.com Follow me on LinkedIn & Twitter Global Investment Strategy View Matrix
Dispatches From The Future: From Goldilocks To President DeSantis
Dispatches From The Future: From Goldilocks To President DeSantis
Special Trade Recommendations Current MacroQuant Model Scores
Dispatches From The Future: From Goldilocks To President DeSantis
Dispatches From The Future: From Goldilocks To President DeSantis
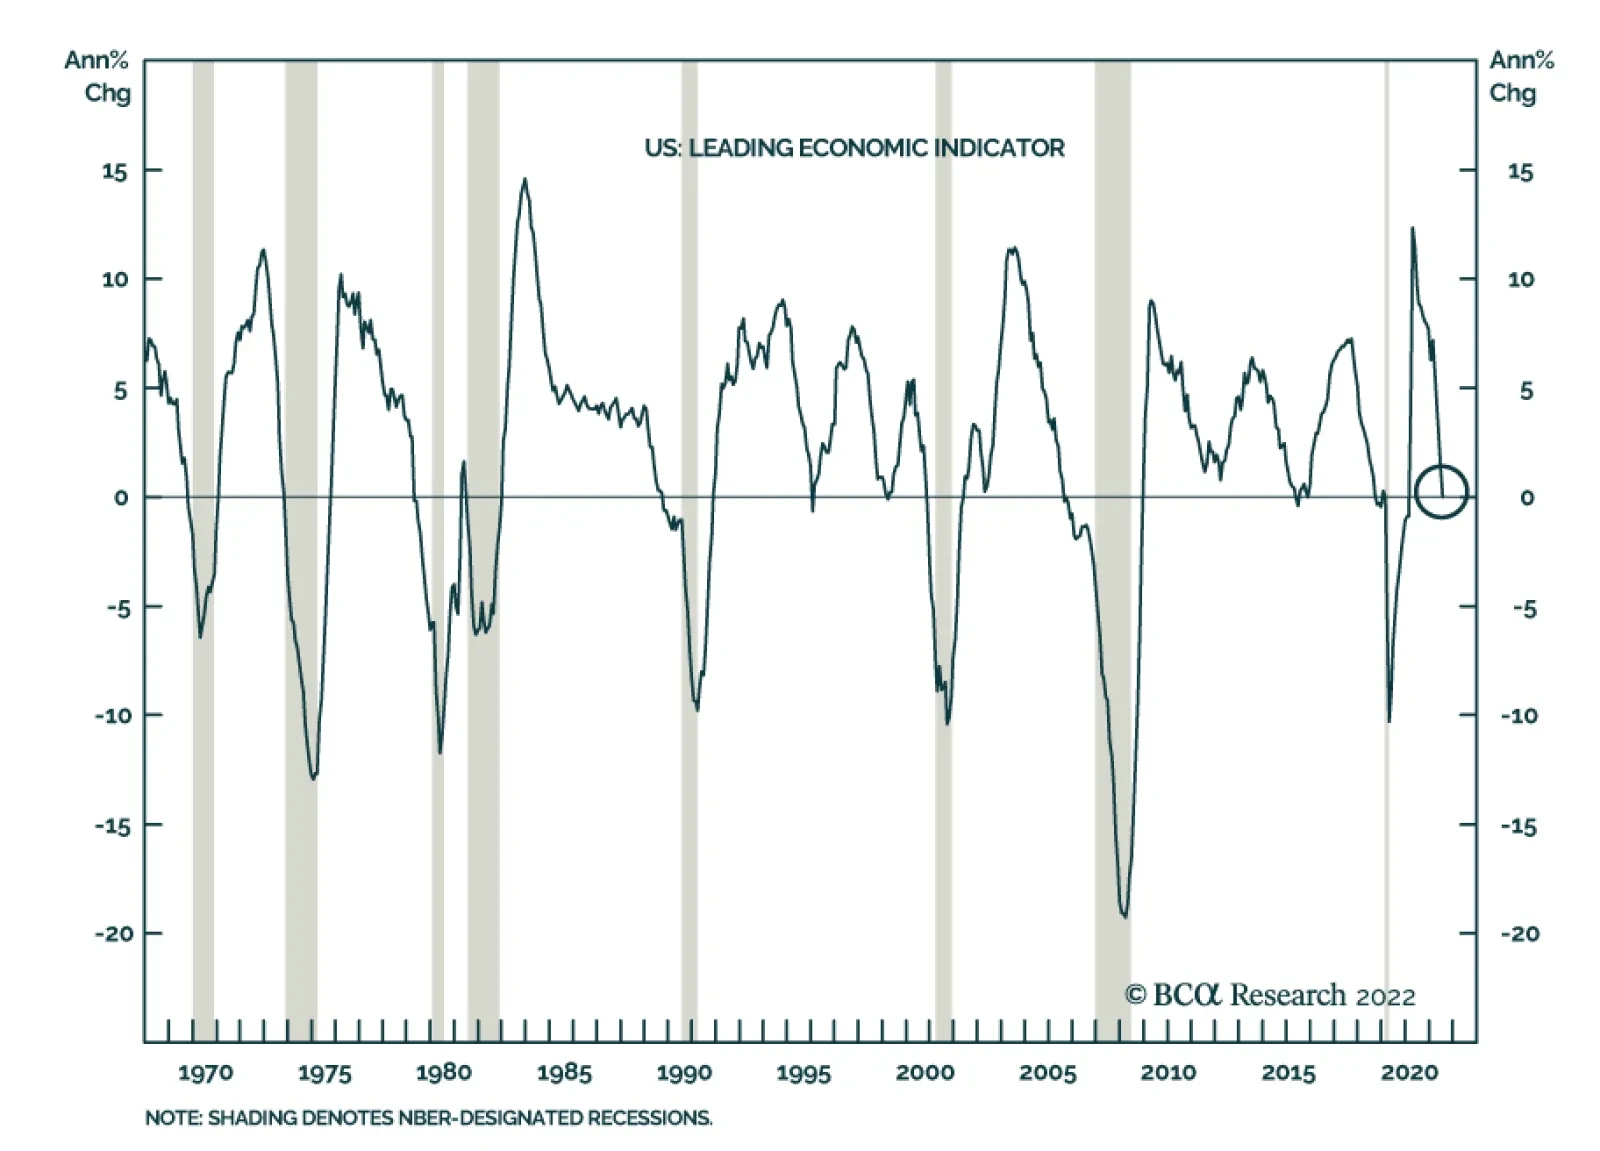
Consistent with a slowing economy, the Conference Board’s US Leading Economic Index (LEI) has declined for a fifth consecutive month and its year-on-year change now stands at 0. A contraction in this measure tends to precede recessions. Meanwhile, some…
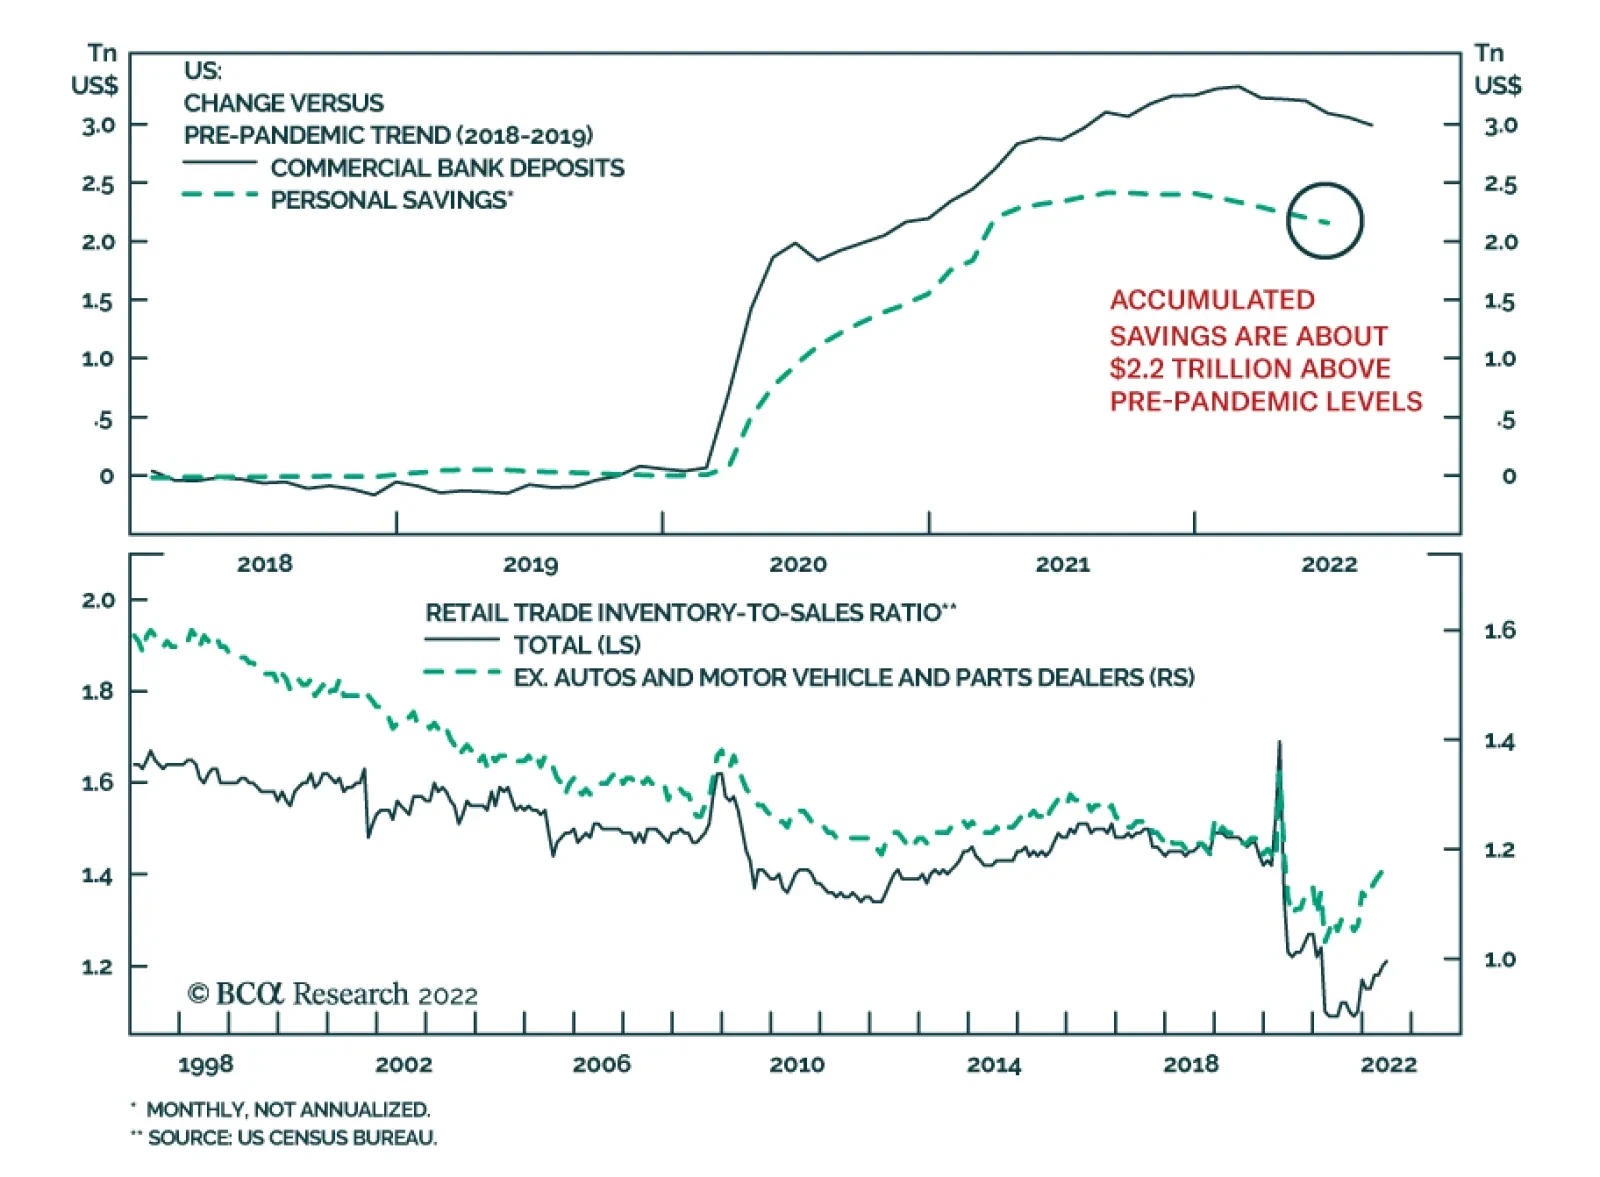
According to BCA Research’s Global Investment Strategy service, the presence of significant pent-up demand is one of three factors that will protect the US economy over the next 12 months. US households have accumulated $2.2 trillion (9% of GDP) of excess…
Executive Summary US Support For A Military Coup?
Trump Raid Heightens Political Risk
Trump Raid Heightens Political Risk
A confluence of structural and cyclical factors makes the US highly prone to social and political instability, as in 2020. Today’s stagflationary economic environment further amplifies domestic political risk. The Biden administration’s decision to pursue a criminal investigation of former President Trump will drive political polarization higher, as will the overall 2022-24 political cycle. Investors should expect negative surprises from US politics, including social unrest, political violence, and domestic terrorism of whatever stripe. Such crisis events usually cause only a short-term spike in financial market volatility. A major crisis that affects election results could have a more lasting impact. The base case for US policy in 2023-24 is gridlock, which is marginally disinflationary. It would take an extraordinary surprise to change that. On a relative basis, US assets benefit from domestic political risk because geopolitical risk rises even faster. Recommendation (Tactical) INITIATION DATE Return Long DXY (Dollar Index) Feb 23, 2022 10.8% Bottom Line: Investors should expect volatility and negative “October surprises” in the short term, at least through the midterm elections. US domestic political risk is high and will also amplify global geopolitical risk. Feature The US’s rolling political crisis is escalating again and political violence is likely to rise in the lead up to the midterm elections on November 8 and the presidential election in November 2024. The Department of Justice (DoJ) refused on August 15 to release the affidavit underpinning the Federal Bureau of Investigation’s (FBI) raid on former President Trump’s Mar-a-Lago residence in Florida. Never before has a US president suffered a raid on his home by the country’s federal law enforcement agencies – though presidents have been investigated before. It is not yet clear what charges will be brought against Trump but it is highly likely that he will be indicted for something. The Justice Department released a redacted version of the search warrant suggesting that Trump may be accused of having kept state secrets at his home in violation of the Presidential Records Act and possibly also the 1917 Espionage Act. Speculation says that some information he took back from the White House relates to nuclear weapons.1 The DoJ is pursuing a criminal investigation. The former president could very well end up on trial, or even in jail, but it is also possible that changes in political power will prevent him from going. What are the investment implications, if any? The US will see significant social and political upheaval but the main investment implication is that the US will continue to play an unpredictable and disruptive role abroad, perpetuating a flight to safety in financial markets, at least until the midterm elections are over. Drivers Of US Political Instability The US political crisis should first be seen through the lens of geopolitics: The US is a continent-sized nation that is separated from the other world powers by large oceans. It is therefore highly defensible and economically insulated, with total exports accounting for only 10.2% of GDP. However, this insularity and relative security create space for a fast growing and evolving society that is primarily focused on doing business rather than strengthening the state. The rapid creation of wealth is good but also produces large disparities in region, class, and race that periodically undermine stability. Maintaining domestic stability across the continent would be a constant challenge even if the government were not a federal republic with short political cycles driven by fickle popular opinion. Freedom is a source of political contention as well as wealth creation. Over the past 70 years the society has become less religious and more secular, while the economy has become less manufacturing-oriented and more service-oriented. The shift to a high-tech and information-driven society has empowered the highly educated at the expense of the less educated. Capital owners have benefited from rising asset values, deregulation, and globalization, while labor has witnessed stagnant real wages. Agricultural and manufacturing regions have fallen behind. Social stability is especially hard to maintain during cyclical periods of economic distress, highlighted today by the rising Misery Index (Chart 1). While inflation may subside in the short run, it will probably persist in the long run, and unemployment has nowhere to go but up. There is a demographic and generational factor that is also driving US instability today: The Baby Boom generation did not begin their adult lives with a robust policy consensus, like their parents’ generation, which shared sacrifices during the Great Depression and World War II. Instead the Boomers began with deep divisions due to the Vietnam War and social revolution of the 1960s. As they grew in wealth and power in the 1980s-90s, pro-growth tax policy, deregulation, and rapid socioeconomic changes aggravated these divisions. Inequality surged (Chart 2). The Iraq War and 2008 financial crisis made matters worse. Chart 1US: High Misery Index
US: High Misery Index
US: High Misery Index
Chart 2US: High Inequality
US: High Inequality
US: High Inequality
Now the elites of this generation, who lead the two major parties, are trying to secure their economic and political interests before retirement and death. Bluntly, the pro-business faction is trying to prevent the pro-government faction from clawing back its wealth. Political polarization has reached the highest level since the early twentieth century (Chart 3). While polarization has subsided from the peaks of 2020, it could still exceed those peaks in the 2022-24 political cycle. The US will remain at or near “peak polarization” until generational change and geopolitical conflicts forge a new policy consensus. Bottom Line: The US is geopolitically secure but periodically struggles to maintain domestic stability. Today it is witnessing a confluence of structural and cyclical factors that generate social unrest and historic levels of political polarization. The 2022-24 election cycle will be tumultuous. Chart 3US: Peak Polarization
US: Peak Polarization
US: Peak Polarization
Disaffection Can Lead To Violence Any kind of fanaticism can lead to violent extremism. Militants have emerged from secular movements on the right and left, from communism to fascism, as well as from religious movements.2 In recent years the US has seen a rise in violence, including crime and terrorism. Mass shootings have spiked since the 2008 financial crisis. Terrorism has revived to the highest levels since the 1980s, 96% of which is domestic terrorism (Chart 4). Recent improvements to the social safety net may or may not reduce violence. The stagflationary economic backdrop bodes ill. Opinion polls are of dubious accuracy when they ask people to admit to militant or criminal inclinations, but they still take the temperature of society. Several recent polls suggest that as many as 25% of Americans are willing to consider violence as a means of resolving political problems (Chart 5). Chart 4US: Domestic Terrorism, Political Violence
Trump Raid Heightens Political Risk
Trump Raid Heightens Political Risk
Chart 5US Support For Political Violence?
Trump Raid Heightens Political Risk
Trump Raid Heightens Political Risk
In addition, 55% of Republicans and 40% of independents claim that a military coup could be justified when there is “a lot of corruption,” a subjective standard to say the least (Chart 6). While this number has spiked over the 2020 election cycle, it also shows a substantial pre-existing willingness to entertain authoritarian solutions to political disputes. We do not take these polls at face value given the difficult subject matter. When a major violent event occurs and real people die, popular “support” for political violence will collapse across the United States. Nevertheless these data suggest a high level of disaffection and discontent, which is supported by the structural socioeconomic problems cited above. Chart 6US Support For A Military Coup?
Trump Raid Heightens Political Risk
Trump Raid Heightens Political Risk
The January 6, 2021 incident at the US Capitol was the crescendo of an explosion of social unrest that occurred across the country in 2020, triggered by the aforementioned structural factors, the Covid-19 pandemic, race riots, and political conflict over the 2020 election. The number of homicides rose to 7.4 per hundred thousand people, the highest annual number since the 1990s, higher than in 2001 when the 9/11 terrorist attacks occurred, and reminiscent of the turbulent late 1960s. This year’s midterm elections will be the first major electoral test since the chaotic events of 2020 and none of the underlying drivers of unrest have been resolved. On the contrary, recent signs are pointing to another escalation of social and political upheaval. The 2024 election will also spark unrest and violence. Bottom Line: The number of violent incidents is rising while a substantial minority of public opinion appears willing to entertain violent means of resolving political disputes. From Reality TV To Real Rebellion? The FBI’s raid on Trump’s Mar-a-Lago estate is naturally triggering a backlash from Trump supporters and Republicans. These groups were already distrustful of the federal government and particularly the FBI for spying on the Trump presidential campaign in the 2016 election.3 Republican support for the FBI and DoJ will fall sharply from its current level in opinion polling taken in 2019 (Chart 7, top panel). Trump opponents will argue that Trump is being investigated because of wrongdoing while Trump supporters will think that the Biden administration is trying to prevent him from running for re-election in 2024. Any lack of transparency by the Justice Department will heighten suspicion and acrimony. Chart 7US Views On 2021 Rebellion
Trump Raid Heightens Political Risk
Trump Raid Heightens Political Risk
A fraction of radicalized Trump supporters could be motivated by this extraordinary event to conduct attacks. Already an armed suspect, allegedly linked to a right-wing extremist group and to the January 6 rebellion at the Capitol, attempted to storm an FBI field office in Cincinnati, Ohio. The Department of Homeland Security and FBI have warned about the risk of domestic terrorism for several years and have issued a new warning since the FBI raid on Mar-a-Lago.4 There is no easy way to resolve the dispute over the 2020 election or the January 6 rebellion because these events have taken on mythic status in the eyes of the different factions. For about half of Republicans, the January 6 incident was a patriotic defense of freedom – rather than an insurrection or attempt to prevent the peaceful and democratic transfer of power (Chart 7, bottom panel). Some small portion of those who view the election as stolen could become radicalized and act out violently. Trump received 46% of the popular vote in 2016 and 47% in 2020 (Chart 8). His favorability has suffered since the January 6 events but not as much as one might think. Among Republicans, Trump’s favorability remains largely unperturbed (Chart 9). While the vast majority of these voters are law-abiding, the decision to raid Trump’s home, and any future decision to press criminal charges, will drastically increase the risk of radicalization on the fringes. Chart 8Trump’s Share Of Popular Vote
Trump Raid Heightens Political Risk
Trump Raid Heightens Political Risk
Chart 9Trump’s Popular Support Post-2020
Trump Raid Heightens Political Risk
Trump Raid Heightens Political Risk
It does not take a social scientist to recognize the potential for an increase in political violence if the federal government is perceived as using the arm of the law to prevent a popular candidate from contesting past or future elections. The risk of political violence cannot be dismissed because the US is a particularly well-armed country. There were 120 civilian-held firearms per 100 persons in the United States as of 2017. By contrast, the nearest country is France, with only 20 firearms per 100 persons (Chart 10). That does not mean that a major incident of violence will necessarily stem from the right wing. Only five years ago an extremist left-wing gunman tried to assassinate a whole group of Republican lawmakers while they were playing baseball. Earlier this year the Department Homeland Security warned about violent reactions to the Supreme Court’s overturning of the Roe v. Wade decision on abortion.5 If and when a major incident of political violence occurs, the public reaction will be a powerful rejection of violence across the political spectrum. For example, President Bill Clinton’s administration benefited from the Oklahoma City bombing in 1995 (Chart 11). Much will depend on the nature of the attack and which faction is most able to capitalize on its victimization. Chart 10Right To Bear Arms Shall Not Be Infringed
Trump Raid Heightens Political Risk
Trump Raid Heightens Political Risk
Chart 11OKC Bombing Spurred Rally Round The Flag
OKC Bombing Spurred Rally Round The Flag
OKC Bombing Spurred Rally Round The Flag
Ultimately instability will generate a popular consensus opposed to political violence and supportive of law and order, just as it did in previous periods of American upheaval. The future policy consensus will be “federalist” in orientation due to America’s geopolitics: there will be an increasing need to unify the states to achieve other strategic imperatives like prosperity and national security. We call this theme “Limited Big Government.” This re-centralization process will involve the federal government intervening to stabilize the society. It is not obvious which political party will first capture this consensus. It depends on the nature and timing of any crisis events and the cyclical rotation of parties. Bottom Line: The US is a heavily armed country that is currently prone to social and political instability. The risk of political violence and domestic terrorism of whatever stripe is already very high. In addition, a substantial portion of the country’s right-wing faction believes that the 2020 election was stolen, that the January 6 rebellion was justified, and that the federal government is now abusing its law enforcement powers to prevent a candidate from running in 2024. Domestic terrorism risk will increase. Implications For The 2024 Election Federal agencies were well aware of the risk of a domestic backlash when they decided to raid Mar-a-Lago. Investigators may or may not produce ironclad evidence of wrongdoing by Trump, but polarization will continue to be the overriding dynamic in the short run. It is unlikely that any evidence will convince the different parties to change their opinions of Trump. Assuming Republicans retake the House of Representatives this fall, they will likely impeach Biden, though they will lack the votes in the Senate to remove him from office. US domestic policy will be effectively paralyzed as the partisan conflict continues. The 2024 election will be required to settle the Trump saga and the future direction of US national policy. Trump’s legal troubles could be a blessing or a curse for the Republican Party in the 2024 cycle: If Trump is disqualified or put in jail, then he will become a political martyr for his populist base, motivating Republican voter turnout. At the same time, the Republican Party establishment will gain the advantage of nominating a more favorable candidate who will be eligible to hold the presidency for eight years. Republicans would benefit. If Trump is not disqualified, then he will be even more incentivized to run for the Republican nomination to avoid legal prosecution. In that case he will hinder Republican appeal among moderate and independent voters – leaving them vulnerable to a party split or third-party challenge. Even if he wins, he will only be eligible for the presidency for four years, limiting his party’s prospects. Republicans would suffer. The takeaway from the above is that Trump’s interests continue to be at odds with the interests of the Republican Party elite. If the Democrats aggressively prosecute Trump and try to put him behind bars, they will in fact help unify and motivate the Republican Party opposition. Two further conclusions can be drawn: First, because of the January 6 incident and the political fallout, any future attempt by protesters or rioters to storm a major federal power center will likely be met with overwhelming force rather than accommodation. If that occurs, and state violence is seen as partisan, then the party that uses force will suffer in public opinion. As with domestic terrorism, a major crisis is likely to occur. But it will ultimately be conducive to a new national policy consensus. Second, US domestic instability will incentivize foreign powers to take advantage of US distraction to pursue their national interests aggressively in their own region. At the same time, the US government will also pursue a reactive foreign policy to attempt to divide the opposition and suppress domestic dissent. Therefore US domestic political instability increases global geopolitical instability. Market Response Will Be Volatility What are the investment ramifications of the above? US corporate earnings are heavily insulated from political crises that do not affect either US policy or the structure of the government and economy. Volatility sometimes pops briefly during domestic terrorist events but not in a way that affects the investment outlook (Chart 12). Investors should bear this in mind since another crisis event is coming. True, if the Mar-a-Lago raid affects the midterm election – and hence the composition of the US government in 2023-24 – then financial markets will respond to some extent. However, investors can safely ignore this risk because the stagflationary economy will be the chief factor in the midterms and already favors the opposition party. For the same reason it remains highly likely that Republicans will retake the House of Representatives, producing legislative gridlock in 2023. The result is disinflationary in the short run, though inflation will be a persistent problem over the long run. If Democrats somehow retain control of both houses of Congress, i.e. the “Blue sweep risk,” then investors would see a substantial change in the policy outlook, as Democrats would have a second chance to raise taxes and social spending. But the odds of a blue sweep are low. Our House election model implies that Democrats will lose 22 seats when they only need to lose a net of five seats to lose control. Our Senate model gives 47.5% chance of Democrats retaining control, too close to call at this point (Appendix). The odds of another blue sweep are only 20% according to online betting market PredictIt. Chart 12Market Historically Ignores Domestic Terrorism
Market Historically Ignores Domestic Terrorism
Market Historically Ignores Domestic Terrorism
US political instability has, if anything, supported the US dollar and US equity and bond outperformance for many years. The more unstable the US, the more unstable the world. Indeed, because of the US’s geopolitical position, the US often exports domestic instability to the rest of the world. That is the situation today as the Biden administration’s domestic-focused, reactive foreign policy exacerbates the conflicts with Russia and China. The Biden administration is willing to escalate strategic tensions with both China and Russia in the lead-up to the midterm elections – and this tendency will likely become the Biden Doctrine, lasting into 2024. Investors should remain defensively positioned, and overweight US assets, at least until the midterm election is over. Matt Gertken Senior Vice President Chief US Political Strategist mattg@bcaresearch.com Footnotes 1 Read the warrant behind FBI search of Trump’s Mar-a-Lago,” PBS, August 12, 2022, pbs.org. 2 See Katarzyna Jasko et al, “A comparison of political violence by left-wing, right-wing, and Islamist extremists in the United States and the world,” PNAS [Proceedings of the National Academy of Sciences of the United States of America] 119:30 (2022), July 18, 2022, pnas.org. See also Herbert McClosky and Dennis Chong, “Similarities and Differences between Left-Wing and Right-Wing Radicals,” British Journal of Political Science 15:3 (1985), pp. 329-63, jstor.org. 3 See Jessica Lee, “Did Obama Get Caught ‘Spying’ on Trump’s 2016 Campaign?” Snopes, September 29, 2020, snopes.com. See also Wall Street Journal Editorial Board, “Trump Really Was Spied On,” February 14, 2022, wsj.com. 4 See Department of Homeland Security, “Strategic Intelligence Assessment and Data on Domestic Terrorism,” July 11, 2022, dhs.gov; Christopher Wray, “Worldwide Threats to the Homeland,” Federal Bureau of Investigation, September 17, 2020, fbi.gov. See also Ryan Lucas, “FBI, Homeland Security warn about threats to law enforcement after Trump search,” NPR, August 15, 2022, npr.org. 5 See Stef W. Kight, “DHS memo: Violent extremism ‘likely’ in wake of Roe v. Wade decision,” Axios, June 24, 2022, axios.com. Strategic View Open Tactical Positions (0-6 Months) Open Cyclical Recommendations (6-18 Months) Table A2Political Risk Matrix
Trump Raid Heightens Political Risk
Trump Raid Heightens Political Risk
Table A3US Political Capital Index
Trump Raid Heightens Political Risk
Trump Raid Heightens Political Risk
Chart A1Presidential Election Model
Third Quarter US Political Outlook: Last Ditch Effort
Third Quarter US Political Outlook: Last Ditch Effort
Chart A2Senate Election Model
Third Quarter US Political Outlook: Last Ditch Effort
Third Quarter US Political Outlook: Last Ditch Effort
Table A4House Election Model
Biden's Midterm Tactics Bear Fruit… But There's A Snake
Biden's Midterm Tactics Bear Fruit… But There's A Snake
Table A5APolitical Capital: White House And Congress
Trump Raid Heightens Political Risk
Trump Raid Heightens Political Risk
Table A5BPolitical Capital: Household And Business Sentiment
Trump Raid Heightens Political Risk
Trump Raid Heightens Political Risk
Table A5CPolitical Capital: The Economy And Markets
Trump Raid Heightens Political Risk
Trump Raid Heightens Political Risk