United States
The US JOLTS report showed the number of job openings decreased to a lower-than-expected 10.7 million in June, from 11.3 million in May, marking a third consecutive month of decline and the smallest increase since September 2021. Retail trade accounted for…
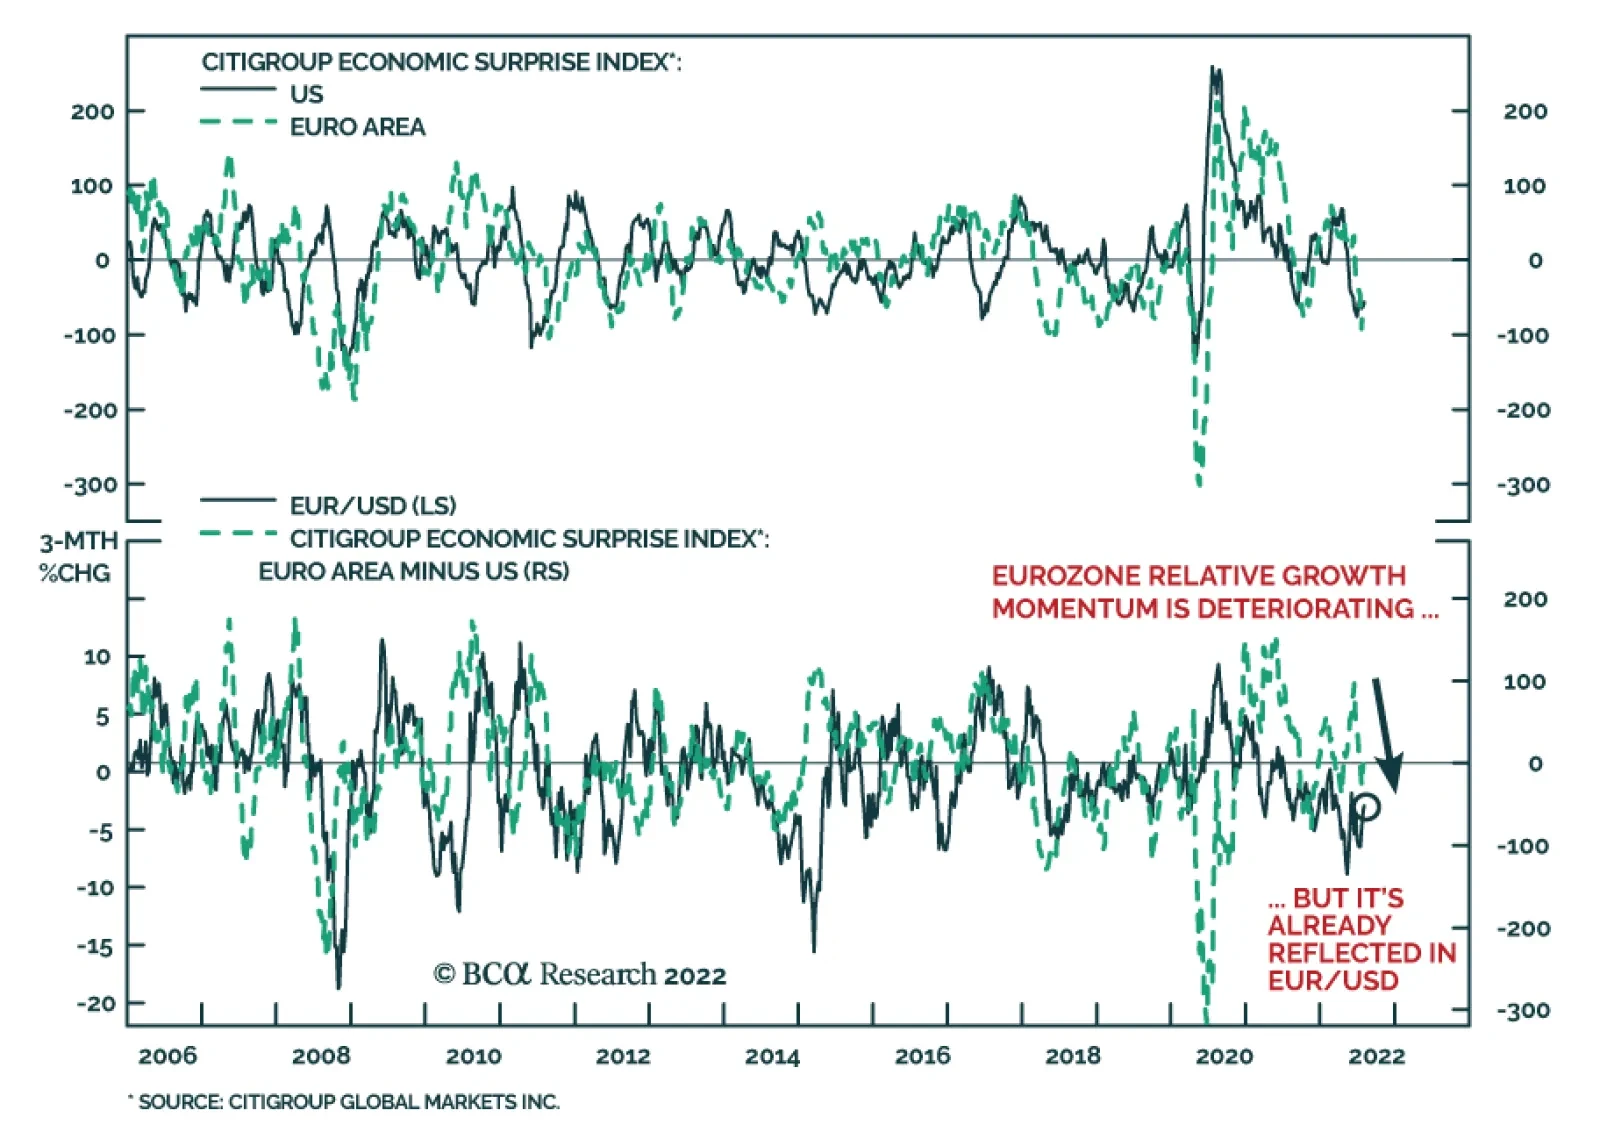
The Citigroup economic surprise indices for the US and the Euro Area are both deep in negative territory. Although the US index was first to cross below 0 in mid-May, the Eurozone measure turned negative towards the end of June and has recently been…
BCA Research’s Geopolitical Strategy service concludes that the US-China confrontation over Taiwan could cause a dramatic escalation in strategic tensions. Speaker of the US House of Representatives Nancy Pelosi arrived in Taiwan on Tuesday, defying…

Listen to a short summary of this report. Executive Summary Investors Are Pricing In A Much More Aggressive Tightening Cycle Than At The Start Of The Year
Investors Are Pricing In A Much More Aggressive Tightening Cycle Than At The Start Of The Year
Investors Are Pricing In A Much More Aggressive Tightening Cycle Than At The Start Of The Year
Following last week’s sharp post-FOMC rally, we shifted our 12-month equity recommendation from overweight to neutral. We expect stock prices to rise further during the remainder of the year as US recession risks abate, but then to give up most of their gains early next year as it becomes clear that the Fed has no intention of cutting rates and may even need to raise rates. We have more conviction that US growth will hold up over the next 12 months than we do that inflation will fall as fast as the Fed expects or the breakevens imply. These varying degrees of conviction stem from the same reason: The neutral rate of interest in the US is higher than widely believed. A high neutral rate implies that it may take significant monetary tightening to slow the economy. That reduces the risk of a recession in the near term, but it raises the risk that inflation will remain elevated. A recession is now our base case for the euro area. However, we expect the European economy to bounce back early next year, as gas supplies increase and fiscal policy turns more stimulative. The euro has significant upside over the long haul. Bottom Line: Stocks will continue to recover over the coming months before facing renewed pressure early next year. We are retaining our tactical (3-month) overweight on global equities but are shifting our 12-month recommendation to neutral. Taking Some Chips Off the Table Following last week’s sharp post-FOMC rally, we shifted our cyclical 12-month equity recommendation from overweight to neutral. This note lays out the key considerations in a Q&A format. Q: Have any of your underlying views about the economy changed recently or has the market simply moved towards pricing in your benign outlook? A: Mainly the latter. While we continue to see a higher-than-normal risk of a US recession over the next 12 months, our baseline (60% odds) remains no recession. Q: Many would say that we are in a recession already. A: While two consecutive quarters of negative growth does not officially constitute a recession, it is correct to say that every time real GDP has contracted for two quarters in a row, the NBER has ultimately deemed that episode a recession (Chart 1). Chart 1In The Past, Two Consecutive Quarters Of Negative Growth Have Always Coincided With A Recession
In The Past, Two Consecutive Quarters Of Negative Growth Have Always Coincided With A Recession
In The Past, Two Consecutive Quarters Of Negative Growth Have Always Coincided With A Recession
That said, one should keep two things in mind. First, preliminary GDP estimates are subject to significant revisions. According to our calculations, there is a 35% chance that real GDP growth in Q2 will ultimately be revised into positive territory (Chart 2). Even Q1 may eventually show positive growth. Real Gross Domestic Income (GDI), which conceptually should equal GDP, rose by 1.8% in Q1. Chart 2After Further Revisions, It Is Possible That GDP Growth Ends Up Being Positive In Q2 2022
Shifting Into Neutral: A Q&A
Shifting Into Neutral: A Q&A
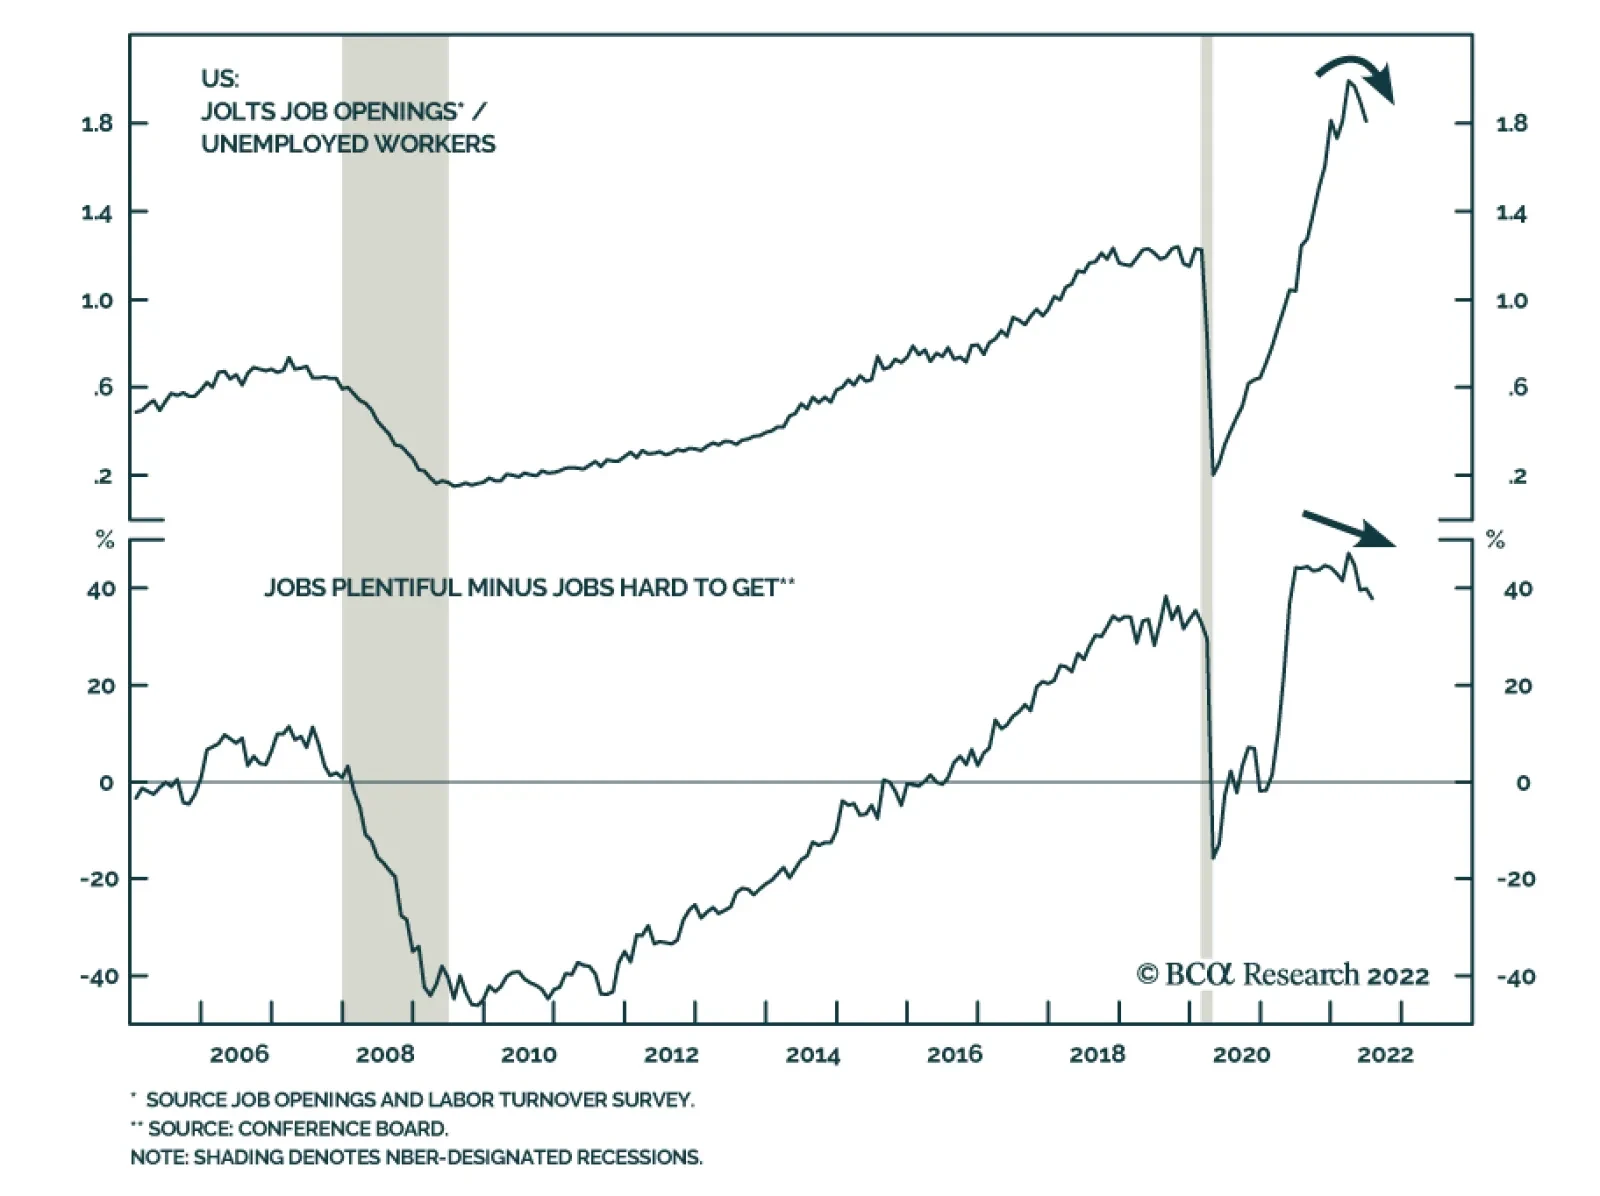
Second, every single US recession has seen an increase in the unemployment rate (Chart 3). So far, that has not happened, and there is good reason to think it will not happen for some time: There are 1.8 job openings per unemployed worker (Chart 4). For the foreseeable future, most people who lose their jobs will be able to walk across the street to find a new one. Chart 3Recessions And Spikes In The Unemployment Rate Go Hand-In-Hand
Recessions And Spikes In The Unemployment Rate Go Hand-In-Hand
Recessions And Spikes In The Unemployment Rate Go Hand-In-Hand
Chart 4A High Level Of Job Openings Creates A Moat Around The Labor Market
A High Level Of Job Openings Creates A Moat Around The Labor Market
A High Level Of Job Openings Creates A Moat Around The Labor Market
Chart 5Spending On Durable Goods Has Been Normalizing Without Derailing The Economy
Spending On Durable Goods Has Been Normalizing Without Derailing The Economy
Spending On Durable Goods Has Been Normalizing Without Derailing The Economy
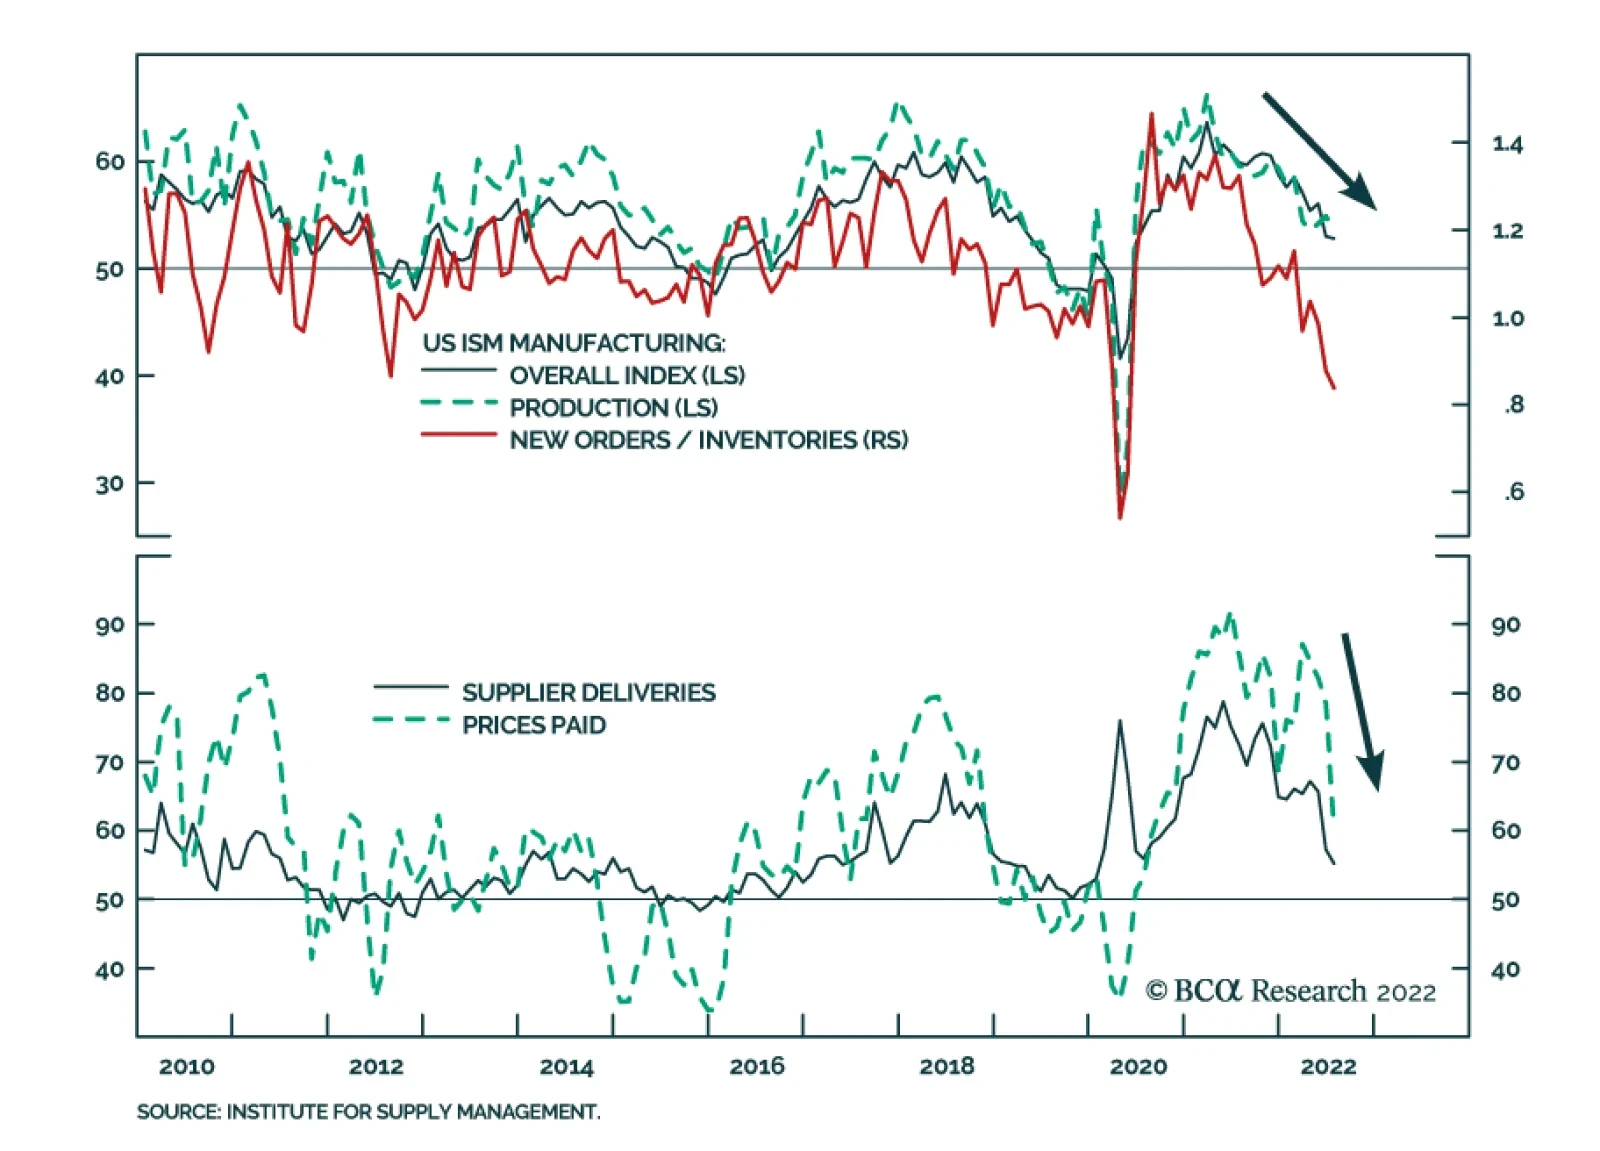
Q: Aren’t other measures of economic activity such as the ISM, consumer confidence, and homebuilder sentiment all signaling that a major slowdown is in progress? A: They are but we should take them with a grain of salt. The composition of consumer spending is shifting from goods to services. This is weighing on manufacturing output. As Chart 5 shows, goods spending has already retraced two-thirds of its pandemic surge, with no ill effects on the labor market. Consumer confidence tends to closely track real wages (Chart 6). Despite an extraordinarily tight labor market, real wages have been shrinking all year. As supply-chain bottlenecks abate, inflation will fall, allowing real wages to rise. This will bolster consumer confidence and spending. Falling gasoline prices will also boost disposable incomes. Prices at the pump have fallen for seven straight weeks and the futures market is pointing to further declines in the months ahead (Chart 7). Chart 6Falling Inflation Will Boost Real Wages And Consumer Confidence
Falling Inflation Will Boost Real Wages And Consumer Confidence
Falling Inflation Will Boost Real Wages And Consumer Confidence
Chart 7The Futures Market Points To Further Declines In Gasoline Prices
The Futures Market Points To Further Declines In Gasoline Prices
The Futures Market Points To Further Declines In Gasoline Prices
It is also critical to remember that the Fed is trying to slow the economy by tightening monetary policy. At the start of the year, investors expected the Fed funds rate to be 0.9% in early 2023. Today, they expect it to be 3.4% (Chart 8). Chart 8Investors Are Pricing In A Much More Aggressive Tightening Cycle Than At The Start Of The Year
Investors Are Pricing In A Much More Aggressive Tightening Cycle Than At The Start Of The Year
Investors Are Pricing In A Much More Aggressive Tightening Cycle Than At The Start Of The Year
Chart 9Housing Activity Should Recover Now That Mortgage Rates Have Stabilized
Housing Activity Should Recover Now That Mortgage Rates Have Stabilized
Housing Activity Should Recover Now That Mortgage Rates Have Stabilized
Rising rate expectations curb aggregate demand. This temporarily leads to lower growth. However, once rate expectations stabilize – and demand resets to a lower level – growth will tend to return to trend. The 6-month mortgage yield impulse has already turned up. This suggests that housing and other interest-rate sensitive parts of the economy will begin to recover by the end of the year (Chart 9). Admittedly, if the unemployment rate rises in response to lower aggregate demand, this could set off a vicious circle where higher unemployment leads to less spending, leading to even higher unemployment. However, as noted above, given that the current starting point is one where labor demand already exceeds labor supply by a wide margin, the odds of a such a labor market doom loop are much lower than during past downturns. Q: Does the question of whether we officially enter a recession or not really matter that much? A: It is a matter of degree. As Chart 10 shows, macroeconomic factors are by far the most important determinant of equity returns over medium-term horizons of about 12 months. As a rule of thumb, bear markets almost always coincide with recessions (Chart 11). Chart 10Macro Forces Are An Important Driver Of Equity Returns On Cyclical Horizons
Macro Forces Are An Important Driver Of Equity Returns On Cyclical Horizons (I)
Macro Forces Are An Important Driver Of Equity Returns On Cyclical Horizons (I)
Chart 11Equity Bear Markets And Recessions Go Hand-In-Hand
Equity Bear Markets And Recessions Go Hand-In-Hand
Equity Bear Markets And Recessions Go Hand-In-Hand
Chart 12Soaring Energy Prices Have Boosted Earnings Estimates This Year
Soaring Energy Prices Have Boosted Earnings Estimates This Year
Soaring Energy Prices Have Boosted Earnings Estimates This Year
Q: Are you surprised that earnings estimates have not come down faster this year as economic risks have intensified? A: Most analysts have not baked in a recession in their forecasts, so from that perspective, if our baseline scenario of no recession does not pan out, earnings estimates will almost certainly come down (Chart 12). That said, the bar for major downward earnings revisions is quite high. This is partly because we think that if a recession does occur, it is likely to be a mild one. It is also because earnings are reported in nominal terms. In contrast to real GDP, nominal GDP grew by 6.6% in Q1 and 7.8% in Q2. Q: Let’s turn to interest rates. Why do you think the Fed will not cut rates next year as markets are discounting? A: It all boils down to the neutral rate of interest. In past reports, we made the case that the neutral rate in the US is higher than widely believed. The fact that job vacancies are so plentiful provides strong evidence in favor of our thesis. If the neutral rate were low, the labor market would not have overheated. But it did, implying that monetary policy must have been exceptionally accommodative. The good news for investors is that a high neutral rate implies that the Fed is unlikely to induce a recession by raising rates in accordance with its dot plot. That reduces the risk of a recession in the near term. The bad news is that a high neutral rate will essentially preclude the Fed from cutting rates next year. The economy will simply be too strong for that. Worse still, if the Fed is too slow in bringing rates to neutral, inflation – which is likely to fall over the coming months as supply-chain pressures ease – could reaccelerate at some point next year. That could force the Fed to start hiking rates again. Chart 13Real Yields Have Scope To Rise Further
Real Yields Have Scope To Rise Further
Real Yields Have Scope To Rise Further
Q: What is your estimate for the neutral rate in the US? A: In the past, we have written that the neutral rate in the US is around 3.5%-to-4%. However, I must admit, I’m not a big fan of this formulation. Real rates matter more for economic growth than nominal rates, and long-term rates matter more than short-term rates. Thus, a better question is what level of real long-term bond yields is consistent with stable inflation and full employment. Based on research we have published in the past, my best bet is that the neutral long-term real bond yield is between 1.5%-and-2%. That is substantially above the 10-year TIPS yield (0.27%) and the 30-year TIPS yield (0.79%) (Chart 13). Given that the yield curve is inverted, the Fed may have to raise policy rates well above 4% in order to drag up the long end of the curve. It is a bit like how oil traders say you need to lift spot crude prices in order to push up long-term futures prices when the oil curve is backwardated. Chart 14Investors Expect Inflation To Fall Rapidly Over The Next Few Years
Shifting Into Neutral: A Q&A
Shifting Into Neutral: A Q&A
Q: So presumably then, you would favor a short duration position in fixed-income portfolios? A: Yes, if the whole yield curve shifts higher, you will lose a lot less money in short-term bonds than in long-term bonds. Relatedly, we would overweight TIPS versus nominal bonds. The TIPS market is pricing in a very rapid decline in inflation over the next few years (Chart 14). The widely followed 5-year, 5-year forward TIPS inflation breakeven rate is trading at 2.28%, toward the bottom end of the Fed’s comfort zone of 2.3%-to-2.5%.1 Q: What about credit? A: US high-yield bonds are pricing in a default rate of 6.1% over the next 12 months. This is up from an expected default rate of 3.8% at the start of the year and is significantly higher than the trailing 12-month default rate of 1.4%. In a typical recession, high-yield default rates rise above 8% (Chart 15). Thus, spreads would probably increase if the US entered a recession. That said, it is important to keep in mind that many corporate borrowers took advantage of very low long-term yields over the past few years to extend the maturity of their debt. Only 7% of US high-yield debt, and less than 1% of investment-grade debt, held in corporate credit ETFs matures in less than two years. This suggests that the default cycle, if it were to occur, would be less intense and more elongated than previous ones. Chart 15High-Yield Bonds Are Pricing In Higher Default Rates
High-Yield Bonds Are Pricing In Higher Default Rates
High-Yield Bonds Are Pricing In Higher Default Rates
On balance, we recommend a modest overweight to high-yield bonds within fixed-income portfolios. Chart 16High Energy Prices Are Weighing On The European Economy
High Energy Prices Are Weighing On The European Economy
High Energy Prices Are Weighing On The European Economy
Q: Let’s turn to non-US markets. The dollar has strengthened a lot against the euro this year as the economic climate in Europe has soured. Can Europe avoid a recession? A: Probably not. European natural gas prices are back near record highs and business surveys increasingly point to recession (Chart 16). That said, the nature of Europe’s recession could turn out to be quite different from what many expect. There are a few useful parallels between the predicament Europe finds itself in now and what the global economy experienced early on during the pandemic. Just like the Novel coronavirus, as it was called back then, represented an external shock to the global economy, the partial cut-off in Russian energy flows represents an external shock to the European economy. Policymakers in advanced economies responded to the pandemic by showering their economies with various income-support measures. European governments will react similarly to the energy crunch. In fact, the political incentive to respond generously is even greater this time around because the last thing European leaders want is for Putin to succeed in his efforts to destabilize the region. For its part, the ECB will set an extremely low bar for buying Italian bonds and the debt of other vulnerable economies. Just like the world eventually deployed vaccines, Europe is taking steps to inoculate itself from its dangerous addiction to Russian energy. The official REPowerEU plan seeks to displace two-thirds of Russian natural gas imports by the end of the year. While some aspects of the plan are probably too optimistic, others may not be optimistic enough. For example, the plan does not envision increased energy production from coal-fired plants, which is something that even the German Green Party has now signed on to. The euro is trading near parity to the dollar because investors expect growth in the common-currency bloc to remain depressed for an extended period of time. If investors start to price in a more forceful recovery, the euro will rally. Q: China’s economy remains in the doldrums. Could that undermine your sanguine view on the global economy? A: China’s PMI data disappointed in July, as anxiety over the zero-Covid policy and a sagging property market continued to weigh on activity (Chart 17). We do not expect any change to the zero-Covid policy until the conclusion of the Twentieth Party Congress later this year. After that, the government is likely to ease restrictions, which will help to reignite growth. Chart 17The Zero-Covid Policy And Slumping Property Market Are Weighing On Chinese Economic Activity
The Zero-Covid Policy And Slumping Property Market Are Weighing On Chinese Economic Activity
The Zero-Covid Policy And Slumping Property Market Are Weighing On Chinese Economic Activity
Chart 18China Faces A Structural Decline In The Demand For Housing
China Faces A Structural Decline In The Demand For Housing
China Faces A Structural Decline In The Demand For Housing
The property market has probably entered a secular downturn (Chart 18). If a weakening property market were to cause a banking crisis, similar to what happened in the US and parts of Europe in 2008, this would destabilize the global economy. However, we doubt that this will happen given the control the government has over the banking system. In contrast, a soft landing for the Chinese real estate market might turn out to be a welcome development for the global economy, as less Chinese property investment would keep a lid on commodity prices, thus helping to ease inflationary pressures. Peter Berezin Chief Global Strategist peterb@bcaresearch.com Follow me on LinkedIn & Twitter Footnotes 1 The Federal Reserve targets an average inflation rate of 2% for the Personal Consumption Expenditures (PCE) index. The TIPS breakeven is based on the CPI index. Due to compositional differences between the two indices, CPI inflation has historically averaged 30-to-50 basis points higher than PCE inflation. This is why the Fed effectively targets a CPI inflation rate of 2.3%-to-2.5%. View Matrix
Image
Special Trade Recommendations Current MacroQuant Model Scores
Shifting Into Neutral: A Q&A
Shifting Into Neutral: A Q&A
Highlights Chart 1Are Expectations Too Dovish?
Are Expectations Too Dovish?
Are Expectations Too Dovish?
The bond market is now priced for the fed funds rate to peak at 3.44% in January and then head back down to 2.79% by the end of 2023 (Chart 1). We strongly push back against the idea that the Fed will be cutting rates in 2023. While inflation will fall during the next few months, strong wage growth suggests that it will be sticky above the Fed’s 2% target for some time. What’s more, comments from yesterday’s ISM PMI release show that “companies continue to hire at strong rates”. Our sense is that it will be difficult to push the unemployment rate up significantly even as economic activity slows. Given that inflation is likely to fall during the next few months, we recommend keeping portfolio duration ‘at benchmark’ for the time being. However, we are now actively looking for an opportunity to reduce portfolio duration and we could change our recommended allocation in the near term. Stay tuned. Feature Table 1 Recommended Portfolio Specification Table 2Fixed Income Sector Performance
Don't Bet On A Fed Pivot
Don't Bet On A Fed Pivot
Table 3A Corporate Sector Relative Valuation And Recommended Allocation* Table 3BCorporate Sector Risk Vs. Reward*
Don't Bet On A Fed Pivot
Don't Bet On A Fed Pivot
Investment Grade: Underweight Chart 2Investment Grade Market Overview
Investment Grade Market Overview
Investment Grade Market Overview
Investment grade corporate bonds outperformed the duration-equivalent Treasury index by 109 basis points in July, bringing year-to-date excess returns up to -274 bps. The average index option-adjusted spread tightened 11 bps on the month and it currently sits at 144 bps. Similarly, our quality-adjusted 12-month breakeven spread moved down to its 54th percentile since 1995 (Chart 2). A report from a few months ago made the case for why investors should underweight investment grade corporate bonds on a 6-12 month investment horizon.1 The main rationale for this recommendation is that the slope of the Treasury curve suggests that the credit cycle is in its late stages. Corporate bond performance tends to be weak during periods when the yield curve is very flat or inverted. Despite our underweight 6-12 month investment stance, we wouldn’t be surprised to see spreads narrow further during the next couple of months as inflation finally shows signs of rolling over. That said, the persistent removal of monetary accommodation and inverted yield curve will limit how much spreads can compress. A recent report dug deeper into the corporate bond space and concluded that investment grade-rated Energy bonds offer exceptional value on a 6-12 month horizon.2 That report also concluded that long maturity investment grade corporates are attractively priced relative to short maturity bonds. High-Yield: Neutral Chart 3High-Yield Market Overview
High-Yield Market Overview
High-Yield Market Overview
High-Yield outperformed the duration-equivalent Treasury index by 434 basis points in July, bringing year-to-date excess returns up to -493 bps. The average index option-adjusted spread tightened 100 bps on the month to reach 469 bps, 100 bps above the 2017-19 average and 62 bps below the 2018 peak. The 12-month spread-implied default rate – the default rate that is priced into the junk index assuming a 40% recovery rate on defaulted debt and an excess spread of 100 bps – moved lower in July. It currently sits at 6.2% (Chart 3). As is the case with investment grade, there’s a good chance that high-yield spreads can continue their relief rally during the next couple of months as inflation falls. Due to the flatness of the yield curve, we think it will be difficult for spreads to move below the average seen during the last tightening cycle (2017-19). However, even a move back to average 2017-19 levels would equate to roughly 5% of excess return for the junk index if it is realized over a six month period. This potential return is the main reason to prefer high-yield over investment grade in a US bond portfolio. While we maintain a neutral (3 out of 5) allocation to high-yield for now, we will be inclined to downgrade the sector if spreads tighten to the 2017-19 average or if core inflation falls back to 4%.3 MBS: Underweight Chart 4MBS Market Overview
MBS Market Overview
MBS Market Overview
Mortgage-Backed Securities outperformed the duration-equivalent Treasury index by 129 basis points in July, bringing year-to-date excess returns up to -44 bps. We discussed the outlook for Agency MBS in a recent report.4 We noted that MBS’s poor performance in 2021 and early-2022 was driven by duration extension. Fewer homeowners refinanced their loans as mortgage rates rose, and the MBS index’s average duration increased (Chart 4). But now, the index’s duration extension is at its end. The average convexity of the MBS index is close to zero (panel 3), meaning that duration is now insensitive to changes in rates. This is because hardly any homeowners have the incentive to refinance at current mortgage rates. The implication is that excess MBS returns will be stronger going forward. That said, we still don’t see enough value in MBS spreads to increase our recommended allocation. The average index spread for conventional 30-year Agency MBS remains close to its lowest level since 2000 (panel 4). At the coupon level, we observe that low-coupon MBS have much higher duration than high-coupon MBS and that convexity is close to zero for the entire coupon stack. This makes the relative coupon trade a direct play on bond yields. We had been recommending that investors favor low-coupon (1.5%-2.5%) MBS over high-coupon (3%-4.5%) MBS to take advantage of falling bond yields (bottom panel). Now that bond yields have fallen, we think it is wise to take profits on this position and shift to a neutral allocation across the coupon stack. Emerging Market Bonds (USD): Underweight Chart 5Emerging Markets Overview
Emerging Markets Overview
Emerging Markets Overview
Emerging Market bonds outperformed the duration-equivalent Treasury index by 31 basis points in July, bringing year-to-date excess returns up to -708 bps. EM Sovereigns outperformed the Treasury benchmark by 155 bps on the month, bringing year-to-date excess returns up to -784 bps. The EM Corporate & Quasi-Sovereign Index underperformed by 45 bps, dragging year-to-date excess returns down to -659 bps. The EM Sovereign Index outperformed the duration-equivalent US corporate bond index by 53 bps in July. The yield differential between EM sovereigns and duration-matched US corporates remains negative (Chart 5). As such, we continue to recommend a maximum underweight allocation to EM sovereigns. The EM Corporate & Quasi-Sovereign Index underperformed duration-matched US corporates by 116 bps in July. The index continues to offer a significant yield advantage versus duration-matched US corporates (panel 4). As such, we continue to recommend a neutral (3 out of 5) allocation to the sector. EM currencies continue to struggle versus the US dollar (bottom panel), and depreciating exchange rates will continue to act as a headwind for USD-denominated EM bond performance. Our Emerging Market Strategy service expects continued near-term weakness in EM currencies.5 Municipal Bonds: Overweight Chart 6Municipal Market Overview
Municipal Market Overview
Municipal Market Overview
Municipal bonds underperformed the duration-equivalent Treasury index by 2 basis points in July, dragging year-to-date excess returns down to -169 bps (before adjusting for the tax advantage). We view the municipal bond sector as better placed than most to cope with the recent bout of spread volatility. As we noted in a recent report, state & local government revenue growth has been strong, but governments have been slow to hire.6 The result is that net state & local government savings are incredibly high (Chart 6) and it will take some time to deplete those coffers, even as economic growth slows and federal fiscal thrust turns to drag. On the valuation front, munis have cheapened up relative to both Treasuries and corporates during the past few months. The 10-year Aaa Muni / Treasury yield ratio is currently 85%, up significantly from its 2021 trough of 55%. The yield ratio between 12-17 year munis and duration-matched corporate bonds is also up significantly off its lows (panel 2). We reiterate our overweight allocation to municipal bonds within US fixed income portfolios, and we continue to have a strong preference for long-maturity munis. The yield ratio between 17-year+ General Obligation Municipal bonds and duration-matched US corporates is 89%. The same measure for 17-year+ Revenue bonds stands at 95%, just below parity even without considering municipal debt’s tax advantage. Treasury Curve: Buy 2-Year Bullet Versus Cash/5 Barbell Chart 7Treasury Yield Curve Overview
Treasury Yield Curve Overview
Treasury Yield Curve Overview
The Treasury curve bull-flattened out to the 10-year maturity point in July. The 2-year/10-year Treasury slope flattened 28 bps on the month while the 5-year/30-year slope steepened 17 bps. The 2/10 and 5/30 slopes now stand at -22 bps and +30 bps, respectively. We closed our position long the 5-year bullet versus a duration-matched 2/10 barbell in a recent report.7 The reason for the move is that the 5-year note no longer offers a yield advantage versus the 2/10 barbell. That 2/5/10 butterfly spread has continued to compress during the past three weeks, and it now sits at -10 bps (Chart 7). In that same report we initiated a new recommendation: buy the 2-year bullet versus a duration-matched barbell consisting of cash and the 5-year note. This position offers a much more attractive yield advantage of 51 bps (bottom panel). Our new position will deliver strong returns if the 2-year/5-year Treasury slope steepens, something that is likely to occur if the market prices out the rate cuts that are currently discounted for next year. This would be in line with our base case expectation. However, if our base case is wrong and a deep recession forces the Fed to cut rates during the next 6-12 months, then our position should also benefit from a bull-steepening of the 2/5 slope. TIPS: Neutral Chart 8TIPS Market Overview
TIPS Market Overview
TIPS Market Overview
TIPS outperformed the duration-equivalent nominal Treasury index by 270 basis points in July, bringing year-to-date excess returns up to +256 bps. The 10-year TIPS breakeven inflation rate rose 20 bps on the month, moving back above the Fed’s 2.3% - 2.5% comfort zone (Chart 8). Meanwhile, our TIPS Breakeven Valuation Indicator now shows that TIPS are modestly cheap versus nominals (panel 2). We upgraded TIPS from underweight to neutral in a recent report.8 In that report we noted that TIPS valuation had improved considerably in recent months as the cost of inflation compensation embedded in the market trended down. For example, the 1-year CPI swap rate currently sits at 3.94%, down from a peak of 5.9% in June. Given our expectation that core inflation will be sticky around 4%, the cost of inflation compensation looks a lot more compelling than it did even a month ago. We also closed our long-standing recommendation to short 2-year TIPS in a report published two weeks ago.9 We made this change after the 2-year TIPS yield moved into positive territory for the first time since 2020, up from a 2021 low of -3.07% (bottom panel). We are not yet ready to upgrade TIPS to overweight, despite much improved valuation, because headline inflation is much more likely to trend lower than higher during the next few months. That said, if current valuations persist, we will likely be looking to upgrade TIPS once more before the end of the year. ABS: Overweight Chart 9ABS Market Overview
ABS Market Overview
ABS Market Overview
Asset-Backed Securities underperformed the duration-equivalent Treasury index by 10 basis points in July, dragging year-to-date excess returns down to -52 bps. Aaa-rated ABS underperformed by 10 bps on the month, dragging year-to-date excess returns down to -43 bps. Non-Aaa ABS underperformed by 11 bps on the month, dragging year-to-date excess returns down to -104 bps. During the past two years, substantial federal government support for household incomes caused US households to build up an extremely large buffer of excess savings. Nowhere is this more evident than in the steep drop in the amount of outstanding credit card debt that was witnessed in 2020 and 2021 (Chart 9). In 2022, consumers have started to re-lever. The personal savings rate was just 5.1% in June and the amount of outstanding credit card debt has recovered to its pre-COVID level (bottom panel). But while household balance sheets are starting to deteriorate, they remain exceptionally strong in level terms. In other words, it will be some time before we see enough deterioration to cause a meaningful uptick in consumer credit delinquencies. Investors should remain overweight consumer ABS and should take advantage of the high quality of household balance sheets by moving down the quality spectrum, favoring non-Aaa rated securities over Aaa-rated ones. Non-Agency CMBS: Overweight Chart 10CMBS Market Overview
CMBS Market Overview
CMBS Market Overview
Non-Agency Commercial Mortgage-Backed Securities outperformed the duration-equivalent Treasury index by 19 basis points in July, bringing year-to-date excess returns up to -175 bps. Aaa Non-Agency CMBS outperformed Treasuries by 18 bps on the month, bringing year-to-date excess returns up to -123 bps. Non-Aaa Non-Agency CMBS outperformed by 22 bps on the month, bringing year-to-date excess returns up to -319 bps. CMBS spreads remain wide compared to other similarly risky spread products and are currently slightly above their historic averages. Further, last week’s Q2 GDP report confirmed that commercial real estate (CRE) investment remains weak (Chart 10). Weak investment will continue to support CRE price appreciation which will benefit CMBS spreads. Agency CMBS: Overweight Agency CMBS underperformed the duration-equivalent Treasury index by 24 bps in July, dragging year-to-date excess returns down to -15 bps. The average index option-adjusted spread widened 9 bps on the month. It currently sits at 54 bps, close to its long-term average (bottom panel). Agency CMBS spreads also continue to look attractive compared to other similarly risky spread products. Stay overweight. Appendix A: The Golden Rule Of Bond Investing We follow a two-step process to formulate recommendations for bond portfolio duration. First, we determine the change in the federal funds rate that is priced into the yield curve for the next 12 months. Second, we decide – based on our assessments of the economy and Fed policy – whether the change in the fed funds rate will exceed or fall short of what is priced into the curve. Most of the time, a correct answer to this question leads to the appropriate duration call. We call this framework the Golden Rule Of Bond Investing, and we demonstrated its effectiveness in the US Bond Strategy Special Report, “The Golden Rule Of Bond Investing”, dated July 24, 2018. Chart 11 illustrates the Golden Rule’s track record by showing that the Bloomberg Barclays Treasury Master Index tends to outperform cash when rate hikes fall short of 12-month expectations, and vice-versa. At present, the market is priced for 78 basis points of rate hikes during the next 12 months. Chart 11The Golden Rule's Track Record
The Golden Rule's Track Record
The Golden Rule's Track Record
We can also use our Golden Rule framework to make 12-month total return and excess return forecasts for the Bloomberg Barclays Treasury index under different scenarios for the fed funds rate. Excess returns are relative to the Bloomberg Barclays Cash index. To forecast total returns we first calculate the 12-month fed funds rate surprise in each scenario by comparing the assumed change in the fed funds rate to the current value of our 12-month discounter. This rate hike surprise is then mapped to an expected change in the Treasury index yield using a regression based on the historical relationship between those two variables. Finally, we apply the expected change in index yield to the current characteristics (yield, duration and convexity) of the Treasury index to estimate total returns on a 12-month horizon. The below tables present those results, along with excess returns for a front-loaded and a back-loaded rate hike scenario. Excess returns are calculated by subtracting assumed cash returns in each scenario from our total return projections.
Don't Bet On A Fed Pivot
Don't Bet On A Fed Pivot
Appendix B: Butterfly Strategy Valuations The following tables present the current read-outs from our butterfly spread models. We use these models to identify opportunities to take duration-neutral positions across the Treasury curve. The following two Special Reports explain the models in more detail: US Bond Strategy Special Report, “Bullets, Barbells And Butterflies”, dated July 25, 2017, available at usbs.bcaresearch.com US Bond Strategy Special Report, “More Bullets, Barbells And Butterflies”, dated May 15, 2018, available at usbs.bcaresearch.com Table 4 shows the raw residuals from each model. A positive value indicates that the bullet is cheap relative to the duration-matched barbell. A negative value indicates that the barbell is cheap relative to the bullet. Table 4Butterfly Strategy Valuation: Raw Residuals In Basis Points (As Of July 29, 2022)
Don't Bet On A Fed Pivot
Don't Bet On A Fed Pivot
Table 5 scales the raw residuals in Table 4 by their historical means and standard deviations. This facilitates comparison between the different butterfly spreads. Table 5Butterfly Strategy Valuation: Standardized Residuals (As Of July 29, 2022)
Don't Bet On A Fed Pivot
Don't Bet On A Fed Pivot
Table 6 flips the models on their heads. It shows the change in the slope between the two barbell maturities that must be realized during the next six months to make returns between the bullet and barbell equal. For example, a reading of 34 bps in the 5 over 2/10 cell means that we would only expect the 5-year to outperform the 2/10 if the 2/10 slope steepens by more than 34 bps during the next six months. Otherwise, we would expect the 2/10 barbell to outperform the 5-year bullet. Table 6Discounted Slope Change During Next 6 Months (BPs)
Don't Bet On A Fed Pivot
Don't Bet On A Fed Pivot
Appendix C: Excess Return Bond Map The Excess Return Bond Map is used to assess the relative risk/reward trade-off between different sectors of the US bond market. It is a purely computational exercise and does not impose any macroeconomic view. The Map’s vertical axis shows 12-month expected excess returns. These are proxied by each sector’s option-adjusted spread. Sectors plotting further toward the top of the Map have higher expected returns and vice-versa. Our novel risk measure called the “Risk Of Losing 100 bps” is shown on the Map’s horizontal axis. To calculate it, we first compute the spread widening required on a 12-month horizon for each sector to lose 100 bps or more relative to a duration-matched position in Treasury securities. Then, we divide that amount of spread widening by each sector’s historical spread volatility. The end result is the number of standard deviations of 12-month spread widening required for each sector to lose 100 bps or more versus a position in Treasuries. Lower risk sectors plot further to the right of the Map, and higher risk sectors plot further to the left. Chart 12Excess Return Bond Map (As Of July 29, 2022)
Don't Bet On A Fed Pivot
Don't Bet On A Fed Pivot
Ryan Swift US Bond Strategist rswift@bcaresearch.com Footnotes 1 Please see US Bond Strategy / Global Fixed Income Strategy Special Report, “Turning Defensive On US Corporate Bonds”, dated April 12, 2022. 2 Please see US Bond Strategy / Global Fixed Income Strategy Special Report, “Looking For Opportunities In US & European Corporates After The Recent Selloff”, dated May 31, 2022. 3 For more details on this call please see US Bond Strategy Weekly Report, “When The Dual Mandates Clash”, dated June 28, 2022. 4 Please see US Bond Strategy Weekly Report, “The Bond Market Implications Of A 5% Mortgage Rate”, dated April 26, 2022. 5 Please see Emerging Markets Strategy Charts That Matter, “Beware Of Another Downleg In Risk Assets”, dated June 30, 2022. 6 Please see US Bond Strategy Weekly Report, “Echoes Of 2018”, dated May 24, 2022. 7 Please see US Bond Strategy / Global Fixed Income Strategy Weekly Report, “A Low Conviction US Bond Market”, dated July 12, 2022. 8 Please see US Bond Strategy / Global Fixed Income Strategy Weekly Report, “A Low Conviction US Bond Market”, dated July 12, 2022. 9 Please see US Bond Strategy Weekly Report, “Three Conjectures About The US Economy”, dated July 19, 2022. Recommended Portfolio Specification Other Recommendations Treasury Index Returns Spread Product Returns
The ISM PMI suggests that manufacturing activity continued to expand at a steady pace in July. The headline index was broadly unchanged at 52.8 (versus 53.0 in June). This figure is in line with the S&P Global’s US Manufacturing PMI’s 52.2 print (see The…
Executive Summary Biden Can Take Risks Ahead Of Midterms
The Fourth Taiwan Strait Crisis
The Fourth Taiwan Strait Crisis
News reports suggest House Speaker Nancy Pelosi will travel to Taiwan and meet with Taiwanese President Tsai Ing-wen in the coming days. China has promised military counter-measures if she visits. Structural factors suggest US-China tensions over Taiwan could explode: China’s reversion to autocracy and hawkish foreign policy, Taiwan’s assertion of autonomy, and the US’s political instability and foreign policy reactiveness. Cyclical factors also suggest that tensions could escalate: China’s instability in the wake of Covid-19, the ramifications of Russia’s invasion of Ukraine, the budding Russo-Chinese alliance, the Biden administration’s domestic political vulnerability, and the Xi administration’s domestic political vulnerability. In particular, Xi cannot back down. A diplomatic crisis or military showdown is likely in the short run but not yet a full-scale war. Taiwan is harder to invade than Ukraine, the US is not attempting a radical boost to Taiwan’s military, Taiwan is not moving toward formal independence, and the Chinese economy is not yet collapsing beyond all hope. However, over the long run we fear that a Taiwan war is more likely than not. Tactically investors should prefer government bonds to equities, US equities to global, defensive sectors to cyclicals, and safe havens to risky assets. Investors should short Chinese and Taiwanese currencies and assets. Tactical Recommendation Inception Date Return LONG US SEMICONDUCTOR & SEMI EQUIPMENT / TAIWAN EQUITIES 2022-06-23 14.6% LONG KOREA/ SHORT TAIWAN EQUITIES 2020-03-27 -23.5% Bottom Line: Tactically investors should buy safe-haven assets and await a resolution of the US-China confrontation over Taiwan, which could cause a dramatic escalation in strategic tensions. Feature A fourth Taiwan Strait crisis is likely upon us. Speaker of the US House of Representatives Nancy Pelosi will visit Taiwan during her travel around Asia Pacific this week, according to the Wall Street Journal on August 1. Chinese President Xi Jinping warned US President Joe Biden in a phone conversation on July 28 that “those who play with fire will eventually get burned,” referring specifically to US relations with Taiwan. Chinese foreign ministry officials have threatened “forceful” countermeasures if Pelosi visits the island, explicitly saying that the People’s Liberation Army would respond in some way. There is still some uncertainty over whether Pelosi will go. She delayed the trip in April. Rumors emerged over July that she would resume but President Joe Biden suggested on July 20 that US military officials opposed the trip, believed the timing to be inappropriate. Taiwan was not mentioned in Pelosi’s official itinerary published on July 31, which includes Singapore, Japan, South Korea, and Malaysia. But the Wall Street Journal report has been corroborated by US and Taiwanese officials. Assuming Pelosi goes, China will respond with some military show of force. The US may pretend that one hand (the White House, the Department of Defense) does not know what the other hand is doing (the House of Representatives). But China will not be convinced. There are three major reasons that we have predicted a fourth Taiwan Strait crisis: 1. China’s reversion to autocracy and foreign policy hawkishness: After the Great Recession, China was forced into a painful downshift in potential economic growth, stemming from a contracting labor force, excessive debt, and changes in the international economy (Chart 1). As economic growth has slowed, China has pursued political centralization, economic mercantilism, military modernization, and foreign policy assertiveness, offering nationalism as a distraction from the disappointments of the new middle class. While China may not be ready to launch a full-scale invasion of Taiwan, it is willing to do so if the Communist Party regime’s survival is at stake. Chart 1China's Slowdown Leads To Hawkishness
China's Slowdown Leads To Hawkishness
China's Slowdown Leads To Hawkishness
2. Taiwan’s reassertion of autonomy: Taiwanese people began to sour on mainland China with the Great Recession and increasingly developed an independent identity (Chart 2). China’s growing economic influence, combined with Xi Jinping’s re-centralization of power across Greater China, provoked a backlash in Taiwan beginning in 2013 that culminated in the nominally pro-independence Democratic Progressive Party gaining full control of the island in 2016. The US-China trade war, China’s imposition of control over critical buffer spaces (including the South China Sea and Hong Kong), and US export controls on advanced technologies thrust Taiwan into the middle of a strategic confrontation. While Taiwan is not seeking war or formal political independence, it is seeking closer ties with the US and democratic allies to protect against Beijing’s encroachment. 3. US political instability and foreign policy reaction: The Great Recession brought the US’s latent political instability from a simmer to a boil. The Washington establishment withdrew from the war on terrorism only to face discontent at home and strategic competition from China and Russia. China intensified its acquisition of US technology while North Korea obtained a nuclear arsenal under China’s watch. A surge in populism led the US to initiate a trade war against China and to impose restrictions on critical technologies to slow China’s modernization. While the US political factions bickered over domestic policy, they both tapped into a popular consensus on economic nationalism and hawkishness toward China (Chart 3). While the US is struggling to curb Russia and Iran, its greatest long-term challenge stems from China and it is increasingly focused on containing China’s economy and strategic ambitions. Chart 2Taiwanese Souring On China
The Fourth Taiwan Strait Crisis
The Fourth Taiwan Strait Crisis
Chart 3US Hawkish Consensus On China
The Fourth Taiwan Strait Crisis
The Fourth Taiwan Strait Crisis
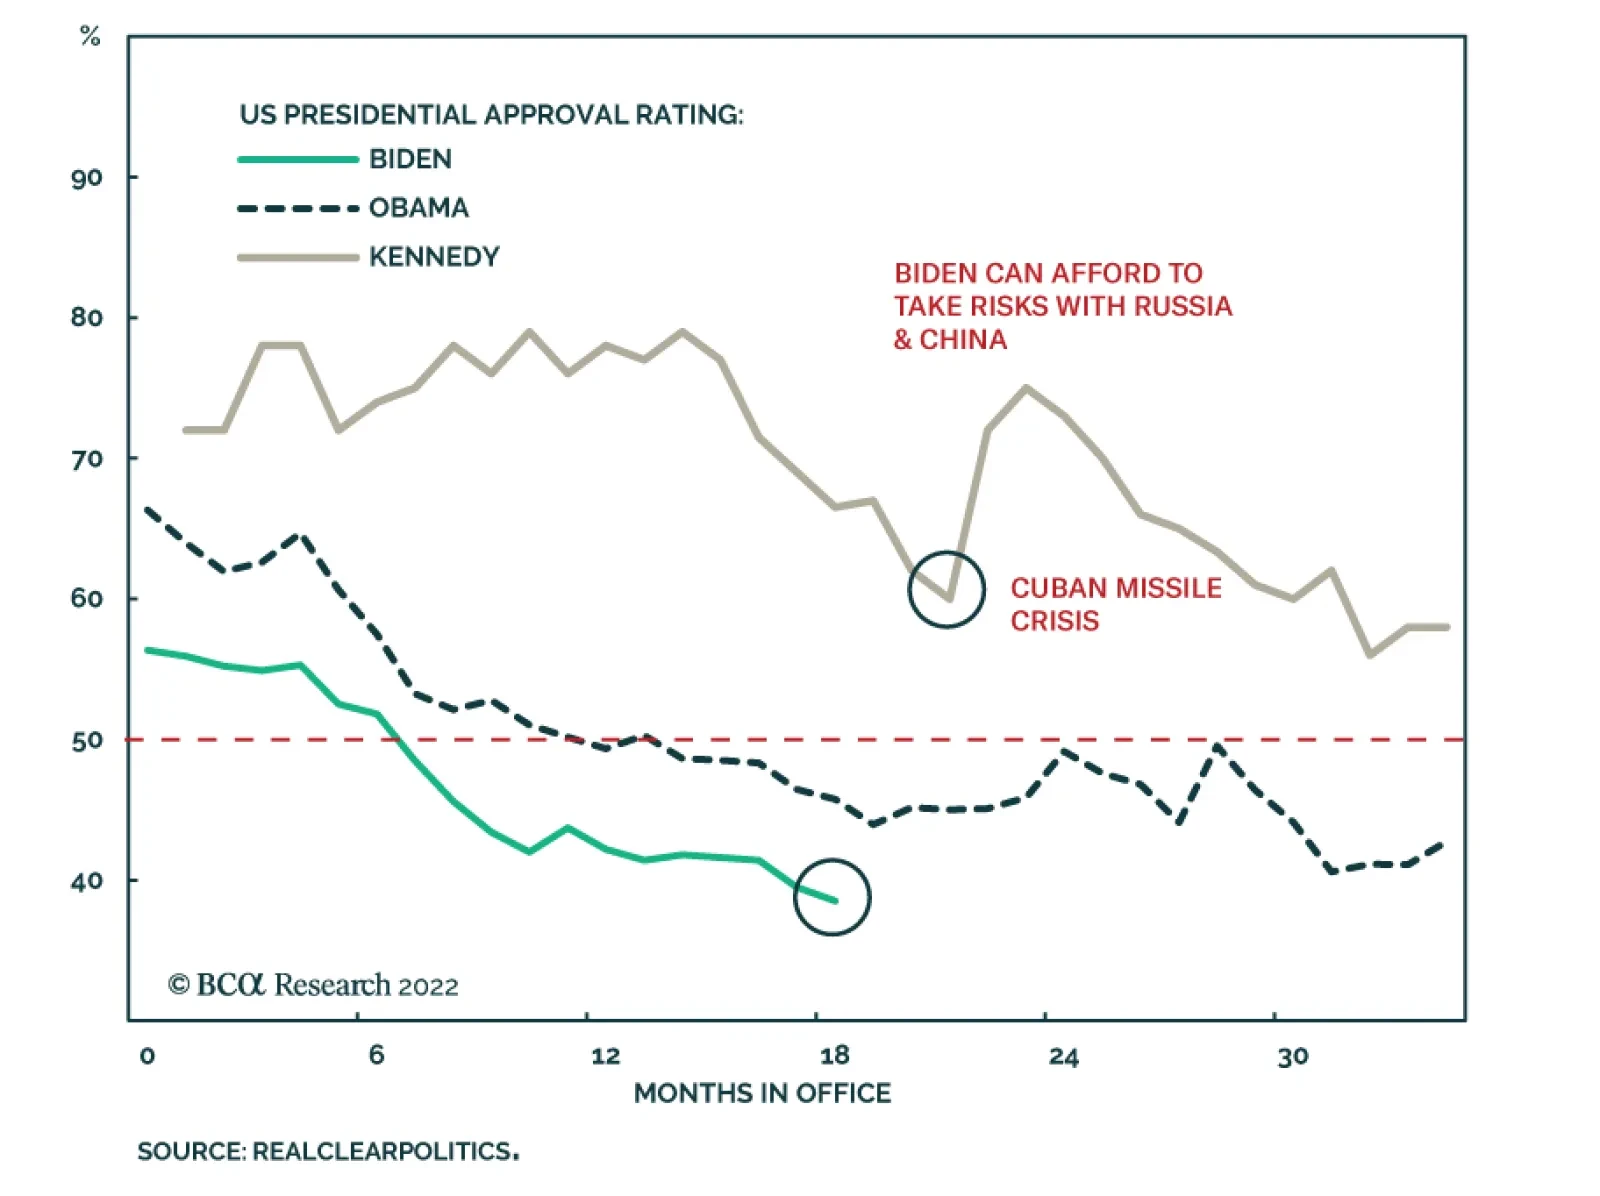
In addition, there are important cyclical reasons why investors should take very seriously the risk of a major geopolitical crisis emanating from Taiwan in the short run: The Covid-19 pandemic intensified US (and global) distrust of China and accelerated the divorce of the US and Chinese economies. It also threw the Chinese economy into a downward spin, threatening Xi Jinping’s personal security and the Communist Party’s regime security. Hypo-globalization reduces critical economic constraints on military conflict. The Ukraine war highlighted the willingness of ambitious strongman regimes to go to war to prevent neighboring countries from allying with the United States. Taiwan is critical to Chinese security just as Ukraine is critical to Russian. Taiwan, like Ukraine, lacks a mutual defense treaty with the US and yet is attempting to create a de facto treaty through political, economic, and military cooperation – a scenario that will incentivize Chinese military action if it ever believes the US will take irrevocable steps to increase its commitment to defend Taiwan. At the same time, the US will try to deter China more effectively, since its deterrence failed in the case of Ukraine, which entails upgrading the Taiwanese relationship. Hence China will feel threatened and accuse the US of altering the status quo. Russo-Chinese alliance prevents US-China reengagement. Russia threw itself into China’s arms by cutting off natural gas to Europe. China cannot reject Russia’s overture because it needs Russia’s alliance to break through American strategic containment in the coming years. China needs Russia’s natural resources and its cooperation in gaining economic access to Central Asia and the Middle East. The US cannot pursue strategic détente with China if China is allying with Russia, since a Russo-Chinese alliance poses an unprecedented threat to American global influence and security (Chart 4). The Democratic Party is desperate to mitigate looming election losses. President Biden’s approval rating has fallen to 39%, while headline inflation hits 9% and the economy slips into a technical recession. The Republican Party is lined up for a victory in the midterm elections, yet Democrats view the populist Republicans as an existential threat. Hence Biden and Democratic leaders like Pelosi are willing to take significant risks to salvage the election, including provoking foreign rivals. The administration is contemplating tougher export controls on China’s access to semiconductor manufacturing equipment and Congress is passing bipartisan legislation to make the US more competitive against China. Any major confrontation abroad would generate a patriotic rally among voters, as did the Cuban Missile Crisis in 1962, which saved the Democrats from heavy losses in the midterms that year (Chart 5). China’s domestic politics support a foreign confrontation. As Xi attempts to cement another five-to-ten years in power at the twentieth national party congress this fall, the pandemic restrictions, political repression, property bust, and economic slowdown ensure that he has little good news to celebrate at home. He could benefit from taking an aggressive stance against the imperialist Americans over Taiwan – and he cannot afford to back down or lose face. Ultimately China’s regime legitimacy is at stake in Taiwan so it is willing to take greater risks than the United States. Chart 4US Cannot Engage With Russo-Chinese Behemoth
US Cannot Engage With Russo-Chinese Behemoth
US Cannot Engage With Russo-Chinese Behemoth
Chart 5Biden Can Take Risks Ahead Of Midterms
The Fourth Taiwan Strait Crisis
The Fourth Taiwan Strait Crisis
All of the above demonstrates that investors should not be complacent but should take risk off the table until the Pelosi trip blows over. A major diplomatic or geopolitical crisis will occur if Pelosi indeed visits Taiwan, for China will be required to react to uphold the credibility of its warnings, and Beijing will have a national and political interest in overreacting rather than underreacting. The Americans will then have a national and political interest in preserving their own credibility. This dynamic could lead to a major escalation in strategic tensions. Could a crisis lead to full-scale war? Yes it could but most likely it will not – at least not yet. Here are some important limitations, which investors should monitor closely. If these are reduced or overcome, then a larger conflict becomes more probable: Taiwan is harder to invade than Ukraine. Taiwan is an island and islands that are politically unified can only be subdued with enormous cost of blood and treasure even by the most powerful armies. Taiwan is critical to the global economy, unlike Ukraine. While it lacks defense treaties, it has stronger strategic partnerships than Ukraine did. The Chinese military has not fought an expeditionary war since Vietnam in 1979. The US sent aircraft carriers to the Taiwan Strait in each of the previous three crises since the 1950s, signaling that it is willing to defend Taiwan, and currently has at least two aircraft carriers in Asia Pacific (Map 1). China needs to be prepared for potential American and Japanese intervention if it is to attack Taiwan, which requires an advanced triad of nuclear arms. Map 1US Aircraft Carriers Suggest Taiwan Risk Is Substantial
The Fourth Taiwan Strait Crisis
The Fourth Taiwan Strait Crisis
The US is not sending any game-changing offensive weapon systems. Instead the US is sending a mere politician. China opposes anything resembling state-to-state relations but Taiwan’s defensive capability would not be improved. Hence China would not be forced to take aggressive military action. Instead China is attempting to set a very low bar for intervening in US-Taiwan political relations. Beijing can intervene in a way that enforces the new line but remains beneath the threshold of war. Going forward, US arms sales to Taiwan will be a much riskier affair and the delivery of a weapons system could trigger conflict (Chart 6). Chinese economy is not (yet) beyond help. China still has authoritarian powers to manipulate the domestic economy, suggesting that policy makers will intervene to slow down the property bust and stimulate activity. After Xi Jinping consolidates power, we expect a pro-growth strategy to be unveiled that will lead to a stabilization of growth in 2023. This is necessary for Xi to maintain domestic stability, which is existential to the regime and its long-term security. If stimulus and interventions fail utterly and China collapses into a full-blown financial crisis, then China will lose the ability to improve its security over the long run and the risk of conflict with foreign powers will rise. But as long as China’s economy is not collapsing, China maintains the prospect of building its influence and power over time and conquering Taiwan through absorption rather than extremely risky armed conflict (Chart 7). Chart 6US Arms Sales Could Trigger A Real Conflict
US Arms Sales Could Trigger A Real Conflict
US Arms Sales Could Trigger A Real Conflict
Chart 7More Economic Stimulus Is Coming
More Economic Stimulus Is Coming
More Economic Stimulus Is Coming
Taiwan is not moving toward formal independence. The Tsai Ing-wen administration is nominally in favor of independence but has chosen rhetorical sleight of hand over any formal change to Taiwan’s status. Taiwanese people support the status quo knowing that they will live in a war zone if they declare independence. The long-term problem stems from the fact that a clear majority opposes unification with the mainland (Chart 8). Taiwan and the US face elections in 2022 and 2024. If the Kuomintang stages a comeback in Taiwanese politics, or the Democrats win reelection in 2024, then China still has the ability to pursue its aims through diplomacy. Whereas if the Democratic Progressive Party remains in full control of Taiwan, and the Republicans regain the White House, Beijing may conclude that little can be gained through diplomacy. Especially if these US and Taiwanese parties proceed to press their interests aggressively. Chart 8Taiwanese Not Declaring Independence
The Fourth Taiwan Strait Crisis
The Fourth Taiwan Strait Crisis
Hence the most likely outcome if Pelosi visits Taiwan is a US-China geopolitical crisis of some sort but not a full-scale war. A crisis short of war could establish a new set of red lines over Taiwan that could govern the US-China relationship in the medium term with reduced uncertainty. But it would bring very bad news in the short run and lead to a permanent deterioration in US-China relations and global stability over the long run, which markets must price first. Bottom Line: Tactically investors should prefer government bonds to equities, US equities to global, defensive sectors to cyclicals, and safe havens to risky assets. Stay short Chinese and Taiwanese currencies and assets. While semiconductor stocks stand at risk, investors should favor US semiconductor companies over Chinese and Taiwanese (Chart 9). Chart 9Investors Should Seek Safe Havens
Investors Should Seek Safe Havens
Investors Should Seek Safe Havens
Matt Gertken Chief Geopolitical Strategist mattg@bcaresearch.com Strategic Themes Open Tactical Positions (0-6 Months) Open Cyclical Recommendations (6-18 Months) Regional Geopolitical Risk Matrix
Dear Client, On Monday August 8, I will be sending you an abbreviated version of our monthly Chart Pack. Our regular publication will resume on August 15. Kind regards, Irene Tunkel Executive Summary The US Is Vulnerable: Only 10% Of Chips Are Manufactured At Home
What To Do With Semiconductors And The Energy Sector
What To Do With Semiconductors And The Energy Sector
In the following report we continue answering questions from our “Bear Market 2.0” webcast, by reviewing recent US legislative actions, and their effects on semiconductor and energy stocks. Semiconductors Bill: Over the long term, the recently passed CHIPS+ bill will have a moderately positive effect on the supply of chips and will benefit a select group of companies with chip manufacturing capabilities. Semiconductors Overview: Semis are "growthy" and have surged on the back of falling yields. They are also highly cyclical, and slowing growth will become a headwind to performance. Demand for chips is fading, especially in the consumer electronics space, with sales slowing and inventories building up. We prefer more stable growth areas of the Technology sector and are overweight Software and Services as opposed to semis stocks. The bill is not enough to "move the needle". What To Do With Energy? The stars are aligning for the price of energy to turn down decisively – not only is demand for energy flagging on the back of slowing economic growth, but also the Inflation Act will likely further boost energy production. As a result, we downgrade the Exploration & Production segment, maintain our overweight in the Equipment & Services, and boost Storage & Transportation from underweight to neutral on the back of the upcoming new pipeline construction. Bottom Line: We remain underweight semis as the one-off boost from the CHIPS+ bill does not counterbalance demand headwinds. When it comes to Energy, the capex upswing will lower the price of oil which warrants an underweight stance in Exploration & Production names. Feature This week investors experienced a deluge of news and data, spanning the Fed rate decision, the Q2-2022 GDP estimate, and earnings reports from some of the largest US corporations, such as Apple, Amazon, and Facebook. To top it off, we had major developments on the legislation front after a multi-month hiatus. Two major bills, the Chips and Science Act of 2022 (aka CHIPS+) and the Inflation Reduction Act of 2022 (an incarnation of Build Back Better), are close to passage, after months and months of dithering. In this report, we will discuss the potential effects of these pieces of legislation on the two equity sectors most affected, Semiconductors and Energy. Since these sectors are also at the epicenter of recent market action, we hope that this report is timely and will help you make the right investment decisions. Sneak Preview: We maintain our underweight on Semiconductors, and downgrade Energy Exploration and Production to an underweight on the back of falling energy prices. Semiconductors: Is It Time To Close The Underweight? When it comes to semis stocks, the current bear market caused a deeper peak-to-trough correction (40%) than at the bottom of the pandemic, implying that, perhaps, much of the bad news was priced in. We have been underweight semis since early January and are up 14% relative to the S&P 500. With the industry bouncing 20% off its June lows, we question whether we have overstayed our welcome and it is time to close this underweight, especially in light of the imminent passage of the CHIPS+ bill. Let’s start by discussing the bill: Designed In The US, Made In Asia In a November 2021 “Semiconductors: Aren’t They Fab?!” Special Report, we highlighted that semiconductor production is divided among chip designers and manufacturers, a so-called “fabless model,” which has grown in prominence as the pace of innovation made it increasingly difficult for firms to manage both the capital intensity of manufacturing and the high levels of R&D spending for design. The entire semiconductor industry depends on cooperation between two regions: North America, which houses global leaders in designing the most sophisticated chips, and Asia, which is home to companies that have the technology to manufacture them (Charts 1 & 2). As a result, the US share of chip manufacturing has been falling steadily for the past 30 years, from 37% to 10% (Chart 3). Recent, supply chain disruptions and heightening geopolitical tensions have underscored this country’s vulnerability due to outsourcing of chip manufacturing, which led to renewed calls for chip independence and onshoring. Chart 1Chips Are Designed In The US...
What To Do With Semiconductors And The Energy Sector
What To Do With Semiconductors And The Energy Sector
Chart 2...And Manufactured In Asia
What To Do With Semiconductors And The Energy Sector
What To Do With Semiconductors And The Energy Sector
Objective Of The CHIPS+ Bill Congress has passed the CHIPS+ bill to alleviate the chip shortage and shore up US competitiveness with China. Money is earmarked for domestic semiconductor production and research, and factory construction. The bill will provide financial incentives for both US and non-US chip makers to open manufacturing plants in the US while restricting semiconductor companies’ activities “in specific countries that present a national security threat to the United States.” The provision ensures that China, which has also been recently striving for chip independence, will not be a beneficiary of US government funds. The bill also comes with strings attached: It states that it will not allow companies to use any of the funds to buy back stocks or issue dividends. Chart 3The US Is Vulnerable: Only 10% Of Chips Are Manufactured At Home
What To Do With Semiconductors And The Energy Sector
What To Do With Semiconductors And The Energy Sector
Cost Of The Bill Preliminary analysis from the Congressional Budget Office assesses that the bill will trigger roughly $79 billion in new spending over the coming decade. The key provision in the bill is the $52.7 billion for chip makers. Of those funds, $39 billion is earmarked to “build, expand, or modernize domestic facilities” for chip-making, while $11 billion is set aside for research and development. Funds will be spread over five years. The bill also adds $24 billion in tax incentives and other provisions for semiconductor manufacturing. In addition, $2 billion is allocated to translate laboratory advances into military and other applications. While $79 billion sounds like a lot of money, we need to keep things in perspective. As Barron’s pointed out: “According to IC Insights, total semiconductor industry capital spending is estimated to grow 24% this year, to $190 billion. Assuming some growth over the next several years, the bill would be a modest single digit percentage of the aggregate spending over the five-year time period.” Therefore, the financial benefits the bill provides are modest. Key Beneficiaries US chip makers with fab facilities, such as Intel (INTC), Micron Technology (MU), and Texas Instruments (TXN) will be the key beneficiaries of the bill as they are offered financial incentives for opening new plants. Foreign companies, such as TSMC, Samsung, and Global Foundries, might also qualify for financial incentives to open chip production facilities in the US. In fact, Intel, TSMC, and Global Foundries have already announced plans to build plants in the US contingent on the bill’s passing. Fabless chip designers, such as Nvidia (NVDA), AMD, and Qualcomm are unlikely to benefit from the package in a major way. Over the long term, the bill will have a moderately positive effect on the supply of chips and will benefit a select group of companies with chip manufacturing capabilities. Demand For Chips Is Fading While the bill will have some positive effect on chip manufacturing, there is a lurking danger that production is being ramped up globally just at a time when, after prolonged shortages, demand for chips is starting to fade. Historically, this highly cyclical industry has gone through boom and boost cycles every three to four years. During the Q2 earnings call, TSMC Chief Executive Mr. Wei said that the broader industry is dealing with an “inventory correction” that has led customers to cut orders from some of its peers. After two years of pandemic-driven demand, “our expectation is for the excess inventory in the semiconductor supply chain to take a few quarters to rebalance to a healthier level.” This is not surprising. Semiconductors are highly economically sensitive with sales declining in lockstep with slowing global growth (Chart 4), while inventory levels are picking up (Chart 5). Chart 4Sales Are Declining In Lockstep With Slowing Global Growth
Sales Are Declining In Lockstep With Slowing Global Growth
Sales Are Declining In Lockstep With Slowing Global Growth
Chart 5Chip Inventory Levels Are Picking Up
Chip Inventory Levels Are Picking Up
Chip Inventory Levels Are Picking Up
Demand for two of the industry’s key markets, computers and mobile phones, which account for 50% of the overall chip demand, seems to be deteriorating rapidly amid the slowing global economy. Demand for consumer electronics is fading after a pandemic surge of buying, when consumers pulled forward their spending on phones and computers. Most of these items don’t need to be upgraded or replaced for years. COVID-related lockdowns in China, meanwhile, have also weighed on consumer demand. According to IDC, worldwide shipments of personal computers fell 15% in the June quarter from a year earlier, due to “macroeconomic headwinds.” IDC has also lowered its forecast for 2022 expecting computer shipments to retreat by 8.2%. Canalys said global shipments for mobile phones fell 9% year over year, following economic headwinds, sluggish demand, and inventory pile-up. Memory chips represent 28% of the industry, and DRAM accounts represent three-fifths of memory sales. DRAM prices are falling (Chart 6). According to TrendForce, the average contract price for a DRAM, used widely in consumer items ranging from cars to phones to fridges, fell by 10.6% during the second quarter, compared to a year ago, the first such decline in two years. DRAM prices are expected to slide by 21% in Q3-2022. Companies are telling us similar stories: Micron, the No. 3 player in memory, recently issued revenue guidance well below analysts’ estimates. Chief Executive Sanjay Mehrotra warned that “the industry demand environment has weakened,” with PC and smartphone sales declining. Lisa Su, Chief Executive of AMD, expects computer demand to be roughly flat. Nvidia is bracing for a slowdown in the crypto space and game consoles. Intel has reported disappointing results: PC customers are reducing inventory levels at a rate not seen in a decade, Chief Executive Pat Gelsinger said in a call with analysts. PC makers typically reduce inventory levels of chips when they are expecting lower sales. Chart 6DRAM Prices Are Falling
DRAM Prices Are Falling
DRAM Prices Are Falling
Of course, there is significant variability in demand for chips across sectors: While demand for phones and computers is fading, there is still pent-up demand for auto chips, and servers (Chart 7). According to Ms. Su, demand remains hot for chips used in high-performance computers and servers. TSMC, which has Apple and Nvidia among its clients, seconds this notion: Quarterly revenue for high-performance computers, increased 13% from the previous quarter and was greater than the revenue from smartphones, which rose 3%. There are also significant shortages of less-advanced auto chips (Chart 8). In a recent Q2 earnings call, GM reported that it carries 95,000 unfinished cars in its inventory due to the auto chip shortage. According to Mr. Wei of TSMC, the company will continue investing in auto chips, a product that historically it didn’t emphasize as much as its cutting-edge chips, in response to strong demand. Texas Instruments, which reported stellar results, also said that while it saw strength in the auto and industrial segments, demand from the consumer electronics market remained weak in both the second quarter and the current quarter. Chart 7Demand For Servers Is Still Strong
Demand For Servers Is Still Strong
Demand For Servers Is Still Strong
Chart 8More Chips Will Boost Auto Sales
More Chips Will Boost Auto Sales
More Chips Will Boost Auto Sales
Demand for chips is fading, especially in the consumer electronics space, with sales slowing and inventories building up. Pricing power is also fading. However, there are still areas immune to the downturn, such as chips for servers, high-performance computers, and less advanced auto chips. Valuations and Fundamentals Earnings growth expectations have also come down significantly off their peak, and are currently at 5% for the next 12 months, which indicates negative real growth (Chart 9). Chart 9Earnings Growth Is Slowing
Earnings Growth Is Slowing
Earnings Growth Is Slowing
Chart 10Valuations Are Above Pre-Pandemic Trough
Valuations Are Above Pre-Pandemic Trough
Valuations Are Above Pre-Pandemic Trough
Semi valuations have pulled back from a 33x trailing multiple to 17x over the course of six months, only to bounce back another 3x since June 16, currently trading at 20x multiple. While valuations certainly moderated, they are still above the pre-pandemic trough in 2019 when the global economy was also slowing. The BCA Valuation Indicator, an amalgamation of various valuation metrics, indicates that semiconductors trade at fair value (Chart 10 & Chart 11). The rebound rally was fast and furious; at nearly 20% off market lows, it feels like much of the recovery from severely oversold conditions has run its course. Chart 11Chips Are Moderately Priced, While Investor Position Is Light
Chips Are Moderately Priced, While Investor Position Is Light
Chips Are Moderately Priced, While Investor Position Is Light
Semis Investment Implications Semiconductors are somewhat unique in that they are both cyclical and “growthy” (Chart 12). Since semis are “growthy,” the past six-week rebound may be attributed to falling rates, which have led to multiple expansion of most growth sectors. However, we need to keep in mind that rates have stabilized because of signs of global slowdown, and that the cyclical nature of semis will get in the way of further outperformance. While we also believe that the CHIPS+ bill is a modest tailwind, it is hard to commit to an industry in the early innings of contraction. For investors who would like to top up their allocations to semis, we recommend companies most exposed to demand from industrial sectors (autos, servers, high performance computers), and staying away from companies most exposed to consumer electronics. Much of the performance of companies that have reported so far hinged on their product mix. Chart 12Semis Are Both "Growthy" And Cyclical
Semis Are Both "Growthy" And Cyclical
Semis Are Both "Growthy" And Cyclical
Bottom Line We are reluctant to add to semis after the sector gained nearly 20% in just six weeks. Economic challenges remain – demand for chips is slowing, and the process of clearing inventory build-up may take several quarters. CHIPS+ is a positive but, in our opinion, is not enough to move the needle. We prefer more stable growth areas of the Technology sector and are overweight Software and Services. We also prefer semis most exposed to demand from non-consumer sectors. What To Do With Energy? We are currently equal-weight Energy. More specifically, we are overweight Energy Equipment and Services, equal weight Explorations and Production (we closed an overweight in March, booking a profit of 50%), and underweight Energy Transportation industry groups. With Brent down 18% and GSCI down 15%, and economic growth slowing, it is essential to review what is in store for the sector. Further, the Inflation Reduction Act, which is now on President Biden desk expecting his signature, has quite a few provisions relevant to the sector. Inflation Reduction Act And Its Effects On The Fossil Fuels Industry This bill is a true marvel of political negotiation and gives all parties something to be happy about and something to complain about. While the bill earmarks $370 billion for clean energy spending at the insistence of Senator Manchin (D, WV), the legislative package provides support for traditional sources of energy like oil, gas, and coal. Broadly speaking, the bill is a positive for expanding domestic energy production and supporting its nascent Capex cycle, which we called for in the “Energy: After Seven Lean Years” Special Report. Development of new wells has already picked up over the past few months (Chart 13). Chart 13New Energy CAPEX Cycle
New Energy CAPEX Cycle
New Energy CAPEX Cycle
Here are a few important rules stipulated by the bill, highlighted by the Wall Street Journal: Expanding offshore wind and solar power development on federal land will now require the federal government to offer more access for drilling on federal territory. Under the bill, the Interior Department would be required to offer up at least two million acres of federal land and 60 million acres of offshore acreage to oil and gas producers every year for the next decade. It would be the first-ever required minimum acreage for offshore oil and gas leasing and would significantly increase the acreage requirements for onshore leasing. The bill would also effectively reinstate an 80-million-acre sale of the Gulf of Mexico to the oil drillers last year that a federal judge had invalidated. The bill is also a major positive for the natural gas industry, providing an accelerated timeline for building the pipelines and terminals needed to increase production and export of fossil fuels. In exchange for access to more federal territory, oil and gas companies would also have to pay higher royalty rates for drilling there. It would also require them to pay royalties on methane they burn off or let intentionally escape from their operations on federal lands. The bill aims to increase the supply of oil, gas, and coal, and return the US towards energy independence. Over the medium term, it should lead to a normalization of the price of energy. Demand Vs. Supply Naturally, the price of oil is all about supply and demand. And the performance of the energy sector is inextricably linked to the price of oil (Chart 14). Supply: According to our EM Strategist, Arthur Budaghyan, “fears that sanctions on Russia will considerably reduce global oil supply have not yet materialized.” According to International Energy Agency (IEA) estimates, Russia’s shipments of crude and oil products have declined by only about 5% since January (Chart 15). Clearly, despite the sanctions and logistical challenges that Western governments have enforced on Russia, the country’s oil exports have not collapsed. Chart 14Price Of Oil Is Important For The Energy Sector's Profitability
Price Of Oil Is Important For The Energy Sector's Profitability
Price Of Oil Is Important For The Energy Sector's Profitability
Chart 15Russia's Supply Of Oil Has Decreased By Only 5%
Russia's Supply Of Oil Has Decreased By Only 5%
Russia's Supply Of Oil Has Decreased By Only 5%
Demand: Meanwhile, global commodities and energy demand is downshifting in response to both high fuel prices and weakening global growth. US consumption of gasoline and other motor fuel has marginally contracted (Chart 16, top panel). In China, rolling lockdowns and weak income growth will continue to suppress the nation’s crude oil imports, which have already been depressed over the past 12 months (Chart 16, bottom panel). In the rest of EM (excluding China), a strong dollar and high oil prices are leading to demand destruction. Chart 16US And Chinese Oil Consumption Is Weak
US And Chinese Oil Consumption Is Weak
US And Chinese Oil Consumption Is Weak
Prices Are To Trend Down: Hence, the supply of energy and commodities is stable, but demand is flagging, which does not bode well for the prices of energy and materials. Odds are that oil prices will decline further and recouple with industrial and precious metal prices. In addition, as the market anticipates a turn in inflation, there is a pronounced rotation away from Energy and Materials towards Technology and other growth pockets of the market (Charts 17 & 18). With a supply of energy staying steady or even expanding, while demand is slowing on the back of the global slowdown, we expect the price of energy to trend down. Chart 17Energy And Materials Were Biggest Winners In the "Inflation High And Rising" Regime...
What To Do With Semiconductors And The Energy Sector
What To Do With Semiconductors And The Energy Sector
Chart 18...But They Gave Back Their Gains In "Inflation High But Falling" Regime
What To Do With Semiconductors And The Energy Sector
What To Do With Semiconductors And The Energy Sector
Energy Investment Implications It appears that the stars are aligning for the price of energy to turn down decisively – not only is demand for energy flagging on the back of slowing economic growth, but also the Inflation Act will likely further boost energy production. As production is expanded and prices fall, the profitability of the Oil Exploration and Production industry (upstream) will decline. In addition, inflation is about to turn, and a change in market leadership has already ensued. We downgrade Exploration and Production to an underweight. In the meantime, the Equipment and Services industry will benefit from contracts to develop new wells and will thrive. We maintain an overweight. We are currently underweight the Energy Storage and Transportation industry (mid-stream) as historically, this industry was marred in multiple regulations and most expansion projects faced obstacles, especially if running through public land. However, under the provisions of the Inflation Act, midstream will benefit from rising production volumes and expedited construction the pipelines and terminals needed to increase production and exports of fossil fuels. We upgrade Storage and Transportation to an equal weight. Bottom Line The Inflation Reduction Act will create conditions favorable for expanding the production of fossil fuels and will support US energy independence. As supply grows while demand is slowing, the price of energy is likely to turn – while a boon for US consumers, this is a headwind to the performance of the Energy sector. Irene Tunkel Chief Strategist, US Equity Strategy irene.tunkel@bcaresearch.com Recommended Allocation
Executive Summary Reporters at last week’s post-FOMC press conference were consumed by the prospect of a recession. Their questions about the economy echoed the analysts’ on bank earnings calls and Chair Powell’s answers echoed the CEOs’ and the CFOs’: while it has clearly slowed, it remains stronger than it would be in a recession. Although the Econ 101 definition of a recession – two or more quarters of contracting real GDP – is embedded in the public’s mind, the NBER’s recession criteria are more involved and do not appear as if they have yet been met. With a little over half of index constituents (~70% of market cap) having reported, S&P 500 earnings have surprised to the upside. Despite a rampaging dollar and a sharp backup in corporate bond yields, margins are down less than 60 basis points from 2Q21 and are unchanged from 1Q22. We are constructive on equities and credit over a three-to-twelve-month timeframe because we believe markets have priced in the impact of the next recession too soon. We expect the Fed will eventually induce a recession, but not for at least another year. Earnings Haven't Stumbled Yet
Earnings Have Not Stumbled Yet
Earnings Have Not Stumbled Yet
Bottom Line: Continue to overweight equities in multi-asset portfolios with a twelve-month timeframe because markets have gotten ahead of themselves by selling off so sharply. A recession will not arrive before underweight investors judged on their relative quarterly performance are forced back into stocks. Feature And we thought investors were preoccupied with recession. The questions sell-side analysts asked on big bank earnings calls in mid-July revealed that the shadow of a recession loomed large in their institutional investor clients’ minds. The questions markets and economics reporters asked Chair Powell at his post-FOMC meeting press conference last week demonstrated that the media is positively obsessed with it. If it bleeds, it leads is no longer just the local TV newscast’s mantra. We have been trying to steer the discussion away from are-we-or-aren’t-we toward questions that we think are more productive for investors. How bad will the next downturn be? What is its current estimated time of arrival? Have markets under or overreacted to our best guess about severity and ETA, assuming the marginal price setter has a timeframe of twelve months or less? Are-we-or-aren’t-we is manifestly Topic A in the financial and general media, however, so the body of this week’s report is given over to why we think we are neither in a recession nor on the cusp of one. We will turn to financial markets and investment strategy in the concluding section. What Is A Recession? In Econ 101 three-plus decades ago, I learned that a recession was defined as back-to-back quarters of economic contraction as measured by real GDP. For all the time that has passed since, I remember that definition clearly. Apparently other graduates do, too, and the definition taught in central Virginia was the standard in Economics departments across the nation. Alas, life is more complicated than it seemed in those halcyon student days. Business cycle inflections are not always apparent to the naked eye and the NBER’s Business Cycle Dating Committee has been tasked with assessing when downturns are sufficiently deep, diffuse and persistent to constitute a recession. The committee monitors a broad range of indicators and moves deliberately, announcing its determinations only after enough subsequent data have arrived to support its assessment of peaks and troughs. For the six recessions since 1980, the committee has announced cycle peaks with an average lag of seven months and cycle troughs with an average lag of fifteen months (Table 1). Table 1Long And Variable Lags
Recession Obsession
Recession Obsession
Equity and credit portfolio managers and analysts spend a lot more time on corporate earnings than GDP, so the recession debate would seem to be of interest mainly within the ivory towers of academia, think tanks and the bureaucracy. The topic is relevant for investors, however, because equity bear markets tend to coincide with recessions. As bear markets (Chart 1, light red shading) typically begin before NBER-designated recessions (gray shading) and always end before them, it is worth investors’ time to try to anticipate their onset. Since a significant portion of bear market drawdowns occur after the recession is deemed to have started, there is also value in the humbler (and more attainable) aim of recognizing a recession once it’s begun. Chart 1Bear Markets And Recessions Tend To Travel Together
Bear Markets And Recessions Tend To Travel Together
Bear Markets And Recessions Tend To Travel Together
So Has It Begun? At the risk of sounding like Jay Powell before a skeptical pool of reporters, we do not think the economy is in a recession, primarily because the labor market is so strong. Recessions always follow one-third percentage-point increases in the three-month moving average of the unemployment rate, but it has yet to begin moving upward (Chart 2). Leading indicators like small business hiring intentions (Chart 3, second panel), temporary employment (Chart 3, third panel) and initial jobless claims (Chart 3, bottom panel) point to continued payroll expansion (Chart 3, top panel). The economy is unquestionably slowing, and labor demand will slow with it, but the record backlog of job openings (Chart 4, top panel) and unabated stream of job quits (Chart 4, bottom panel) suggest that the labor market has a sizable cushion that will allow it to endure a few blows. Chart 2Unemployment Has Not Turned Yet
Unemployment Has Not Turned Yet
Unemployment Has Not Turned Yet
Chart 3The Employment Outlook Is Still Good ...
The Employment Outlook Is Still Good ...
The Employment Outlook Is Still Good ...
Chart 4... As There Is Still A Shortage Of Workers
... As There Is Still A Shortage Of Workers
... As There Is Still A Shortage Of Workers
Like Chair Powell, we would venture that the labor market’s cushion extends to the overall economy. We believe that households’ excess pandemic savings will buffer the largest component of aggregate demand from inflation pressures, though the eventual fate of those savings is hotly debated within BCA. Related Report US Investment StrategyA Difference Of Opinion We expect that a meaningful share of the $2 trillion-plus that households have amassed will eventually be spent; our Counterpoint team does not. The matter is not yet settled, but we are encouraged that the savings rate dipped below its February 2020 level of 8.3% in the fourth quarter and has been less than 6% every month this year, reaching a low of 5.1% in June. If the savings rate is mean-reverting, and if households don’t circle the wagons en masse as they might if recession prophecies become self-fulfilling, households have quite a bit of catching up to do (Chart 5). If consumption continues to lead business investment in line with the empirical record, fixed investment should be able to keep its head above water. Even a downshift in consumption and investment ought to be enough to offset the modest fiscal drag that may ensue if gridlock becomes even more constraining after November’s elections, as our US Political Strategy colleagues expect, and keep the expansion going for a few more quarters. Chart 5These Squirrels Have Stored Up A Lot Of Nuts For The Winter
These Squirrels Have Stored Up A Lot Of Nuts For The Winter
These Squirrels Have Stored Up A Lot Of Nuts For The Winter
Okay, But What About Earnings? S&P 500 earnings are where the rubber meets the road for investors. Befitting the one-step-forward, one-step-back course the macro data releases have followed, second quarter earnings have been mixed.1 In the aggregate, however, they’ve been solid, with the 56% of index constituents (~70% of market cap) that have reported so far beating earnings expectations by 5.2%. That’s in line with the typical underpromise-and-overdeliver earnings season theater but feels like a reprieve for investors who’ve been subjected to a steady drumbeat of recession talk. Profit margins have narrowed – earnings per share have grown 7.7% year over year, well shy of revenue per share’s 12.1% growth – but by less than expected, as the 5.2% earnings surprise has swamped the 1.6% revenue surprise. S&P 500 operating profit margins observed a tight range after the crisis before jumping by more than a percentage point when the top marginal corporate tax rate was lowered beginning in 2018 (Chart 6). They then made another percentage-point leap in 2021, as companies seemed to find another efficiency gear as they adjusted to the pandemic. The reasons for the pandemic leap aren’t clear – shrinking office footprints, lower utility bills and reduced travel and entertainment don’t seem like candidates to move the needle so far on their own – but according to Refinitiv, the owner of I/B/E/S, the definitive source for earnings estimates, it has persisted through the first two quarters of 2022.2 The contraction in real compensation since 2021 (Chart 7, second panel) has likely been the primary driver, but the backup in corporate bond yields (Chart 7, third panel) and the surging dollar (Chart 7, bottom panel) have been margin headwinds so far this year. Chart 6Profit Margins Remain Elevated
Profit Margins Remain Elevated
Profit Margins Remain Elevated
Chart 7Falling Real Wages Have Been Great For Margins
Falling Real Wages Have Been Great For Margins
Falling Real Wages Have Been Great For Margins
We expect that the interest expense and currency translation headwinds will largely disappear in the second half, leaving real wages as the critical swing factor. Our benign take on wages (from employers’ perspective) is not unanimously held within BCA and could be a crucial determinant of our more bullish recommendations’ outcome. Our view is predicated on an analysis of US labor relations history positing that employers have achieved formidable structural advantages over employees that cannot be unwound by a few years of a cyclical boost and one term of the determinedly labor-friendly Biden administration. Our interpretation runs counter to the prevailing view but we believe it is well supported and can provide a lengthy source bibliography for those inclined to check our work. Investment Implications There are no absolutes in financial markets. No asset is good or bad in itself; its merit is solely a function of its relative probability-adjusted risk-reward profile. The recession debate doesn’t matter much in itself; the key is whether this year’s market declines have gone too far in pricing in the severity, breadth, duration and proximity of the next downturn. We add proximity to the list of the NBER’s criteria because it is a critically important factor when most professional money managers, who exert outsize influence in setting prices, are judged on their relative quarterly and annual performance. We are not perma-bulls or attention-seekers. We are more bullish than our colleagues and the investor consensus purely because we think the equity market has gone too far in discounting the impact of a recession that we estimate will not begin before the second half of 2023 and may not be particularly deep in the absence of imbalances that make the real economy vulnerable to a metastasizing downturn. Inflation pressures have not been building unopposed across four presidencies (LBJ through Carter) while corporate management teams nearly indifferent to shareholder interests rolled over at the feet of the UAW and other formerly potent labor unions, entrenching the wage-price spiral. The Powell Fed has begun to hike the funds rate aggressively, but it will not have to smother the economy like the Volcker Fed to round up a fugitive inflation genie and force it back into the bottle. Chart 8It Is Not A Spiral When Prices Rout Wages
It Is Not A Spiral When Prices Rout Wages
It Is Not A Spiral When Prices Rout Wages
Levered capital has not been cascading into commercial real estate for better than a decade to exploit tax loopholes which were closed by the 1986 Tax Act, leaving savings and loans holding the bag and imperiling a sizable swath of the banking system. Stocks are expensive and there are plenty of pockets of silliness, but financial markets have not replayed the dot-com mania, no matter how promiscuously the term "bubble" is applied or how thoroughly the post-crisis rise in asset values has driven Austrian School devotees up the wall. Malinvestment has not occurred on anything close to the scale of the subprime crisis, when lenders, ratings agencies, regulators, banks and investors collectively failed at their duties, spawning a global crisis. American households have modest debt loads and a mountain of savings. Nonfinancial corporations are well heeled after a frenzy of pandemic debt issuance at laughably favorable terms. The banking system is doubly and triply reinforced with the biggest banks hemmed in by excessive capital requirements and stifling risk limits. The economy is likely to be on a better footing at the start of the next recession than it has been in any of the recessions of the previous 40 years (ex-the flash COVID recession). Although he wouldn’t answer the question directly, we thought Chair Powell made it abundantly clear that the Fed is willing to induce a recession if that’s what it takes to bring inflation to heel. We ultimately think the Fed will have to squash the economy to get inflation back down to its 2% target, but we don’t think it will happen over the timeframe that matters to the institutional investor constituencies that have a huge say in setting marginal prices. That view is at risk if inflation does not show signs of peaking soon or if longer-run inflation expectations rise to uncomfortable levels. For now, neither has happened and the latest run of data did not break one way or the other. Final July long-run inflation expectations of 2.9% from the University of Michigan consumer sentiment survey were down from June’s final 3.1% reading and meaningfully below the 3.3% preliminary June false alarm that jarred the FOMC. The second quarter employment cost index grew by more than 1% for the fourth straight quarter, extending its nominal rise (Chart 8, top panel) even while it continues to contract in real terms (Chart 8, bottom panel). A growth shortfall is a threat as well, though it failed to materialize in second quarter earnings, forcing the S&P 500 to unwind some of the weak growth expectations it had already discounted. If our base-case scenario holds, more such unwinding is in store. Doug Peta, CFA Chief US Investment Strategist dougp@bcaresearch.com Footnotes 1 As we worked on this report after Thursday’s market close, Amazon delighted investors, Apple pleased them and Intel, as per a barrons.com headline, “missed by a mile.” 2 Per Standard & Poor’s, the index’s operating margin fell by a percentage point in the first quarter. Though S&P has tended to define operating earnings less favorably than Refinitiv/I/B/E/S, the two series moved together directionally until 1Q22 and only Refinitiv’s data facilitates comparisons between past results and future expectations.
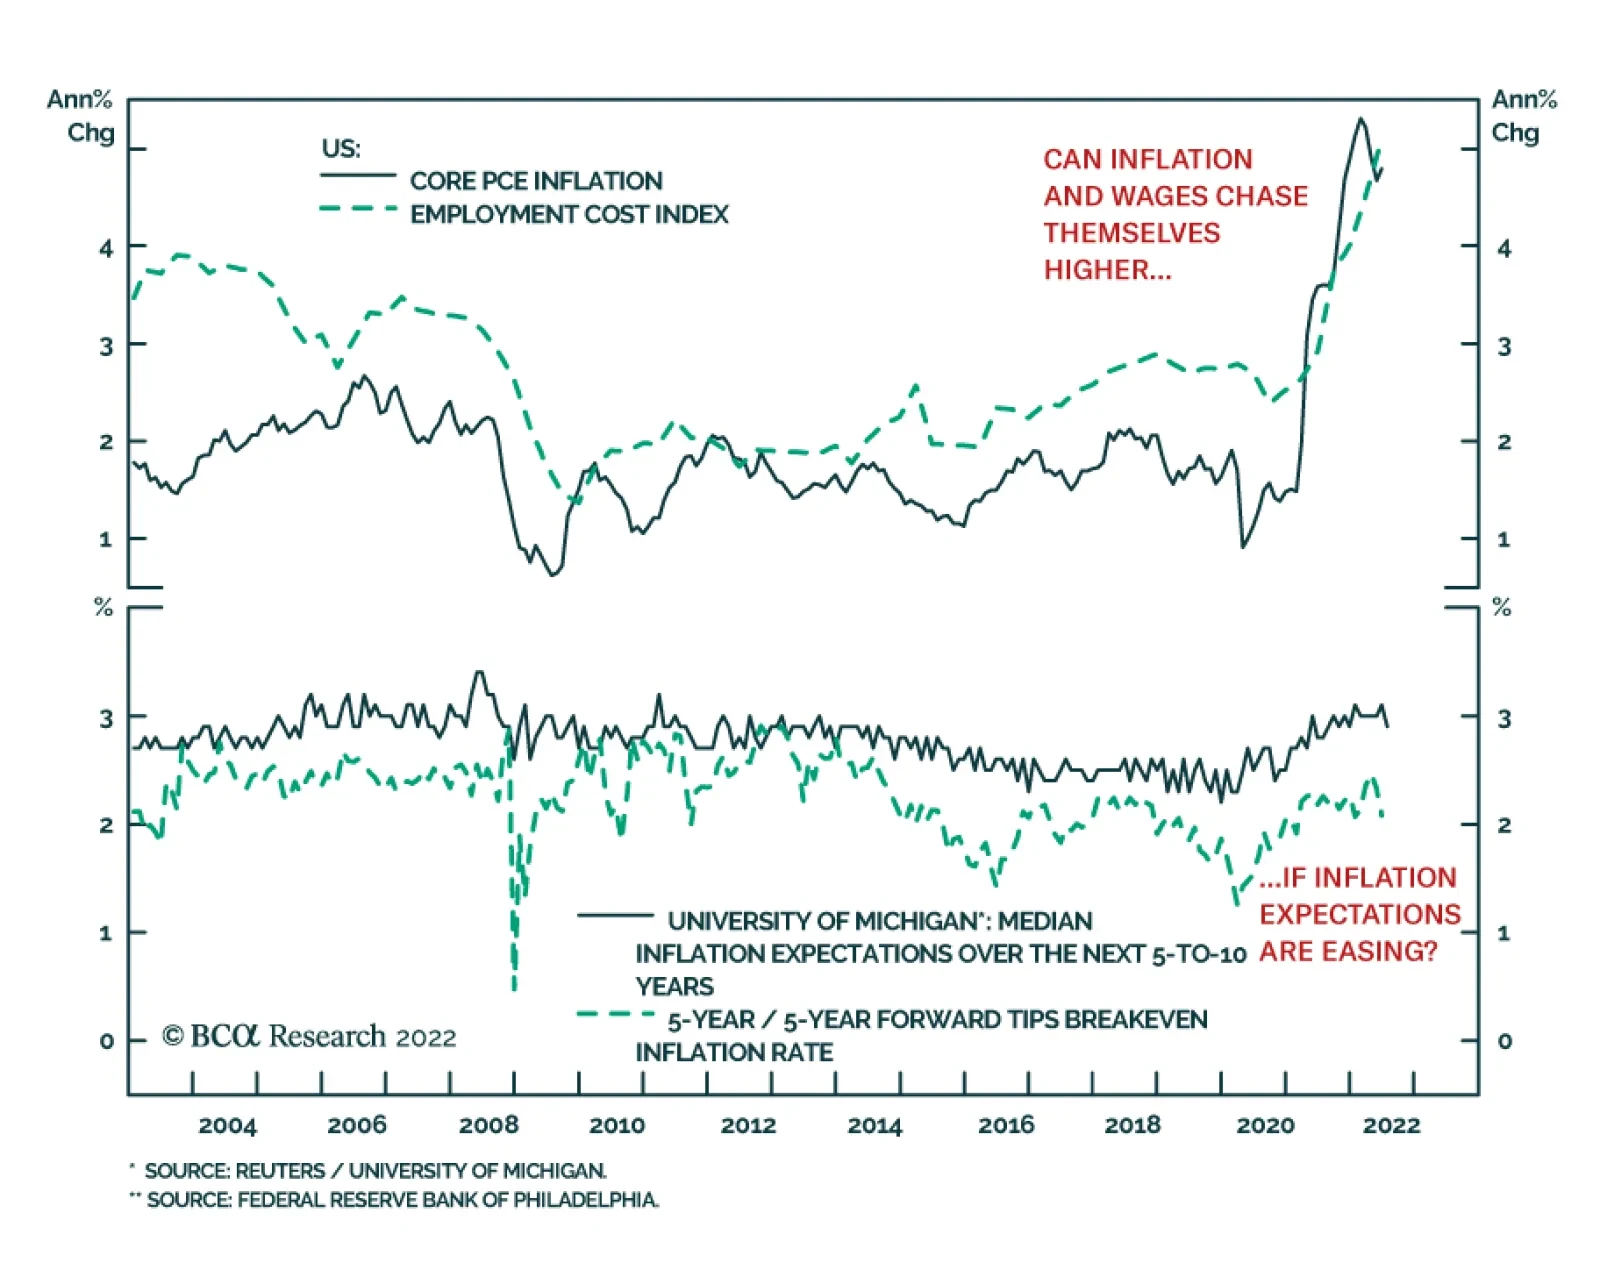
Both the employment cost index (ECI) and the PCE deflator beat expectations on Friday and came in on the strong side. The ECI accelerated to 5.1% y/y in Q2 from 4.5% y/y in Q1. The core PCE deflator, the Fed’s favored inflation gauge, rose from 4.7% to 4.8%…