United States
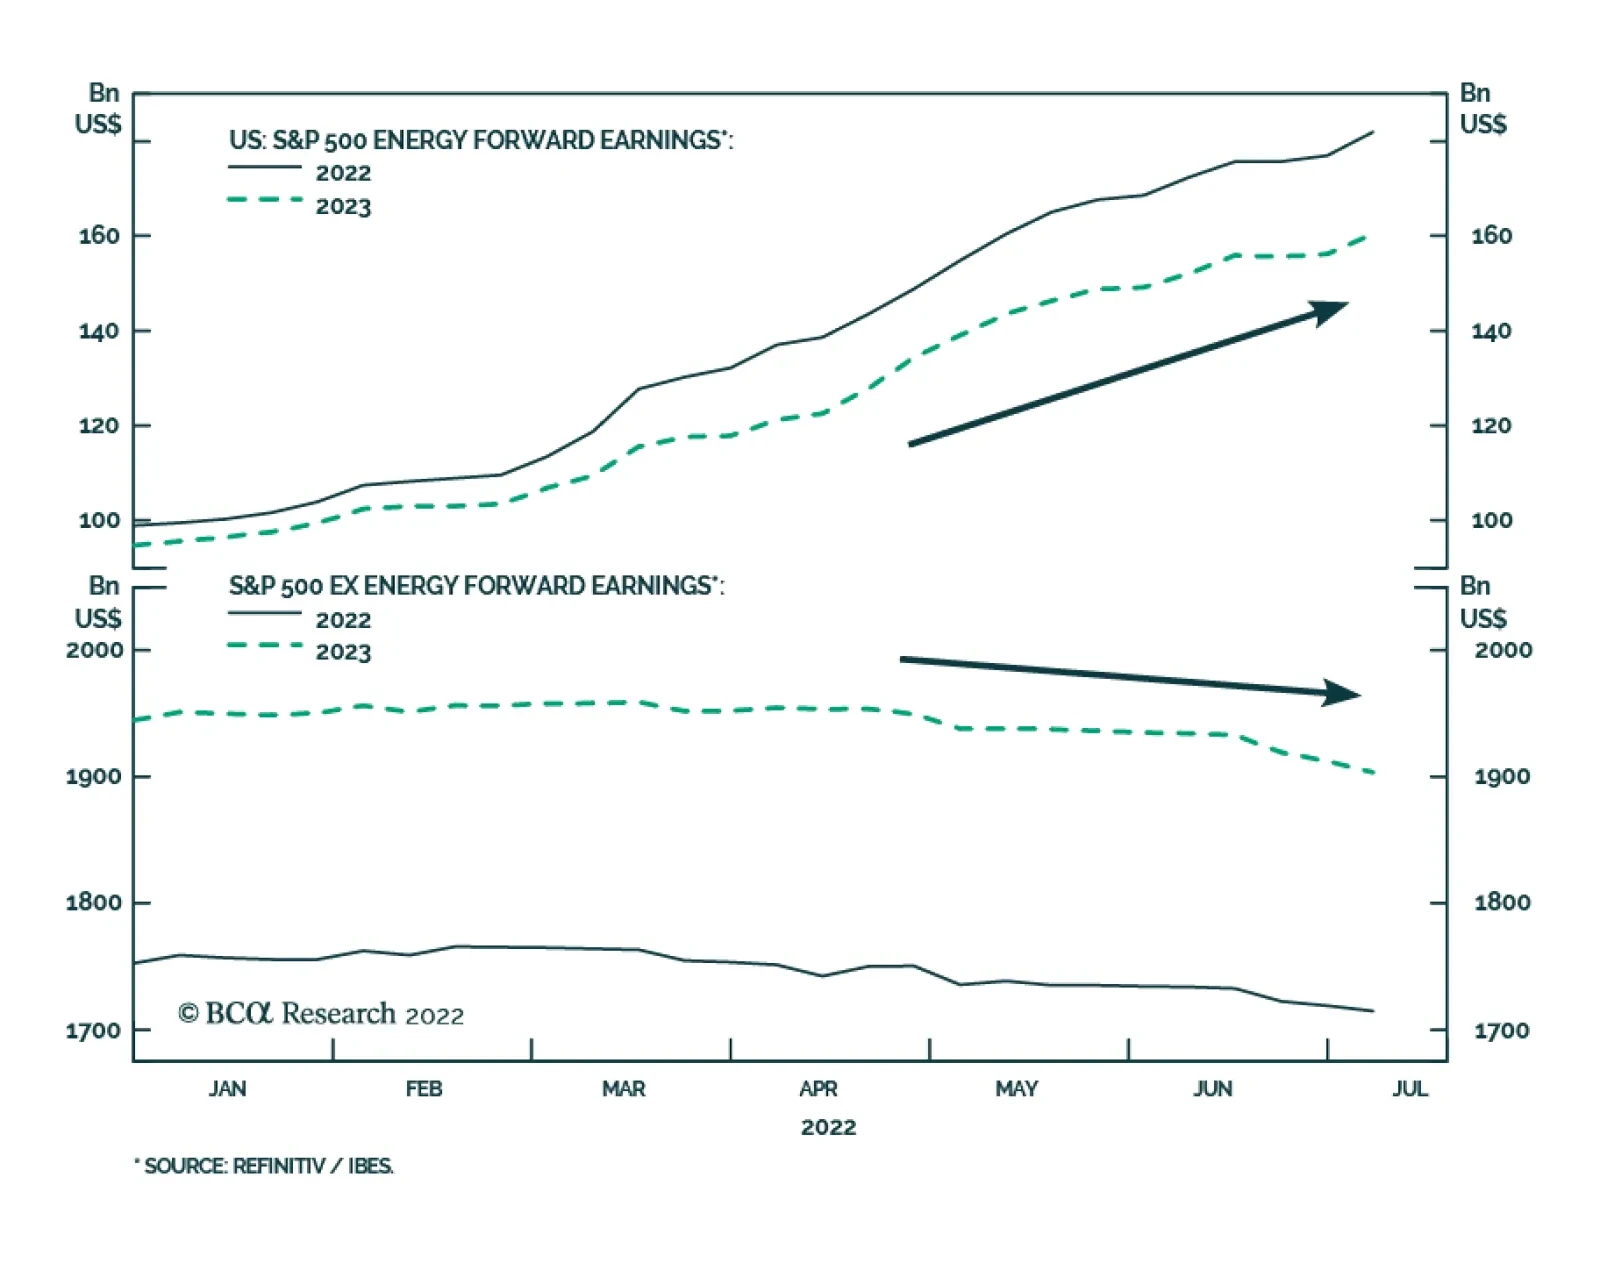
Valuations are largely responsible for the year-to-date equity selloff. Meanwhile, earnings estimates have remained relatively resilient even though global growth has slowed globally. Two factors explain this earnings puzzle. First, soaring energy…
According to BCA Research’s US Bond Strategy service, inflation has an easy path back to 4%, but a move to 2% will require a higher unemployment rate. At 5.9%, core CPI inflation is running well above the Fed’s 2% target. However, we know that some portion…

Executive Summary We posit three conjectures about the US economy: Inflation has an easy path back to 4%, but a move to 2% will require a higher unemployment rate. It will be more difficult to raise the unemployment rate than many anticipate. The Fed will tolerate a higher unemployment rate than many anticipate. Taken together, these conjectures point to a higher fed funds rate in 2023 than is currently discounted in the market. This suggests that investors should be bearish bonds on a 12-18 month investment horizon. While we are bearish bonds in the medium-to-long term, we retain an ‘at benchmark’ portfolio duration stance for the time being because numerous indicators point to lower bond yields during the next few months. We also recommend an underweight allocation to spread product versus Treasuries, though we highlight the potential for solid near-term junk bond returns. Rate Expectations: Market Versus Fed
Rate Expectations: Market Versus Fed
Rate Expectations: Market Versus Fed
Bottom Line: Maintain an ‘at benchmark’ portfolio duration stance. We will recommend reducing portfolio duration if the 10-year Treasury yield falls to 2.5% or if core inflation converges with our 4%-5% estimate of its underlying trend. Feature Uncertainty in bond markets remains elevated as investors seemingly can’t decide whether the US economy is in the midst of an inflationary boom or hurtling towards recession. This week’s report details our view of the current macroeconomic environment by offering three conjectures about the state of the US economy and monetary policy. We conclude by explaining how these conjectures shape our recommended investment strategy. Conjecture #1: Inflation Has An Easy Path Back To 4%, The Path To 2% Will Be More Difficult At 5.9%, core CPI inflation is running well above the Fed’s 2% target. However, we know that some portion of that 5.9% reflects supply side constraints related to the pandemic and some portion reflects an overheating of the demand side of the US economy. This distinction is important because the pandemic-related inflation will eventually subside on its own, without the need for materially slower economic growth. In contrast, a significant economic slowdown and a higher unemployment rate will be required to tame any inflation driven by strong US demand. Chart 1Estimating Trend Inflation
Estimating Trend Inflation
Estimating Trend Inflation
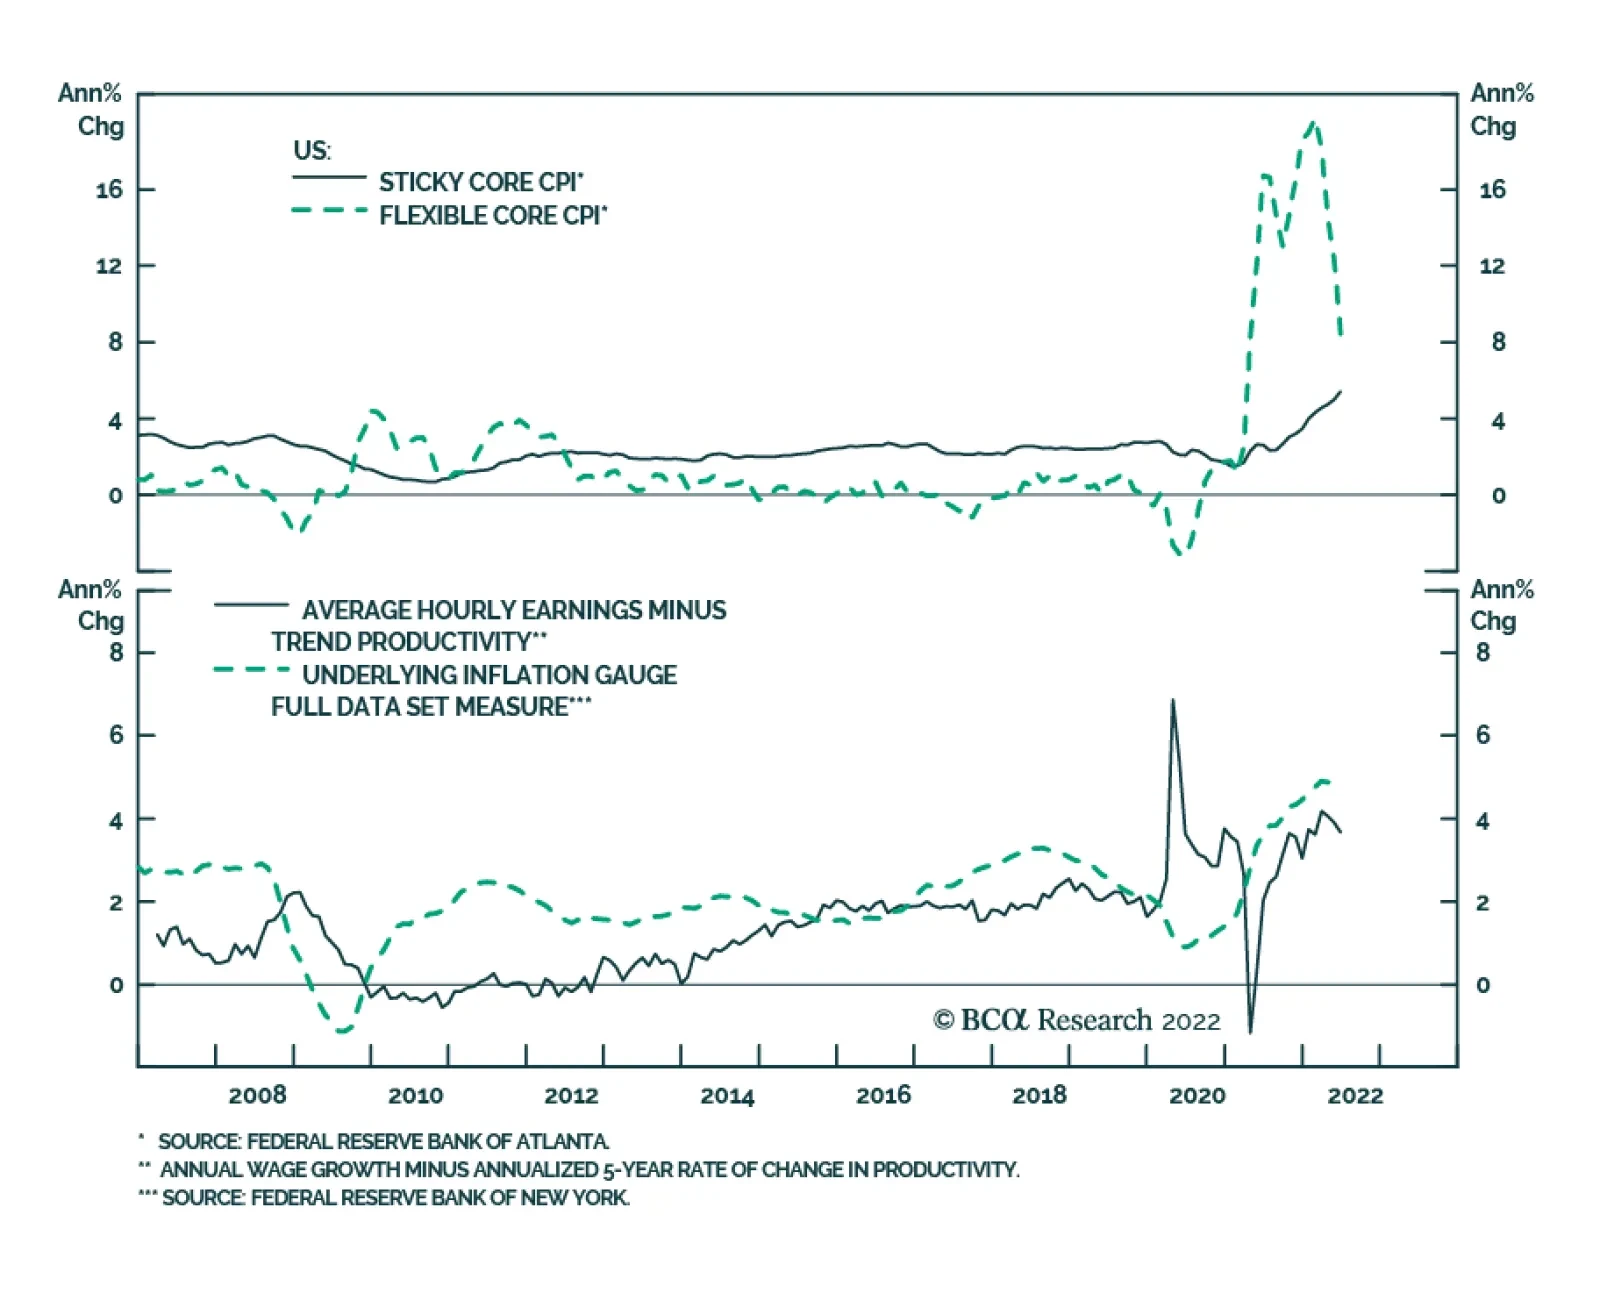
In a recent report we looked at three different techniques for distinguishing between these two types of inflation.1First, we considered the Atlanta Fed’s decomposition of core inflation into flexible and sticky components. At present, the volatile core flexible CPI is running at an 8.4% annual rate and the core sticky CPI stands at 5.4% (Chart 1). Second, we noted that the New York Fed’s Underlying Inflation Gauge is running at 4.8% (Chart 1, bottom panel). Finally, we used wage growth net of trend productivity growth as an estimate of inflation’s underlying trend and calculated that to be 3.7% (Chart 1, bottom panel). From this analysis, our general conclusion is that core CPI inflation can fall into a range of 4%-5% just from the unwinding of pandemic-induced supply-side effects. After that, the Fed will be forced to engineer an economic slowdown to bring inflation from the stickier 4% level back down to its 2% target. Inflation Progress Report Last week’s June CPI report shows that even progress back to our 4%-5% estimate of inflation’s underlying trend is proving difficult. Core CPI rose 0.71% in June, well above expectations, and monthly trimmed mean CPI was an even stronger 0.80% (Chart 2A). Base effects led to a small drop in the annual core CPI number – from 6.0% to 5.9% - but annual trimmed mean CPI moved up to 6.9% (Chart 2B). The strong CPI print has led to increased speculation that the Fed will raise rates by 100 bps this month (see Box). Chart 2AMonthly Inflation
Monthly Inflation
Monthly Inflation
Chart 2BYearly Inflation
Yearly Inflation
Yearly Inflation
Turning to the three major components of core inflation, we see that shelter, goods, and services ex. shelter contributed roughly equal amounts to the June core CPI reading (Chart 3). The elevated reading from core goods inflation is particularly notable because this is one area where we have been anticipating that easing supply-side constraints will send prices lower. Car prices, specifically, have been one of the principal drivers of high inflation and they remained stubbornly high in June (Chart 4). Chart 3Monthly Core CPI Inflation By Major Component
Three Conjectures About The US Economy
Three Conjectures About The US Economy
Chart 4Contribution To Month-Over-Month Core Goods CPI
Three Conjectures About The US Economy
Three Conjectures About The US Economy
Chart 5Supply-Side Constraints Are Easing
Supply-Side Constraints Are Easing
Supply-Side Constraints Are Easing
While it has taken much longer than expected for core goods and other pandemic-driven components of inflation to turn down, leading indicators still suggest that these prices are more likely to fall than rise during the next few months. The New York Fed’s Global Supply Chain Pressure Index has clearly rolled over and supplier delivery times, as measured by both the ISM manufacturing and non-manufacturing surveys, have shortened (Chart 5). While core goods and autos are representative of the sort of inflation that will ease naturally as supply chain constraints abate, shelter inflation is representative of the sort of inflation that will be stickier. That is, a higher unemployment rate will be required to significantly lower shelter inflation. Chart 6Shelter CPI Model
Shelter CPI Model
Shelter CPI Model
Shelter inflation, currently running at 5.6%, can be modeled using the unemployment rate, rental vacancies and home prices (Chart 6). Given that shelter is such a large component of core inflation, it must fall if the Fed is going to achieve its 2% inflation target. That will certainly require a higher unemployment rate and very likely a recession. Bottom Line: Core inflation will move down in the second half of this year, as easing supply-side constraints lead to lower goods prices. Inflation’s downtrend will subside once it reaches its trend level of 4%-5%, at which point a higher unemployment rate and economic recession will be required to move it even lower, back to the Fed’s 2% target. BOX 75 bps Or 100 bps At The Next FOMC Meeting? Guidance provided by Fed Chair Jay Powell at the last meeting FOMC meeting suggested that the committee will choose between lifting rates by 50 bps or 75 bps when it meets later this month. The implication was that any negative inflation surprise would push the committee towards 75 bps. Certainly, last month’s strong employment report and hot CPI print justify a 75 bps move within Powell’s framework. But is it possible that Powell’s guidance from the June FOMC meeting is already stale? Chart B1July FOMC Expectations
July FOMC Expectations
July FOMC Expectations
Investors are increasingly betting that it is, and the market is now discounting some chance of a 100 bps rate hike this month (Chart B1). The reason for this pricing is that the Fed has already backtracked on its guidance once before. Powell ruled out 75 bps rate hikes at the May FOMC press conference. Then, the committee delivered a 75 bps increase in June after core CPI came in hot. Kansas City Fed President Esther George dissented from the June decision because she objected to the Fed flip-flopping on its guidance so quickly. George explained her dissent in a recent speech by saying that “communicating the path for interest rates is likely far more consequential than the speed with which we get there.”2 Where does this leave us for the July meeting? Our expectation is that the Fed will stick to its guidance and deliver a 75 bps increase this month. However, if the market moves to fully price-in a 100 bps move then the committee may be tempted to deliver on those expectations. In other words, the Fed’s recent track record of abandoning its forward rate guidance means that both a 75 bps rate hike and a 100 bps rate hike are in play for July. Conjecture #2: The Labor Market Will Be More Resilient Than Is Widely Believed Chart 7An Extremely Tight Labor Market
An Extremely Tight Labor Market
An Extremely Tight Labor Market
Our second conjecture is that it will be more difficult to lift the unemployment rate than many people think. This view stems from the fact that the labor market is incredibly tight. As Fed officials have often pointed out, there are currently almost two job openings for every unemployed worker in the country (Chart 7). Further, we noted in last week’s report that while the employment readings from both ISM surveys are in contractionary territory, respondents to those surveys were much more likely to cite concerns about the supply side of the labor market than they were to cite concerns about hiring demand.3 In other words, an economy where there are twice as many job openings as unemployed workers and where firms are complaining about a shortage of labor is not one where we are likely to see an immediate surge in layoffs, even as demand starts to soften. Conjecture #3: The Fed Will Tolerate A Higher Unemployment Rate Than Is Widely Believed Chart 8Optimal Control Monetary Policy
Optimal Control Monetary Policy
Optimal Control Monetary Policy
Our final conjecture is that the Fed will persistently run a much more restrictive monetary policy than many investors anticipate. We detailed our logic in a recent report where we argued that the Fed will adopt an optimal control approach to monetary policy.4 An optimal control strategy is employed when the Fed is unlikely to perfectly hit both its full employment goal and its 2% inflation target. In such environments, Janet Yellen has argued that the Fed should set monetary policy to minimize the joint deviations of inflation from target and of the unemployment rate from estimates of its full employment level.5 Chart 8 presents an example of an optimal control loss function that consists of adding together the squared deviations of inflation from 2% and of the unemployment rate from the Congressional Budget Office’s estimate of NAIRU. Using this framework, the Fed’s goal is to minimize the output of the loss function shown in the top panel. The dashed lines in Chart 8 illustrate a scenario where core PCE inflation falls to 4% but where the output from the loss function is held flat. That scenario implies an increase in the unemployment rate from its current level of 3.6% all the way up to 6.7%! This exercise demonstrates that, under an optimal control framework, the Fed would be willing to tolerate an unemployment rate of 6.7% or lower in order to move core inflation back to 4%. We don’t see the unemployment rate hitting 6.7% any time soon. The main point of this analysis is to illustrate that Fed policy is likely to retain a restrictive bias until inflation returns to 2% or lower. It won’t move toward easing policy at the first sign of a higher unemployment rate, as has been the pattern in recent years when inflation was much more contained. Investment Implications To summarize, our three conjectures about the US economy are that: (i) a higher unemployment rate will be required to move inflation from 4% to the Fed’s 2% target, (ii) a lot of demand destruction will be required before we see a significant rise in the unemployment rate and (iii) in its pursuit of lower inflation, the Fed will tolerate a higher unemployment rate than many people expect. Taken together, these three conjectures imply that the fed funds rate will be higher in 2023 than what is currently priced in the curve. At present, the market is priced for the fed funds to peak at 3.67% in March 2023 and then fall back to 3.13% by the end of the year (Chart 9). If our three conjectures pan out, then we think it’s likely that the fed funds rate will move above 4% next year and that it will be higher than 3.13% by the end of 2023. Chart 9Rate Expectations: Market Versus Fed
Rate Expectations: Market Versus Fed
Rate Expectations: Market Versus Fed
Portfolio Duration Chart 10High-Frequency Bond Yield Indicators
High-Frequency Bond Yield Indicators
High-Frequency Bond Yield Indicators
Obviously, this view makes us inclined toward a ‘below-benchmark’ portfolio duration stance on a 12-18 month investment horizon. That said, we recommend keeping portfolio duration close to benchmark for now because many indicators suggest that bond yields could fall during the next few months (Chart 10). More specifically, with core CPI still above our 4%-5% estimate of its underlying trend, we see inflation as more likely to fall than rise during the next six months. At the same time, aggregate demand will be slowing as the Fed tightens policy and the unemployment rate is more likely to rise than fall. These factors will keep bond yields contained between now and the end of the year. While we recommend an ‘at benchmark’ portfolio duration stance on a 6-12 month horizon, we will reduce portfolio duration if the 10-year Treasury yield moves back to 2.5% or once core inflation converges to our 4%-5% estimate of trend. At that point, we think inflation will be stickier and it will make sense to position for higher bond yields. Spread Product Our three conjectures also imply a negative environment for spread product. Monetary policy will become increasingly restrictive, and it will be a long time before the Fed moves toward interest rate cuts – the traditional signal to pile into spread product. We therefore advocate an underweight allocation to spread product versus Treasuries in US bond portfolios. One exception to our underweight spread product allocation is that we retain a neutral allocation to high-yield. Our reasoning is that high-yield spreads are elevated and they have the potential to tighten during the next few months as inflation converges toward our estimate of trend. As inflation falls and fears of immediate recession abate, it’s conceivable that junk spreads could revert to their 2017-19 average, the level that prevailed during the previous tightening cycle (Chart 11), and such a move would lead to roughly 8.4% of excess return.6 If such a move were to occur within the next six months, then we would be inclined to reduce our junk bond exposure to underweight. A Quick Note On 2-Year TIPS Chart 11Junk Spreads Are Elevated
Junk Spreads Are Elevated
Junk Spreads Are Elevated
Chart 122-Year TIPS Yield Is Positive
Three Conjectures About The US Economy
Three Conjectures About The US Economy
In last week’s report we recommended upgrading TIPS from underweight to neutral relative to duration-matched nominal Treasuries. However, given that the 2-year TIPS yield was still negative, we did not close our recommendation to short 2-year TIPS or our recommended 2/10 real yield curve flattener and 2/10 inflation curve steepener positions. The 2-year real yield has continued to rise during the past week and, at +9 bps, it is now in positive territory (Chart 12). We were confident that the 2-year TIPS yield would turn positive because the Fed has implied that it is targeting positive real yields across the entire curve. But now that the yield is positive, we are no longer confident in the trade’s upside. Bottom Line: Investors should close out their short 2-year TIPS positions, as well as their 2/10 real yield curve flatteners and 2/10 inflation curve steepeners. Ryan Swift US Bond Strategist rswift@bcaresearch.com Footnotes 1 Please see US Bond Strategy / Global Fixed Income Strategy Weekly Report, “No End In Sight For Fed Tightening”, dated June 21, 2022. 2 https://www.kansascityfed.org/Speeches/documents/8875/2022-George-MidAm… 3 Please see US Bond Strategy / Global Fixed Income Strategy Weekly Report, “A Low Conviction US Bond Market”, dated July 12, 2022. 4 Please see US Bond Strategy Weekly Report, “When The Dual Mandates Clash”, dated June 28, 2022. 5 https://www.federalreserve.gov/newsevents/speech/yellen20120606a.htm 6 Return estimate assumes default losses of 1.8% and that the spread tightening occurs over a six month period. Recommended Portfolio Specification Other Recommendations Treasury Index Returns Spread Product Returns
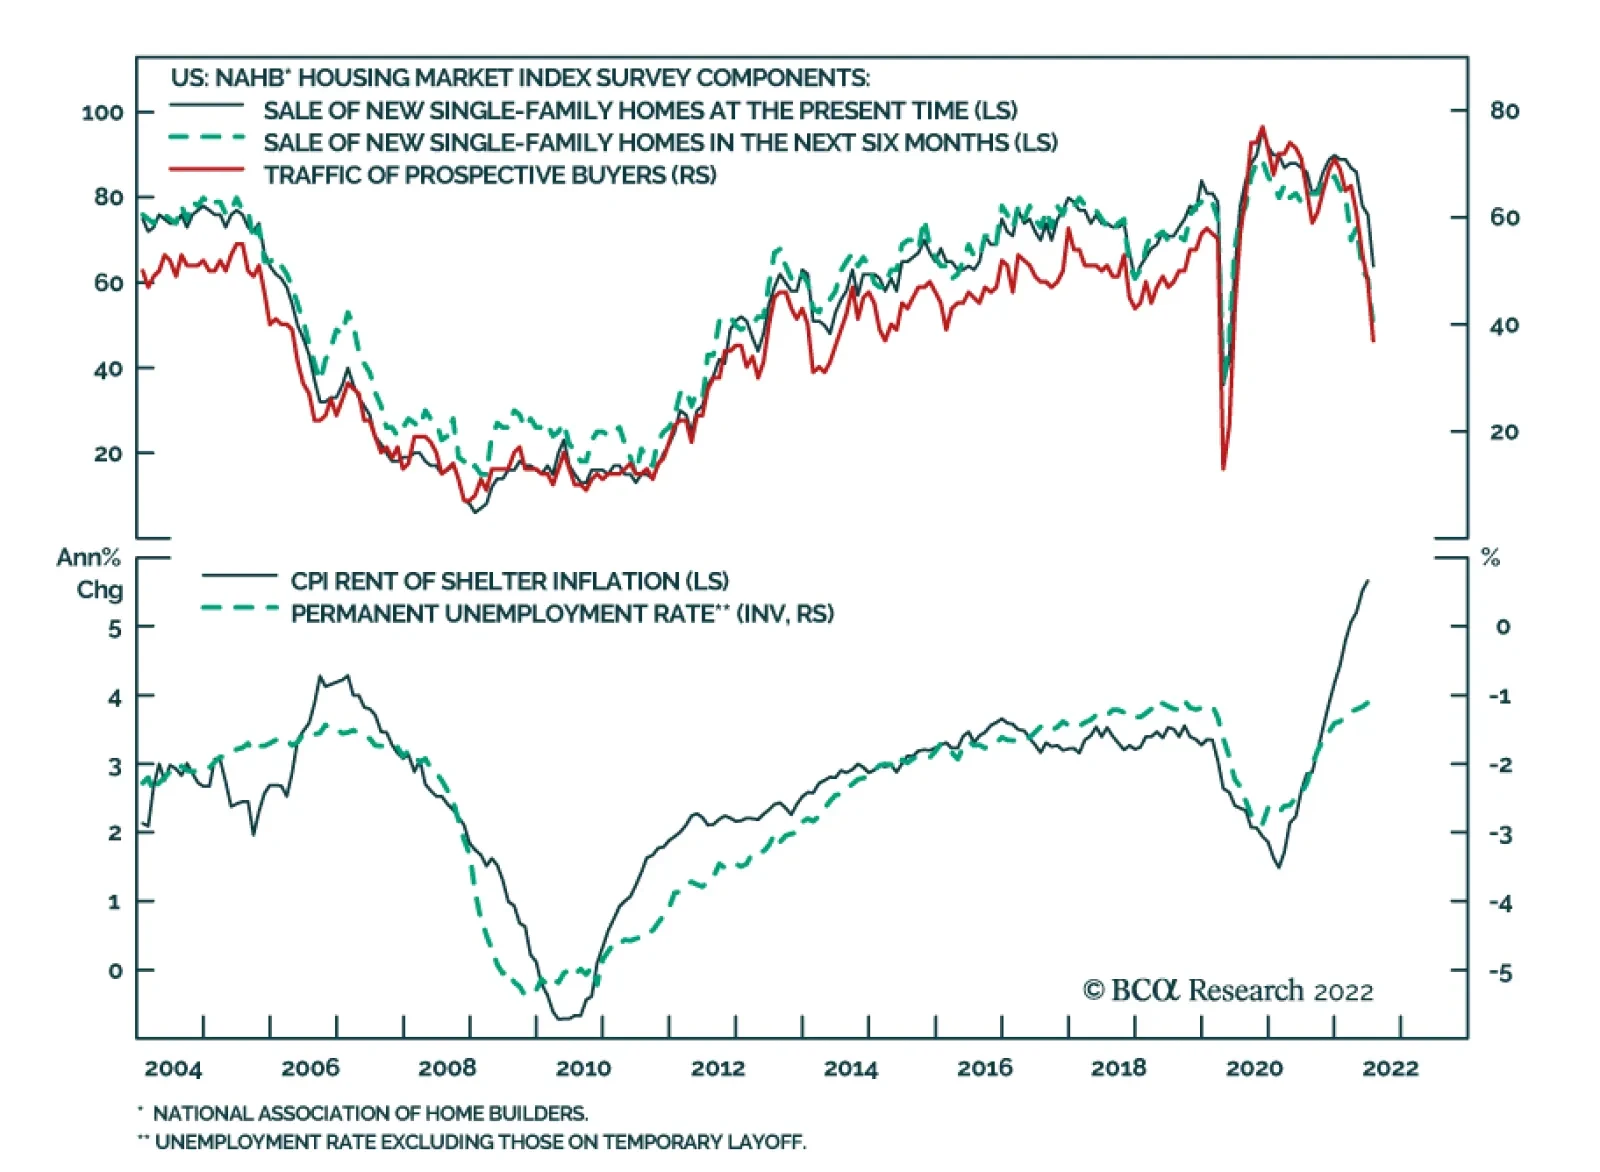
The NAHB Housing Market Index, which measures sentiment among US homebuilders, dropped by a greater-than-expected 12 points to 55 in July, the lowest level since May 2020 and the second largest single-month drop in the index's 37-year history. All three…
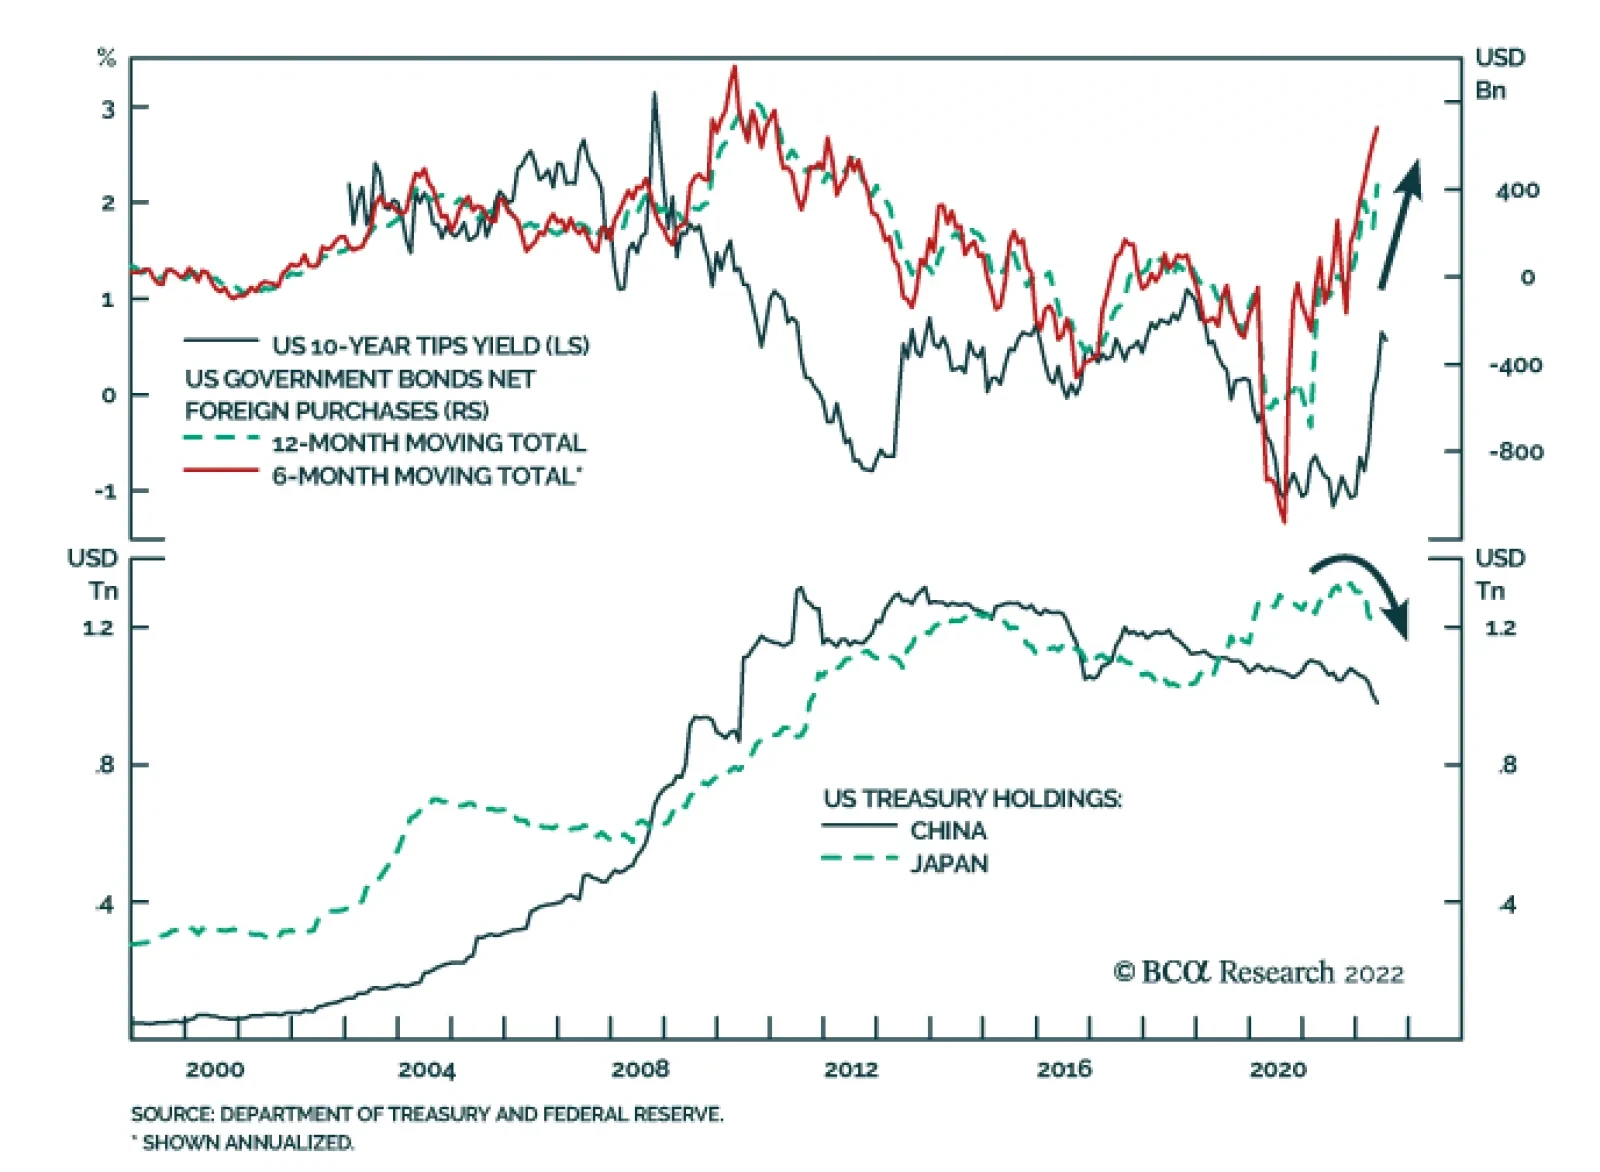
Even though Japan and China – the top foreign owners of US government debt – have been reducing their holdings of US Treasurys, net foreign purchases of US Treasurys have been surging. This dynamic is relevant as our FX strategists have highlighted massive…
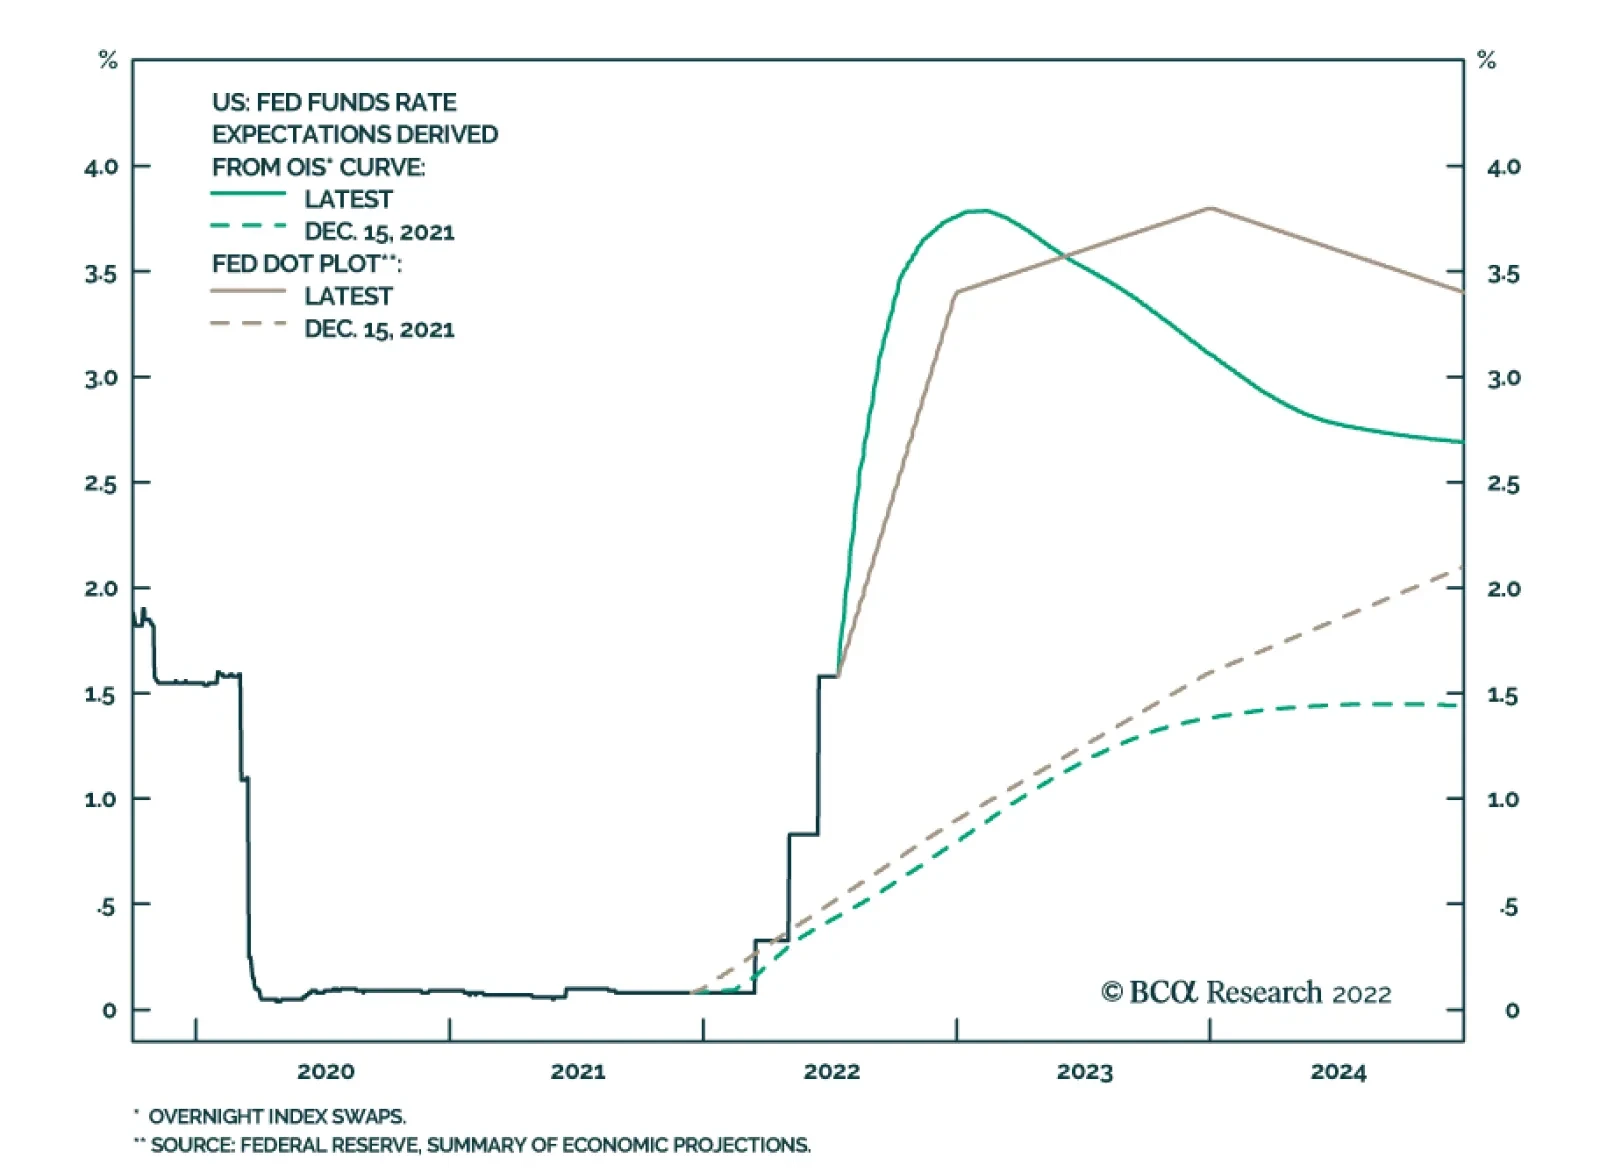
According to the FOMC’s latest Summary of Economic Projections, the Fed expects to raise interest rates to 3.4% and 3.8% by the end of 2022 and 2023, respectively. Policymakers are determined to do whatever it takes to tackle inflation. Indeed, at last…
BCA Research’s US Investment Strategy service concludes that consumer credit is way down on the list of things to worry about in the current environment. There are several lengthy data series to help evaluate households’ aggregate financial position. As a…
Executive Summary Compared to output, income and net worth, aggregate consumer indebtedness is at the low end of its twenty-first century range. Modest indebtedness and low interest rates have made it easy for households to service their debt and leave them with room to take on more. Low-income households are beginning to show some signs of strain and it appears most of them have used up their pandemic savings. Loans have been underwritten more rigorously since the crisis, however, and borrower quality has been rising, especially since the pandemic began. Loan performance always deteriorates during recessions, but attention-getting claims about credit busts appear to be overheated. Consumer borrowers are on solid footing, and the financial system is not particularly vulnerable to a consumer credit downturn. The White House is reportedly mulling some measure of student loan forgiveness for a targeted set of households at the lower end of the wealth and income distributions. The overall package will have to be small, but it may make a difference for some of the more vulnerable borrowers. Consumers Are Starting From A Good Place
Consumers Are Starting From A Good Place
Consumers Are Starting From A Good Place
Bottom Line: Reports of the American consumer’s demise have been greatly exaggerated. Consumer credit is way down on the list of things to worry about in the current environment, and investors should not be distracted by sensationalized claims about bursting bubbles. Feature Our internal research meeting last Monday, live-streamed and archived in the Live & Unfiltered section of BCA's website, addressed media reports of an increase in auto repossessions. The juiciest report featured the anecdotal observations of Lucky Lopez, YouTuber and owner of Automotive Life, a Las Vegas-based auto-related company with a somewhat ambiguous mission. Lopez’s LinkedIn profile indicates that he has a wide range of experience in the automotive industry as an owner/operator of auto repair shops, an auto body shop, a rental car company and a car dealership, though he is now a consultant and coach for all automotive businesses. Although a cursory Google search indicates that the customer experience at his past businesses has not been uniformly happy, his January YouTube video, “Used Car Market Bubble Popped !!!” has garnered over 300,000 views, raising his profile beyond the bounds of the Internet’s echo chambers. That article also referenced the work of a professor, now at New York’s Cardozo Law School, who has warned that pandemic aid merely delayed the onset of an auto-loan crisis. “The bubble is beginning to show signs of bursting soon,” she said in the column. According to Google Scholar, her 2021 paper, “Bursting the Auto Loan Bubble in the Wake of COVID-19,” has subsequently been cited by three other papers, two of which she co-authored. She and the other people featured in the column pointed to reports of surging repossessions as a cause for alarm, but repo data are hard to come by and delinquency patterns don’t suggest that default rates are headed meaningfully higher. The internal discussion motivated us to look more deeply into consumer creditworthiness. After considering the level and composition of household indebtedness, borrower quality and borrower performance, we conclude that consumer credit is in a good place. It will worsen when the recession arrives, but it will start from a better than usual position and therefore poses less of a threat to financial markets and economic output than it typically would. Our findings reinforce the idea that the economy is not beset by imbalances that increase its vulnerability to an especially nasty recession. Household Indebtedness In contrast to the murky world of auto repos, there are several lengthy data series that allow us to evaluate households’ aggregate financial position. As a share of GDP, household debt is back to the 75% level it first reached 20 years ago (Chart 1), driven by the deleveraging that followed the financial crisis (the pandemic spike was about sudden GDP contraction, not increased borrowing). Adjusted for disposable income, the after-tax cash flowing to consumers to service their obligations, the pattern is the same, as mortgage indebtedness has unwound its crisis excesses while other consumer debt has remained steady (Chart 2). The growth in household borrowing has failed to keep up with appreciating asset values and debt as a share of household net worth fell to multi-decade lows at the end of the first quarter (Chart 3). Chart 1Household Balance Sheets Have Been Strengthening For A Decade
Household Balance Sheets Have Been Strengthening For A Decade
Household Balance Sheets Have Been Strengthening For A Decade
Chart 2A 20-Year Round Trip
A 20-Year Round Trip
A 20-Year Round Trip
Chart 3Debt Is Markedly Lower As A Share Of Net Worth, ...
Debt Is Markedly Lower As A Share Of Net Worth, ...
Debt Is Markedly Lower As A Share Of Net Worth, ...
Chart 4... And Falling Rates Have Made It Especially Easy To Service
... And Falling Rates Have Made It Especially Easy To Service
... And Falling Rates Have Made It Especially Easy To Service
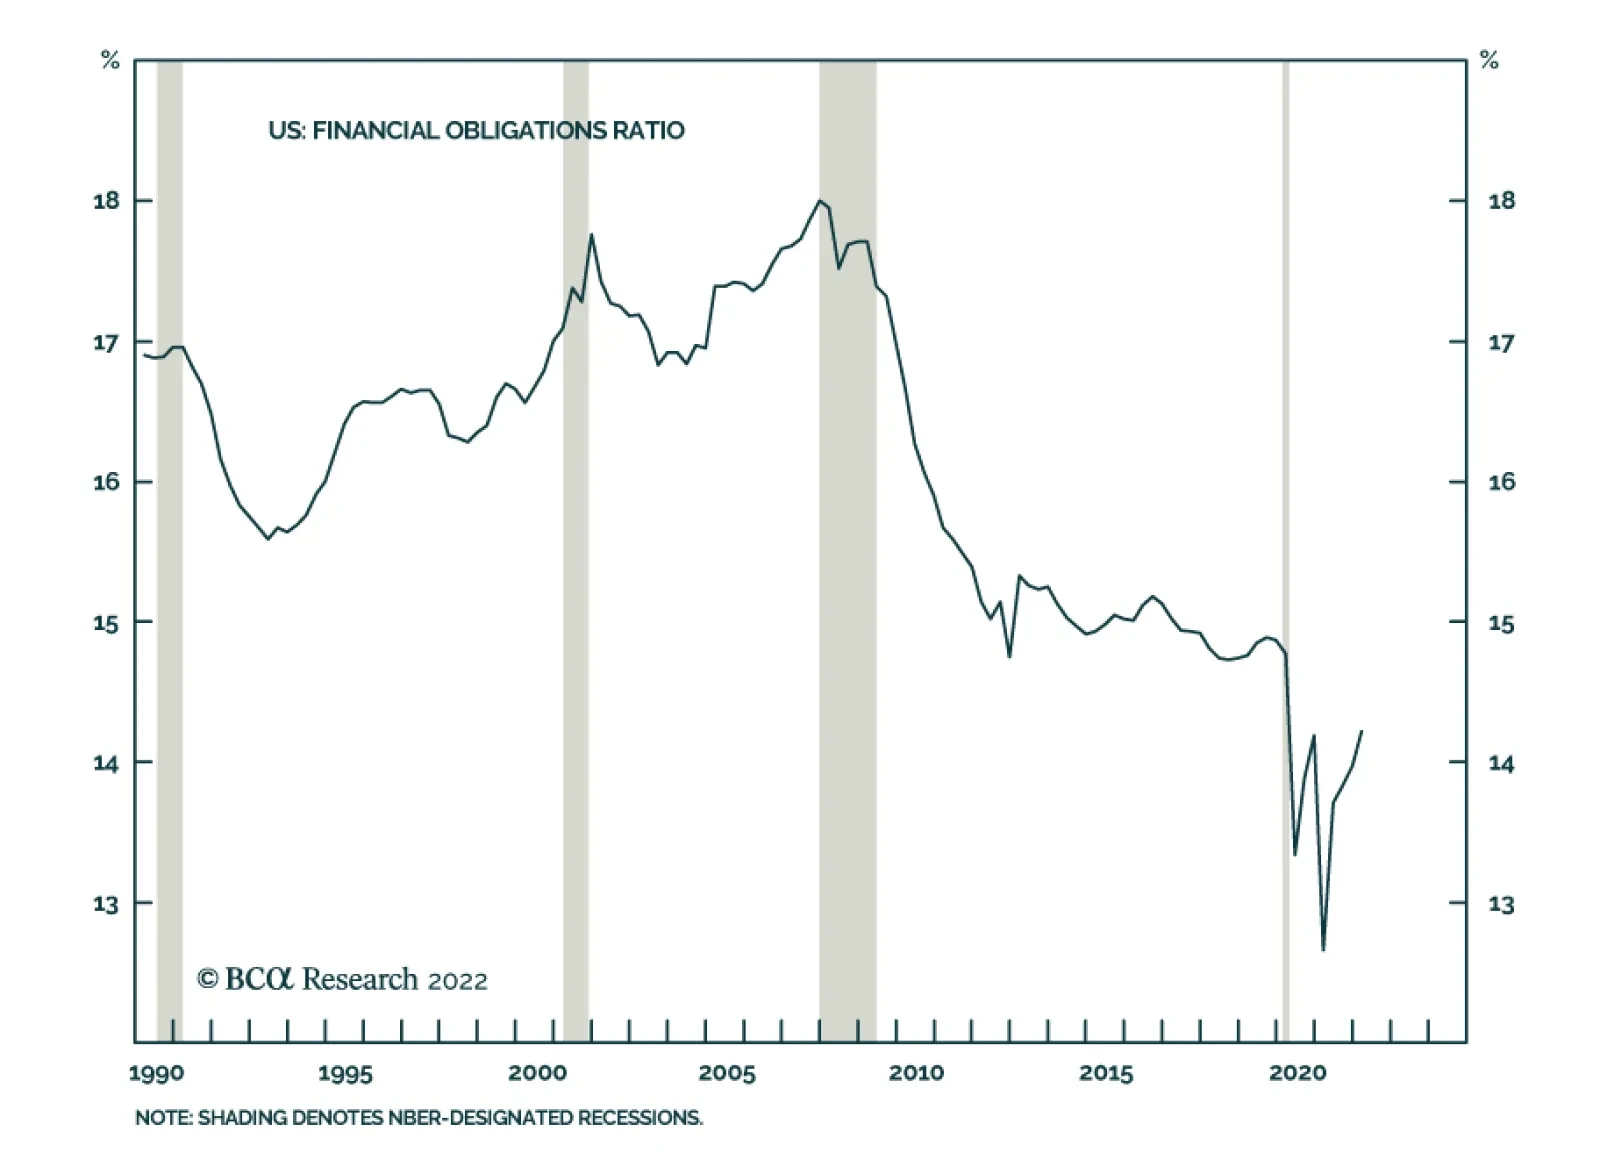
Low levels of indebtedness, combined with low interest rates, have eased households’ debt service burden, with the share of their disposable income that goes to interest and principal repayments falling to multi-decade lows (Chart 4). No matter how you slice it, the debt yoke is as light as it has been heading into the last four recessions. From a composition perspective, mortgages maintain the dominant position, accounting for nearly three-fourths of household debt (Chart 5), while student loans (11%), auto loans (8%) and credit cards (6%) comprise nearly all the rest. Although those warning of an auto bubble cite rising auto loan balances as a sign of trouble, they have been mostly steady as a share of disposable income since 2015 and remain well short of their 2002-to-2005 peak. Chart 5Consumer Credit Has Moved In Step With Disposable Income For The Last 20 Years
Consumer Credit Has Moved In Step With Disposable Income For The Last 20 Years
Consumer Credit Has Moved In Step With Disposable Income For The Last 20 Years
Bottom Line: Household indebtedness is much more manageable now than it was ahead of the last four recessions, thanks to reduced balances relative to income and wealth and lower interest rates. Borrower Quality As household balance sheets strengthen, consumer borrowers become better credits, but loan quality is also a function of lenders’ appetites. Bad loans are made in good times, according to the bank examiner’s mantra, but the corollary is also true. Reluctant lenders make sound loans and banks lost some of their appetite after the crisis while regulators took away much of what was left of it. Basel III standards clipped banks’ wings by applying onerous capital charges to all but the most straightforward lending activity and Fannie Mae’s and Freddie Mac’s aggressive stance on returning defaulted residential mortgages to their originators over an uncompromisingly strict reading of representation and warranty claims have forced banks to scrutinize prospective homeowners’ credentials. Increased scrutiny has shown up in the vastly improved risk profile of mortgage originations (Chart 6), which are now overwhelmingly tilted in favor of prime-plus (FICO score of 720 to 780) and superprime (greater than 780) borrowers and away from near prime (600 to 660) and subprime borrowers (less than 600). It is understandable that investors who lived through the trauma of the financial crisis just over a decade ago remain sensitive to housing market vulnerability, but we think the FICO score data forcefully rebut any lingering concerns about residential mortgages. Chart 6Residential Mortgage Originations By FICO Score
How Creditworthy Are American Consumers?
How Creditworthy Are American Consumers?
The remainder of household debt, detailed in the Fed’s monthly consumer credit reports, is primarily concentrated in student loans, auto loans and credit cards. Student loan balances, adjusted for disposable income, surged in the wake of the financial crisis to surpass declining credit card balances, which slid further in the early stages of the pandemic, and stable auto loans. Student loan borrowers at the lower end of the wealth and income distributions may soon have some of their obligations canceled, which may help consumer credit performance at the margin (Box), though the resumption of paused monthly payments will likely make the net effect a wash. The biggest banks’ customers are beginning to carry slightly higher credit card balances and though the banks have surely eased their standards to make more of their most profitable loans, we do not foresee cards as a systemic vulnerability. BOX Student Loan Debt: Pause, Play Or Erase Student loan borrowers have been able to pause making payments on their loans since the CARES Act took effect in April 2020, but the seventh extension of the temporary pause expires at the end of August and there will not be another. The Biden administration is grappling with whether to make good on a campaign promise to cancel at least some student debt held by the federal government. Washington holds over 80% of outstanding student loans and could wipe out any or all of it via executive order but the political calculus is complicated and perilous: the Democrats would like to appeal to young voters before the midterms, as well as women, who are on the hook for almost 60% of student debt, without alienating less well-off voters who might view cancellation as a giveaway to wealthy elites. Our US Political Strategy service expects that cancellation will be limited and targeted, too small to move the needle on aggregate household finances but perhaps providing the most vulnerable borrowers temporary relief to allow them to better service their other debt and/or maintain their consumption in the face of high food and fuel prices. That leaves auto loans as the swing factor within consumer credit performance. Despite the auto bubble-watchers’ assertions, anonymized Equifax data compiled by the New York Fed for its quarterly Household Debt and Credit Report do not indicate that auto lending standards have been eased: since 2017, the share of auto loan originations made to near-prime and subprime borrowers has steadily declined while the share of prime-plus and superprime originations has risen (Chart 7). Auto lenders did relax their standards in 2013 through 2016, once they got some distance from the crisis, but they reversed the trend in 2017 and tightened the screws even more when the pandemic arrived, as per the moves in a diffusion index calculated by subtracting the share of below-prime originations from the share of above-prime originations (Chart 8). Chart 7Auto Loan Originations By FICO Score
How Creditworthy Are American Consumers?
How Creditworthy Are American Consumers?
Chart 8Tighter Standards On Showroom Floors And Used-Car Lots
How Creditworthy Are American Consumers?
How Creditworthy Are American Consumers?
Chart 9Collateral Values Have Surged
Collateral Values Have Surged
Collateral Values Have Surged
The increase in the value of the collateral securing outstanding auto loans, which have an average term of nearly six years, should help contain lender losses in the event of default (while encouraging borrowers not to default). Per the Manheim Used Vehicle Value Index, used car prices have risen between 150% and 180% since the 2016-2019 vintages of outstanding auto loans were issued (Chart 9). Cars driven for the last five or six years have been depreciating with each mile driven, so they would not bring 150-180% of their initial value if their lenders repossessed and sold them, but the unforeseen price appreciation does mean their loan-to-value ratios (LTVs) must be tiny if borrowers have kept up with their payments. Loans issued after used-car prices exploded higher in late 2020 are vulnerable on an LTV basis and are likely to generate larger-than-normal losses given default once vehicle prices come back to earth, but lenders are well insulated from losses on their older outstanding loans. Bottom Line: Borrower quality is robust relative to history. Mortgage lending standards have tightened considerably since the financial crisis and auto borrower quality has been improving since 2017. The most vulnerable student loan borrowers are likely to get some relief in the form of debt forgiveness and soaring used car prices will help shield auto lenders from losses on the loans they issued before the pandemic. Borrower Performance Monthly delinquencies across consumer borrowing categories support the idea that households are on firmer financial footing than they were before COVID-19. TransUnion’s publicly available data show that 60-day mortgage delinquencies have cratered, spending the last fourteen months at around one-half of their February 2020 level (Chart 10, bottom panel). 90-day credit card delinquencies, after rising from unprecedented lows, have settled over the last six months at about two-thirds of their February 2020 level (Chart 10, second panel). 60-day auto loan delinquencies are back to their pre-pandemic level (Chart 10, top panel), but they are a far cry from what alarmist claims would suggest. As we noted in the previous section, better borrowers and used car appreciation should help insulate lenders from losses on loans that were issued before car prices soared. Chart 10Consumer Delinquencies Remain Well-Behaved
How Creditworthy Are American Consumers?
How Creditworthy Are American Consumers?
The Road Ahead As a SIFI bank CFO put it last week when discussing his company’s second quarter earnings, no cracks in consumer borrower performance have shown up yet. Credit performance frays when growth decelerates and deteriorates when the economy contracts. The coming recession will be no different but what’s different this time is the starting point for consumer credit. Consumers often stretch their credit to the limit by the time output peaks but they are in a comfortably sustainable spot today. This time around, lenders did not abandon their credit standards to maintain market share in an increasingly overheated environment. The borrowing performance rule of thumb is that consumers will pay their debts unless they lose their jobs, get divorced or suffer catastrophic illness. Much therefore depends on employment, and the job market still looks strong. Initial jobless claims are still close to record-low levels, surveys indicate that businesses still have ambitious hiring intentions and plenty of positions need to be filled if the leisure and hospitality industry is going to meet pent-up demand. We will continue to monitor every data series that might lead consumer spending and consumer credit performance. The SIFI banks’ second-quarter earnings releases and calls end today with Bank of America and we will present our July 2022 Big Bank Beige Book report next week. Bank management teams don’t have crystal balls, but they do gain a wealth of insight into consumers’ appetites and businesses’ investment plans, and they often share some of it during their earnings calls with sell-side analysts. The macro backdrop remains fluid and fraught, and consumer credit prospects look a lot like the overall economy – far from perfect, but better than the financial market selloff and persistent gloom would imply. We remain more constructive than the consensus on the twelve-month outlook for financial markets and the economy. Doug Peta, CFA Chief US Investment Strategist dougp@bcaresearch.com
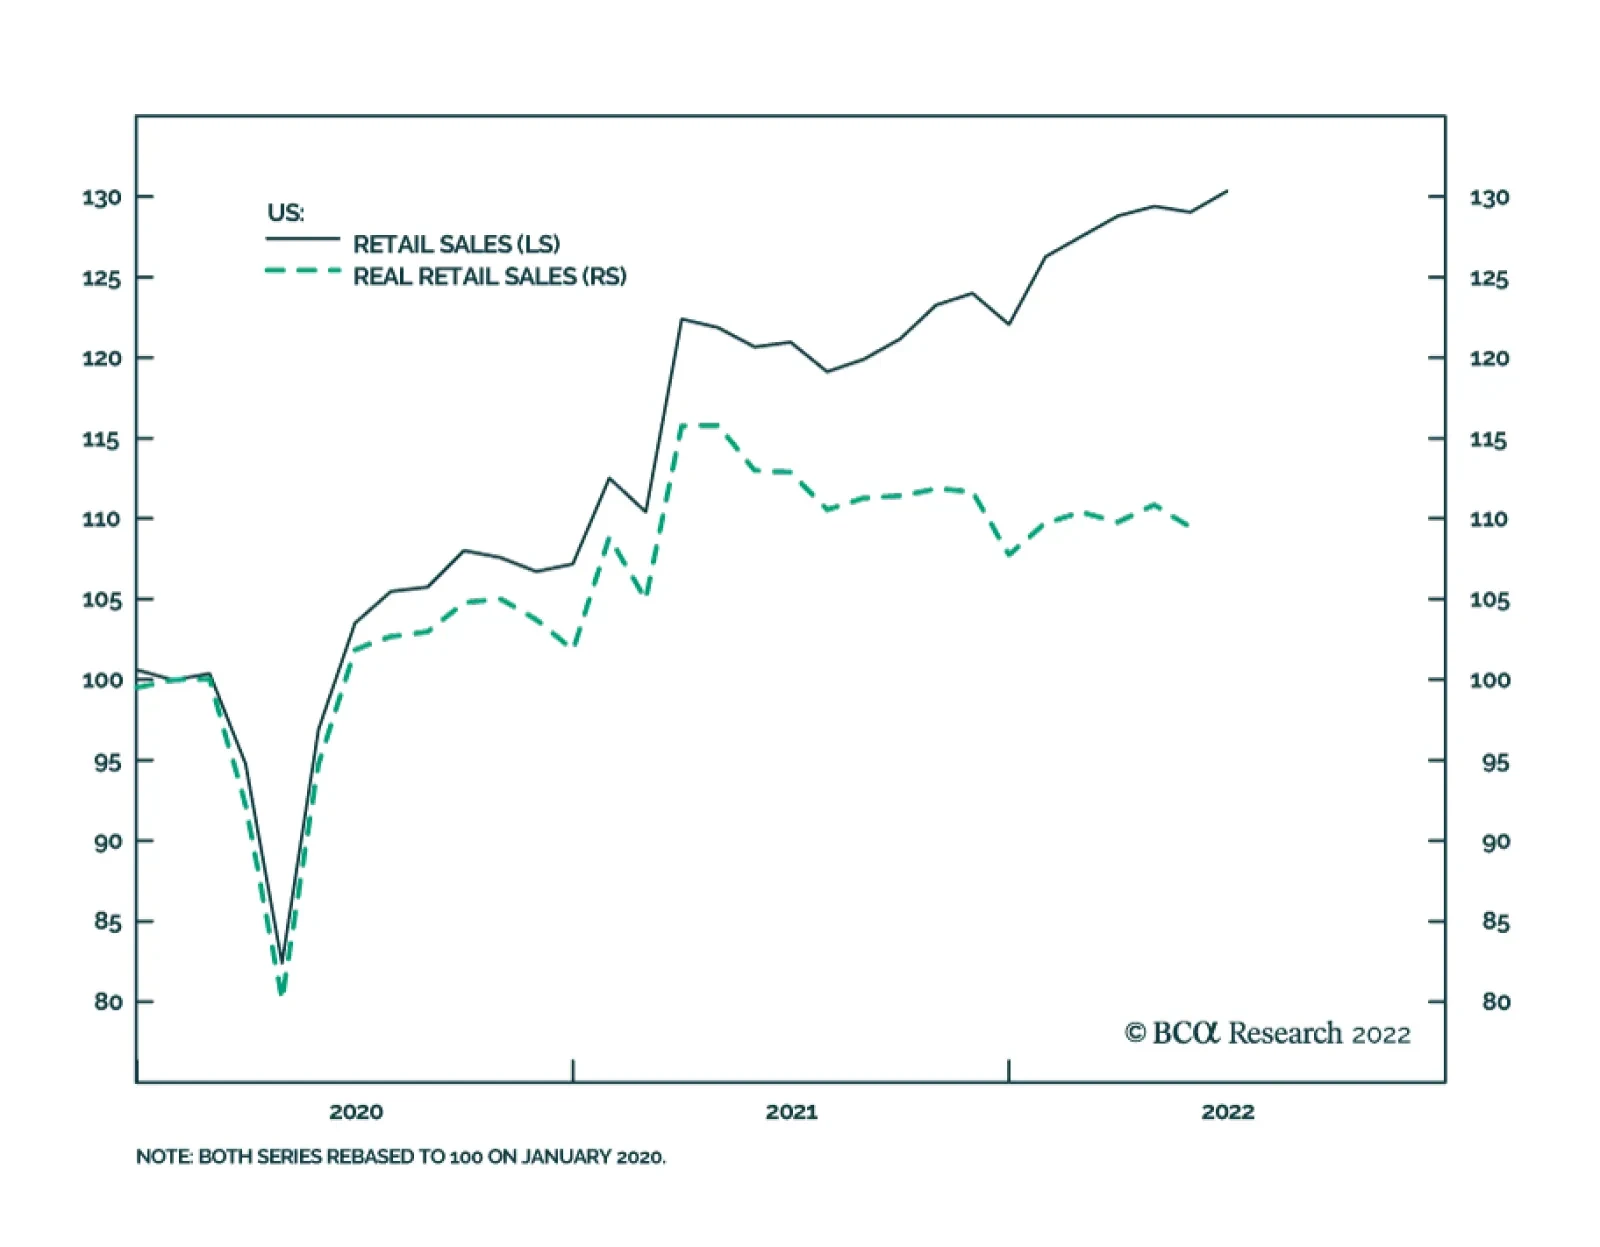
US nominal retail sales rose by a stronger-than-expected 1% m/m clip in June from an upwardly revised 0.1% contraction in May. Gasoline, online retail and home furnishing were the main contributors. A core measure excluding autos and gas – which have been…
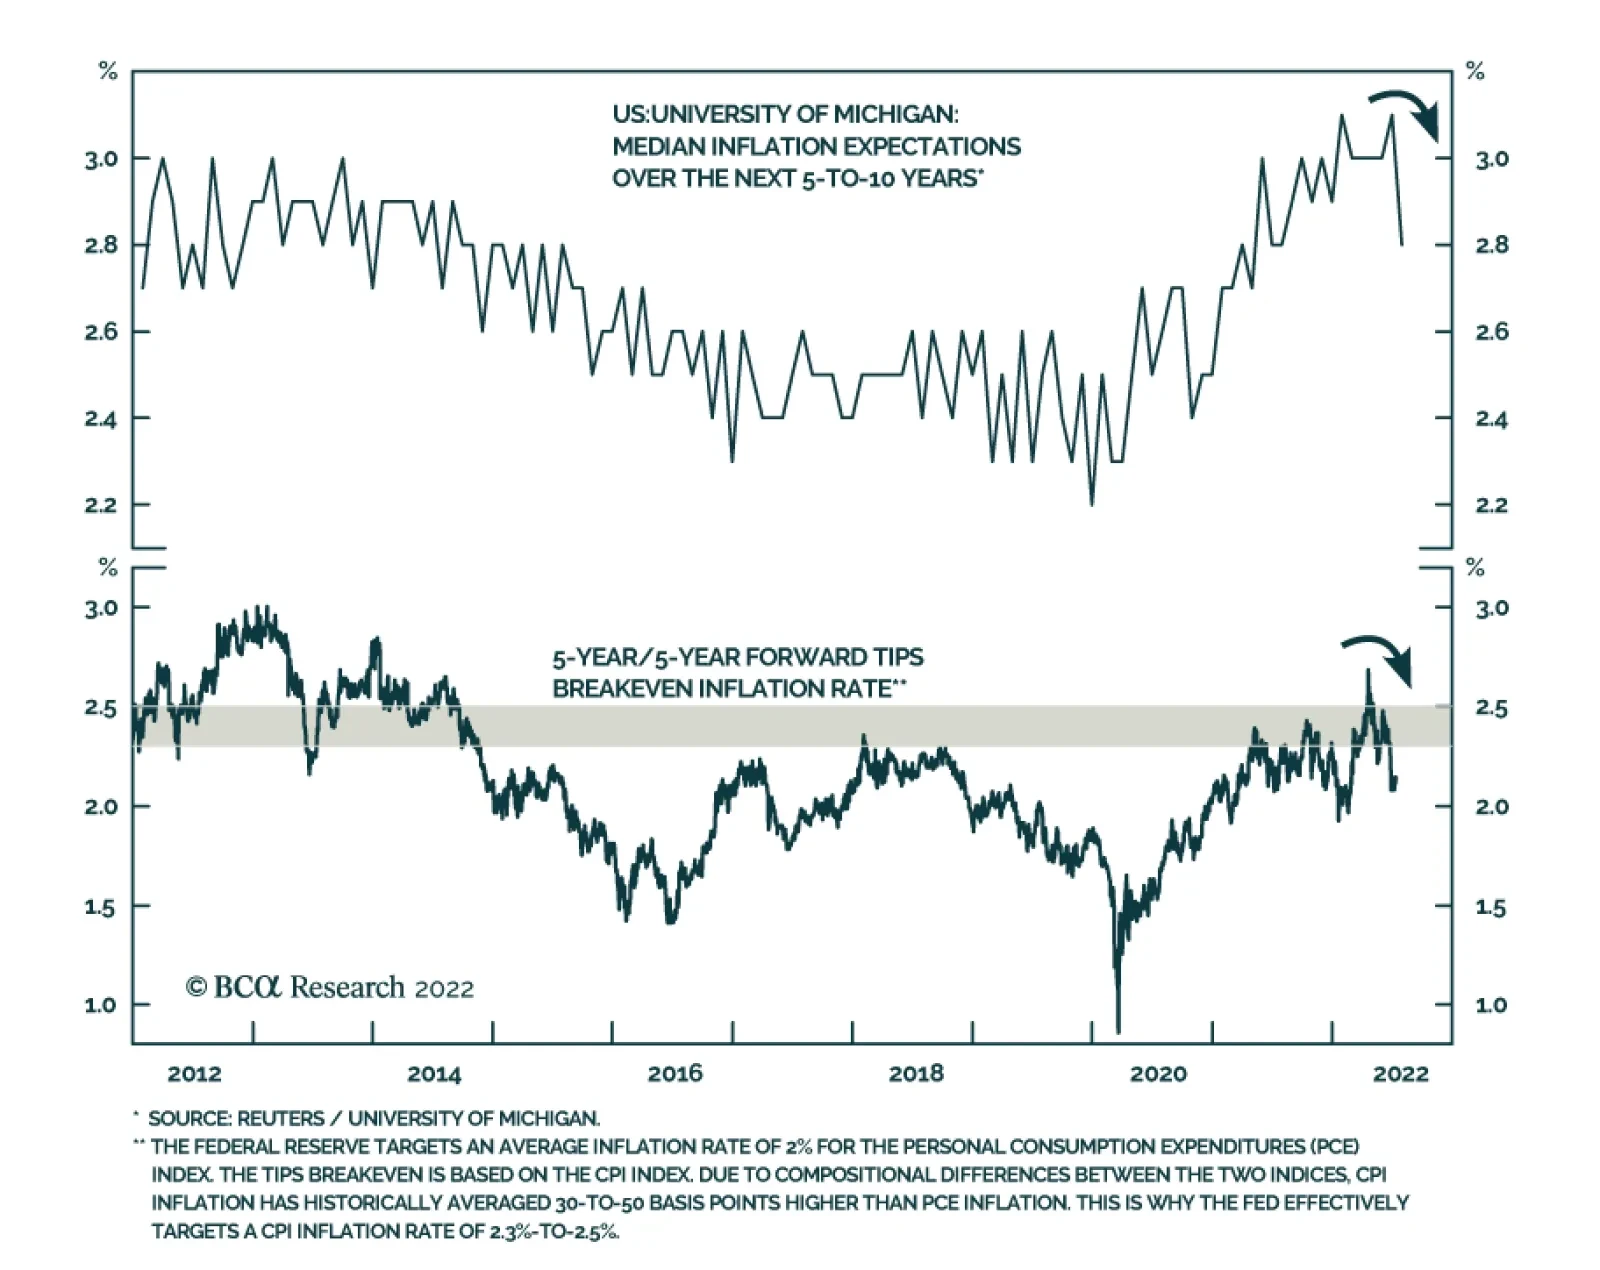
Data released on Friday sends a positive signal about US consumption. In addition to the better-than-expected June retail sales report (see The Numbers), the preliminary release of the University of Michigan survey shows a surprise minor improvement in…