United States
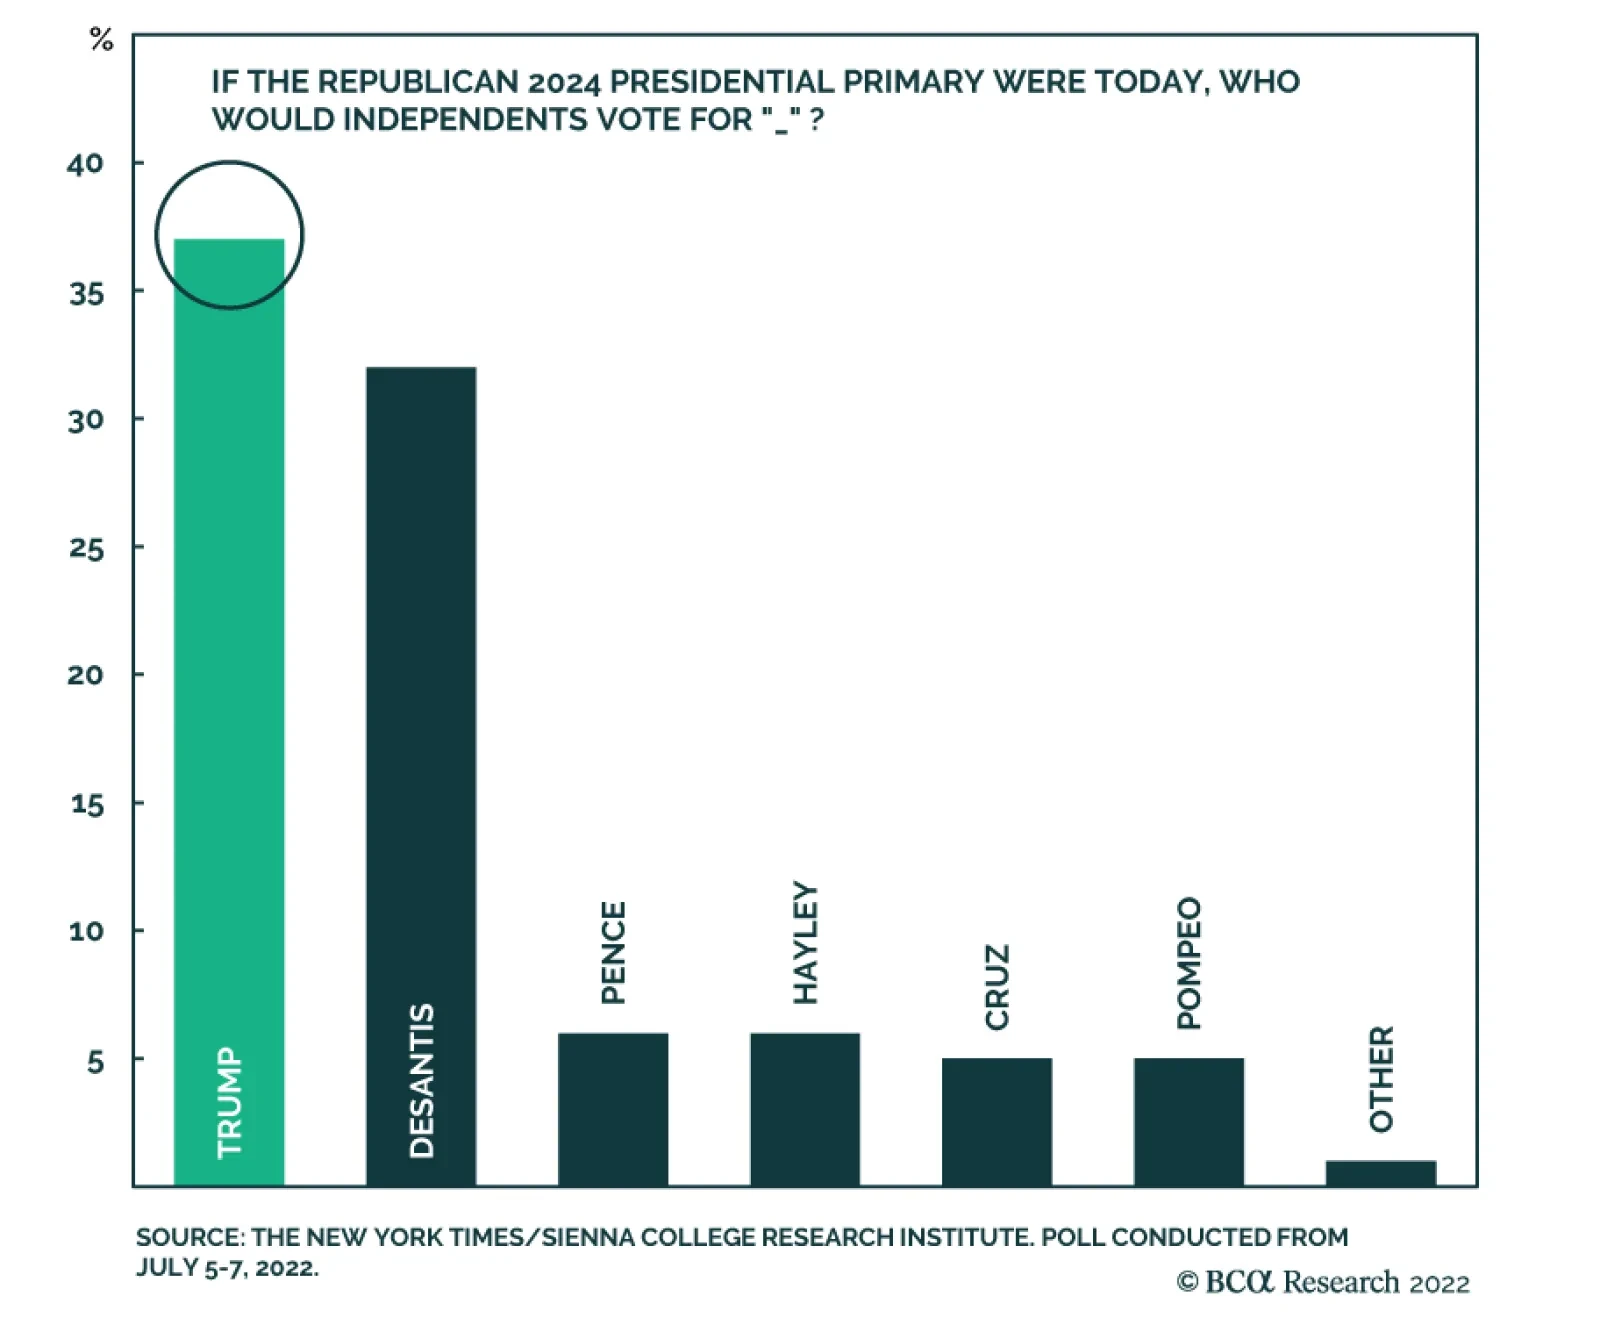
According to BCA Research’s US Political Strategy service, US economic policy uncertainty will rise ahead of the midterms, pull back afterwards, then rise again in advance of the 2024 election. While a lot can change in two years, the base case for 2024…

Listen to a short summary of this report. Executive Summary The TIPS Market Foresees A Sharp Deceleration In Inflation
What If The TIPS Are Right?
What If The TIPS Are Right?
TIPS breakevens are pointing to a rapid decline in US inflation over the next two years. If the TIPS are right, the Fed will not need to raise rates faster than what is already discounted over the next six months. Falling inflation will allow real wages to start rising again. This will bolster consumer confidence, making a recession less likely. The surprising increase in analyst EPS estimates this year partly reflects the contribution of increased energy profits and the fact that earnings are expressed in nominal terms while economic growth is usually expressed in real terms. Nevertheless, even a mild recession would probably knock down operating earnings by 15%-to-20%. While a recession in the US is not our base case, it is for Europe. A European recession is likely to be short-lived with the initial shock from lower Russian gas flows counterbalanced by income-support measures and ramped-up spending on energy infrastructure and defense. We are setting a limit order to buy EUR/USD at 0.981. Bottom Line: Stocks lack an immediate macro driver to move higher, but that driver should come in the form of lower inflation prints starting as early as next month. Investors should maintain a modest overweight to global equities. That said, barring any material developments, we would turn neutral on stocks if the S&P 500 were to rise above 4,050. US CPI Surprises to the Upside… Again Investors hoping for some relief on the inflation front were disappointed once again this week. The US headline CPI rose 1.32% month-over-month in June, above the consensus of 1.1%. Core inflation increased to 0.71%, surpassing consensus estimates of 0.5%. The key question is how much of June’s report is “water under the bridge” and how much is a harbinger of things to come. Since the CPI data for June was collected, oil prices have dropped to below $100/bbl. Nationwide gasoline prices have fallen for four straight weeks, with the futures market pointing to further declines in the months ahead. Agriculture and metals prices have swooned. Used car prices are heading south. Wage growth has slowed to about 4% from around 6.5% in the second half of last year. The rate of change in the Zillow rent index has rolled over, albeit from high levels (Chart 1). The Zumper National Rent index is sending a similar message as the Zillow data. All this suggests that inflation may be peaking. The TIPS market certainly agrees. It is discounting a rapid decline in US inflation over the next few years. This week’s inflation report did little to change that fact (Chart 2). Chart 1Some Signs That Inflation Has Peaked
Some Signs That Inflation Has Peaked
Some Signs That Inflation Has Peaked
Chart 2Investors Expect Inflation To Fall Rapidly Over The Next Few Years
What If The TIPS Are Right?
What If The TIPS Are Right?
TIPS Still Siding with Team Transitory If the TIPS market is right, this would have two important implications. First, the Fed would not need to raise rates more quickly over the next six months than the OIS curve is currently discounting (although it probably would not need to cut rates in 2023 either, given our higher-than-consensus view of where the US neutral rate lies) (Chart 3). The second implication is that real wages, which have declined over the past year, will start rising again as inflation heads lower. Falling real wages have sapped consumer confidence. As real wage growth turns positive, confidence will improve, helping to bolster consumer spending (Chart 4). To the extent that consumption accounts for nearly 70% of the US economy – and other components of GDP such as investment generally take their cues from consumer spending – this would significantly raise the odds of a soft landing. Chart 3The Fed Is Signaling That It Will Raise Rates To Almost 4% In 2023
The Fed Is Signaling That It Will Raise Rates To Almost 4% In 2023
The Fed Is Signaling That It Will Raise Rates To Almost 4% In 2023
Chart 4Positive Real Wage Growth Will Provide A Boost To Consumer Confidence
Positive Real Wage Growth Will Provide A Boost To Consumer Confidence
Positive Real Wage Growth Will Provide A Boost To Consumer Confidence
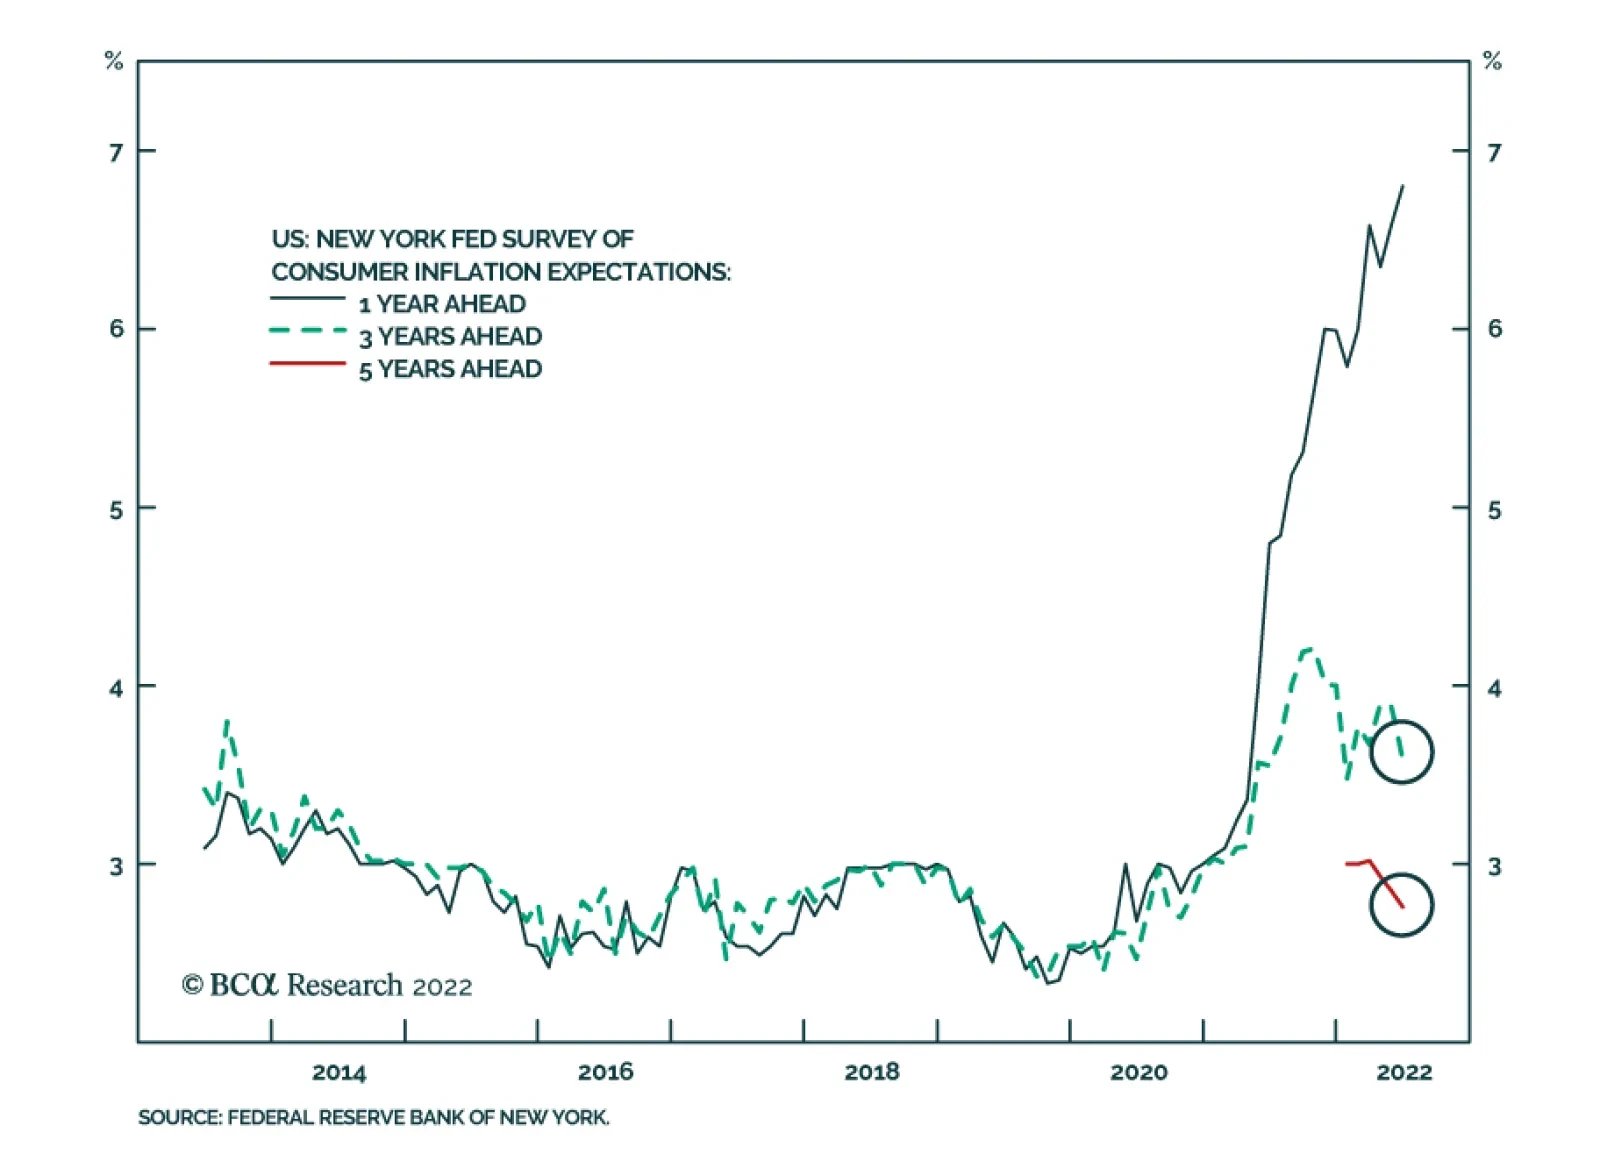
Chart 5Long-Term Inflation Expectations Remain Well Anchored
Long-Term Inflation Expectations Remain Well Anchored
Long-Term Inflation Expectations Remain Well Anchored
Of course, the TIPS market could be wrong. Bond traders do not set prices and wages. Businesses and workers, interacting with each other, ultimately determine the direction of inflation. Yet, the view of the TIPS market is broadly in sync with the view of most households and businesses. Expected inflation 5-to-10 years out in the University of Michigan survey has risen since the pandemic began, but at about 3%, it is close to where it was for most of the period between 1995 and 2015 (Chart 5). As we pointed out in our recently published Third Quarter Strategy Outlook, and as I discussed in last week’s webcast, the fact that long-term inflation expectations are well anchored implies that the sacrifice ratio – the amount of output that must be forgone to bring down inflation by a given amount — may be quite low. This also raises the odds of a soft landing. Investors Now See Recession as the Base Case Our relatively sanguine view of the US economy leaves us in the minority camp. According to recent polling, more than 70% of US adults expect the economy to be in recession by year-end. Within the investment community, nearly half of retail traders and three-quarters of high-level asset allocators expect a recession within the next 12 months (Chart 6). Chart 6Many Investors Now See Recession As Baked In The Cake
What If The TIPS Are Right?
What If The TIPS Are Right?
Reflecting the downbeat mood among investors, bears exceeded bulls by 20 points in the most recent weekly poll by the American Association of Individual Investors (Chart 7). A record low percentage of respondents in the New York Fed’s Survey of Consumer Expectations believes stocks will rise over the next year (Chart 8). Chart 7Bears Exceed The Bulls By A Wide Margin
Bears Exceed The Bulls By A Wide Margin
Bears Exceed The Bulls By A Wide Margin
Chart 8Households Are Pessimistic On Stocks
Households Are Pessimistic On Stocks
Households Are Pessimistic On Stocks
Resilient Earnings Estimates Admittedly, while sentiment on the economy and the stock market has soured, analyst earnings estimates have yet to decline significantly. In fact, in both the US and the euro area, EPS estimates for 2022 and 2023 are higher today than they were at the start of the year (Chart 9). What’s going on? Part of the explanation reflects the sectoral composition of earnings. In the US, earnings estimates for 2022 are up 2.4% so far this year. Outside of the energy sector, however, 2022 earnings estimates are down 2.2% year-to-date and down 2.9% from their peak in February (Chart 10). Chart 9US And European EPS Estimates Are Up Year-To-Date
US And European EPS Estimates Are Up Year-To-Date
US And European EPS Estimates Are Up Year-To-Date
Another explanation centers on the fact that earnings estimates are expressed in nominal terms while GDP growth is usually expressed in real terms. When inflation is elevated, the difference between real and nominal variables can be important. For example, while US real GDP contracted by 1.6% in Q1, nominal GDP rose by 6.6%. Gross Domestic Income (GDI), which conceptually should equal GDP but can differ due to measurement issues, rose by 1.8% in real terms and by a whopping 10.2% in nominal terms in Q1. Chart 10Soaring Energy Prices Have Boosted Earnings Estimates
Soaring Energy Prices Have Boosted Earnings Estimates
Soaring Energy Prices Have Boosted Earnings Estimates
How Much Bad News Has Been Discounted? Historically, stocks have peaked at approximately the same time as forward earnings estimates have reached their apex. This time around, stocks have swooned well in advance of any cut to earnings estimates (Chart 11). At the time of writing, the S&P 500 was down 25% in real terms from its peak on January 3. Chart 11Unlike In Past Cycles, Stocks Peaked Well Before Earnings
What If The TIPS Are Right?
What If The TIPS Are Right?
This suggests that investors have already discounted some earnings cuts, even if analysts have yet to pencil them in. Consistent with this observation, two-thirds of investors in a recent Bloomberg poll agreed that analysts were “behind the curve” in responding to the deteriorating macro backdrop (Chart 12). Chart 12Most Investors Expect Analyst Earnings Estimates To Come Down
What If The TIPS Are Right?
What If The TIPS Are Right?
Nevertheless, it is likely that stocks would fall further if the economy were to enter a recession. Even in mild recessions, operating profits have fallen by about 15%-to-20% (Chart 13). That is probably a more severe outcome than the market is currently discounting. Chart 13Even A Mild Recession Could Significantly Knock Down Earnings Estimates
Even A Mild Recession Could Significantly Knock Down Earnings Estimates
Even A Mild Recession Could Significantly Knock Down Earnings Estimates
Subjectively, we would expect the S&P 500 to drop to 3,500 over the next 12 months in a mild recession scenario where growth falls into negative territory for a few quarters (30% odds) and to 2,900 in a deep recession scenario where the unemployment rate rises by more than four percentage points from current levels (10% odds). On the flipside, we would expect the S&P 500 to rebound to 4,500 in a scenario where a recession is completely averted (60% odds). A probability-weighted average of these three scenarios produces an expected total return of 8.3% (Table 1). This is enough to warrant a modest overweight to stocks, but just barely. Barring any material developments, we would turn neutral on stocks if the S&P 500 were to rise above 4,050. Table 1A Scenario Analysis For The S&P 500
What If The TIPS Are Right?
What If The TIPS Are Right?
What’s the Right Framework for Thinking About a European Recession? Whereas we would assign 40% odds to a recession in the US over the next 12 months, we would put the odds of a recession in Europe at around 60%. With a recession in Europe looking increasingly probable, a key question is what the nature of this recession would be. The pandemic may provide a useful framework for answering that question. Just as the pandemic represented an external shock to the global economy, the disruption to energy supplies, stemming from Russia’s invasion of Ukraine, represents an external shock to the European economy. In the initial phase of the pandemic, economic activity in developed economies collapsed as millions of workers were forced to isolate at home. Over the following months, however, the proliferation of work-from-home practices, the easing of lockdown measures, and ample fiscal support permitted growth to recover. Eventually, vaccines became available, which allowed for a further shift to normal life. Just as it took about two years for vaccines to become widely deployed, it will take time for Europe to wean itself off its dependence on Russian natural gas. Earlier this year, the IEA reckoned that the EU could displace more than a third of Russian gas imports within a year. The more ambitious REPowerEU plan foresees two-thirds of Russian gas being displaced by the end of 2022. In the meantime, some Russian gas will be necessary. Canada’s decision over Ukrainian objections to return a repaired turbine to Germany for use in the Nord Stream 1 gas pipeline suggests that a full cutoff of Russian gas flows is unlikely. Chart 14The Euro Is 26% Undervalued Against The Dollar Based On PPP
The Euro Is 26% Undervalued Against The Dollar Based On PPP
The Euro Is 26% Undervalued Against The Dollar Based On PPP
During the pandemic, governments wasted little time in passing legislation to ease the burden on households and businesses. The European energy crunch will elicit a similar response. Back when I worked at the IMF, a common mantra in designing lending programs was that one should “finance temporary shocks but adjust to permanent ones.” The current situation Europe is a textbook example for the merits of providing income support to the private sector, financed by temporarily larger public deficits. The ECB’s soon-to-be-launched “anti-fragmentation” program will allow the central bank to buy the government debt of Italy and other at-risk sovereign borrowers without the need for a formal European Stability Mechanism (ESM) program, provided that the long-term debt profile of the borrowers remains sustainable. Get Ready to Buy the Euro All this suggests that Europe could see a fairly brisk rebound after the energy crunch abates. If the euro area recovers quickly, the euro – which is now about as undervalued against the dollar as anytime in its history (Chart 14) – will soar. With that in mind, we are setting a limit order to buy EUR/USD at 0.981. Peter Berezin Chief Global Strategist peterb@bcaresearch.com Follow me on LinkedIn & Twitter Global Investment Strategy View Matrix
What If The TIPS Are Right?
What If The TIPS Are Right?
Special Trade Recommendations Current MacroQuant Model Scores
What If The TIPS Are Right?
What If The TIPS Are Right?
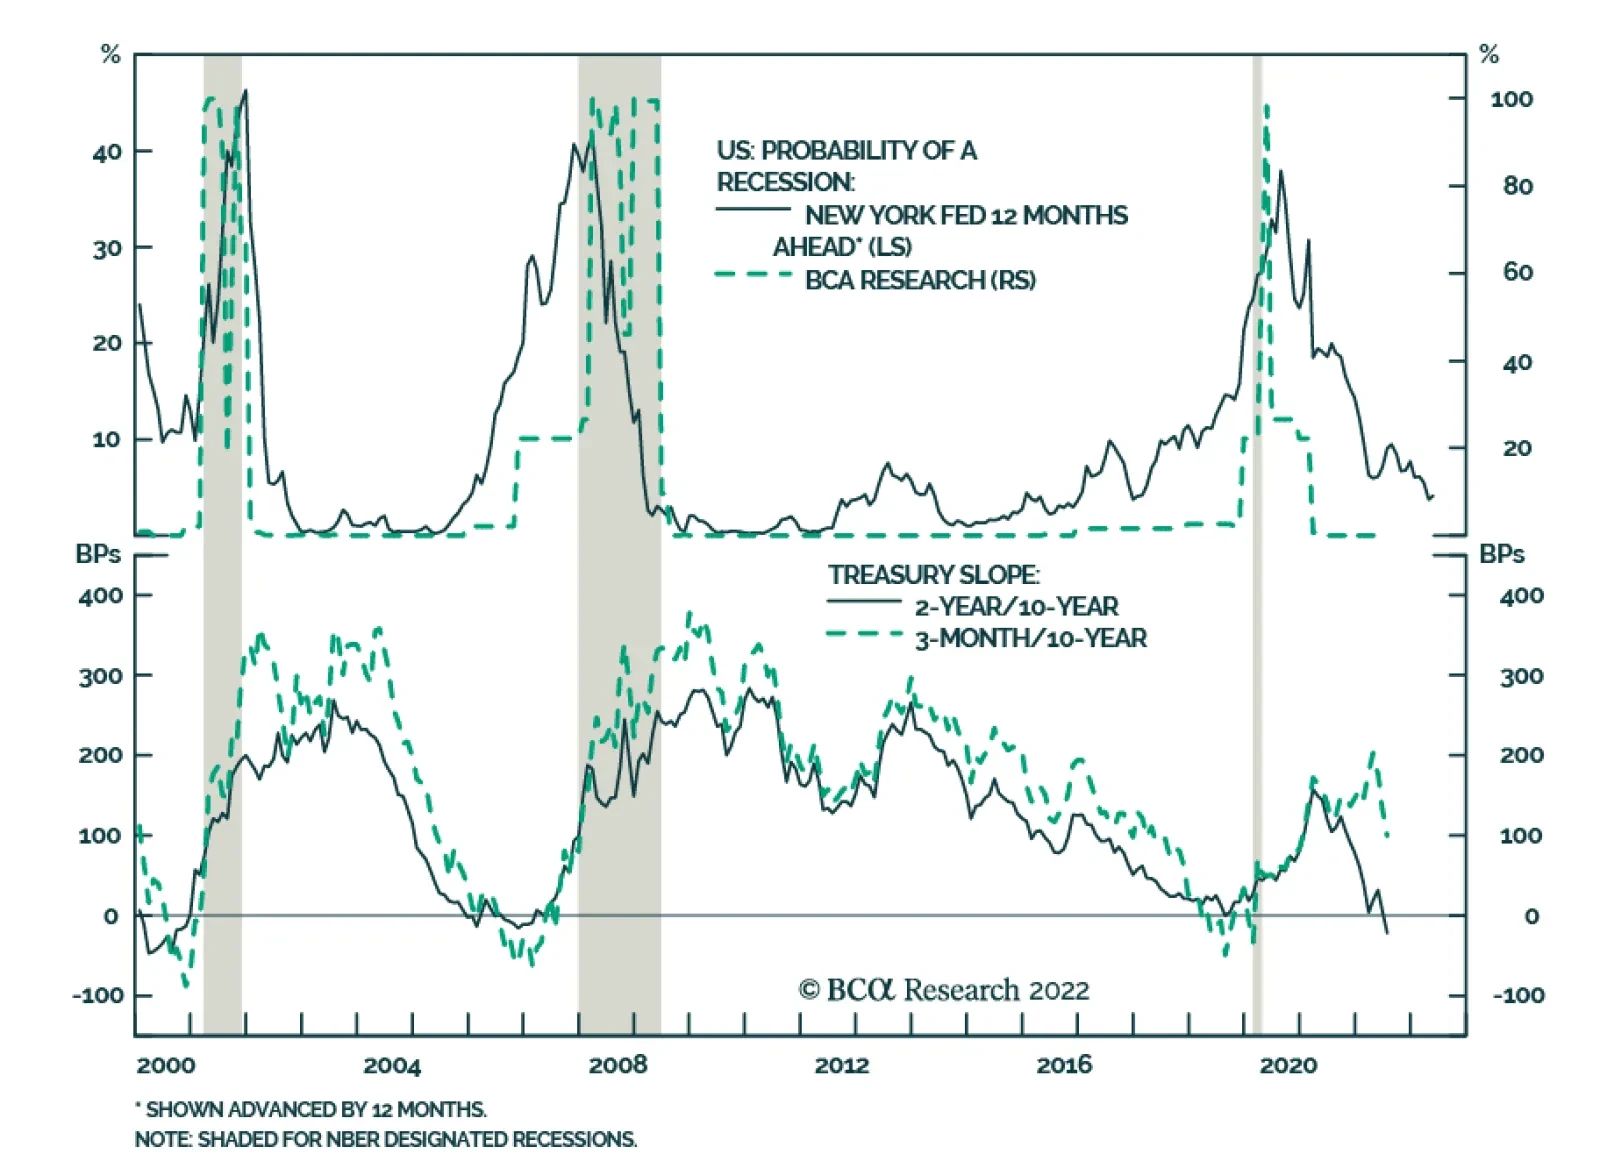
The Atlanta Fed’s GDPNow model is sending an extremely pessimistic signal about the US economy. However, formal recession models maintained by regional Feds do not suggest that a recession is imminent. The June reading of the New York Fed’s version – based on…
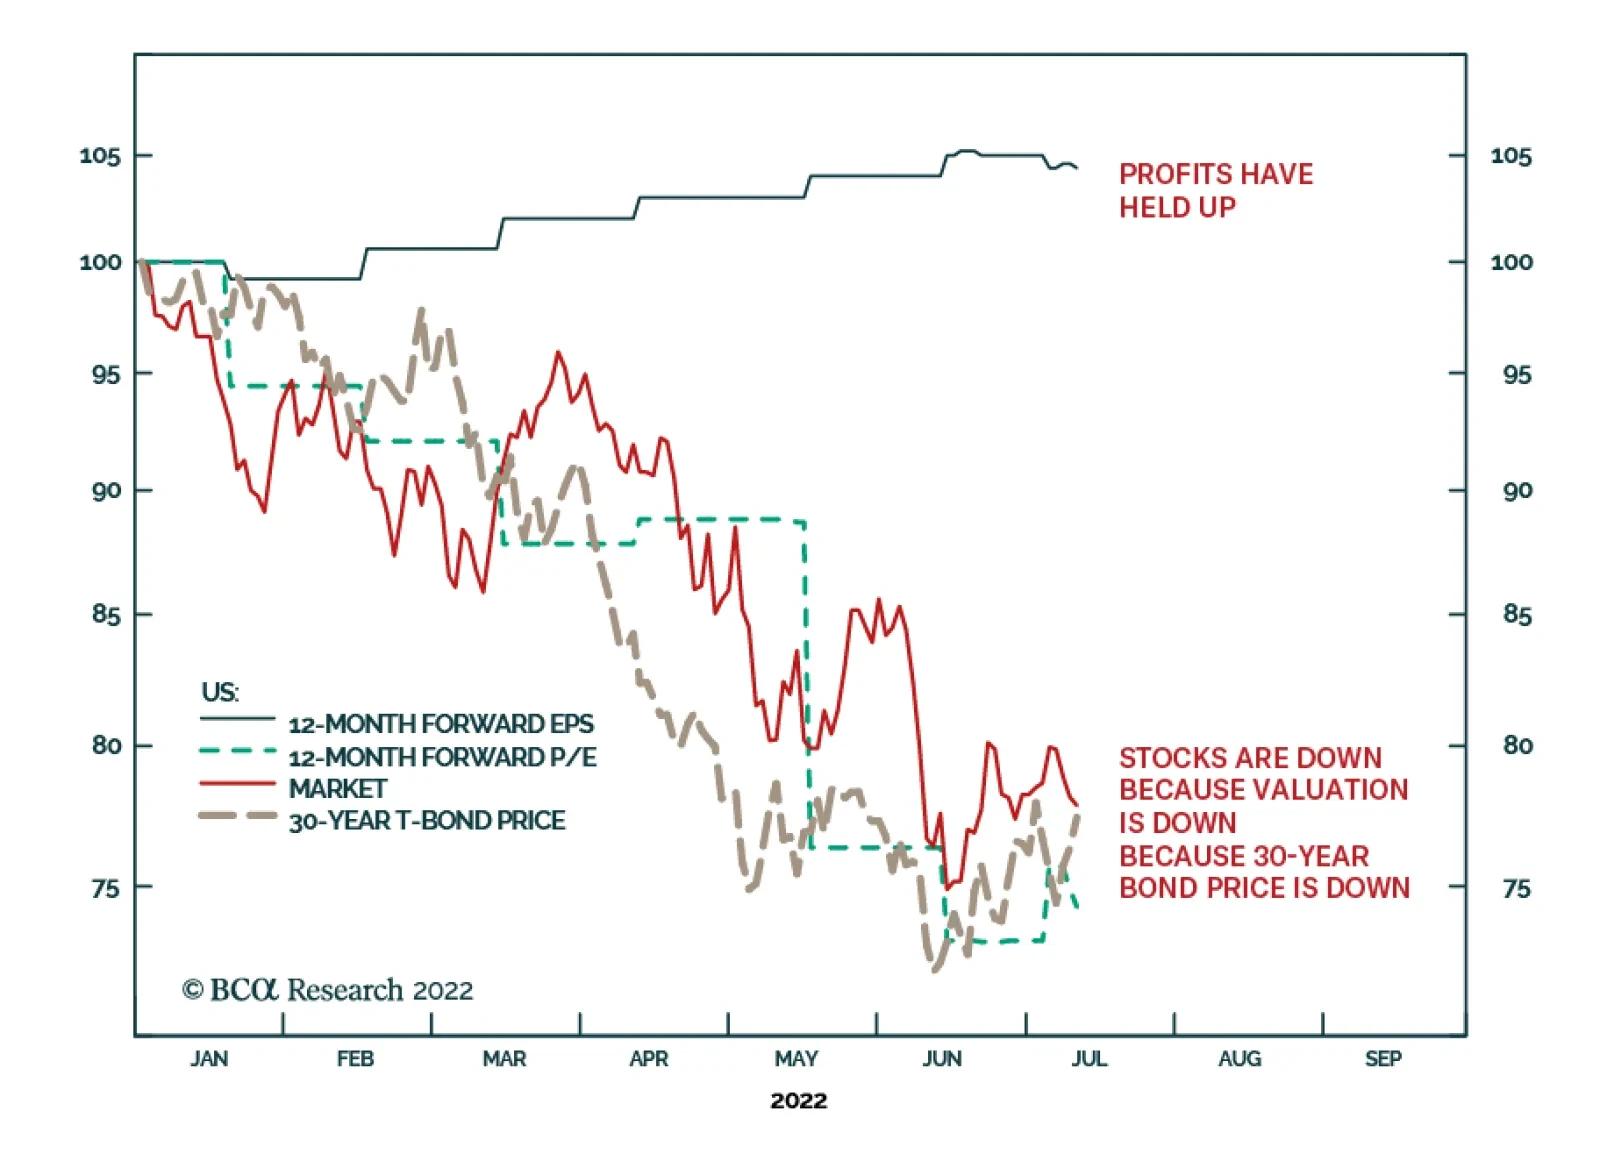
According to BCA Research’s Counterpoint Service, the stock market has not yet discounted a recession. Does the 2022 bear market mean that it has already discounted a recession? No, this year’s bear market is entirely due to a collapse in valuations.…
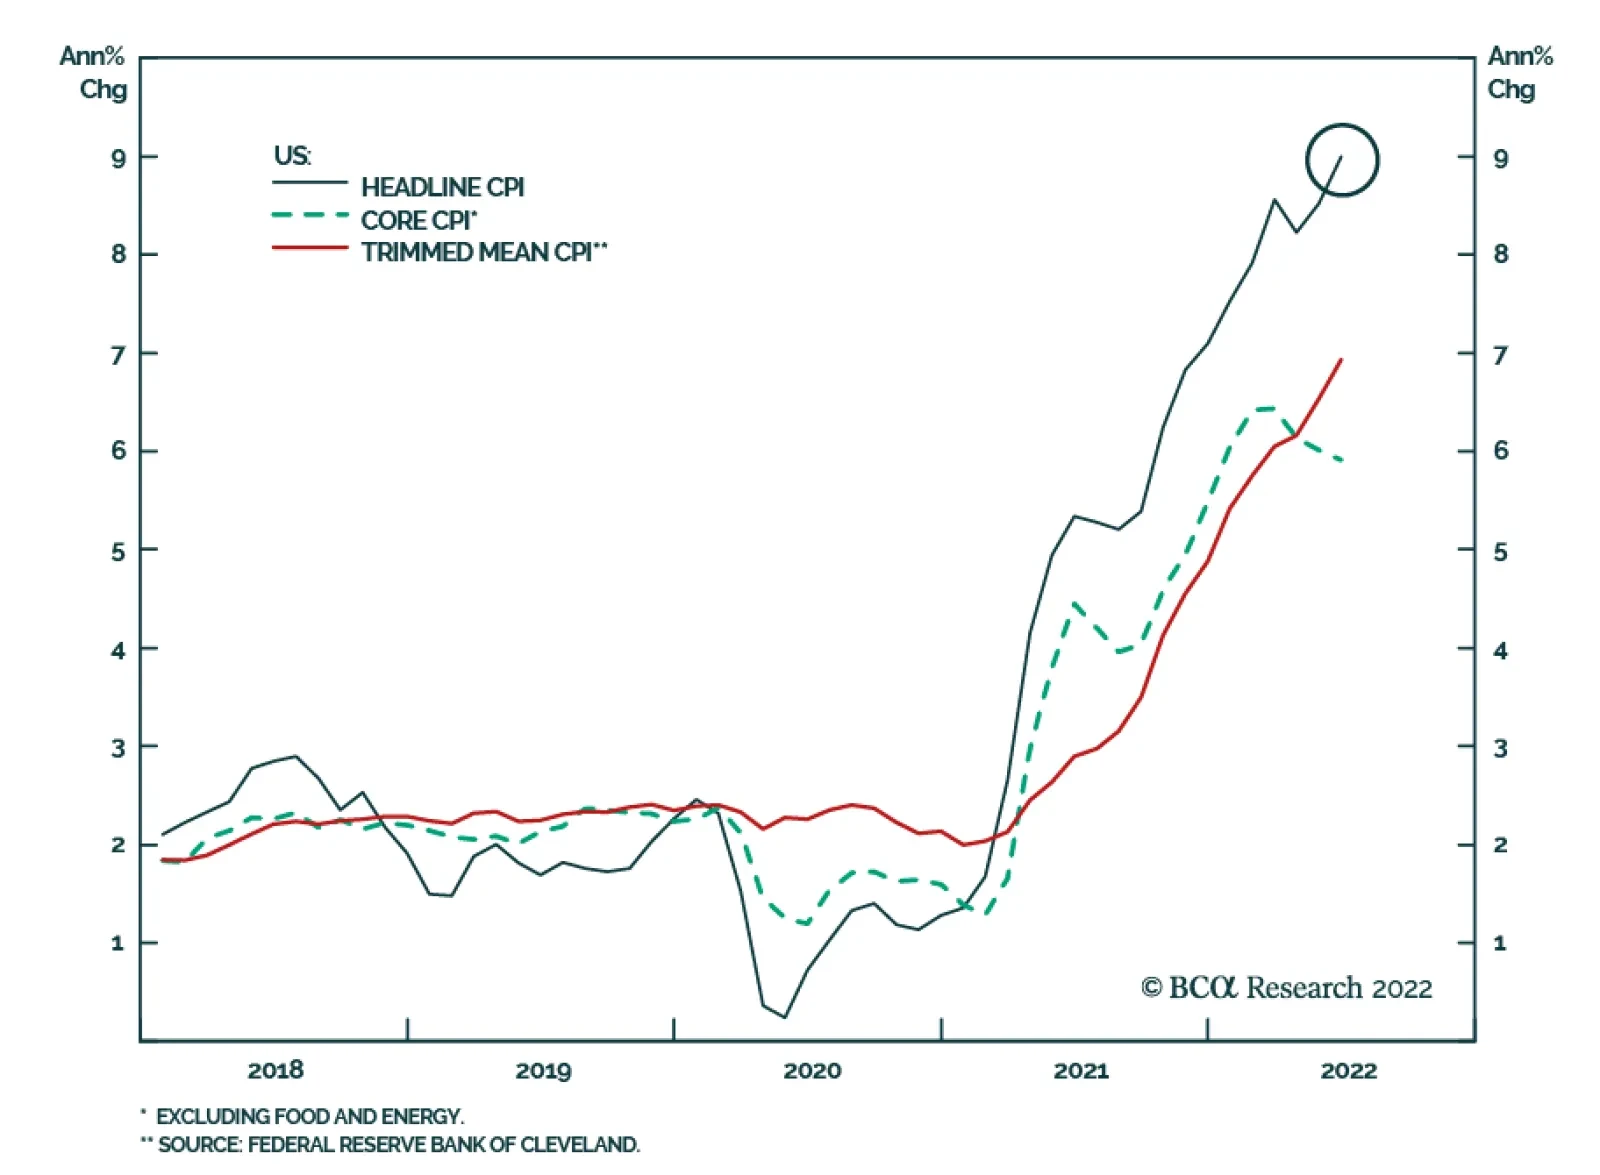
US headline CPI rose by a stronger-than-expected 9.1% y/y from 8.6% y/y (1.3% m/m from 1.0% m/m) in June, topping expectations of a milder increase. Gasoline, shelter and food continue to drive headline CPI. Notably, the core measure also firmed on a…
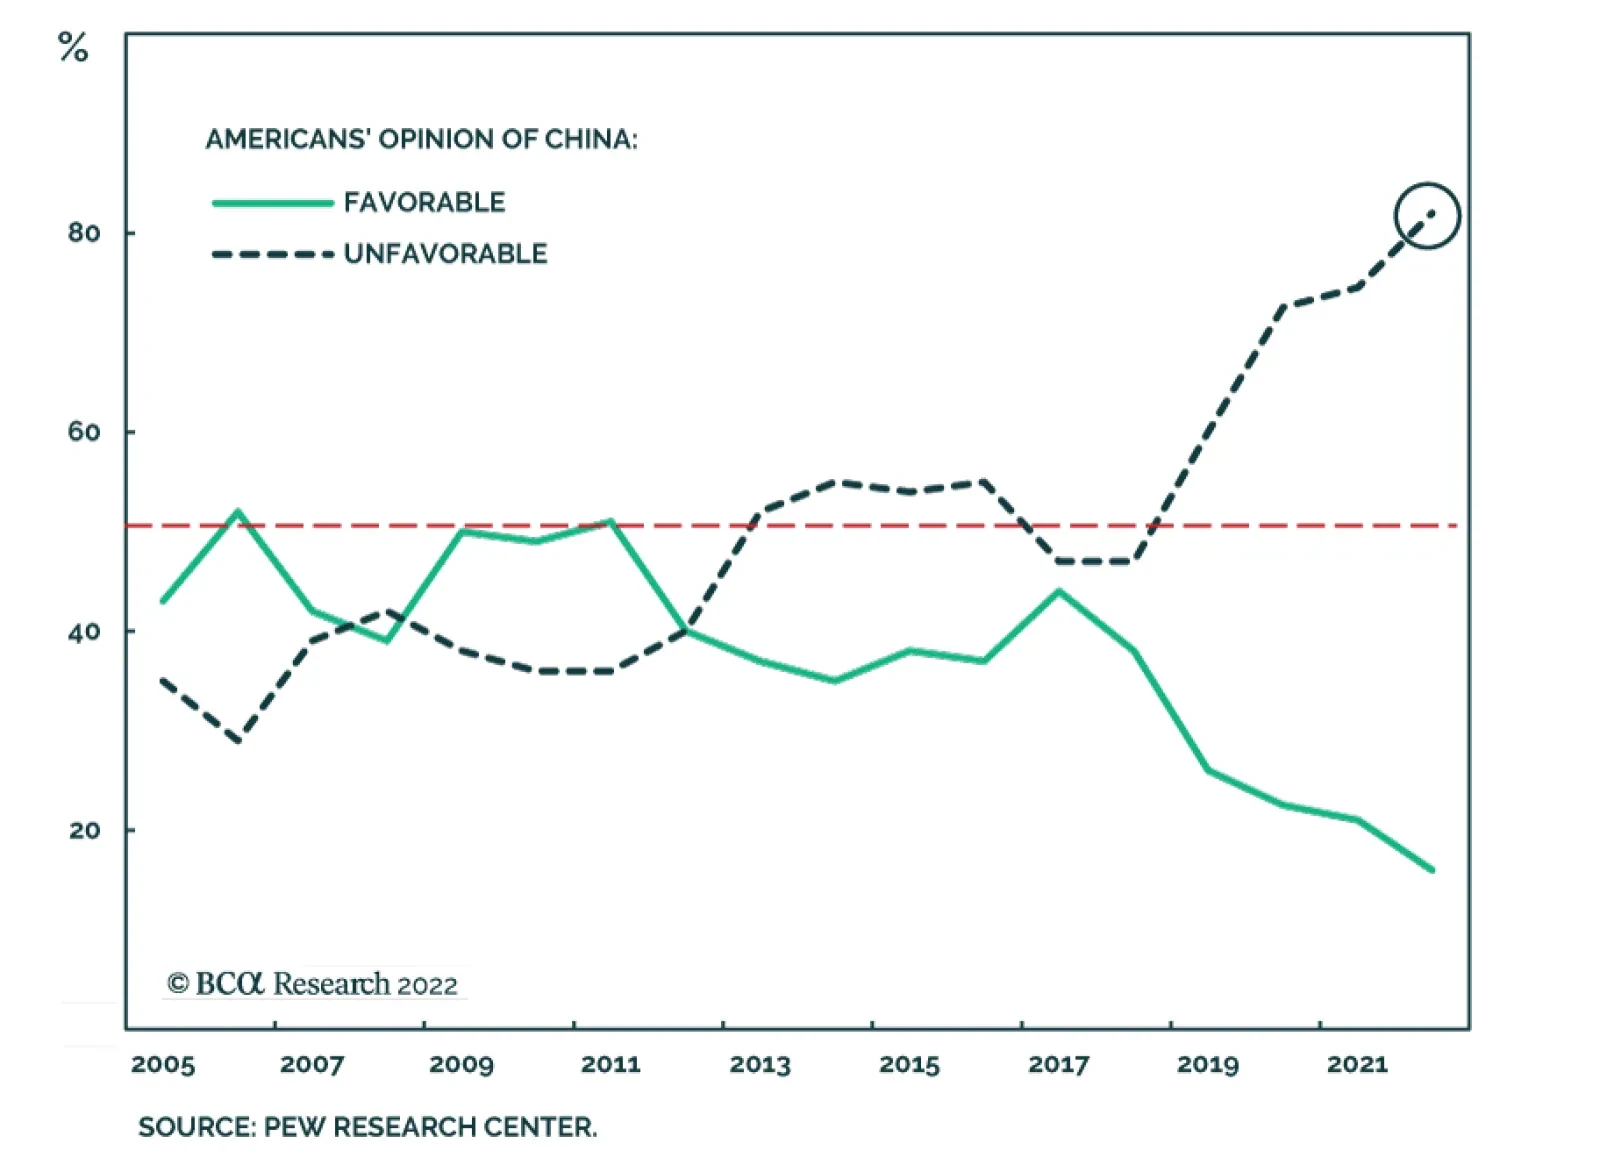
A decision is expected shortly on whether President Joe Biden will roll back some of the Trump-era tariffs on imports from China. Voices within President Biden’s administration are divided. US Treasury Secretary Janet Yellen is among those in favor of…
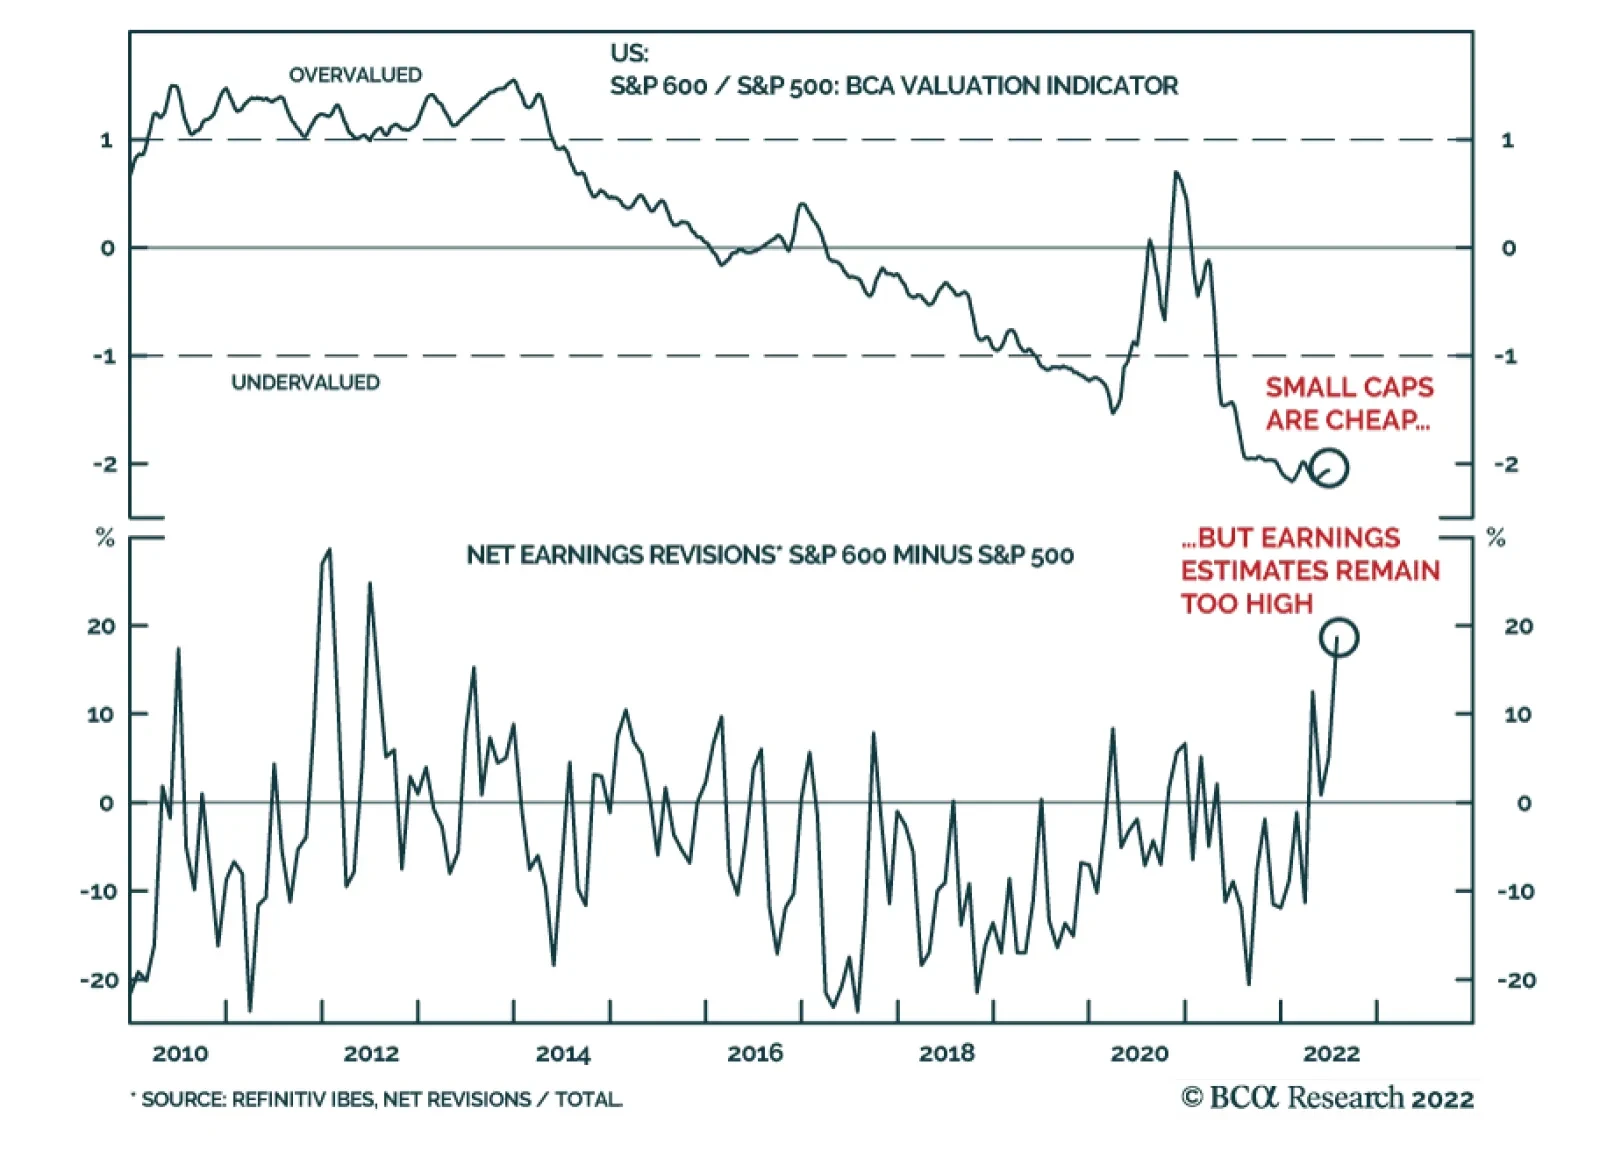
Small caps have been underperforming their large cap counterparts since October 2021. Indeed, these highly cyclical stocks tend to underperform larger companies when the business cycle slows down. Their relatively higher allocation to regional banks also…
Executive Summary Bond investors can’t seem to decide whether the US economy is in the midst of an inflationary boom or hurtling toward recession. Our sense is that, while US economic growth is clearly slowing, we don’t see the unemployment rate rising enough for the Fed to abandon its tightening cycle any time soon. The 5-year US Treasury yield has tightened relative to the rest of the curve in recent weeks, and the 2-year maturity now looks like the most attractive spot for investors. TIPS breakeven inflation rates have also declined markedly in recent weeks, and TIPS no longer look expensive on our models. TIPS Are No Longer Expensive
TIPS Are No Longer Expensive
TIPS Are No Longer Expensive
Bottom Line: US bond investors should keep portfolio duration close to benchmark. They should also shift Treasury curve allocations from the 5-year maturity to the 2-year maturity and upgrade TIPS from underweight to neutral. Whipsaw Inflationary boom or recession? US bond investors can’t seem to decide and yields are swinging back and forth depending on the latest economic data. Just in the past month we’ve seen the 10-year US Treasury yield peak at 3.49%, fall to 2.82% and then finally move back above 3% following last week’s strong employment report. Not surprisingly, implied interest rate volatility is the highest it’s been since the Global Financial Crisis (Chart 1). Our sense is that, while US economic growth is clearly slowing, we don’t see the unemployment rate rising enough for the Fed to abandon its tightening cycle any time soon. This is especially true because the Fed will tolerate a significant rise in the unemployment rate as long as inflation stays above target.1 Turning to the evidence, decelerating US economic activity is apparent in the manufacturing and non-manufacturing PMIs, which are both falling rapidly from high levels (Chart 2). Though both indexes remain firmly above the 50 boom/bust line, trends in financial conditions suggest that they could dip below 50 within the next few months. Chart 1A Highly Volatile Rates Market
A Highly Volatile Rates Market
A Highly Volatile Rates Market
Chart 2US Growth Is Slowing
US Growth Is Slowing
US Growth Is Slowing
The employment components of both indexes are already in contractionary territory (Chart 2, bottom panel), but this is due to concerns about labor supply, not demand. For example, last week’s ISM non-manufacturing PMI release included three representative quotes from respondents about labor market conditions.2 All three quotes reference concerns about labor supply: Unable to fill positions with qualified applicants. Extremely hard to find truck drivers. Demand for talent is higher, but availability of candidates to fill open roles continues to keep employment levels from increasing. This doesn’t sound like an economy that is on the cusp of surging unemployment, and this is exactly what the Fed is counting on. The Fed’s hope is that slower demand will bring down the large number of job openings without leading to a significant increase in layoffs or a significant rise in the unemployment rate. In that regard, it is notable that job openings ticked down in May, both in absolute terms and relative to the number of unemployed. Meanwhile, the rates of hiring and layoffs held steady (Chart 3). Chart 3Some Hope For A Soft Landing
Some Hope For A Soft Landing
Some Hope For A Soft Landing
Investment Implications Our investment strategy hinges on two key economic views related to the labor market and inflation. First, while a surge doesn’t seem imminent, slowing economic activity means that the unemployment rate is more likely to edge higher between now and the end of the year than it is to fall. Second, as we’ve written in previous reports, US inflation has a relatively easy path back to its underlying trend of approximately 4%.3 After that, it will be more difficult for policymakers to bring inflation from 4% back down to 2%, and we could see the Fed push rates above 4% next year to accomplish this task. Taken together, these two views suggest that growth will be slowing and inflation falling between now and the end of the year. This combination could easily push bond yields lower, especially if recession worries flare up again. High frequency bond yield indicators such as the CRB Raw Industrials / Gold ratio and the relative performance of cyclical versus defensive equities also suggest that bond yields have room to fall (Chart 4). That said, the market is currently priced for the fed funds rate to peak at 3.74% in May 2023 and to fall back to 3.19% by the end of 2023. We see strong odds that inflation will be sticky enough (and the labor market resilient enough) for the Fed to push rates above those levels next year. This leaves us with an ‘at benchmark’ stance on portfolio duration for the time being, with an inclination to turn more bearish on bonds later this year if our base case forecast pans out. More specifically, we would likely reduce portfolio duration if the 10-year Treasury yield falls back to 2.5% or if inflation reverts to its 4% underlying trend. Conversely, we will turn more bullish on bonds if we see signs in the labor market data that point to a Fed pause (or Fed rate cuts) being necessary. For now, growth in nonfarm employment and aggregate weekly payrolls (wages x hours x employment) suggest we aren’t close to this outcome (Chart 5). Chart 4High-Frequency Bond Yield Indicators
High-Frequency Bond Yield Indicators
High-Frequency Bond Yield Indicators
Chart 5The US Labor Market Is Strong
The US Labor Market Is Strong
The US Labor Market Is Strong
Sliding Down The Yield Curve Since early April we’ve been recommending that investors position long the 5-year Treasury note and short a duration-matched barbell consisting of the 2-year and 10-year notes to take advantage of a US yield curve that was quite steep out to the 5-year maturity point and quite flat beyond that. That trade is now played out. The 5 over 2/10 butterfly spread has tightened back to zero and the 2-year note is now the most attractively priced security on the US Treasury curve. Chart 6 shows that the spread between the 2-year note and a duration-matched barbell consisting of cash and the 5-year note offers an extraordinary yield advantage of 92 bps. What’s more, Table 1 shows that, with the exception of the unloved 20-year bond, the 2-year note offers the most attractive 12-month carry on the curve, largely a result of the 18 bps of rolldown attributable to the still-steep slope between the 1-year and 2-year maturity points. Chart 6Shift Into 2s
Shift Into 2s
Shift Into 2s
Table 112-Month Carry Across The US Treasury Curve
A Low Conviction US Bond Market
A Low Conviction US Bond Market
This large shift in relative pricing compels us to close our prior position (long 5-year bullet versus 2/10 barbell) and open a new position: long the 2-year note and short a duration-matched cash/5 barbell. This new position (long 2yr over cash/5) offers attractive 12-month carry, but given the current volatile interest rate environment, it should mainly be expected to profit in the event of a steepening of the 2/5 Treasury slope. With that in mind, it’s notable that the 2/5 slope recently inverted. Inversions of the 2/5 slope are historically rare. They tend to occur near the end of Fed tightening cycles and, with the exception of the early-1980s, they tend to not last that long (Chart 7). Chart 72/5 Inversions Are Rare And Fleeting
2/5 Inversions Are Rare And Fleeting
2/5 Inversions Are Rare And Fleeting
Going forward, we see three plausible scenarios for the 2/5 slope during the next 6-12 months. First, the Fed achieves something close to the soft landing it is aiming for. Inflation starts to fall and the unemployment rate edges higher. However, unemployment never reaches levels that necessitate a complete reversal of Fed tightening. The 2/5 Treasury slope bear-steepens in this scenario as the market discounts that the Fed will have to push rates above 4% to hit its inflation target. Second, a deep recession and complete reversal of Fed tightening occur much more quickly than we anticipate. The 2/5 Treasury slope would bull-steepen in this scenario as the front-end of the curve is pulled down by the Fed’s pivot. Third, inflation shows no signs of reversing course. Long-dated inflation expectations jump and the Fed determines that it has no choice but to follow the example of Paul Volcker and tighten, even if the economy falls into a deep recession. As was the case in the early-1980s, the 2/5 Treasury slope could become deeply inverted in this scenario. Our sense is that the first two scenarios are much more likely than the third. We have written in prior reports about how the current spate of inflation is much different than what was seen in the early 1980s.4 This makes us willing to bet against a prolonged deep inversion of the 2/5 slope. Bottom Line: US Treasury curve investors should exit their positions long the 5-year bullet versus a duration-matched 2/10 barbell. They should initiate a position long the 2-year bullet versus a duration-matched cash/5 barbell. Upgrade US TIPS To Neutral Finally, we note that TIPS breakeven inflation rates have declined markedly during the past month. The 10-year TIPS breakeven inflation rate is currently 2.38%, near the lower-end of the Fed’s 2.3%-2.5% target range, and the 5-year/5-year forward TIPS breakeven inflation rate is a mere 2.12%, well below target (Chart 8). We also note that the 5-year/5-year forward TIPS breakeven inflation rate is back below survey estimates of what inflation will be 5-10 years in the future (Chart 8, bottom panel). Chart 8TIPS Breakevens
TIPS Breakevens
TIPS Breakevens
We have been recommending an underweight position in TIPS versus nominal US Treasuries since early April, but the recent valuation shift means it’s time to add some exposure. Critically, our TIPS Breakeven Valuation Indicator has also increased to +0.6, moving into “TIPS cheap” territory (Chart 9). Historically, the 10-year TIPS breakeven inflation rate has averaged an increase of 28 bps in the 12 months following a reading between +0.5 and +1.0 from our Indicator (Table 2). Chart 9TIPS Are No Longer Expensive
TIPS Are No Longer Expensive
TIPS Are No Longer Expensive
Table 2TIPS Breakeven Valuation Indicator Track Record
A Low Conviction US Bond Market
A Low Conviction US Bond Market
The drop in TIPS breakeven inflation rates has been most prominent at the front-end of the curve. The 2-year TIPS breakeven inflation rate is down to 3.22% from a peak of 4.93%. The high correlation between short-maturity TIPS breakevens and realized CPI inflation means that short-dated breakevens can fall further as inflation continues to trend down, but already we see that 3.22% looks like a much more reasonable estimate of average inflation for the next two years than did the 4.93% peak. While we advise investors to upgrade TIPS from underweight to neutral relative to nominal US Treasuries, we continue to recommend an outright short position in 2-year TIPS. The 2-year TIPS yield has risen sharply since its 2021 low (Chart 10), but recent comments from Fed officials imply that the Fed would like to see positive real yields across the entire curve before it declares monetary policy sufficiently restrictive.5 This means that there is still some room for the 2-year TIPS yield to increase, from its current level of -0.10% back into positive territory. Such a move should also lead to more flattening of the 2/10 TIPS curve, and we continue to recommend holding that position as well (Chart 10, bottom panel). Chart 10Stay Short 2-Year TIPS
Stay Short 2-Year TIPS
Stay Short 2-Year TIPS
Bottom Line: Investors should upgrade TIPS from underweight to neutral relative to nominal US Treasuries but maintain outright short positions in 2-year TIPS. 2/10 TIPS curve flatteners and 2/10 inflation curve steepeners also continue to make sense. Ryan Swift US Bond Strategist rswift@bcaresearch.com Footnotes 1 For more details on how to think about the tradeoff between the Fed’s inflation and employment goals please see US Bond Strategy Weekly Report, “When The Dual Mandates Clash”, dated June 28, 2022. 2 https://www.ismworld.org/supply-management-news-and-reports/reports/ism-report-on-business/services/june/ 3 Please see US Bond Strategy / Global Fixed Income Strategy Weekly Report, “No End In Sight For Fed Tightening”, dated June 21, 2022. 4 Please see US Bond Strategy Weekly Report, “No Relief From High Inflation”, dated June 14, 2022. 5 Please see US Bond Strategy Weekly Report, “When The Dual Mandates Clash”, dated June 28, 2022. Recommended Portfolio Specification Other Recommendations Treasury Index Returns Spread Product Returns
Stronger-than-expected job gains in June increase the odds that the Fed will lift interest rates by another 75bps when it meets again in two weeks. Data released this week will either cement the case for another mega hike, or instead provide support for a…
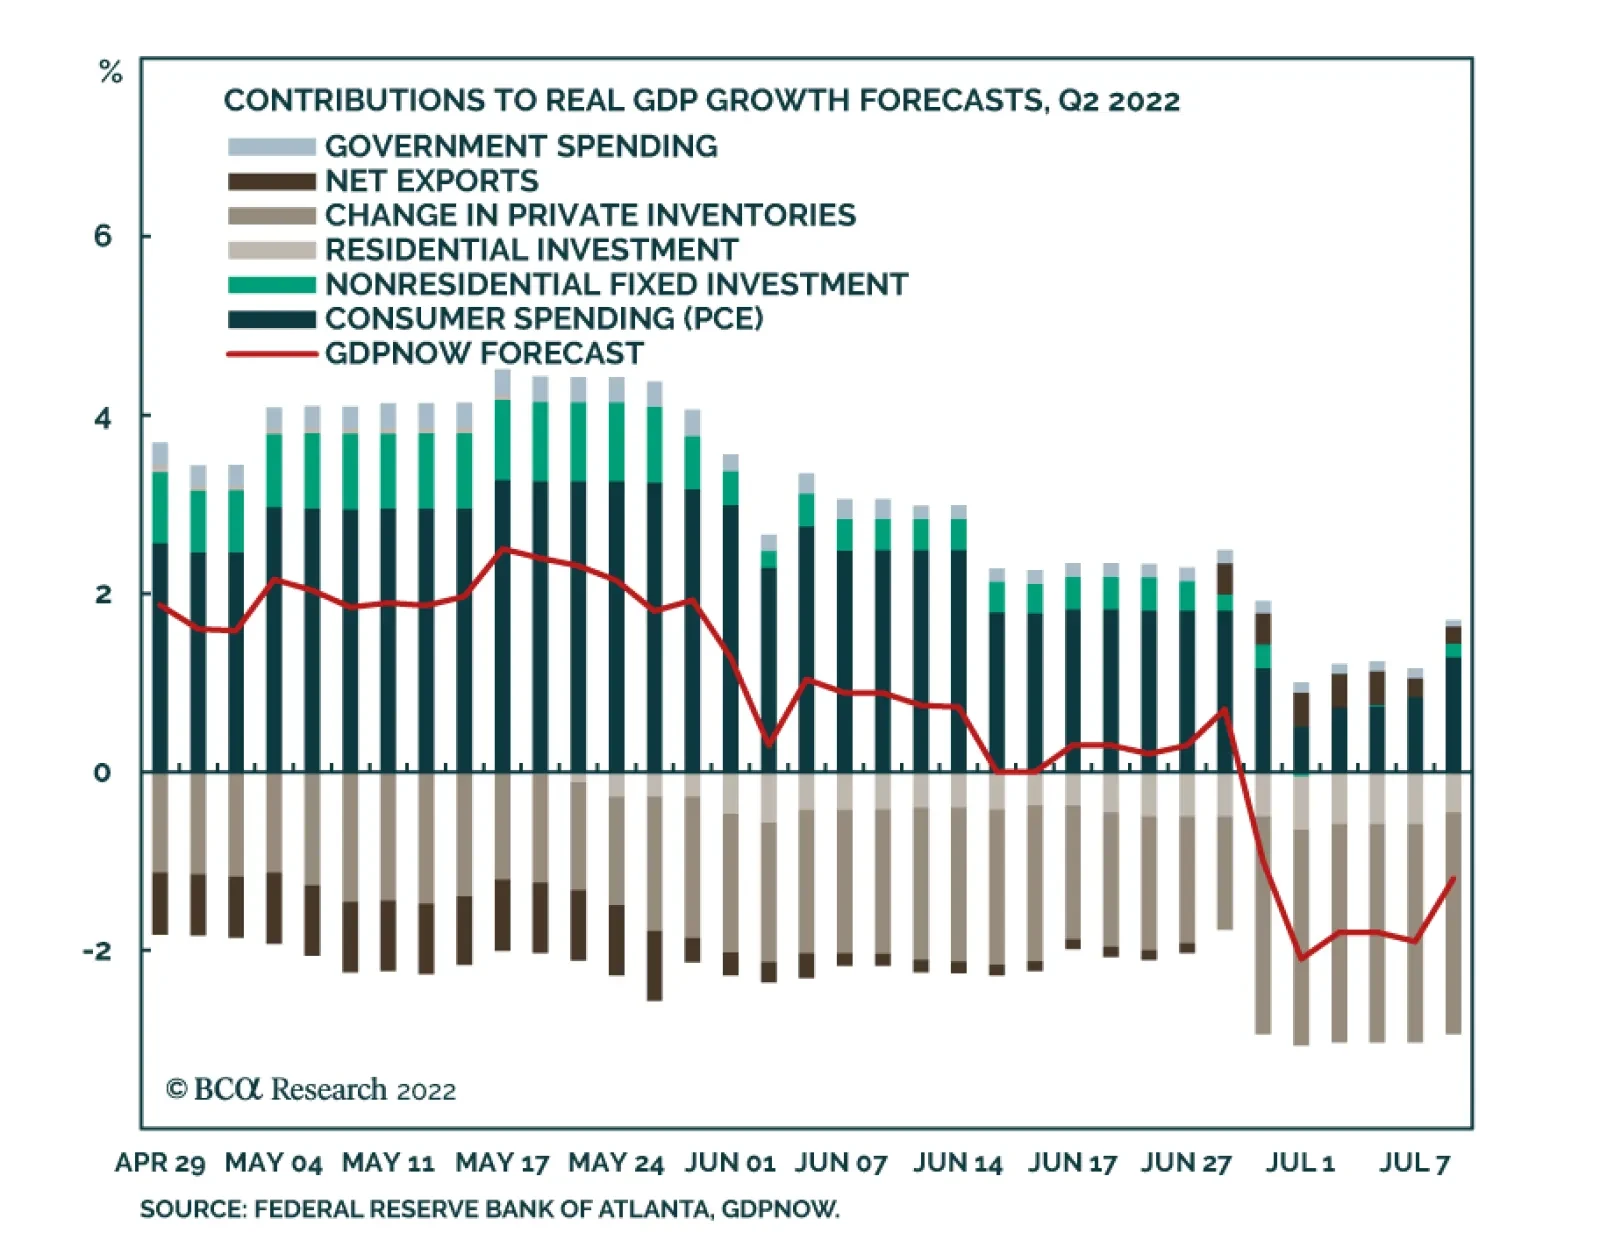
The Atlanta Fed’s GDPNow model is sending an extremely pessimistic signal about the US economy. Since mid-May, its estimates of Q2 GDP growth have been consistently deteriorating. Although June’s robust non-farm payroll release led to an upward revision, the…