United States

Executive Summary Russia Squeezes EU Natural Gas
Russia Squeezes EU Natural Gas
Russia Squeezes EU Natural Gas
Major geopolitical shocks tend to coincide with bear markets, so the market is getting closer to pricing this year’s bad news. But investors are not out of the woods yet. Russia is cutting off Europe’s natural gas supply ahead of this winter in retaliation to Europe’s oil embargo. Europe is sliding toward recession. China is reverting to autocratic rule and suffering a cyclical and structural downshift in growth rates. Only after Xi Jinping consolidates power will the ruling party focus exclusively on economic stabilization. The US can afford to take risks with Russia, opening up the possibility of a direct confrontation between the two giants before the US midterm election. A new strategic equilibrium is not yet at hand. Tactical Recommendation Inception Date Return LONG GLOBAL DEFENSIVES / CYCLICALS EQUITIES 2022-01-20 18.3% Bottom Line: Maintain a defensive posture in the third quarter but look for opportunities to buy oversold assets with long-term macro and policy tailwinds. Feature 2022 is a year of geopolitics and supply shocks. Global investors should remain defensive at least until the Chinese national party congress and US midterm election have passed. More fundamentally, an equilibrium must be established between Russia and NATO and between the US and Iran. Until then supply shocks will destroy demand. Checking Up On Our Three Key Views For 2022 Our three key views for the year are broadly on track: 1. China’s Reversion To Autocracy: For ten years now, the fall in Chinese potential economic growth has coincided with a rise in neo-Maoist autocracy and foreign policy assertiveness, leading to capital flight, international tensions, and depressed animal spirits (Chart 1). Related Report Geopolitical StrategyWill China Let 100 Flowers Bloom? Only Briefly. Rising incomes provided legitimacy for the Communist Party over the past four decades. Less rapidly rising incomes – and extreme disparities in standards of living – undermine the party and force it to find other sources of public support. Fighting pollution and expanding the social safety net are positives for political stability and potentially for economic productivity. But converting the political system from single-party rule to single-person rule is negative for productivity. Mercantilist trade policy and nationalist security policy are also negative. China’s political crackdown, struggle with Covid-19, waning exports, and deflating property market have led to an abrupt slowdown this year. The government is responding by easing monetary, fiscal, and regulatory policy, though so far with limited effect (Chart 2). Economic policy will not be decisive in the third quarter unless a crash forces the administration to stimulate aggressively. Chart 1China's Slowdown Leads To Maoism, Nationalism
China's Slowdown Leads To Maoism, Nationalism
China's Slowdown Leads To Maoism, Nationalism
Chart 2Chinese Policy Easing: Limited Effect So Far
Chinese Policy Easing: Limited Effect So Far
Chinese Policy Easing: Limited Effect So Far
Chart 3Nascent Rally In Chinese Shares Will Be Dashed
Nascent Rally In Chinese Shares Will Be Dashed
Nascent Rally In Chinese Shares Will Be Dashed
Once General Secretary Xi Jinping secures another five-to-ten years in power at the twentieth national party congress this fall, he will be able to “let 100 flowers bloom,” i.e. ease policy further and focus exclusively on securing the economic recovery in 2023. But policy uncertainty will remain high until then. The party may have to crack down anew to ensure Xi’s power consolidation goes according to plan. China is highly vulnerable to social unrest for both structural and cyclical reasons. The US would jump to slap sanctions on China for human rights abuses. Hence the nascent recovery in Chinese domestic and offshore equities can easily be interrupted until the political reshuffle is over (Chart 3). If China’s economy stabilizes and a recession is avoided, investors will pile into the rally, but over the long run they will still be vulnerable to stranded capital due to Chinese autocracy and US-China cold war. If the Politburo and Politburo Standing Committee are stacked with members of Xi’s faction, as one should expect, then the reduction in policy uncertainty will only be temporary. Autocracy will lead to unpredictable and draconian policy measures – and it cannot solve the problem of a shrinking and overly indebted population. If the Communist Party changes course and stacks the Politburo with Xi’s factional rivals, to prevent China from going down the Maoist, Stalinist, and Putinist route, then global financial markets will cheer. But that outcome is unlikely. Hawkish foreign policy means that China will continue to increase its military threats against Taiwan, while not yet invading outright. Beijing has tightened its grip over Tibet, Xinjiang, and Hong Kong since 2008; Taiwan and the South China Sea are the only critical buffer areas that remain to be subjugated. Taiwan’s midterm elections, US midterms, and China’s party congress will keep uncertainty elevated. Taiwan has underperformed global and emerging market equities as the semiconductor boom and shortage has declined (Chart 4). Hong Kong is vulnerable to another outbreak of social unrest and government repression. Quality of life has deteriorated for the native population. Democracy activists are disaffected and prone to radicalization. Singapore will continue to benefit at Hong Kong’s expense (Chart 5). Chart 4Taiwan Equity Relative Performance Peaked
Taiwan Equity Relative Performance Peaked
Taiwan Equity Relative Performance Peaked
Chart 5Hong Kong Faces More Troubles
Hong Kong Faces More Troubles
Hong Kong Faces More Troubles
Chart 6Japan Undercuts China
Japan Undercuts China
Japan Undercuts China
China and Japan are likely to engage in clashes in the East China Sea. Beijing’s military modernization, nuclear weapons expansion, and technological development pose a threat to Japanese security. The gradual encirclement of Taiwan jeopardizes Japan’s vital sea lines of communication. Prime Minister Fumio Kishida is well positioned to lead the Liberal Democratic Party into the upper house election on July 10 – he does not need to trigger a diplomatic showdown but he would not suffer from it. Meanwhile China is hungry for foreign distractions and unhappy that Japan is reviving its military and depreciating its currency (Chart 6). A Sino-Japanese crisis cannot be ruled out, especially if the Biden administration looks as if it will lose its nerve in containing China. Financial markets would react negatively, depending on the magnitude of the crisis. North Korea is going back to testing ballistic missiles and likely nuclear weapons. It is expanding its doctrine for the use of such weapons. It could take advantage of China’s and America’s domestic politics to stage aggressive provocations. South Korea, which has a hawkish new president who lacks parliamentary support, is strengthening its deterrence with the United States. These efforts could provoke a negative response from the North. Financial markets will only temporarily react to North Korean provocations unless they are serious enough to elicit military threats from Japan or the United States. China would be happy to offer negotiations to distract the Biden administration from Xi’s power grab. South Korean equities will benefit on a relative basis as China adds more stimulus. 2. America’s Policy Insularity: President Biden’s net approval rating, at -15%, is now worse than President Trump’s in 2018, when the Republicans suffered a beating in midterm elections (Chart 7). Biden is now fighting inflation to try to salvage the elections for his party. That means US foreign policy will be domestically focused and erratic in the third quarter. Aside from “letting” the Federal Reserve hike rates, Biden’s executive options are limited. Pausing the federal gasoline tax requires congressional approval, and yet if he unilaterally orders tax collectors to stand down, the result will be a $10 billion tax cut – a drop in the bucket. Biden is considering waiving some of former President Trump’s tariffs on China, which he can do on his own. But doing so will hurt his standing in Rust Belt swing states without reducing inflation enough to get a payoff at the voting booth – after all, import prices are growing slower from China than elsewhere (Chart 8). He would also give Xi Jinping a last-minute victory over America that would silence Xi’s critics and cement his dictatorship at the critical hour. Chart 7Democrats Face Shellacking In Midterm Elections
Third Quarter Geopolitical Outlook: Thunder And Lightning
Third Quarter Geopolitical Outlook: Thunder And Lightning
Chart 8Paring Trump Tariffs Won't Reduce Inflation Much
Paring Trump Tariffs Won't Reduce Inflation Much
Paring Trump Tariffs Won't Reduce Inflation Much
Chart 9Only OPEC Can Help Biden - And Help May Come Late
Only OPEC Can Help Biden - And Help May Come Late
Only OPEC Can Help Biden - And Help May Come Late
Biden is offering to lift sanctions on Iran, which would free up 1.3 million barrels of oil per day. But Iran is not being forced to freeze its nuclear program by weak oil prices or Russian and Chinese pressure – quite the opposite. If Biden eases sanctions anyway, prices at the pump may not fall enough to win votes. Hence Biden is traveling to Saudi Arabia to make amends with Crown Prince Mohammed bin Salman. OPEC’s interest lies in producing enough oil to prevent a global recession, not in flooding the market on Biden’s whims to rescue the Democratic Party. Saudi and Emirati production may come but it may not come early in the third quarter. Lifting sanctions on Venezuela is a joke and Libya recently collapsed again (Chart 9). Even in dealing with Russia the Biden administration will exhibit an insular perspective. The US is not immediately threatened, like Europe, so it can afford to take risks, such as selling Ukraine advanced and long-range weapons and providing intelligence used to sink Russian ships. If Russia reacts negatively, a direct US-Russia confrontation will generate a rally around the flag that would help the Democrats, as it did under President John F. Kennedy in 1962 – one of the rare years in which the ruling party minimized its midterm election losses (Chart 10). The Cuban Missile Crisis counted more with voters than the earlier stock market slide. 3. Petro-States’ Geopolitical Leverage: Oil-producing states have immense geopolitical leverage this year thanks to the commodity cycle. Russia will not be forced to conclude its assault on Ukraine until global energy prices collapse, as occurred in 2014. In fact Russia’s leverage over Europe will be greatly reduced in the coming years since Europe is diversifying away from Russian energy exports. Hence Moscow is cutting natural gas flows to Europe today while it still can (Chart 11). Chart 10Biden Can Afford To Take Risks With Russia
Third Quarter Geopolitical Outlook: Thunder And Lightning
Third Quarter Geopolitical Outlook: Thunder And Lightning
Chart 11Russia Squeezes EU's Natural Gas
Russia Squeezes EU's Natural Gas
Russia Squeezes EU's Natural Gas
Chart 12EU/China Slowdown Will Weigh On World
Third Quarter Geopolitical Outlook: Thunder And Lightning
Third Quarter Geopolitical Outlook: Thunder And Lightning
Russia’s objective is to inflict a recession and cause changes in either policy or government in Europe. This will make it easier to conclude a favorable ceasefire in Ukraine. More importantly it will increase the odds that the EU’s 27 members, having suffered the cost of their coal and oil embargo, will fail to agree to a natural gas embargo by 2027 as they intend. Italy, for example, faces an election by June 2023, which could come earlier. The national unity coalition was formed to distribute the EU’s pandemic recovery funds. Now those funds are drying up, the economy is sliding toward recession, and the coalition is cracking. The most popular party is an anti-establishment right-wing party, the Brothers of Italy, which is waiting in the wings and can ally with the populist League, which has some sympathies with Russia. A recession could very easily produce a change in government and a more pragmatic approach to Moscow. The Italian economy is getting squeezed by energy prices and rising interest rates at the same time and cannot withstand the combination very long. A European recession or near-recession will cause further downgrades to global growth, especially when considering the knock-on effects in China, where the slowdown is more pronounced than is likely reported. The US economy is more robust but it will have to be very robust indeed to withstand a recession in Europe and growth recession in China (Chart 12). Russia does not have to retaliate against Finland and Sweden joining NATO until Turkey clears the path for them to join, which may not be until just before the Turkish general election due in June 2023. But imposing a recession on Europe is already retaliation – maybe a government change will produce a new veto against NATO enlargement. Russian retaliation against Lithuania for blocking 50% of its shipments to the Kaliningrad exclave is also forthcoming – unless Lithuania effectively stops enforcing the EU’s sanctions on Russian resources. Russia cannot wage a full-scale attack on the Baltic states without triggering direct hostilities with NATO since they are members of NATO. But it can retaliate in other ways. In a negative scenario Moscow could stage a small “accidental” attack against Lithuania to test NATO. But that would force Biden to uphold his pledge to defend “every inch” of NATO territory. Biden would probably do so by staging a proportionate military response or coordinating with an ally to do it. The target would be the Russian origin of attack or comparable assets in the Baltic Sea, the Black Sea, Ukraine, Belarus, or elsewhere. The result would be a dangerous escalation. Russia could also opt for cyber-attacks or economic warfare – such as squeezing Europe’s natural gas supply further. Ultimately Russia can afford to take greater risks than the US over Kaliningrad, other territories, and its periphery more broadly. That is the difference between Kennedy and Biden – the confrontation is not over Cuba. Russia is also likely to take a page out of Josef Stalin’s playbook and open a new front – not so much in Nicaragua as in the Middle East and North Africa. The US betrayal of the 2015 nuclear deal with Iran opens the opportunity for Russia to strengthen cooperation with Iran, stir up the Iranians’ courage, sell them weapons, and generate a security crisis in the Middle East. The US military would be distracted keeping peace in the Persian Gulf while the Europeans would lose their long-term energy alternative to Russia – and energy prices would rise. The Iranians – who also have leverage during a time of high oil prices – are not inclined to freeze their nuclear program. That would be to trade their long-term regime survival for economic benefits that the next American president can revoke unilaterally. Bottom Line: Xi Jinping is converting China back into an autocracy, the Biden administration lacks options and is willing to have a showdown with Russia, and the Putin administration is trying to inflict a European recession and political upheaval. Stay defensive. Checking Up On Our Strategic Themes For The 2020s As for our long-term themes, the following points are relevant after what we have learned in the second quarter: 1. Great Power Rivalry: The war in Ukraine has reminded investors of the primacy of national security. In an anarchic international system, if a single great nation pursues power to the neglect of its neighbors’ interests, then its neighbors need to pursue power to defend themselves. Before long every nation is out for itself. At least until a new equilibrium is established. For example, Russia’s decision to neutralize Ukraine by force is driving Germany to abandon its formerly liberal policy of energy cooperation in order to reduce Russia’s energy revenues and avoid feeding its military ambitions. Russia in turn is reducing natural gas exports to weaken Europe’s economy this winter. Germany will re-arm, Finland and Sweden will eventually join NATO, and Russia will underscore its red line against NATO bases or forces in Finland and Sweden. If this red line is violated then a larger war could ensue. Chart 13China Will Shift To Russian Energy
China Will Shift To Russian Energy
China Will Shift To Russian Energy
Until Russia and NATO come to a new understanding, neither Europe nor Russia can be secure. Meanwhile China cannot reject Russia’s turn to the east. China believes it may need to use force to prevent Taiwan independence at some point, so it must prepare for the US and its allies to treat it the same way that they have treated Russia. It must secure energy supply from Russia, Central Asia, and the Middle East via land routes that the US navy cannot blockade (Chart 13). Beijing must also diversify away from the US dollar, lest the Treasury Department freeze its foreign exchange reserves like it did Russia’s. Global investors will see diversification as a sign of China’s exit from the international order and preparation for conflict, which is negative for its economic future. However, the Russo-Chinese alliance presents a historic threat to the US’s security, coming close to the geopolitical nightmare of a unified Eurasia. The US is bound to oppose this development, whether coherently or not, and whether alone or in concert with its allies. After all, the US cannot offer credible security guarantees to negotiate a détente with China or Iran because its domestic divisions are so extreme that its foreign policy can change overnight. Other powers cannot be sure that the US will not suffer a radical domestic policy change or revolution that leads to belligerent foreign policy. Insecurity will drive the US and China apart rather than bringing them together. For example, Russia’s difficulties in Ukraine will encourage Chinese strategists to go back to the drawing board to adjust their plans for military contingencies in Taiwan. But the American lesson from Ukraine is to increase deterrence in Taiwan. That will provoke China and encourage the belief that China cannot wait forever to resolve the Taiwan problem. Until there is a strategic understanding between Russia and NATO, and the US and China, the world will remain in a painful and dangerous transitional phase – a multipolar disequilibrium. Chart 14Hypo-Globalization: Globalizing Less Than Potential
Third Quarter Geopolitical Outlook: Thunder And Lightning
Third Quarter Geopolitical Outlook: Thunder And Lightning
2. Hypo-Globalization: If national security rises to the fore, then economics becomes a tool of state power. Mercantilism becomes the basis of globalization rather than free market liberalism. Hypo-globalization is the result. The term is fitting because the trade intensity of global growth is not yet in a total free fall (i.e. de-globalization) but merely dropping off from its peaks during the phase of “hyper-globalization” in the 1990s and early 2000s (Chart 14). Hypo-globalization is probably a structural rather than cyclical phenomenon. The EU cannot re-engage with Russia and ease sanctions without rehabilitating Russia’s economy and hence its military capacity – which could enable Russia to attack Europe again. The US and China can try to re-engage but they will fail. Russo-Chinese alliance ensures that the US would be enriching not one but both of its greatest strategic rivals if it reopened its doors to Chinese technology acquisition and intellectual property theft. Iran will see its security in alliance with Russia and China. China has an incentive to develop Iran’s economy so as not to depend solely on Russia and Central Asia. Russia has an incentive to develop Iran’s military capacity so as to deprive Europe of an energy alternative. Both Russia and China wish to deprive the US of strategic hegemony in the Middle East. By contrast the US and EU cannot offer ironclad security guarantees to Iran because of its nuclear ambitions and America’s occasional belligerence. Thus the world can see expanding Russian and Chinese economic integration with Eurasia, and expanding American and European integration with various regions, but it cannot see further European integration with Russia or American integration with China. And ultimately Europe and China will be forced to sever links (Chart 15). Globalization will not cease – it is a multi-millennial trend – but it will slow down. It will be subordinated to national security and mercantilist economic theory. 3. Populism/Nationalism: In theory, domestic instability can cause introversion or extroversion. But in practice we are seeing extroversion, which is dangerous for global stability (Chart 16). Chart 15Global Economic Disintegration
Global Economic Disintegration
Global Economic Disintegration
Chart 16Internal Sources Of Nationalism
Internal Sources Of Nationalism
Internal Sources Of Nationalism
Russia’s invasion of Ukraine derived from domestic Russian instability – and instability across the former Soviet space, including Belarus, which the Kremlin feared could suffer a color revolution after the rigged election and mass protests of 2020-21. The reason the northern European countries are rapidly revising their national defense and foreign policies to counter Russia is because they perceive that the threat to their security is driven by factors within the former Soviet sphere that they cannot easily remove. These factors will get worse as a result of the Ukraine war. Russian aggression still poses the risk of spilling out of Ukraine’s borders. China’s Maoist nostalgia and return to autocratic government is also about nationalism. The end of the rapid growth phase of industrialization is giving way to the Asian scourge: debt-deflation. The Communist Party is trying to orchestrate a great leap forward into the next phase of development. But in case that leap fails like the last one, Beijing is promoting “the great rejuvenation of the Chinese nation” and blaming the rest of the world for excluding and containing China. Taiwan, unfortunately, is the last relic of China’s past humiliation at the hands of western imperialists. China will also seek to control the strategic approach to Taiwan, i.e. the South China Sea. China’s claim that the Taiwan Strait is sovereign sea, not international waters, will force the American navy to assert freedom of passage. American efforts to upgrade Taiwan relations and increase deterrence will be perceived as neo-imperialism. The United States, for its part, could also see nationalism convert into international aggression. The US is veering on the brink of a miniature civil war as nationalist forces in the interior of the country struggle with the political establishment in the coastal states. Polarization has abated since 2020, as stagflation has discredited the Democrats. But it is now likely to rebound, making congressional gridlock all but inevitable. A Republican-controlled House will find a reason to impeach President Biden in 2023-24, in hopes of undermining his party and reclaiming the presidency. Another hotly contested election is possible, or worse, a full-blown constitutional crisis. American institutions proved impervious to the attempt of former President Trump and his followers to disrupt the certification of the Electoral College vote. However, security forces will be much more aggressive against rebellions of whatever stripe in future, which could lead to episodes in which social unrest is aggravated by police repression. If the GOP retakes the White House – especially if it is a second-term Trump presidency with a vendetta against political enemies and nothing to lose – then the US will return to aggressive foreign policy, whether directed at China or Iran or both. In short, polarization has contaminated foreign policy such that the most powerful country in the world cannot lead with a steady hand. Over the long run polarization will decline in the face of common foreign enemies but for now the trend vitiates global stability. Chart 17Germany And Japan Rearming
Third Quarter Geopolitical Outlook: Thunder And Lightning
Third Quarter Geopolitical Outlook: Thunder And Lightning
It goes without saying that nationalism is also an active force in Iran, where 83-year-old Supreme Leader Ayatollah Khamenei is attempting to ensure the survival of his regime in the face of youthful social unrest and an unclear succession process. If Khamenei takes advantage of the commodity cycle, and American and Israeli disarray, he can make a mad dash for the bomb and try to achieve regime security. But if he does so then nationalism will betray him, since Israel and/or the US are willing to conduct air strikes to uphold the red line against nuclear weaponization. If any more proof of global nationalism is needed, look no further than Germany and Japan, the principal aggressors of World War II. Their pacifist foreign policies have served as the linchpins of the post-war international order. Now they are both pursuing rearmament and a more proactive foreign policy (Chart 17). Nationalism may be very nascent in Germany but it has clearly made a comeback in Japan, which exacerbates China’s fears of containment. The rise of nationalism in India is widely known and reinforces the trend. Bottom Line: Great power rivalry is intensifying because of Russia’s conflict with the West and China’s inability to reject Russia. Hypo-globalization is the result since EU-Russia and US-China economic integration cannot easily be mended in the context of great power struggle. Domestic instability in Russia, China, and the US is leading to nationalism and aggressive foreign policy, as leaders find themselves unwilling or unable to stabilize domestic politics through productive economic pursuits. Investment Takeaways BCA has shifted its House View to a neutral asset allocation stance on equities relative to bonds (Chart 18). Chart 18BCA House View: Neutral Stocks Versus Bonds
BCA House View: Neutral Stocks Versus Bonds
BCA House View: Neutral Stocks Versus Bonds
Geopolitical Strategy remains defensively positioned, favoring defensive markets and sectors, albeit with some exceptions that reflect our long-term views. Tactically stay long US 10-year Treasuries, large caps versus small caps, and defensives versus cyclicals. Stay long Mexico and short the UAE (Chart 19). Strategically stay long gold, US equities relative to global, and aerospace/defense sectors (Chart 20). Among currencies favor the USD, EUR, JPY, and GBP. Chart 19Stay Defensive In Q3 2022
Stay Defensive In Q3 2022
Stay Defensive In Q3 2022
Chart 20Stick To Long-Term Geopolitical Trades
Stick To Long-Term Geopolitical Trades
Stick To Long-Term Geopolitical Trades
Chart 21Favor Semiconductors But Not Taiwan
Favor Semiconductors But Not Taiwan
Favor Semiconductors But Not Taiwan
Chart 22Indian Tech Will Rebound Amid China's Geopolitical Risks
Indian Tech Will Rebound Amid China's Geopolitical Risks
Indian Tech Will Rebound Amid China's Geopolitical Risks
Chart 23Overweight ASEAN
Overweight ASEAN
Overweight ASEAN
Go long US semiconductors and semi equipment versus Taiwan broad market (Chart 21). While we correctly called the peak in Taiwanese stocks relative to global and EM equities, our long Korea / short Taiwan trade was the wrong way to articulate this view and remains deeply in the red. Similarly our attempt to double down on Indian tech versus Chinese tech was ill-timed. China eased tech regulations sooner than we expected. However, the long-term profile of the trade is still attractive and Chinese tech will still suffer from excessive government and foreign interference (Chart 22). Go long Singapore over Hong Kong, as Asian financial leadership continues to rotate (see Chart 5 above). Stay long ASEAN among emerging markets. We will also put Malaysia on upgrade watch, given recent Malaysian equity outperformance on the back of Chinese stimulus and growing western interest in alternatives to China (Chart 23). Matt Gertken Chief Geopolitical Strategist mattg@bcaresearch.com Strategic Themes Open Tactical Positions (0-6 Months) Open Cyclical Recommendations (6-18 Months) Regional Geopolitical Risk Matrix
In this week’s report “Adaptive Expectations: Revisiting Our Views”, we concluded that the S&P 500 is unlikely to find a bottom until inflation turns and monetary conditions stabilize, and US equities will follow a “fat and down” trajectory. We recommended that investors should overweight defensives vs. cyclicals. Accordingly, today we downgrade our overweight in Travel complex (Hotels, Cruises, and Airlines) to underweight. As a reminder, we recently moved retailing and durables categories to below benchmark. The key reason for this call is the effect of persistently high inflation on discretionary spending. In the past, we have written about the bifurcation of the US consumer, and that, while lower-income Americans are struggling with soaring prices of food, gas, and shelter, wealthier Americans are more comfortable and just shift their spending away from goods to services, such as eating out and travel. We expect strong profits for the travel sector this summer on the back of strong consumer demand and return of the business and international travel. We have discussed the drivers of the industry in these reports (here and here). Yet, markets are forward-looking, and the outlook for the industry beyond the summer months is dimming. With inflation entrenched, now even middle- and upper-class Americans as well as retirees are also starting to feel the pain. The US equity and bond market selloffs of the past 12 months have wiped out about $12 trillion and $3.5 trillion off their respective market value. This adds up to a combined $15.5 trillion or about 60% of US GDP (Chart 1). These are nest eggs and pensions shrinking by the day, diminishing future spending, and causing anxiety about the future. And while the S&P 500 is still at a level above the pandemic lows, adjusted for inflation, most of the gains are gone. On top of the reduced value of investments, negative real wage growth dampens consumer confidence (Chart 2). To make things worse, fears of recession and impending layoffs are pervasive in media stories, stoking fear of the future, and perhaps, making an economic downturn a self-fulfilling prophecy. Therefore, even wealthier Americans may have to tighten their belts and reduce their discretionary spending, with travel and leisure categories being on top of their list. Chart 1
CHART 1
CHART 1
Chart 2
CHART 2
CHART 2
Therefore, after the summer vacation surge is over, hotels and airlines are likely to experience slower demand which will weigh on their sales and pricing power. At the same time, these are industries most affected by the rising cost of fuel (airlines and cruise lines) and rising wages (hotels). As a result, we expect profitability to diminish and earnings growth recovery to stall. We have a negative outlook on the travel industry on a tactical time horizon. Bottom Line: Entrenched inflation is weighing on discretionary spending, and travel is likely to be the next victim of curtailed spending. We downgrade the S&P Hotels and the S&P Airlines indexes from overweight to underweight.
Executive Summary Biden Can Take Risks With Russia
Third Quarter US Political Outlook: Last Ditch Effort
Third Quarter US Political Outlook: Last Ditch Effort
President Biden will make a last-ditch effort to mitigate Democratic losses in the midterm elections and the effect will be still-high policy uncertainty and erratic US behavior. Biden can take several executive actions against inflation but we do not expect them to resolve the global supply shock or to save the Democrats from a Republican takeover of Congress this fall. There is substantial risk of a direct US-Russia crisis ahead of the election that would sustain bearish sentiment. US policy remains a headwind for equities in 2022 but possibly a tailwind in 2023. A rally after the midterm is fairly likely. Recommendation (Tactical) Initiation Date Return Long DXY (Dollar Index) 23-FEB-22 8.8% Bottom Line: Maintain a defensive posture in the third quarter but look for opportunities to buy oversold assets with long-term macro and policy tailwinds. Feature President Biden and the Democratic Party will make a last-ditch effort in the third quarter to mitigate their large expected losses in the midterm elections. The president will concentrate on fighting inflation, which is weighing on wages, incomes, and consumer and business sentiment (Chart 1). Related Report US Political StrategyBiden Opens The Border Biden’s frantic efforts will induce additional market volatility. The president has a few limited tools to address global energy and supply shocks that probably will not work. Inflation will remain problematic even if it slows down over the next three months as our bond strategists expect. The odds of recession have risen sharply. Our Chief Global Strategist Peter Berezin suggests that the odds are 40% – a point underscored by inversion of some parts of the yield curve and a falling leading economic indicator (Chart 2). President Biden recently met with outside economic adviser Larry Summers and concluded that a recession is “not inevitable.” Not very comforting. Chart 1Inflation's Toll
Inflation's Toll
Inflation's Toll
Chart 2Odds Of Recession Rising
Odds Of Recession Rising
Odds Of Recession Rising
Summers, who warned Biden and the Democrats not to add $1.9 trillion in spending at the beginning of 2021, has put forward research showing recession odds at 60%-70% over the next 12-24 months.1 However, BCA’s own recession checklist is still ambivalent (Table 1). BCA’s House View is now neutral on equities. Table 1BCA Recession Checklist
Third Quarter US Political Outlook: Last Ditch Effort
Third Quarter US Political Outlook: Last Ditch Effort
What could change the US policy outlook? Not much. Avoiding recession, reducing inflation, mobilizing women voters, and clashing directly with Russia could mitigate some of the Democrats’ expected losses this fall, but the outcome would probably be the same. Betting markets give a 72%probability to Democrats losing control of both the House of Representatives and the Senate. Our own election models show Democrats losing 22 seats in the House and two seats in the Senate (see Appendix), reinforcing our February forecast. The implication is congressional gridlock in 2023-24. Gridlock is marginally positive for the broad US equity market beginning in Q4 2022 … but marginally negative before then. Checking Up On Our Three Key Views For 2022 Our three key views for 2022 remain intact at the halfway point of the year. : 1. From Single-Party Rule To Gridlock: The Democrats are highly likely to lose control of the House of Representatives this fall, meaning that unified government will end with the lame duck legislative session in November and December. The Democrats’ fiscal 2022 budget reconciliation bill is less likely to pass now that midterm campaigning has begun. A fiscally expansive bill would add to inflation. A deficit-reducing bill – i.e. one with substantial tax hikes – would increase the odds of recession. Biden no longer has an interest in pushing the bill until he is reasonably sure a recession can be avoided. It is very hard to garner 218 votes in the House and 51 votes in the Senate now that Biden’s and Democrats’ popular support is melting down. Democrats are polling comparably to Republicans who lost 41 House seats in the 2018 midterms (Chart 3). Thus while it is still possible for Democrats to pass an energy security and climate change bill under Biden’s presidency, we have no conviction that they can do it before the midterm. More likely it would have to pass during the lame-duck session in the fourth quarter – or as a compromise law with a Republican Congress in 2023-24. Until 2025, at earliest, US government will be divided, which means that the post-election drop in policy uncertainty will be short-lived, as fears will emerge of breaching the debt ceiling in early 2023. Chart 3Democratic Party Troubles
Third Quarter US Political Outlook: Last Ditch Effort
Third Quarter US Political Outlook: Last Ditch Effort
2. From Legislative To Executive Power: With the legislature stymied, Biden will resort to executive power to keep his presidency afloat. So what will he do? Fight inflation. Biden’s anti-inflation plan consists of three prongs. The first is “letting” the Fed raise interest rates, which is well under way. The Fed hiked rates by 75 basis points on June 15 and plans to raise the Fed funds rate to 3.25% or 3.5% by end of year. The second prong is passing his Build Back Better plan and the third is consolidating the fiscal deficit. But these two options are bogged down in Congress – no new belt-tightening will occur until 2023 at earliest. So Biden’s remaining options consist of administrative maneuvers and executive orders. Biden could stop collecting the federal gas tax, although the tax has not risen since 1993 and its removal will have a marginal impact (Chart 4). He has already tapped the strategic petroleum reserve, to an unprecedented degree, without preventing the surge in prices at the pump (Chart 5). Chart 4Biden To Defer Federal Gas Tax
Biden To Defer Federal Gas Tax
Biden To Defer Federal Gas Tax
Chart 5Strategic Petroleum Reserve Already Tapped
Strategic Petroleum Reserve Already Tapped
Strategic Petroleum Reserve Already Tapped
3. From Domestic To Foreign Policy: Part of Biden’s turn toward executive power will be a turn toward foreign policy orientation. However, before the midterm, Biden’s foreign policy will be defensive or reactive. That is, with the exception of Russia, he will attempt to placate foreign threats and mitigate the energy shock. On China, Biden is considering pulling back on some of President Trump’s extraordinary tariffs, though probably not the Section 301 tariffs related to technology theft. He has the authority to do so unilaterally just as Trump had the authority to put them on. The problem is that easing the China tariffs will have little effect on inflation, and only after the midterm, while it would weaken Biden’s political standing in the Rust Belt and undermine the US’s strategic competition with China. Tariff relief would only temporarily benefit the renminbi, if at all, given China’s need for a weak currency amid its economic slowdown (Chart 6). Hence Biden may reduce some tariffs but it will be underwhelming. Not a reliable way to bring down inflation. Chart 6Biden Can Ease China Tariffs (But Don't Bet On It)
Biden Can Ease China Tariffs (But Don't Bet On It)
Biden Can Ease China Tariffs (But Don't Bet On It)
Second, Biden has proposed to ease sanctions on Iran if it will freeze its nuclear program and come back into compliance with the 2015 nuclear deal that the Trump administration rejected. But the Iranians can export oil anyway at today’s prices, they have customers in China and India, and they have immense military leverage over Iraqi production, which means they are not forced to capitulate (Chart 7). Not a reliable way to bring down inflation. Third, Biden is courting the Gulf Arab states and tinkering with easing sanctions on Venezuela and others. OPEC support is a better option than Iran/Venezuela. However, OPEC will decide when and how much support to give. The Arab states will act to prolong the global business cycle but will not base their strategy on helping Democrats win an election. Hence they may not come to the rescue as early as the third quarter (Chart 8). Chart 7Biden Can Ease Iran Sanctions (But Don't Bet On It)
Biden Can Ease Iran Sanctions (But Don't Bet On It)
Biden Can Ease Iran Sanctions (But Don't Bet On It)
Chart 8Biden Casting About For Oil Providers
Biden Casting About For Oil Providers
Biden Casting About For Oil Providers
Moreover if the Biden administration makes amends with Saudi Arabia, then Iran’s nuclear progress will steam ahead and ignite tensions in the Middle East within the year. That would vitiate the impact of increased OPEC production. Not a reliable way to bring down inflation. Biden has even sought to exempt Russia from some sanctions for the sake of reducing inflation, such as with grain exports. However, these arrangements may not last. Given Biden’s weak domestic support and given the way that the Cuban Missile Crisis helped President Kennedy to mitigate his party’s losses in 1962, Biden can afford to be confrontational and even provocative toward Russia (Chart 9). After all, Russia is already pulling levers to add to inflation. The problem is that a direct US-Russia showdown would increase inflation while heightening global risk aversion. Bottom Line: Gridlock is coming, which is marginally negative for US equities in Q3 2022 but marginally positive as early as Q4 2022 and in 2023. It is not good for equities in 2022 because of elevated uncertainty – uncertainty not so much about the election results as about the volatile and unpredictable impacts of the president’s last-ditch efforts to fight inflation. Chart 9Biden Can Take Risks With Russia
Third Quarter US Political Outlook: Last Ditch Effort
Third Quarter US Political Outlook: Last Ditch Effort
Checking Up On Our Strategic Themes For The 2020s Looking beyond the short term, this year’s inflation outbreak and geopolitical events will largely reinforce our three long-term US political themes, in the following ways: 1. Millennials/GenZ Rising: In the coming 12 months, a fall in job openings due to the economic slowdown, combined with a recovering labor participation rate, could reduce wage pressures and inflation, in accordance with the Federal Reserve’s plan for a “soft landing” (Chart 10). Of course, that is not happening yet. And conversely labor participation will fall again if recession risks materialize. So there will be a lot of noise in the short run. Over the long run, a rising dependency ratio, in the context of a growing population, has inflationary implications. It decreases the pool of savings, increases the need for public investment, and increases the cost of each prime-age worker. Today the headline labor participation rate has mostly recovered but workers over the age of 55 are failing to return to pre-pandemic levels of participation, as are young people, which will keep wage pressures up (Chart 11). Chart 10The Fed's Idea Of A Soft Landing
The Fed's Idea Of A Soft Landing
The Fed's Idea Of A Soft Landing
Chart 11Generational Shift In Labor Market
Generational Shift In Labor Market
Generational Shift In Labor Market
Thus generational change will be marginally inflationary and will have powerful political effects. An increasingly multi-ethnic and educated population will hold different opinions from previous generations. Political parties will evolve to capture these voters. Underlying the shift will be the fact that government support will be necessary for the rising share of dependents, yet fiscal discipline will be necessary to restrict inflation. The current quarrel between older and younger generations will intensify before it subsides. The Silent Generation, along with the conservative Baby Boomers, will remain the decisive voting bloc in the 2022 midterm and will seek to freeze fiscal policy. That brings us to our next theme … 2. Peak Polarization: Political polarization has declined since the 2020 election, as we predicted. All voters dislike high inflation (Chart 12). However, polarization will remain at historically high levels at least over the short and medium term. Chart 12Everyone Loathes Inflation
Everyone Loathes Inflation
Everyone Loathes Inflation
Chart 13Women’s Turnout Will Matter
Third Quarter US Political Outlook: Last Ditch Effort
Third Quarter US Political Outlook: Last Ditch Effort
Polarization will remain high in part because of the generational divide, which is still very wide and underpins stark ideological divides. For example, a short-term driver of polarization will be abortion. The Supreme Court is likely, though not certain, to overturn the 1972 Roe v. Wade decision that guarantees nationwide access to abortion. If it does, protests and civil unrest will occur. Women turned out in droves against President Trump’s Republicans in the 2018 midterms and will do so again in 2022 (Chart 13), helping Democrats to mitigate some of their losses. Polarization will also remain high due to the electoral system and intra-party dynamics. While Democrats ensconce themselves in formal institutions, Republicans continue to transform into a populist party. So far in the Republican primary elections, candidates endorsed by former President Trump are winning the nomination at a 94% rate. Table 2 shows the outcomes in the GOP primary elections for the House of Representatives so far. A GOP House majority is likely to impeach President Biden for one or another reason, even though they will not be able to remove him from office. Table 2Polarization Will Stay Near Historic Peaks Over 2022-24 Cycle
Third Quarter US Political Outlook: Last Ditch Effort
Third Quarter US Political Outlook: Last Ditch Effort
Today’s extreme polarization entails that congressional gridlock will return and that the US remains at high risk of social unrest, political violence, and domestic terrorism (Chart 14). A terrorist attack that affects critical infrastructure, high-level personnel, or the electoral system would lead to greater sociopolitical instability. Especially if violence tips the narrow political balance of one of the branches of government and has a concrete impact on national policy.2 Social unrest alone will hardly move markets but unrest that fundamentally damages US political stability is possible and would engender risk-aversion. Over the long run, however, the US will avoid a second civil war since Washington possesses the world’s most powerful military and intelligence apparatus, which is highly unlikely to be coopted or defeated by an extremist movement. The military swears allegiance to the constitution. For example, neither the military nor the political institutions (as opposed to individuals) showed any serious sign of breaking down during the January 6, 2021 insurrection. The vast majority of voters will recoil from any major incidents of terrorism or militancy. While opinion polls show non-negligible support for political violence, such polls need to be interpreted carefully (Chart 15). A recent study shows that these polls overstate public support for violence.3 Chart 14Major Risk Of Domestic Terrorism, Political Violence
Third Quarter US Political Outlook: Last Ditch Effort
Third Quarter US Political Outlook: Last Ditch Effort
Chart 15Opinion Growing More Militant … Until Militancy Happens
Third Quarter US Political Outlook: Last Ditch Effort
Third Quarter US Political Outlook: Last Ditch Effort
The emerging Russo-Chinese strategic challenge, combined with generational change, will force political elites to cooperate to prevent domestic insurrections, regime fracture, and foreign humiliation. Polarization will give way to a new American consensus which is largely directed at domestic stabilization and fighting the Second Cold War. 3. Limited Big Government: The inflation outbreak has dealt a blow to arguments in favor of unlimited government, including Modern Monetary Theory. While the US rediscovered the need for “Big Government” during the deflationary 2010s, it is already starting to rediscover the need for limited government via the inflationary 2020s (Chart 16). The next Congress will reimpose some fiscal discipline – and future governments will face some checks and balances on spending due to their fear of an inflationary surge and negative consequences at the voting booth. Unless Democrats somehow retain control of Congress this fall, they will reinforce the precedent set by the Carter administration that high inflation is politically undesirable. Chart 16Inflation Outbreak Will Limit Big Government
Third Quarter US Political Outlook: Last Ditch Effort
Third Quarter US Political Outlook: Last Ditch Effort
Fiscal policy will be more expansive in the coming decade than in recent decades due to structural factors. But it will still face limitations from democratic politics, i.e. gridlock. As long as polarization does not spiral out of control, the US government will not become authoritarian or autocratic and fiscal policy will not result in Big Government Socialism or No Government Anarchism. A new compromise will be found which will be Limited Big Government. Bottom Line: Generational tensions will rise and then fall – and so will political polarization. The US faces a high risk of sociopolitical instability in the short term. The 2022 midterm will become a source of uncertainty, volatility, and a still-elevated equity risk premium. After the midterm, uncertainty and risk premiums will dissipate temporarily. But avoiding a recession will become the critical factor in maintaining policy continuity and national stability through the 2024 election cycle. Investment Takeaways BCA has shifted its House View to a neutral asset allocation stance on equities relative to bonds, as noted. US Political Strategy remains defensively positioned, as midterm elections typically provide a tailwind to defensive sectors for the first three quarters of the election year. This is also true when unified governments shift to divided governments – and in that case bond yields tend to be higher than usual (Chart 17). While the inflation outbreak makes this year different from many recent midterm years, these trends have persisted. For this reason, and our Geopolitical Strategy views, we will maintain our defensive bias in the third quarter. Chart 17Stocks Flat, Bond Yields High, Until After Midterm Elections
Stocks Flat, Bond Yields High, Until After Midterm Elections
Stocks Flat, Bond Yields High, Until After Midterm Elections
We remain overweigh health care relative to the broad market and overweight nominal Treasuries relative to inflation-protected securities. Having said that, we are putting our long US dollar (DXY) trade on downgrade watch. We do not doubt that the dollar can go higher this year but our bearish views have come to fruition both within the US and in the geopolitical space and they are now largely priced. It may soon be time to step back and reassess, especially because interest rate differentials are turning against the dollar (Chart 18). In addition China’s government will take a pro-growth turn to try to secure the economic recovery over the next 12 months. In the energy space, we expect volatility. The Biden administration is focused on fighting inflation and could pull various levers to affect the oil market, outlined above. If Biden succeeds against expectations, then the oil price would suffer a substantial setback. Moreover OPEC has an independent interest in prolonging the business cycle now that global prices have become punitive. Hence we are neutral on oil prices and booked gains on our long energy trades for the time (Chart 19). Chart 18Put US Dollar On Downgrade Watch
Put US Dollar On Downgrade Watch
Put US Dollar On Downgrade Watch
If inflation subsides and bond yields moderate, then growth stocks should rebound against value stocks. However, we implemented this idea prematurely earlier this year and suffered for it. Therefore we remain neutral on the question of portfolio styles for now. Our cyclical plays remain the same: long cyber security stocks, defense stocks, and infrastructure stocks. We also remain long renewable energy, although for now we only recommend it as a tactical trade (Chart 20). Chart 19Energy Prices Will Be Volatile
Energy Prices Will Be Volatile
Energy Prices Will Be Volatile
Chart 20Stick With Cyber Security, Defense, And Renewables
Stick With Cyber Security, Defense, And Renewables
Stick With Cyber Security, Defense, And Renewables
Matt Gertken Senior Vice President Chief US Political Strategist mattg@bcaresearch.com Footnotes 1 See Lawrence H. Summers and Alex Domash, “History Suggests a High Chance of Recession over the Next 24 Months,” Harvard Kennedy School, March 15, 2022, www.hks.harvard.edu. 2 Consider the January 6 insurrection, the recent plot against Supreme Court Justice Brett Kavanaugh’s life, the gun attack on Republican Senators in 2017, and the risk of assassinations or other extremist incidents. 3 See Sean J. Westwood et al, “Current research overstates American support for political violence,” Proceedings of the National Academy of Sciences, 119:12 (2022), pnas.org. Strategic View Open Tactical Positions (0-6 Months) Open Cyclical Recommendations (6-18 Months) Table A2Political Risk Matrix
Third Quarter US Political Outlook: Last Ditch Effort
Third Quarter US Political Outlook: Last Ditch Effort
Table A3US Political Capital Index
Third Quarter US Political Outlook: Last Ditch Effort
Third Quarter US Political Outlook: Last Ditch Effort
Chart A1Presidential Election Model
Third Quarter US Political Outlook: Last Ditch Effort
Third Quarter US Political Outlook: Last Ditch Effort
Chart A2Senate Election Model
Third Quarter US Political Outlook: Last Ditch Effort
Third Quarter US Political Outlook: Last Ditch Effort
Table A4House Election Model
Third Quarter US Political Outlook: Last Ditch Effort
Third Quarter US Political Outlook: Last Ditch Effort
Table A5APolitical Capital: White House And Congress
Third Quarter US Political Outlook: Last Ditch Effort
Third Quarter US Political Outlook: Last Ditch Effort
Table A5BPolitical Capital: Household And Business Sentiment
Third Quarter US Political Outlook: Last Ditch Effort
Third Quarter US Political Outlook: Last Ditch Effort
Table A5CPolitical Capital: The Economy And Markets
Third Quarter US Political Outlook: Last Ditch Effort
Third Quarter US Political Outlook: Last Ditch Effort
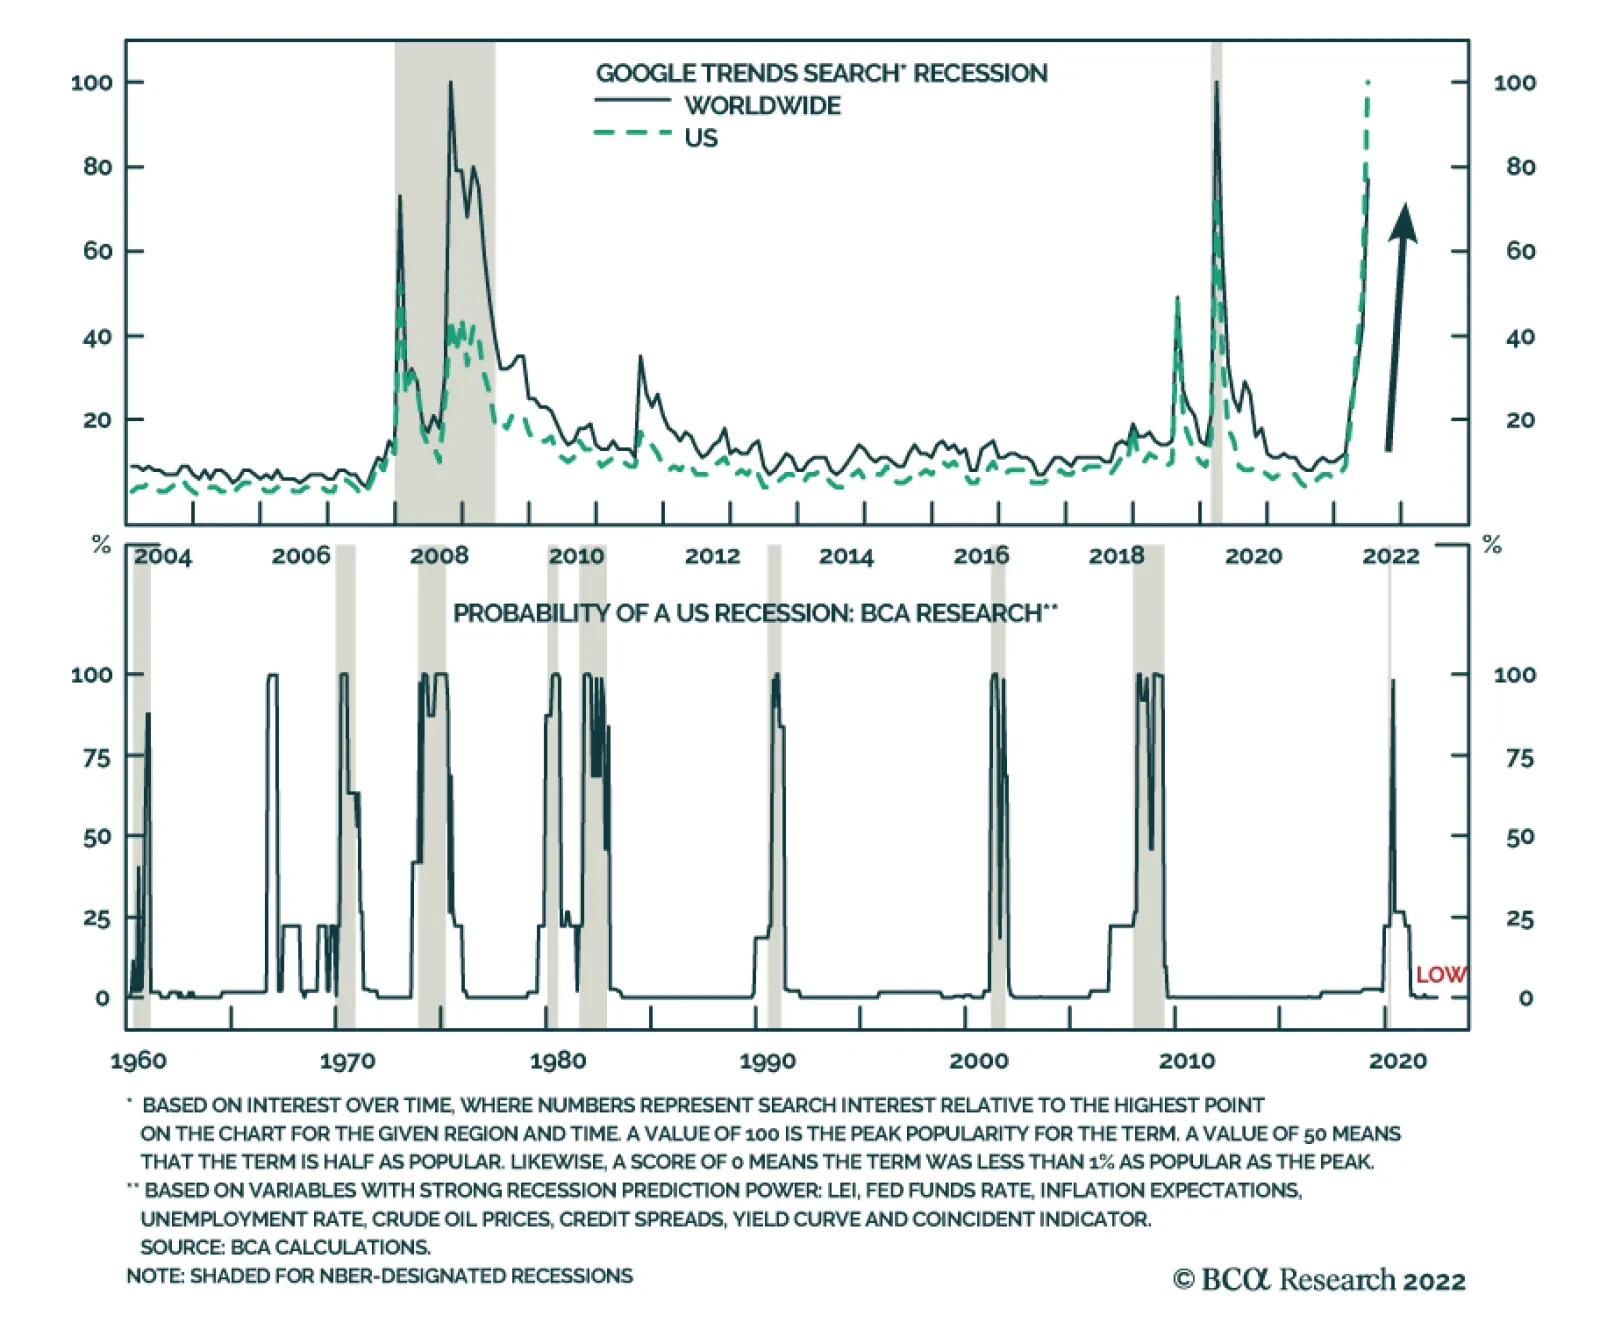
Wall Street strategists are tripping over themselves to upgrade the probability of a recession. This trend is also spilling over into Main Street. Google searches for “recession” are spiking, indicating that the wider public has also become increasingly…
BCA Research’s US Bond Strategy service expects core US inflation to fall naturally to a trend rate of roughly 4-5%, even in the absence of recession. However, an economic recession and its associated labor market weakness are likely required to move…
Every month, BCA strategists hold a view meeting to discuss the most important issues driving the macroeconomy and financial markets. This month’s meeting, which was held on Monday, was especially pertinent as it comes on the heels of a substantial decline in…
Executive Summary At our monthly view meeting on Monday, BCA strategists voted to change the House View to a neutral asset allocation stance on equities, with a slight plurality favoring an outright underweight. The view of the Global Investment Strategy service is somewhat more constructive, as I think it is still more likely than not that the US will avoid a recession; and that if a recession does occur, it will be a fairly mild one. Nevertheless, the risks to my view have increased. I now estimate 40% odds of a recession during the next 12 months, up from 20% a month ago. In The Past, When Unemployment Has Started Rising In The US, It Has Kept On Rising
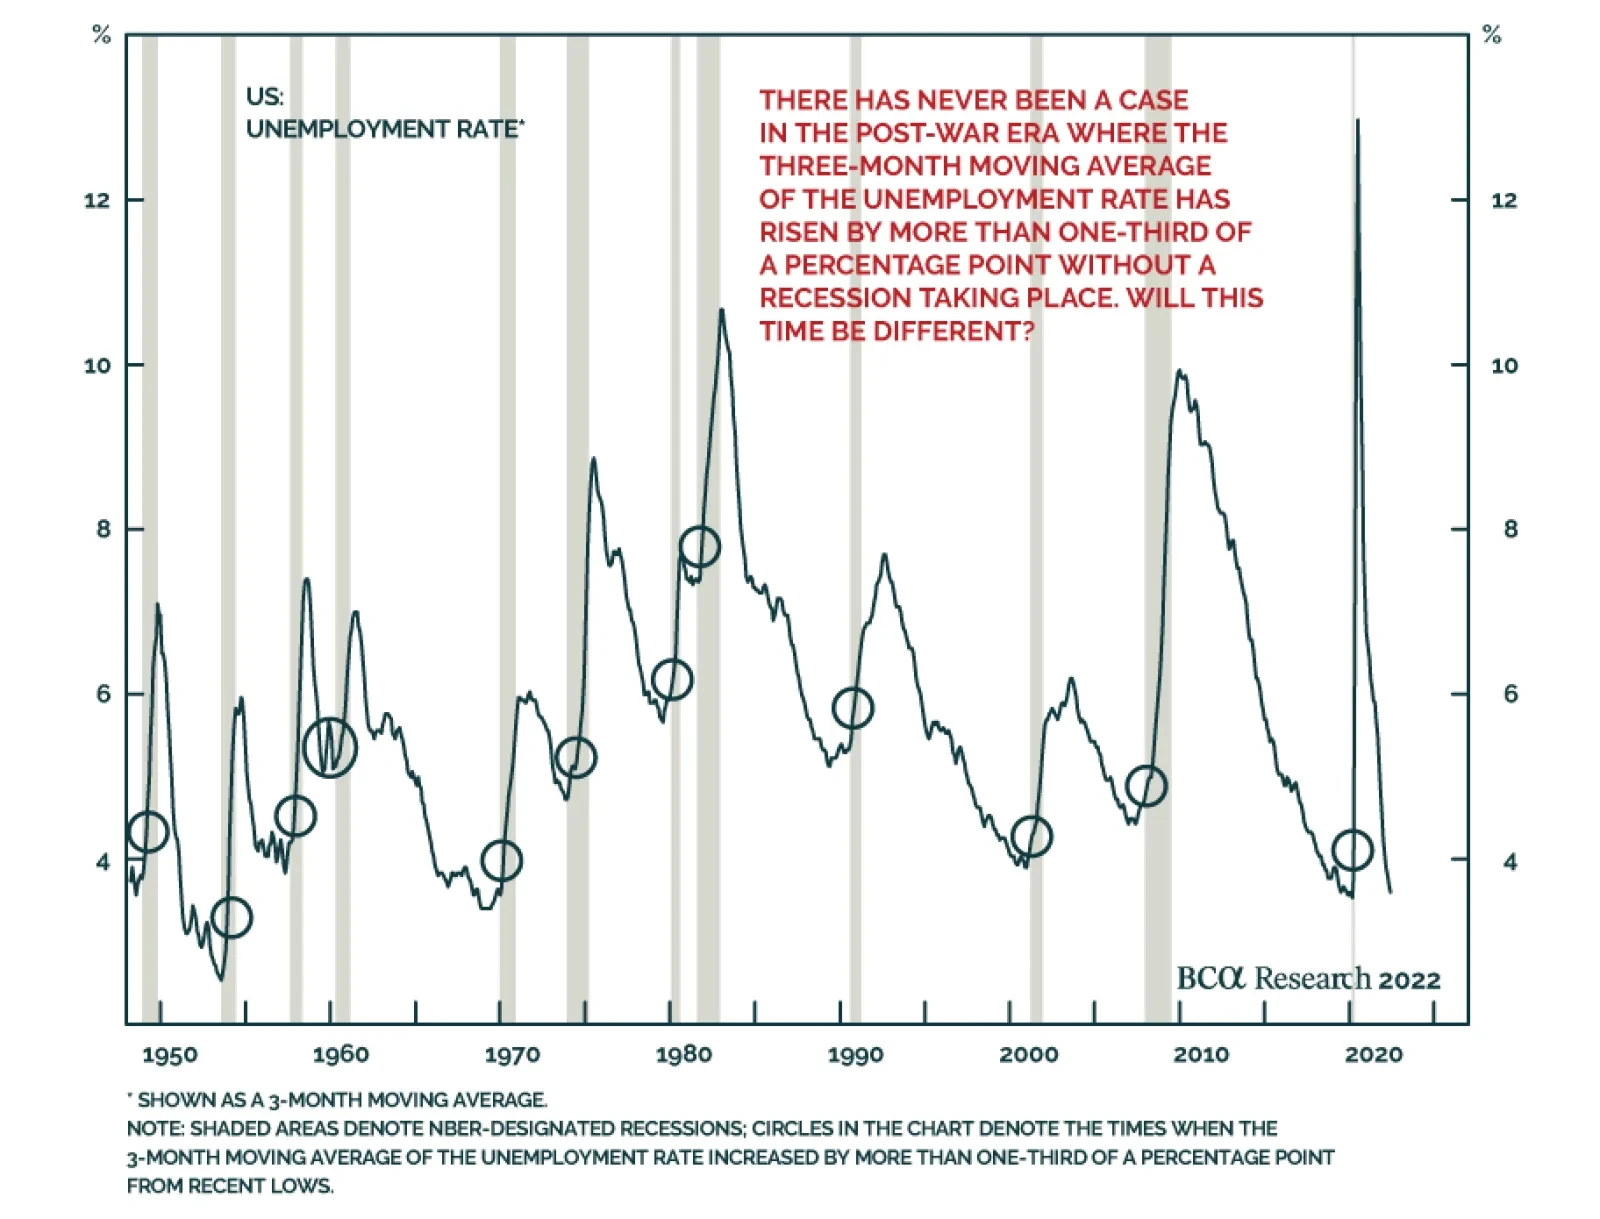
In The Past, When Unemployment Has Started Rising In The US, It Has Kept On Rising
In The Past, When Unemployment Has Started Rising In The US, It Has Kept On Rising
Bottom Line: With the S&P 500 down 27% in real terms from its highs at the time of the meeting, the view of the Global Investment Strategy service is that a modest overweight is appropriate. However, investors should refrain from adding to equity positions until more clarity emerges about the path for inflation and growth. Heading For Recession? Every month, BCA strategists hold a view meeting to discuss the most important issues driving the macroeconomy and financial markets. This month’s meeting, which was held yesterday, was especially pertinent as it comes on the heels of a substantial decline in global equities. The key issue that we grappled with was whether the Fed could achieve a proverbial soft landing or whether the US and the rest of the global economy were spiraling towards recession (if it wasn’t already there). I began the meeting by showing one of my favorite charts, a deceptively simple chart of the US unemployment rate (Chart 1). The chart makes three things clear: 1) The US unemployment rate is rarely stable; It is almost always either rising or falling; 2) Once it starts rising, it keeps rising. In fact, the US has never averted a recession when the 3-month average of the unemployment rate has risen by more than a third of a percentage point; and 3) As a mean-reverting series, the unemployment rate is most likely to start rising when it is very low. Chart 1In The Past, When Unemployment Has Started Rising In The US, It Has Kept On Rising
In The Past, When Unemployment Has Started Rising In The US, It Has Kept On Rising
In The Past, When Unemployment Has Started Rising In The US, It Has Kept On Rising
Taken at face value, the chart paints a damning picture about the economic outlook. The US unemployment rate is near a record low, which means that it has nowhere to go but up. And once the unemployment rate starts going up, history suggests that a recession is inevitable. Five Caveats Despite this ominous implication, I did highlight five caveats. First, the observation that even a modest increase in the unemployment rate invariably heralds a recession is based on a limited sample of business cycles from the US. Across the G10, soft landings have occurred, Canada being one example (Chart 2). Second, unlike the unemployment rate, the employment-to-population ratio is still 1.1 percentage points below its pre-pandemic level, and 4.6 percentage points below where it was in April 2000. A similar, though less pronounced, pattern holds if one focuses only on the 25-to-54 age cohort (Chart 3). Chart 2G10 Economies Sometimes Manage To Avoid A Recession Amid Rising Unemployment
G10 Economies Sometimes Manage To Avoid A Recession Amid Rising Unemployment
G10 Economies Sometimes Manage To Avoid A Recession Amid Rising Unemployment
Chart 3The Employment-To-Population Ratio Remains Below Pre-Pandemic Levels
The Employment-To-Population Ratio Remains Below Pre-Pandemic Levels
The Employment-To-Population Ratio Remains Below Pre-Pandemic Levels
While the number of people not working either because they are worried about the pandemic, or because they are still burning through their stimulus checks, has been trending lower, it is still fairly high in absolute terms (Chart 4). As my colleague Doug Peta discussed in his latest report, one can envision a scenario where job growth remains positive, but the unemployment rate nonetheless edges higher as more workers rejoin the labor force. Chart 4ALabor Supply Should Increase As Covid Fears Continue To Abate And More Workers Burn Through Their Stimulus Savings (I)
Labor Supply Should Increase As Covid Fears Continue To Abate And More Workers Burn Through Their Stimulus Savings (I)
Labor Supply Should Increase As Covid Fears Continue To Abate And More Workers Burn Through Their Stimulus Savings (I)
Chart 4BLabor Supply Should Increase As Covid Fears Continue To Abate And More Workers Burn Through Their Stimulus Savings (II)
Labor Supply Should Increase As Covid Fears Continue To Abate And More Workers Burn Through Their Stimulus Savings (II)
Labor Supply Should Increase As Covid Fears Continue To Abate And More Workers Burn Through Their Stimulus Savings (II)
Third, the job vacancy rate is extremely high today – much higher than a pre-pandemic “Beveridge Curve” would have predicted (Chart 5). This provides the labor market with a wide moat against an increase in firings. As Fed governor Christopher Waller has emphasized, the main effect of the Federal Reserve’s efforts to cool labor demand could be to push down vacancies rather than to push up unemployment. Fourth, as we have highlighted in past research, the Phillips curve is kinked at very low levels of unemployment (Chart 6). This means that a decline in unemployment from high to moderate levels may do little to spur inflation, but once the unemployment rate falls below its full employment level, then watch out! Chart 5The Fed Hopes That Its Tightening Policy Will Bring Down Job Openings More Than It Pushes Up The Unemployment Rate
The Fed Hopes That Its Tightening Policy Will Bring Down Job Openings More Than It Pushes Up The Unemployment Rate
The Fed Hopes That Its Tightening Policy Will Bring Down Job Openings More Than It Pushes Up The Unemployment Rate
Chart 6The Phillips Curve Is Kinked At Very Low Levels Of Unemployment
Hard Or Soft Landing? BCA Strategists Debate The Question
Hard Or Soft Landing? BCA Strategists Debate The Question
The converse is also true, however. If a small decrease in unemployment can trigger a large increase in inflation, then a small increase in unemployment can trigger a large decrease in inflation, provided that long-term inflation expectations remain reasonably well anchored in the meantime. In other words, it is possible that the so-called “sacrifice ratio” — the amount of output that has to be sacrificed to reduce inflation — may be quite low. Fifth, and perhaps most importantly, there is a lot of variation from one recession to the next in how much unemployment rises. In general, the greater the financial and economic imbalances going into a recession, the deeper it tends to be. US household balance sheets are in reasonably good shape these days. Households are sitting on $2.2 trillion in excess savings (Chart 7). Yes, most of those savings belong to relatively well-off households. But as Chart 8 illustrates, even rich people spend well over half of their income. Chart 7Households Have Only Just Begun To Draw Down Their Accumulated Savings
Households Have Only Just Begun To Draw Down Their Accumulated Savings
Households Have Only Just Begun To Draw Down Their Accumulated Savings
Chart 8Even The Rich Spend The Majority Of Their Income
Hard Or Soft Landing? BCA Strategists Debate The Question
Hard Or Soft Landing? BCA Strategists Debate The Question
The ratio of household debt-to-disposable income in the US is down by a third since its peak in 2008. Despite falling equity prices, the ratio of household net worth-to-disposable income is still up nearly 50 percentage points since the end of 2019, mainly because home prices have risen (Chart 9). As is likely to be the case in many other countries, home prices in the US will level off and quite possibly decline over the next few years. In and of itself, that may not be such a bad outcome for equity markets since lower real estate prices will cool aggregate demand, thus lowering inflation without the need for much higher interest rates. The danger, of course, is that we could see a replay of the GFC. This risk cannot be ignored but is probably quite small. The quality of mortgage lending has been very strong over the past 15 years. Moreover, unlike in 2007, when there was a large glut of homes, the homeowner vacancy rate today is at a record low. Tepid homebuilding has pushed the average age of the US residential capital stock to 31 years, the highest since 1948 (Chart 10). Chart 9The US Household Debt Burden Has Come Down Significantly Since 2008, While Net Worth Is Still Higher Than Before The Pandemic
The US Household Debt Burden Has Come Down Significantly Since 2008, While Net Worth Is Still Higher Than Before The Pandemic
The US Household Debt Burden Has Come Down Significantly Since 2008, While Net Worth Is Still Higher Than Before The Pandemic
Chart 10Tight Supply Conditions In The Housing Market Argue Against A Repeat Of The GFC
Tight Supply Conditions In The Housing Market Argue Against A Repeat Of The GFC
Tight Supply Conditions In The Housing Market Argue Against A Repeat Of The GFC
A Bleaker Picture Outside The US The situation is admittedly dicier outside the US. Putin’s despotic regime continues to wage war on Ukraine. While European natural gas prices are still well below their March peak, they have recently surged as Russia has begun to throttle natural gas exports (Chart 11). The euro area manufacturing PMI clocked in a respectable 54.6 in May but is likely to drop over the coming months as higher energy prices restrain production. The only saving grace is that fiscal policy in Europe has turned more expansionary. The IMF’s April projection foresaw the structural primary budget balance easing from a surplus of 1.2% of GDP between 2014 and 2019 to a deficit of 1.2% of GDP between 2022 and 2027, the biggest swing among the major economies (Chart 12). Even the IMF’s numbers probably underestimate the fiscal easing that will transpire considering the need for Europe to invest more in energy independence and defense. Chart 11The European Economy Is Threatened By Rising Gas Prices
The European Economy Is Threatened By Rising Gas Prices
The European Economy Is Threatened By Rising Gas Prices
Chart 12Euro Area Fiscal Policy Is Expected To Be More Expansionary In The Years To Come Than Before The Pandemic
Hard Or Soft Landing? BCA Strategists Debate The Question
Hard Or Soft Landing? BCA Strategists Debate The Question
The Chinese economy continues to suffer from the “triple threat” of renewed Covid lockdowns, a shift of global demand away from manufactured goods towards services, and a floundering property market. We expect the Chinese property market to ultimately succumb to the same fate that befell Japan 30 years ago. Chart 13Chinese Stocks Are Cheap
Chinese Stocks Are Cheap
Chinese Stocks Are Cheap
Unlike Japanese stocks in the early 1990s, however, Chinese stocks are trading at fairly beaten down valuations – 10.9-times earnings and 1.4-times book for the investable index (Chart 13). With the Twentieth Party Congress slated for later this year and the population jaded by lockdowns, the political incentive to shower the economy with cash and loosen the reins on regulation will intensify. A Scenario Analysis For The S&P 500 Corralling all these moving parts is no easy matter. We would put the odds of a US recession over the next 12 months at 40%. This is double what we would have said a month ago when we tactically upgraded stocks after the S&P 500 fell below the 4,000 mark. The May CPI report was clearly a shocker, both to the Fed and the markets. The median dot in the June Summary of Economic Projections sees the Fed funds rate rising to 3.8% next year, smack dab in the middle of our once highly out-of-consensus estimate of 3.5%-to-4% for the neutral rate of interest. With interest rates potentially moving into restrictive territory next year, equity investors are right to be concerned. Yet, as noted above, if a recession does occur, it is likely to be a fairly mild one. At the time of the BCA monthly view meeting, the S&P 500 was already down 23% in nominal terms and 27% in real terms from its peak in early January. We assume that the S&P 500 will fall a further 10% in real terms over the next 12 months in a “mild recession” scenario (30% odds) and by 25% in a “deep recession” scenario (10% odds). Conversely, we assume that the S&P 500 will be 20% higher in 12 months’ time in a “no recession” scenario (60% odds). Note that even in a “no recession” scenario, the real value of the S&P 500 would still be down 12% in June 2023 from its all-time high. On a probability-weighted basis, the expected 12-month real return across all three scenarios works out to 6.5%, or 8% with dividends (Table 1). That is enough to justify a modest overweight in my view – but given the risks, just barely. Investors focused on capital preservation should consider a more conservative stance. Table 1S&P 500 Drawdowns Depending On Whether The US Will Enter A Recession And How Severe It Will Be
Hard Or Soft Landing? BCA Strategists Debate The Question
Hard Or Soft Landing? BCA Strategists Debate The Question
Most of my colleagues were more cautious than me, as they generally thought that the odds of a recession were greater than 50%. They voted to shift the BCA house view to a neutral asset allocation stance on equities, with a slight plurality favoring an outright underweight (10 for underweight; 9 for neutral; and 6 for overweight). Peter Berezin Chief Global Strategist peterb@bcaresearch.com Global Investment Strategy View Matrix
Hard Or Soft Landing? BCA Strategists Debate The Question
Hard Or Soft Landing? BCA Strategists Debate The Question
Special Trade Recommendations Current MacroQuant Model Scores
Hard Or Soft Landing? BCA Strategists Debate The Question
Hard Or Soft Landing? BCA Strategists Debate The Question
Executive Summary Calculating Trend Inflation
Calculating Trend Inflation
Calculating Trend Inflation
Investors should anticipate 50 basis point rate hikes at each FOMC meeting, eventually transitioning to 25 bps per meeting once inflation shows clear and convincing evidence of trending down. This transition should occur later this year. Core inflation has peaked for the year and it can fall to a range of 4-5% even in the absence of an economic recession or meaningful labor market weakness. A recession will eventually be required to push inflation from 4% down to the Fed’s 2% target. Economic growth will slow going forward, but we won’t see enough weakness for the Fed to abandon its tightening cycle within the next 6-12 months. Bottom Line: US bond investors should keep portfolio duration close to benchmark, underweight TIPS versus nominal Treasuries and maintain a defensive posture on corporate bond spreads (underweight IG and neutral HY). The Fed Goes Big Chart 1Inflation Expectations
Inflation Expectations
Inflation Expectations
The US Federal Reserve continued to prove its inflation-fighting mettle last week with a 75 basis point rate hike, the largest single-meeting increase since 1994. Chair Powell had initially telegraphed 50 basis point rate increases for both the June and July FOMC meetings, but he made it clear during last week’s press conference that the committee was spooked by May’s surprisingly high CPI number and by the recent jump in 5-10 year household inflation expectations (Chart 1). Alongside the 75 basis point rate hike, committee members revised up their fed funds rate forecasts. The median FOMC member now expects the funds rate to reach a range of 3.25% to 3.5% by the end of 2022. That is consistent with three more 50 basis point rate hikes and one more 25 basis point hike at this year’s four remaining FOMC meetings. Looking further out, the median committee member anticipates 25-50 bps additional upside in the fed funds rate in 2023 but is then forecasting a modest reduction in 2024. Critically, the fed funds rate is still expected to be above estimates of long-run neutral by the end of 2024. Chart 2 shows how current market expectations compare to the Fed’s forecasts. We see that, even after the Fed’s upward forecast revisions, the market still anticipates a somewhat faster pace of tightening this year. The market is also priced for rate cuts in 2023, likely due to the increasingly widespread expectation that a recession is coming within the next 12 months. Chart 2Rate Expectations: Market Versus Fed
Rate Expectations: Market Versus Fed
Rate Expectations: Market Versus Fed
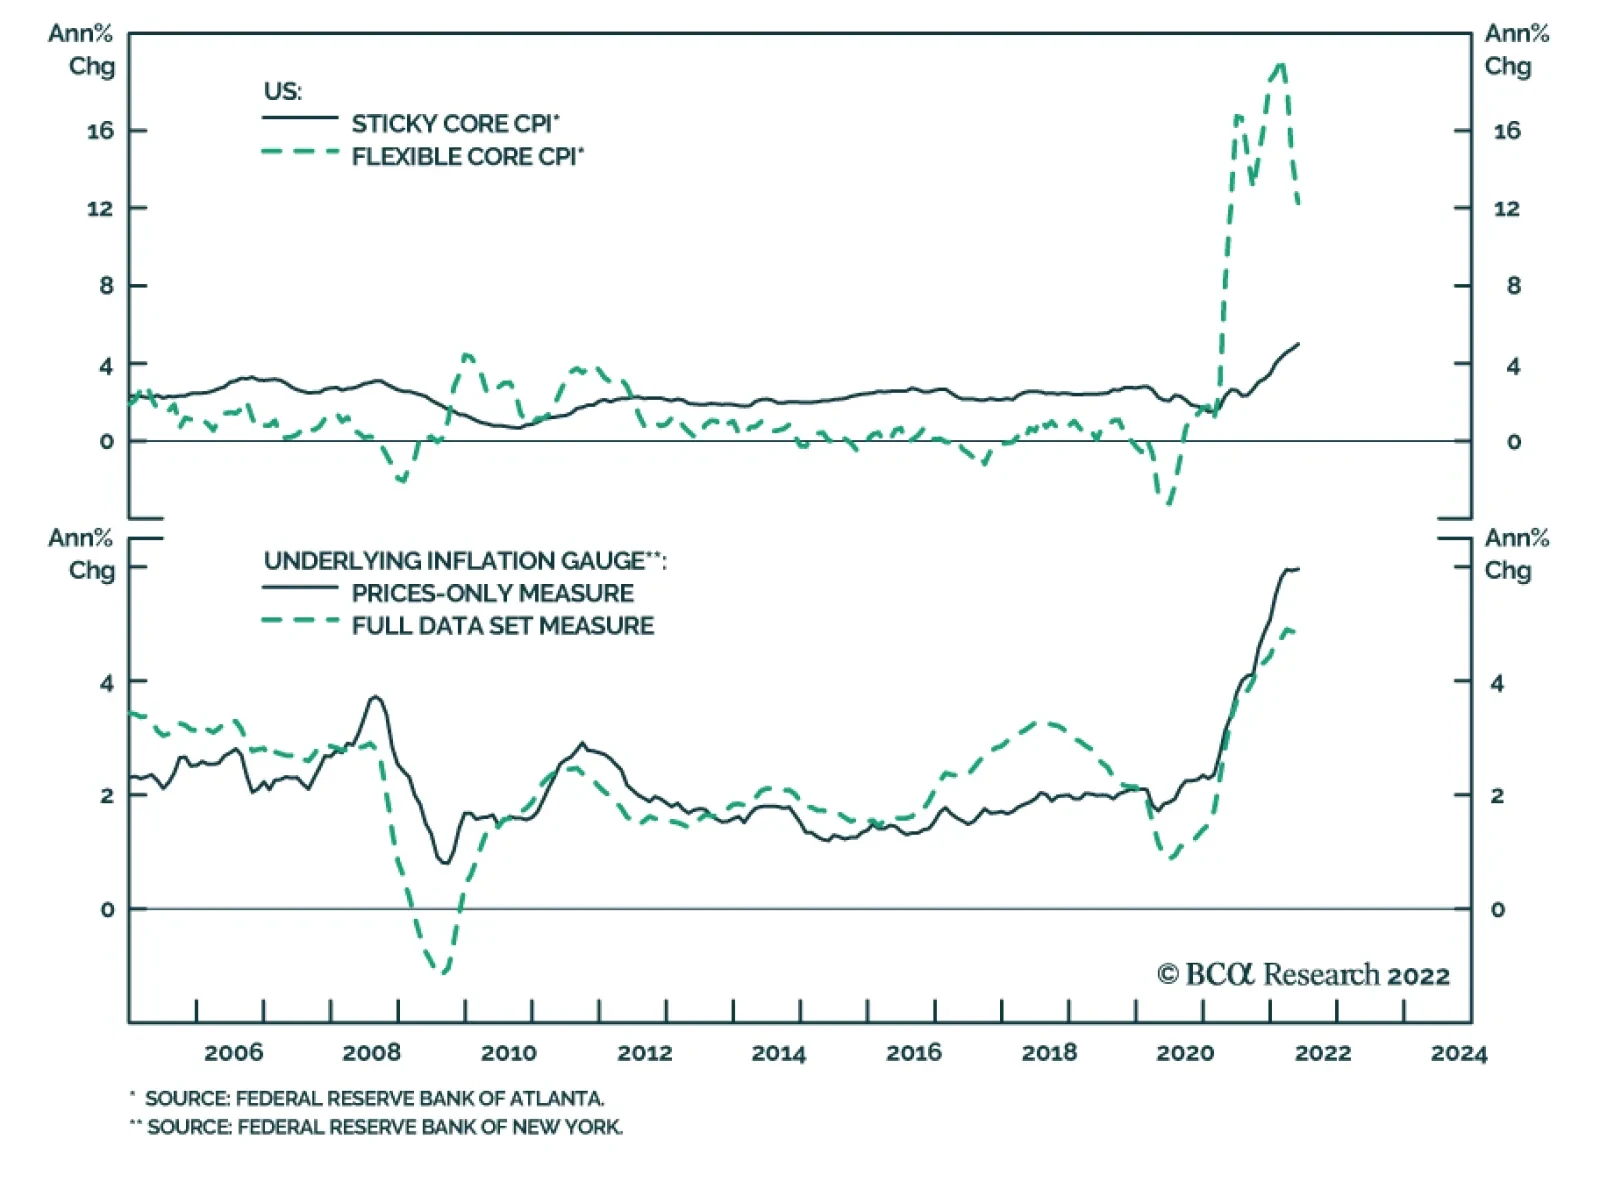
The Fed’s Near-Term Plan As for what we can expect going forward, we found two comments from Chair Powell’s press conference particularly enlightening. First, he called last week’s 75 basis point rate increase “unusually large” and said that he “doesn’t expect moves of that size to be common.” Second, Powell said that the Committee will need to see “convincing” and “compelling” evidence of falling inflation before it starts to moderate its tightening pace.1 From these statements we deduce the following near-term plan: 1. The Fed’s baseline expectation is to lift rates by 50 bps at each meeting. 2. A significant upside surprise in either the monthly core CPI data or long-dated inflation expectations would cause the Fed to lift by 75 bps instead of 50 bps. 3. The Fed will not reduce the pace of tightening to 25 bps per meeting until there is clear and convincing evidence that inflation is trending down. Bottom Line: Investors should anticipate 50 basis point rate hikes at each FOMC meeting, eventually transitioning to 25 bps per meeting once inflation shows clear and convincing evidence of trending down. This transition from 50 bps per meeting to 25 bps per meeting should occur later this year, meaning that the Fed will tighten no more quickly than what is already priced into the yield curve for the remainder of 2022. Inflation: All Clear To 4%, 2% Will Be More Challenging It’s evident from the above discussion that inflation remains the critical input for both monetary policy and US bond yields. In particular, the key questions are: 1. Will inflation trend down, and if so, how quickly? 2. Is an economic recession required to curtail inflation? Our answer to these questions is that core US inflation should fall naturally to a trend rate of roughly 4-5%, even in the absence of recession. However, an economic recession and its associated labor market weakness are likely required to move inflation from 4% back to the Fed’s 2% target. Chart 3Calculating Trend Inflation
Calculating Trend Inflation
Calculating Trend Inflation
To arrive at these conclusions, we seek out different ways of estimating inflation’s underlying trend (Chart 3). The first method we consider is the Atlanta Fed’s decomposition of core inflation into “flexible” and “sticky” components. As defined by the Atlanta Fed, “flexible” items tend to change price more frequently compared to “sticky” items. Items like hotels and new & used vehicles fall into the flexible index, while rent and medical care fall into the sticky index.2 As of May, 12-month core flexible inflation is running at a rate of 12.3%. Meanwhile, core sticky inflation is running at 5.0% (Chart 3, top panel). Second, we consider the New York Fed’s Underlying Inflation Gauge (UIG). The UIG uses a dynamic factor model to derive a measure of trend inflation from a broad set of data.3 In total, the measure uses 346 data series encompassing price measures and other nominal, real and financial variables. The New York Fed has demonstrated that the UIG provides better forecasts of CPI inflation than other measures of core and trimmed mean inflation. At present, the UIG is running at 4.9% (Chart 3, panel 2). A second “prices only” UIG measure that includes only price data and no other economic or financial variables is running hotter at 6.0%. Finally, we can assess inflation’s underlying trend by looking at wage growth. Specifically, we can look at unit labor costs, a measure of wages relative to productivity. Unit labor costs are volatile, but they tend to track core inflation over long periods of time. Unit labor costs grew at an extremely high rate of 8.2% in the four quarters ending in Q1, but this is partly due to huge post-pandemic swings in productivity growth. If we create a more stable measure of underlying wage pressure by subtracting annualized 5-year productivity growth from the 12-month growth rate in average hourly earnings, we see that this trend inflation measure is running at only 3.8% (Chart 3, bottom panel). Chart 4Auto Inflation Will Slow
Auto Inflation Will Slow
Auto Inflation Will Slow
We conclude from our analysis that 12-month core CPI inflation will fall from its current 6.0% back down to its trend level of roughly 4-5% without the Fed needing to slam the brakes on economic growth. This will occur because we will finally see the normalization of some prices that were pushed dramatically higher during the pandemic. Auto price inflation, for example, shot up above 20% last year because the pandemic and the fiscal response to the pandemic conspired to cause a surge in auto sales at the same time as a slump in production (Chart 4). Now, for reasons that have nothing to do with monetary policy but everything to do with the waning impact of the pandemic, we see auto sales rolling over as production ramps up. This will push prices lower in the second half of this year. All that said, once core inflation reaches its 4-5% trend level, more economic pain will be required to push it lower. Shelter, for example, carries a huge weight in the Atlanta Fed’s core sticky CPI and it is highly correlated with the economic cycle. A rising unemployment rate, and an economic recession, will eventually be required to push shelter inflation down. Bottom Line: Core inflation has peaked for the year and it can fall to a range of 4-5% even in the absence of an economic recession or meaningful labor market weakness. A recession and a rising unemployment rate will eventually be required to push inflation from 4% down to the Fed’s 2% target. The Risk Of Recession Just because US inflation can fall to 4% in the absence of recession doesn’t mean that the Fed won’t get impatient and cause one anyways. In fact, the Fed made it clear last week that it isn’t interested in nuanced inflation forecasts. The Fed will tighten aggressively until it is apparent that inflation is rolling over, even if it causes economic pain. In this section, we run through several economic and financial market indicators that often send signals near the peak of Fed tightening cycles and in advance of recessions. We conclude that economic growth is slowing, but we do not yet see any evidence of an imminent recession or of any growth slowdown that would be large enough for the Fed to pause or reverse its tightening cycle. First, we look at financial conditions (Chart 5). The Goldman Sachs Financial Conditions Index has tightened rapidly during the past few months and that tightening is broad-based across all five of the index’s components. That said, the index has still not quite moved into “restrictive” territory. Typically, Fed tightening cycles only end once financial conditions are already restrictive, and in this cycle, high inflation means that the Fed will likely tolerate even more tightening of financial conditions than usual. Second, we observe that the end of a Fed tightening cycle is often marked by a dip in the ISM Manufacturing PMI to below 50. Presently, the PMI is a solid 56.1 but it is falling, and regional Fed surveys suggest that it may soon dip into contractionary territory (Chart 6). Chart 5Financial Conditions
Financial Conditions
Financial Conditions
Chart 6PMIs Are Slowing
PMIs Are Slowing
PMIs Are Slowing
Third, residential construction activity is a strong predictor of both recession and the end of Fed tightening cycles. Specifically, we have observed that Fed tightening cycles tend to terminate once the 12-month moving average of housing starts falls below the 24-month moving average.4 At present, there is strong evidence that higher mortgage rates are starting to bite the housing market. Housing starts dipped sharply in May and homebuilder confidence is trending down (Chart 7). That said, our housing starts indicator still has a long way to go before it signals the end of the Fed’s tightening cycle (Chart 7, bottom panel). Finally, we turn to the labor market where we do not yet see any evidence of an economic slowdown. Nonfarm payroll growth usually turns negative prior to recession, but right now it is running at a rate of 4.5% during the past 12 months and 3.3% during the past three months (Chart 8). The unemployment rate, for its part, is extremely low, but this only reinforces the idea that the Fed won’t be inclined to abandon its tightening cycle anytime soon. Chart 7US Housing
US Housing
US Housing
Chart 8The US Labor Market
The US Labor Market
The US Labor Market
Consider that the Congressional Budget Office estimates that the natural unemployment rate is 4.4% and the median FOMC member estimates that it is 4.0%. In other words, the Fed would still consider the labor market tight even if the unemployment rate rose from its current 3.6% level to around 4%. Even though such an increase in the unemployment rate might technically be consistent with a recession, the Fed would not be inclined to ease monetary policy into such a labor market if inflation is still above its 2% target. Additionally, we must also consider that the labor force participation rate is trending up and it still has breathing room before it reaches its pre-pandemic level. Further increases in labor force participation – which seem likely – could support employment growth going forward even if the unemployment rate stops falling. Bottom Line: The Fed’s rate hikes, and tighter financial conditions more generally, will slow economic growth going forward. However, we don’t see any evidence that growth will be weak enough for the Fed to abandon its tightening cycle within the next 6-12 months. This is especially true because above-target inflation increases the amount of financial conditions tightening and labor market pain that the Fed will tolerate. Investment Implications Portfolio Duration & US Treasury Curve May’s surprisingly elevated CPI number caused US Treasury yields to move above their 2018 peaks across the entire yield curve (Chart 9). But we wouldn’t be surprised to see that uptrend take a breather during the next few months as inflation descends toward its 4-5% underlying trend. As noted above, falling inflation will likely cause the Fed to tighten by no more than what is already discounted between now and the end of the year, this should keep US Treasury yields rangebound. As a result, we advise investors to keep duration close to benchmark in US bond portfolios, with an eye toward re-evaluating this positioning once core inflation moves closer to its underlying trend. Chart 9US Treasury Yields
US Treasury Yields
US Treasury Yields
On the Treasury curve, the 5-year note continues to trade cheap relative to the 2-year/10-year slope (Chart 9, bottom panel). We recommend buying the 5-year note versus a duration-matched barbell consisting of the 2-year and 10-year notes. TIPS Chart 10Underweight TIPS Versus Nominals
Underweight TIPS Versus Nominals
Underweight TIPS Versus Nominals
Investors should position for inflation falling back to trend by underweighting TIPS versus duration-matched nominal US Treasuries. Not only will falling inflation weigh on TIPS breakeven inflation rates during the next few months but a resolutely hawkish Fed will also apply downward pressure (Chart 10). We are particularly bearish on short-maturity TIPS, and we advise investors to initiate outright short positions in 2-year TIPS (Chart 10, bottom panel). In last week’s press conference, Chair Powell pointed to negative short-maturity real yields as evidence that financial conditions have room to tighten further. To us, this suggests that the Fed will not quit until real yields move into positive territory across the entire yield curve. In an environment of falling inflation, this is likely to occur because of falling TIPS breakeven inflation rates. However, the Fed has now demonstrated that even if inflation doesn’t fall it will push real yields higher with its policy rate actions and forward guidance. Corporate Credit The combination of slowing economic growth and increasingly restrictive Fed policy compels us toward a defensive positioning on corporate bond spreads. Specifically, we advise investors to carry an underweight (2 out of 5) allocation to investment grade US corporate bonds and a neutral (3 out of 5) allocation to high-yield US corporate bonds. Our slight preference for high-yield comes from the view that spread widening is likely to take a breather this year as inflation turns down and the Fed tightens by no more than what is already discounted in the yield curve. Though the long-run prospects for corporate bond returns remain bleak, if inflation moderates this year as we expect, then spreads could easily re-tighten to the average levels seen during the last tightening cycle (2017-19). That would equate to 31 bps of spread tightening for investment grade US corporate bonds (Chart 11), or roughly 300 bps of excess return versus duration-matched US Treasuries.5 For high-yield, a return to average 2017-19 spread levels would equate to 133 bps of spread tightening (Chart 12), or roughly 875 bps of excess return versus duration-matched US Treasuries.6 Chart 11IG Spreads
IG Spreads
IG Spreads
Chart 12HY Spreads
HY Spreads
HY Spreads
In our view, this warrants a slightly higher allocation to high-yield for the time being, though we will likely turn increasingly bearish should spreads tighten to average 2017-19 levels or once inflation converges with its 4-5% trend. Ryan Swift US Bond Strategist rswift@bcaresearch.com Footnotes 1 https://www.federalreserve.gov/mediacenter/files/FOMCpresconf20220615.pdf 2 For more info on the Atlanta Fed’s sticky and flexible CPIs please see: https://www.atlantafed.org/research/inflationproject/stickyprice 3 For more info on the Underlying Inflation Gauge please see https://www.newyorkfed.org/research/policy/underlying-inflation-gauge 4 For more details on this indicator please see US Bond Strategy Weekly Report, “The Bond Market Implications Of A 5% Mortgage Rate”, dated April 26, 2022. 5 This excess return estimate is roughly 31 bps of spread tightening multiplied by average index duration of 7.5. We then add half of the index OAS as an estimate of the carry earned during the next six months. 6 This excess return estimate is roughly 133 bps of spread tightening multiplied by average index duration of 4.3. We then add half of the index OAS, less estimated default losses of 200 bps, as an estimate of the carry earned during the next six months. Recommended Portfolio Specification Other Recommendations Treasury Index Returns Spread Product Returns
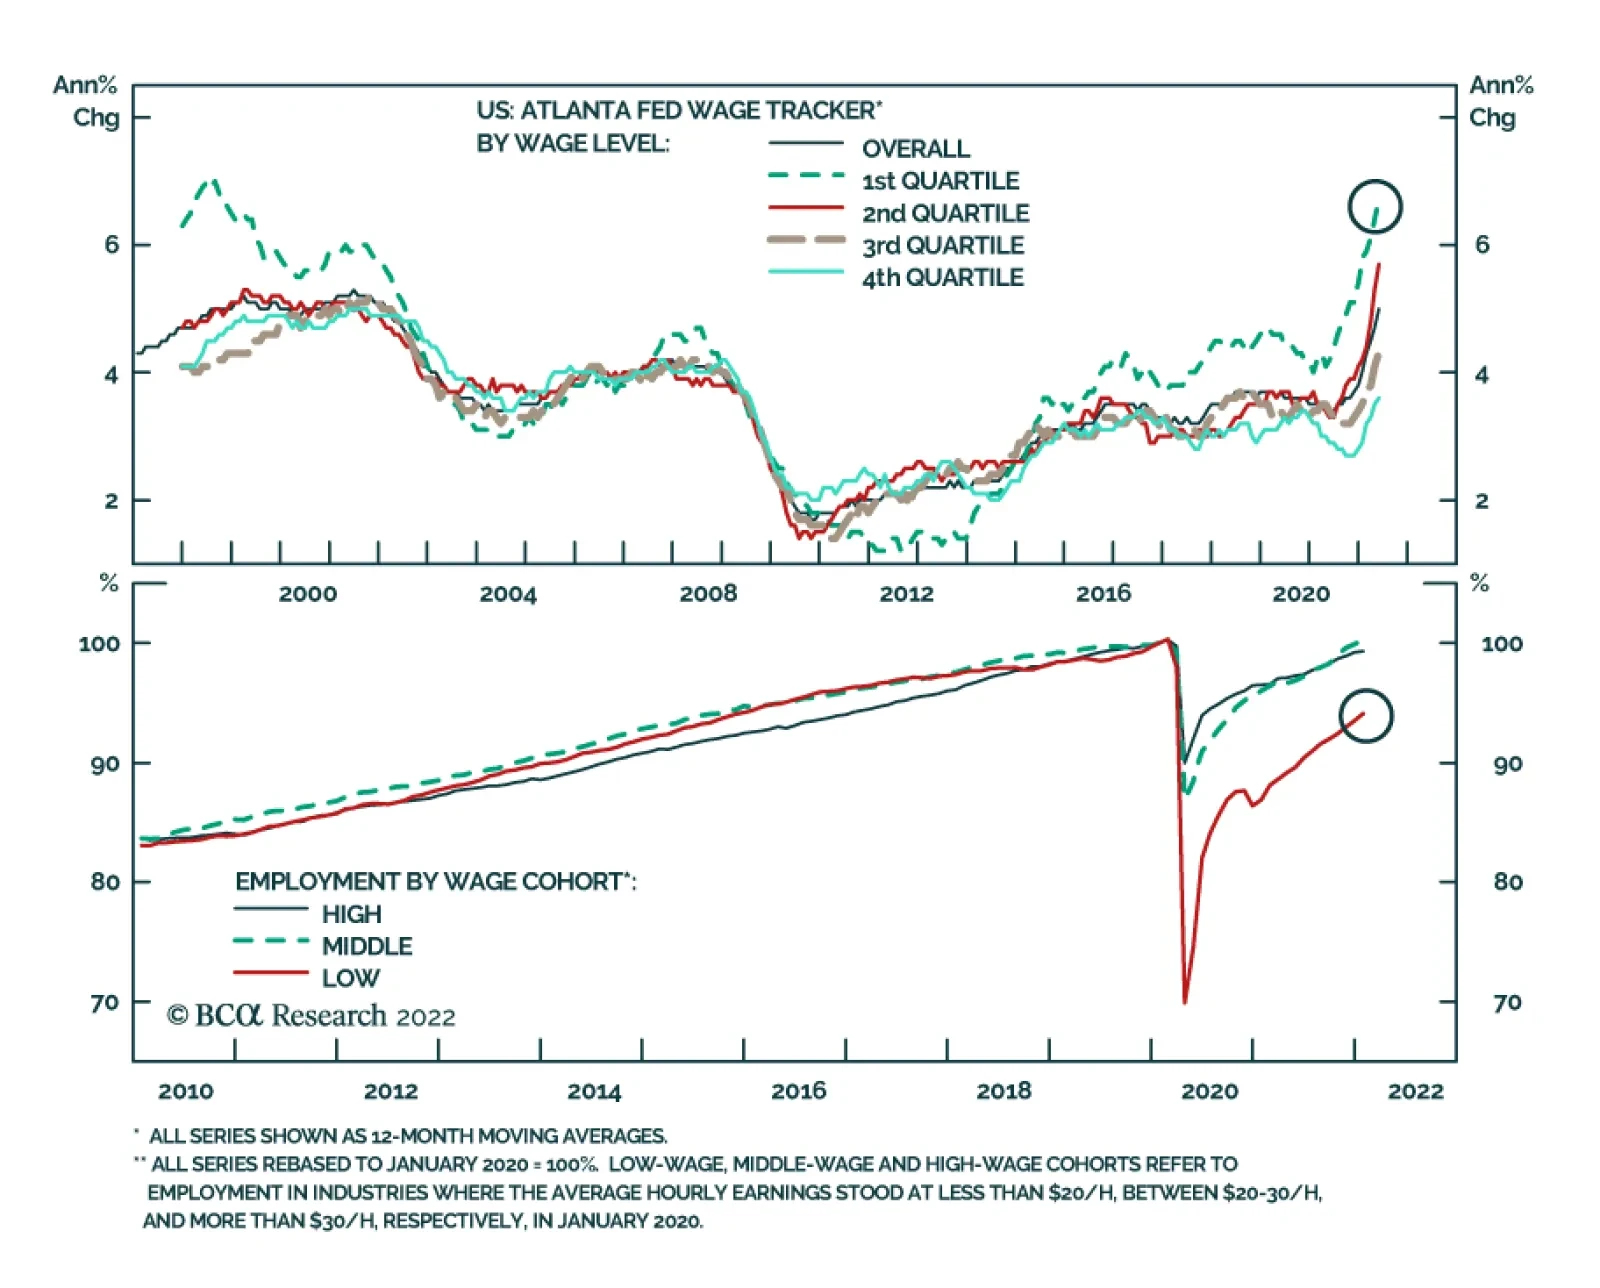
Business confidence in the US has collapsed this year. The Conference Board’s measure of CEO Confidence deteriorated for the fourth consecutive quarter in Q2 and is now near where it was at the onset of the pandemic in early 2020. The war in Ukraine and…
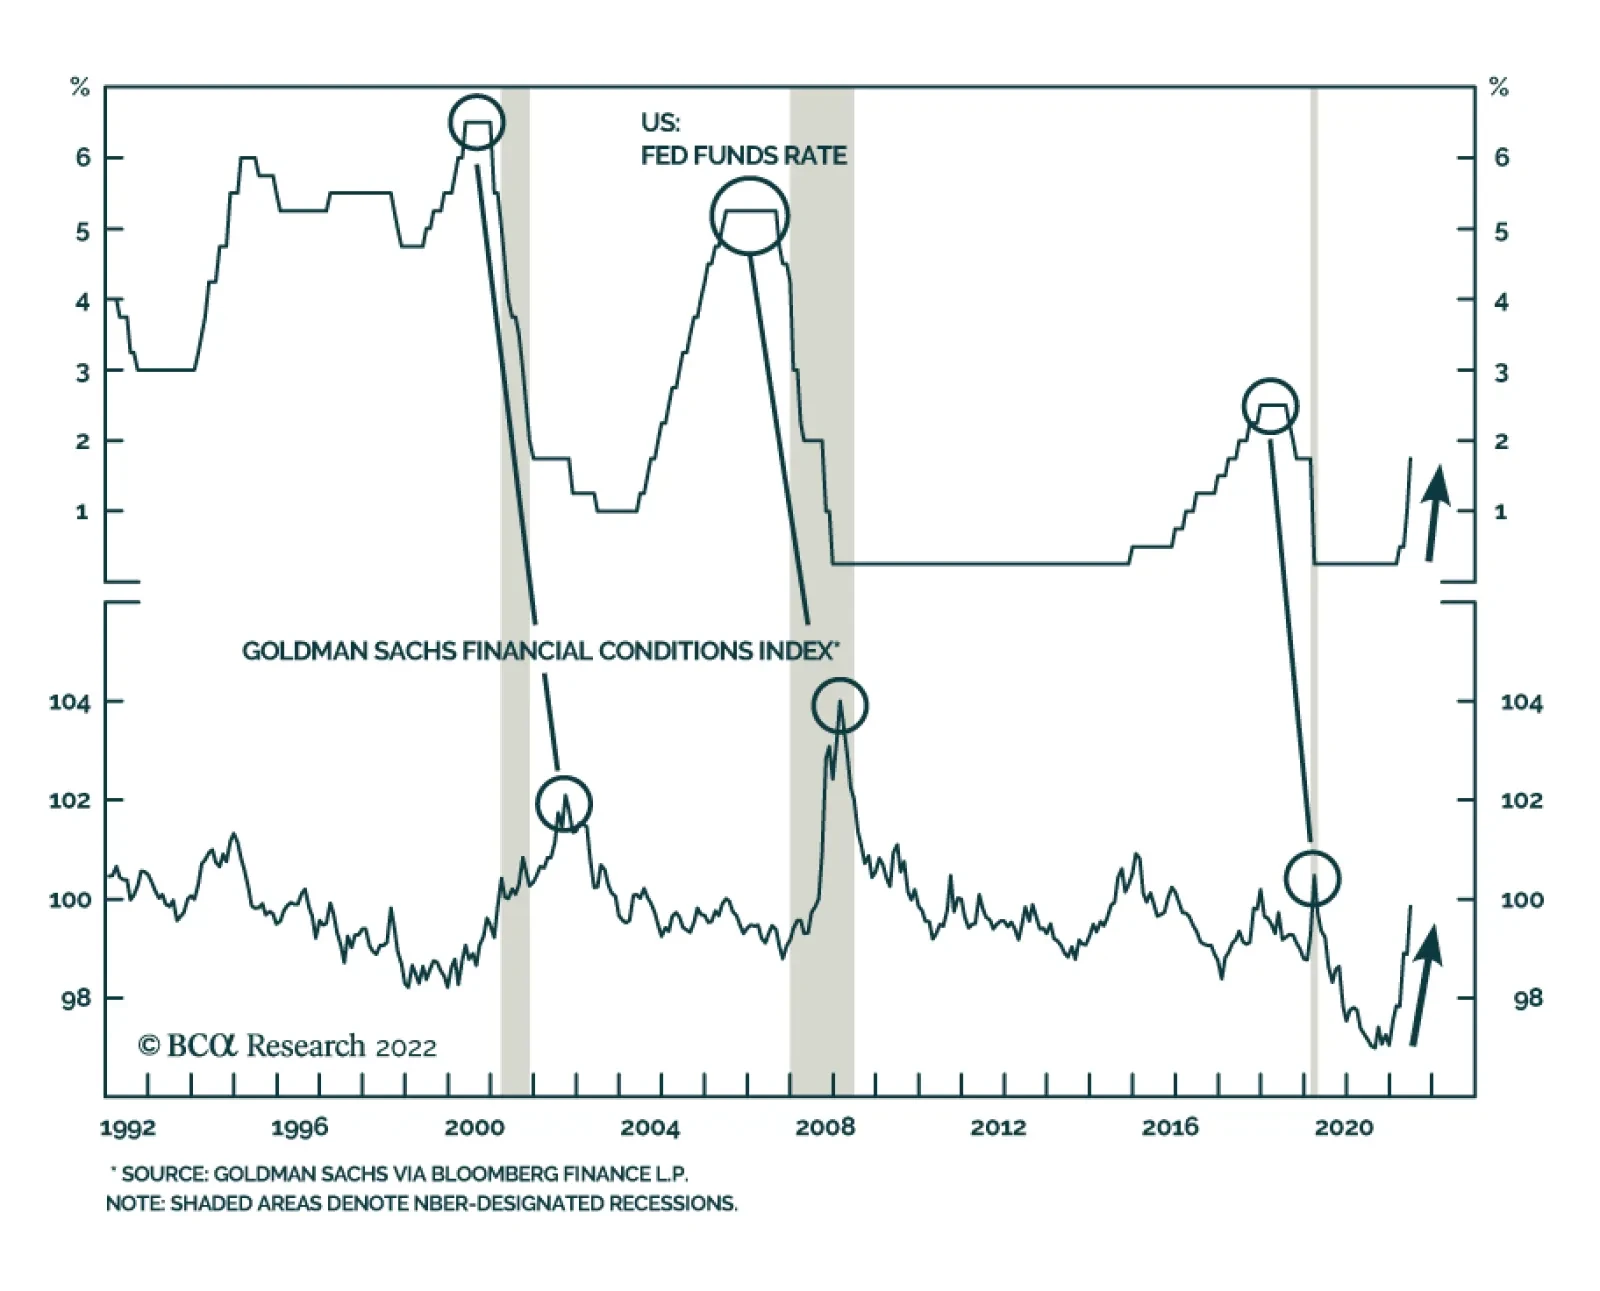
According to BCA Research’s US Investment Strategy service, if the recession is further away than moves in the bond, equity and foreign exchange markets imply, risk assets are poised to rebound. The current rate hike campaign’s real-time impact on…