United States

Executive Summary Ingredients For A Policy Mistake
Ingredients For A Policy Mistake
Ingredients For A Policy Mistake
The hawks on the European Central Bank Governing Council have become vocal about a July rate hike. Such a move would be a policy mistake because European growth is weak, while inflation is supply-driven and will soften meaningfully. July 2022 hike is not yet certain. A policy mistake suggests that the current interest rate pricing for June 23 is too aggressive. Buy June 2023 Euribor contract. The serious risk of a policy mistake and the uncertainty surrounding Europe’s energy security confirm that investors should maintain a defensive stance in European assets. The pronounced threats to UK growth warrant a negative view on the pound. Recommendation INCEPTION DATE RETURN SINCE INCEPTION (%) COMMENT Buy June 2023 Euribor contract 05/09/2022 Bottom Line: Stay defensive in Europe. The risk of a policy mistake is high. Only when inflation peaks should investors move into cyclical stocks. In recent weeks, a chorus of ECB hawks expressed the need to increase rates as early as July 2022. Inflation data is on their side; HICP stands at 7.5% and core CPI has reached 3.5%, levels never seen since the introduction of the euro. Markets are responding. The ESTR curve is pricing in a positive ECB deposit rate for the October 2022 Governing Council meeting. We need to examine the underlying European economic picture to address two key questions: Will the ECB lift rates as early as July? And will doing so constitute a policy mistake that would hurt European assets? Weaker Growth Let’s start with the growth outlook. European economic activity is rapidly deteriorating. Real GDP growth in the Eurozone has slowed markedly. In Q1, real GDP growth fell to 0.2% quarter-on-quarter or an annualized rate of 0.8%. Worrisomely, Italy’s GDP contracted by -0.2% over that time frame and the very economically sensitive Swedish activity contracted by -0.4%, which suggests that Europe’s deceleration is only starting. Soft data confirm the flagging economic outlook on the continent. Consumer confidence is plunging to levels that are consistent with a recession, led by the collapse in the willingness to make large purchases (Chart 1, top panel). The ZEW as well as the Ifo survey confirm that growth expectations point to a very large decline in output (Chart 1, bottom panel). The weakness is also evident in hard data. High inflation erodes real household income, which squeezes consumer spending. Retail sales across Europe are slowing sharply, only growing at an annual rate of 0.8% while contracting -0.4% on a monthly basis; on a level basis, they are lower today than they were in June 2021. Meanwhile, German retail sales volumes are falling at a -5.4% annual rate. The situation is even worse for new car registrations, which are collapsing at an annual rate of 20.2% (Chart 2). Chart 1Soft Data Point To Soft Growth...
Soft Data Point To Soft Growth...
Soft Data Point To Soft Growth...
Chart 2...So Do Hard Data
...So Do Hard Data
...So Do Hard Data
Industrial production has not been spared. Euro Area IP softened to 2% annually in February and contractions are now visible in Germany and France. Some of this weakness reflects supply difficulties, but the -3.1% annual fall in German factory orders indicates that demand is frail too and that industrial production will shrink further in the months ahead (Chart 2, bottom panel). The deterioration in the global outlook further hurts Europe economic prospects. Our global growth tax indicator, based on energy prices, the dollar, and global bond yields, points toward a further deceleration in the global and US manufacturing PMI, it suggests Euro Area PMIs could fall below 50 (Chart 3). China woes continue to reverberate throughout the global economy. Potential supply constraints will hurt industrial production, but, more importantly, the weakness in China’s marginal propensity to consume (as measured by the gap between the growth rate of M1 relative to M2) predicts a much greater deterioration in European industrial orders, which means that the demand for European capital goods will slow (Chart 3, bottom panel). Chart 3Risks To The Downside
Risks To The Downside
Risks To The Downside
Chart 4Tightening Financial Conditions
Tightening Financial Conditions
Tightening Financial Conditions
European financial conditions are also tightening significantly. The iTraxx Crossover Index is rising swiftly. European high-yield corporate spreads are now above 450bps, levels that coincide with past recessions in the Euro Area (Chart 4). Government bond markets are increasingly under duress too. Italian BTPs now yield close to 200bps above German Bunds (Chart 4, bottom panel), which accentuates the periphery’s pain. Bottom Line: The Eurozone economy is slowing sharply. While Q1 GDP avoided a contraction, soft and hard data indicators suggest that Q2 is likely to record an actual output contraction for the whole Euro bloc. High Inflation, But For How Long? At first glance, European inflation numbers scream for an ECB rate hike, preferably one yesterday. However, the picture is not that clear-cut. Supply factors predominantly drive the Eurozone’s inflation surge. Chart 5 highlights the role of energy, utilities, food, and transportation costs in the HICP and shows that these factors account for more than 80% of the 7.5% HICP rate. Moreover, the fluctuations in energy CPI continue to explain most of the gyration in headline CPI. The close relationship between energy CPI and core CPI highlights an elevated degree of pass-though, the result of higher electricity and transportation costs (Chart 6). Chart 5Energy, Food And Transport Dominate European CPI
An ECB Policy Mistake And Your Portfolio
An ECB Policy Mistake And Your Portfolio
Chart 6All About Energy
All About Energy
All About Energy
Chart 7No Demand Pull-Inflation In Europe
No Demand Pull-Inflation In Europe
No Demand Pull-Inflation In Europe
Unlike those in the US, Euro Area underlying inflation drivers are weak and inconsistent with demand-pull inflation. Wage growth in Europe stands at a paltry 1.6% annual rate, while in the US, the Atlanta Fed Wage Tracker has jumped to 4.5% (Chart 7, top panel). Moreover, Eurozone rent inflation remains stable at 1.2%, while it is a very elevated 4.5% in the US (Chart 7, bottom panel). The bifurcation in demand-driven inflation reflects vastly different output gaps between the two regions. US nominal GDP stands 2.5% above its 2014-2019 trend, while that of the Eurozone is still 5.3% below it. In the consumer durable goods sector, where the US experienced the greatest demand-supply mismatch – and therefore, the greatest inflation pressures – purchases are 25% above their 2014-2019 trend, while in Europe, they are still 9.5% below that trend (Chart 8) Year-on-year inflation prints should roll over this summer, as highlighted by weakening sequential inflation. Even if it remains elevated, the monthly Trimmed Mean CPI peaked last year. Energy inflation, moreover, is already contracting on a month-to-month basis (Chart 9). Chart 8Mind The Output Gap
Mind The Output Gap
Mind The Output Gap
Chart 9Weakening Sequential Inflation
Weakening Sequential Inflation
Weakening Sequential Inflation
Chart 10A Naive Inflation Forecast
A Naive Inflation Forecast
A Naive Inflation Forecast
Simple simulation exercises also confirm that annual inflation will peak this summer (Chart 10). Monthly headline inflation averaged 0.11% from 2010 to 2019, 0.31% in the first half of 2021, and 0.55% from mid-2021 to January 2022. If we assume that monthly inflation prints remain in line with its most recent average, annual inflation will peak by year-end at 9.1%, before falling to 6.8% by April 2023. However, if monthly inflation falls back to an historically elevated monthly average of 0.31%, annual headline inflation will peak in September and fall back to 3.8% by April 2023. Similarly, if monthly core CPI averages 0.28%, annual core CPI will peak in October before declining to 3.4% by April 2023, but it will fall to 2.1% by April 2023, if monthly core CPI averages an historically elevated 0.17%, or the average observed in the first half of 2021 (Chart 10, bottom two panels). Chart 11A Conditional Inflation Forecast
A Conditional Inflation Forecast
A Conditional Inflation Forecast
A more sophisticated exercise based on energy prices and the EUR/USD exchange rate also underlines the downside for Euro Area headline inflation. Energy inflation, which drives headline CPI, closely tracks the evolution of brent prices in euro terms and Deutsch natural gas prices. Assuming that natural gas prices average the historically very high level of €100/MWh over the next twelve months, that Brent averages US$95/bbl over that time frame (consistent with BCA’s commodity and energy team forecasts), and that the euro progressively moves back to EUR/USD1.10 by April 2023 (a weaker expectation than BCA’s Foreign Exchange Strategy team anticipates), then the Eurozone’s energy inflation will collapse to -10% by April 2023 (Chart 11). We can also assume that Russia enacts a full energy embargo on Western Europe if Sweden and Finland apply for NATO membership. In this case, Brent would spike quickly to $140/bbl and natural gas to €250/MWh. In our scenario, prices stay elevated for two months, before they ultimately normalize by early 2023. Under this scenario, energy inflation would experience a spike to 80% (!) in June 2022 before falling back sharply. In all cases, the collapse in energy inflation is consistent with a rapid decline in headline inflation toward 2% in 2023. Bottom Line: European inflation is elevated but remains mainly driven by supply factors, particularly the evolution of energy inflation. Demand-pull inflation is minimal, unlike that in the US. Additionally, both core and headline inflations are set to peak in the coming months based on the evolution of sequential monthly inflation as well as the behavior of the energy market. A July ECB rate hike would constitute a policy mistake for three reasons: (i) the ECB has no control over supply-driven inflation; (ii) Eurozone inflation is set to weaken; and (iii) economic growth will remain poor. Investment Implications Despite the noise made by the hawks, a large amount of uncertainty around the July 2022 meeting’s outcome remains. It is easy to forget that the ECB’s decisions are consensual. Influential members such as Vice-President Luis de Guindos continues to see a July 2022 hike as possible but unlikely. Others, such as Executive Board member Fabio Panetta, are very worried about the Eurozone’s economic slowdown. Moreover, ECB President Christine Lagarde has not endorsed the hawks. In the context of weak growth and a potential top in inflation, achieving consensus about an early summer hike could be difficult. Chart 12Patience Would Be Rewarded
Patience Would Be Rewarded
Patience Would Be Rewarded
The great paradox is that, if the ECB waits before pushing interest rates up, it will have an opportunity to increase rates durably next year. Wage growth is anemic today, but the decline in the Eurozone unemployment rate is consistent with a pickup in salaries in 2023 (Chart 12). Moreover, if energy inflation slows, the relative price-shock that is hurting households and domestic demand will ebb, which will allow consumption to recover. Patience would give Europe strength and the ECB a very strong basis to lift rates sustainably. The hawks will sway the council to their views. Inflation has latency, which means that its inertia may cause HICP to remain elevated beyond this summer. Moreover, the EU’s proposed ban on Russian oil imports along with Sweden’s and Finland’s likely accession-demand to NATO in the upcoming weeks could provoke Russia to strike first by cutting all its energy export to the EU to zero immediately. This would lift inflation for somewhat longer, as we showed in Chart 9. Related Report European Investment StrategyThe Three Forces Hurting European Earnings In response to the significant risk of a rate hike, we continue to recommend investors stay short cyclical stocks relative to defensive ones. Moreover, if the risk of a Russian energy cutoff increases, so does the threat of a severe recession in Europe, as a recent Bundesbank study posits (Chart 13). Capital preservation is paramount in today’s context; thus, we continue to lean on the side of prudence, especially considering Europe’s soft profit outlook. Once risks recede, we will abandon this strategy. This decision, however, would require clarification of Sweden and Finland’s decision about their membership in NATO as well as Russia’s response, a confirmation that the ECB is not hiking rates in July, and a pullback in inflation surprises, which would prove a powerful help for European equities and the cyclicals/defensive split (Chart 14). Chart 13The Russian Embargo Risk
An ECB Policy Mistake And Your Portfolio
An ECB Policy Mistake And Your Portfolio
Chart 14Wait For Inflation To Turn
Wait For Inflation To Turn
Wait For Inflation To Turn
In fact, our view that inflation will peak leads to direct implications for European markets. The periods that followed the previous four peaks in European core inflation were associated with an outperformance of small-cap stocks and cyclical stocks over the subsequent six and twelve months as well as declines in German yields and narrower credit spreads (Table 1A). The sectoral implications were not as clear, but industrials enjoyed an edge, while healthcare stocks suffered marked declines. Our conviction is strongest that energy CPI will fall. Again, this environment is associated with an outperformance of small-caps stocks and cyclicals over the following six months (Table 1B). Sector-wise, energy names suffer in this climate along with defensives, especially communication services equities. Table 1APeaks In Core CPI & Subsequent European Asset Performance
An ECB Policy Mistake And Your Portfolio
An ECB Policy Mistake And Your Portfolio
Table 1BPeaks In Energy CPI & Subsequent European Asset Performance
An ECB Policy Mistake And Your Portfolio
An ECB Policy Mistake And Your Portfolio
Looking at this period of disinflation more broadly rather than just following peaks in inflation, we find similar results. Declining core CPI is associated with an outperformance of cyclicals relative to defensives as well as strength in small-cap equities (Table 2A). This larger sample allows for a clearer view of sectors. Specifically, the performance of industrials and tech relative to the broad market improves markedly, while utilities suffer greatly. We reach roughly similar conclusions when energy CPI is contracting, except that, in this instance, energy stocks also underperform (Table 2B). Interestingly, so do financial companies. This is a surprising result, but previous instances of weaker energy CPI in the sample reflected weaker demand, not an evolving supply shock. Weaker aggregate demand always hurts financials. Table 2ADisinflation & Subsequent European Asset Performance
An ECB Policy Mistake And Your Portfolio
An ECB Policy Mistake And Your Portfolio
Table 2BEnergy Deflation & Subsequent European Asset Performance
An ECB Policy Mistake And Your Portfolio
An ECB Policy Mistake And Your Portfolio
Bottom Line: The risk of a policy mistake at the July ECB meeting is elevated. A policy mistake suggests that the current interest rate pricing for June 23 is too aggressive. Buy June 2023 Euribor contract. Moreover, Russian energy exports are still under threat. Accordingly, we continue to emphasize capital preservation and favor defensives over cyclicals. However, a buying opportunity will emerge rapidly once inflation peaks, especially if the ECB follows our base case. At this point, investors should buy small-cap and cyclical stocks. Industrials will beat energy, while all the defensive sectors will suffer. The BoE’s Tough Choice The Bank of England is stuck between a rock and a hard place. UK inflation shares characteristics of that of both the Eurozone and the US. On the one hand, energy inflation is increasing and could push headline CPI into double-digit territory around October 2022, once fuel subsidies fully expire. On the other hand, wage growth is strong as labor supply elasticity declined after Brexit. Demand-pull inflation is also rampant, which has pushed core CPI to a 5.7% annual rate. The UK’s cost push inflation, along with the growth slowdown in Europe and increasing tax rates are likely to cause a recession in the UK over the coming twelve months. The demand-pull inflation, however, will force the BoE to hike interest rates. This accentuates the downside risk to UK economic activity. Chart 15BoE's First Victim: The Pound
BoE's First Victim: The Pound
BoE's First Victim: The Pound
The obvious victim of this configuration is the pound. Weak growth will prevent the BoE from matching the pace of rate hikes of the Fed and poor economic growth will detract from investments in the UK. As a result, we see further downside in GBP/USD (Chart 15). BCA’s FX strategy team is also selling the pound versus the euro. This position is likely to generate further gains as investors will revise down their views for UK economic activity relative to the Euro Area, since they already hold much more dire expectations for the latter than the former. Bottom Line: EUR/GBP possesses more upside. The growth outlook for the Eurozone is poor, but investors currently overestimate the growth path of the UK relative to that of its southern neighbor. Mathieu Savary, Chief European Strategist Mathieu@bcaresearch.com Tactical Recommendations Cyclical Recommendations Structural Recommendations
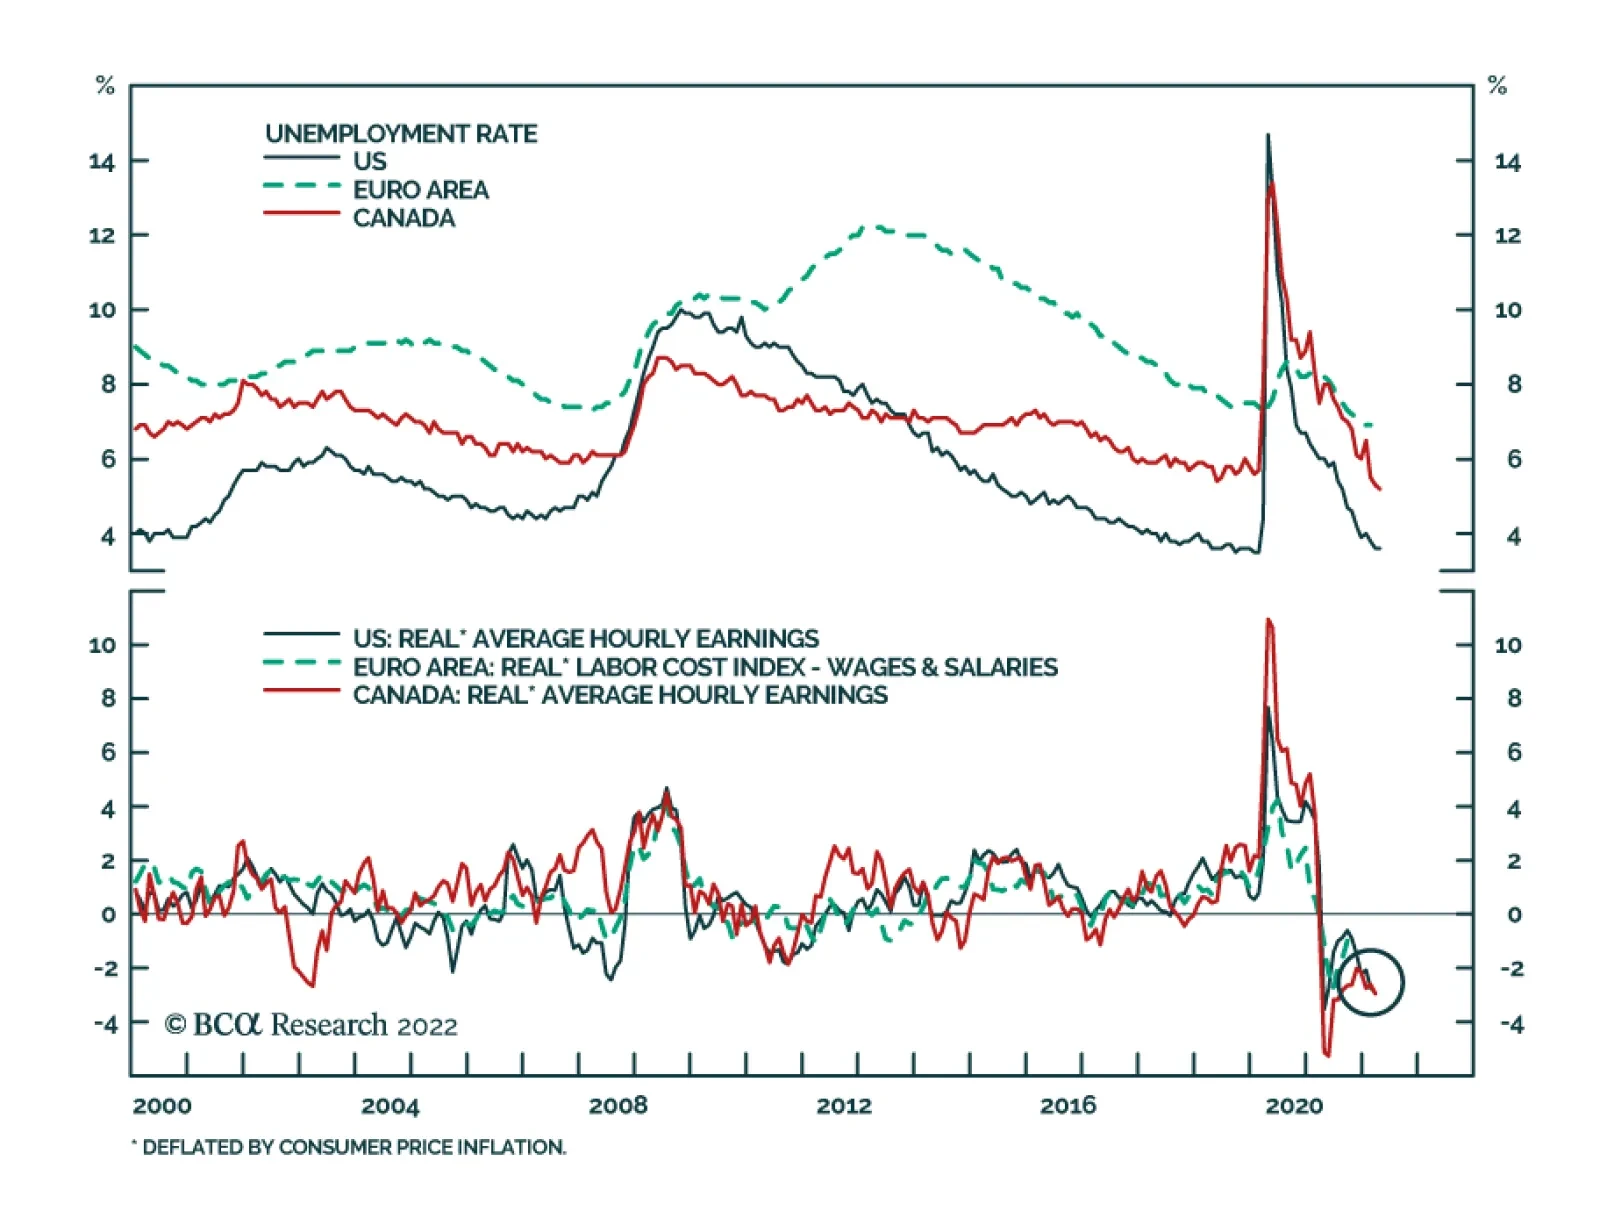
US nonfarm payrolls increased by 428 thousand in April, in line with the previous month’s level but above expectations of 380 thousand. The job gains were widespread and led by leisure and hospitality, manufacturing as well as the transportation and…
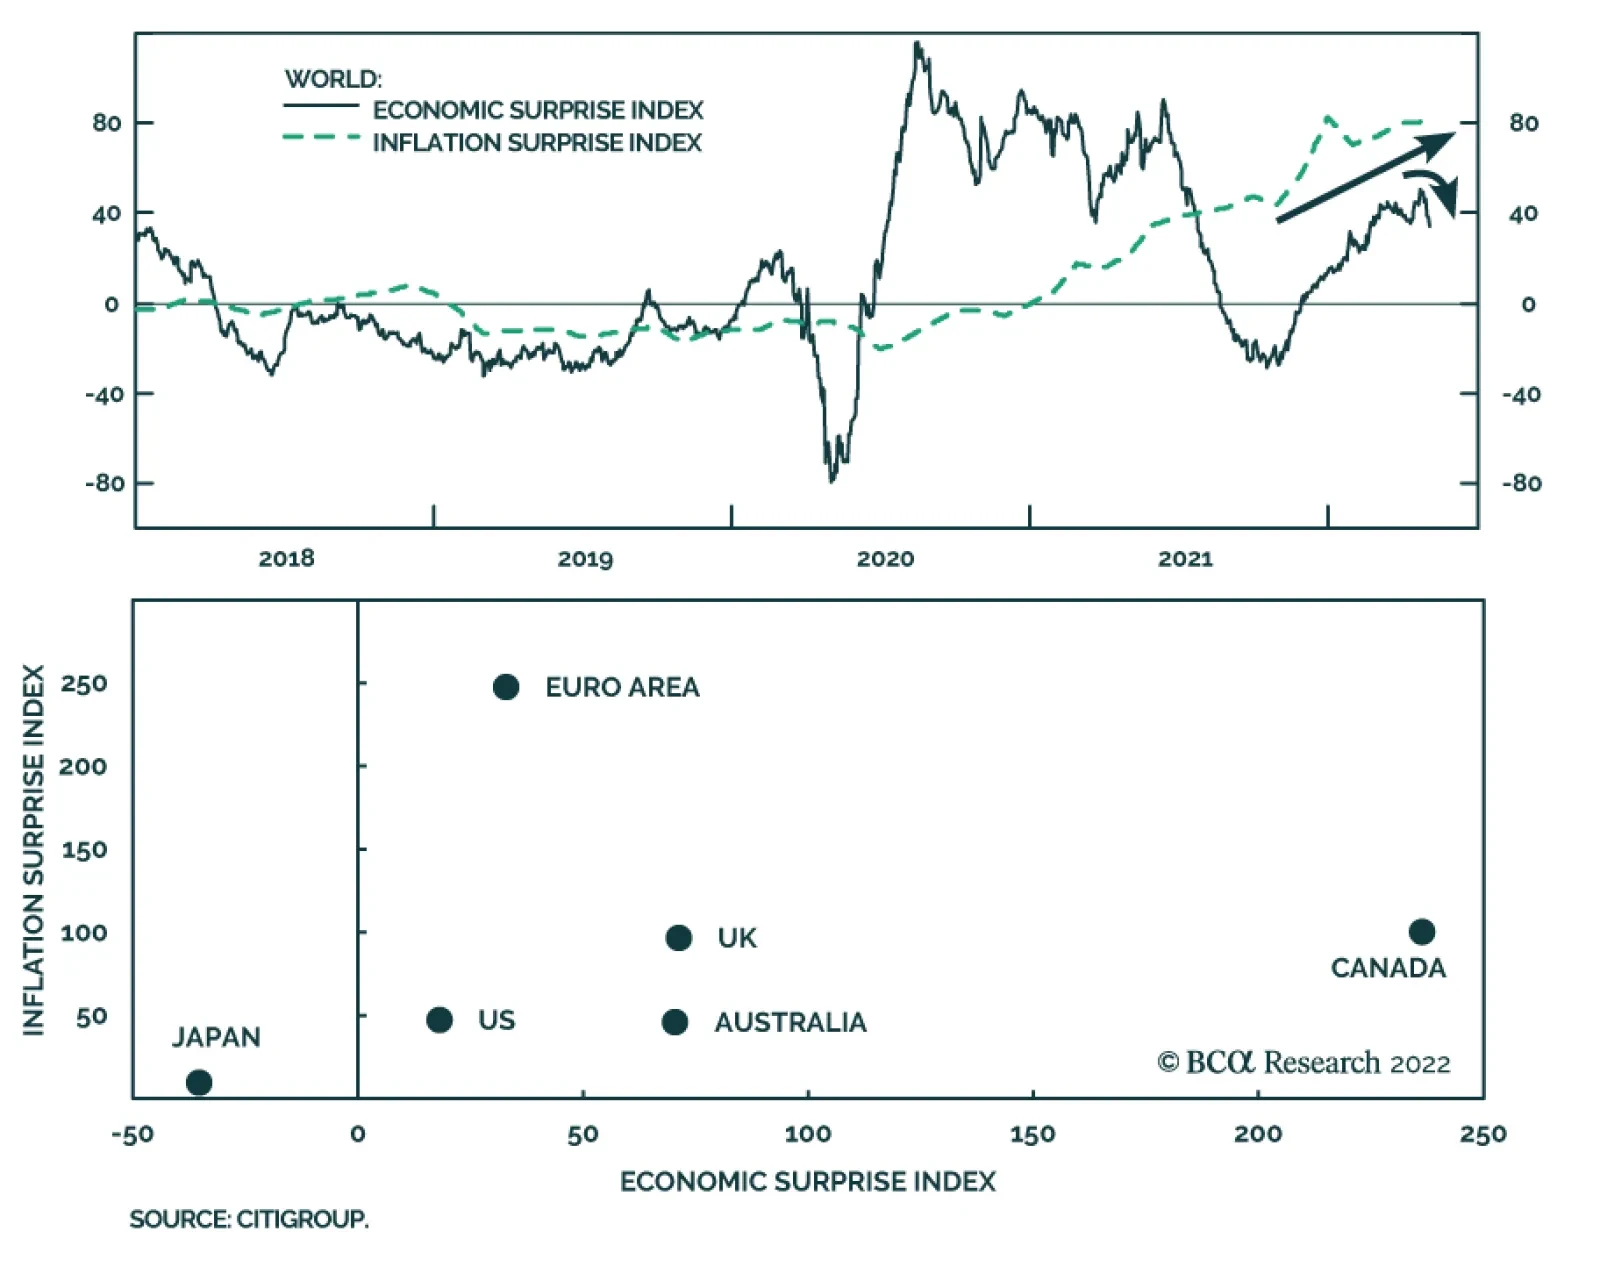
The global inflation surprise index continues to trend higher, while the global economic surprise index has recently rolled over. This divergence highlights the challenging environment policymakers are currently facing. On the one hand, they need to hike…
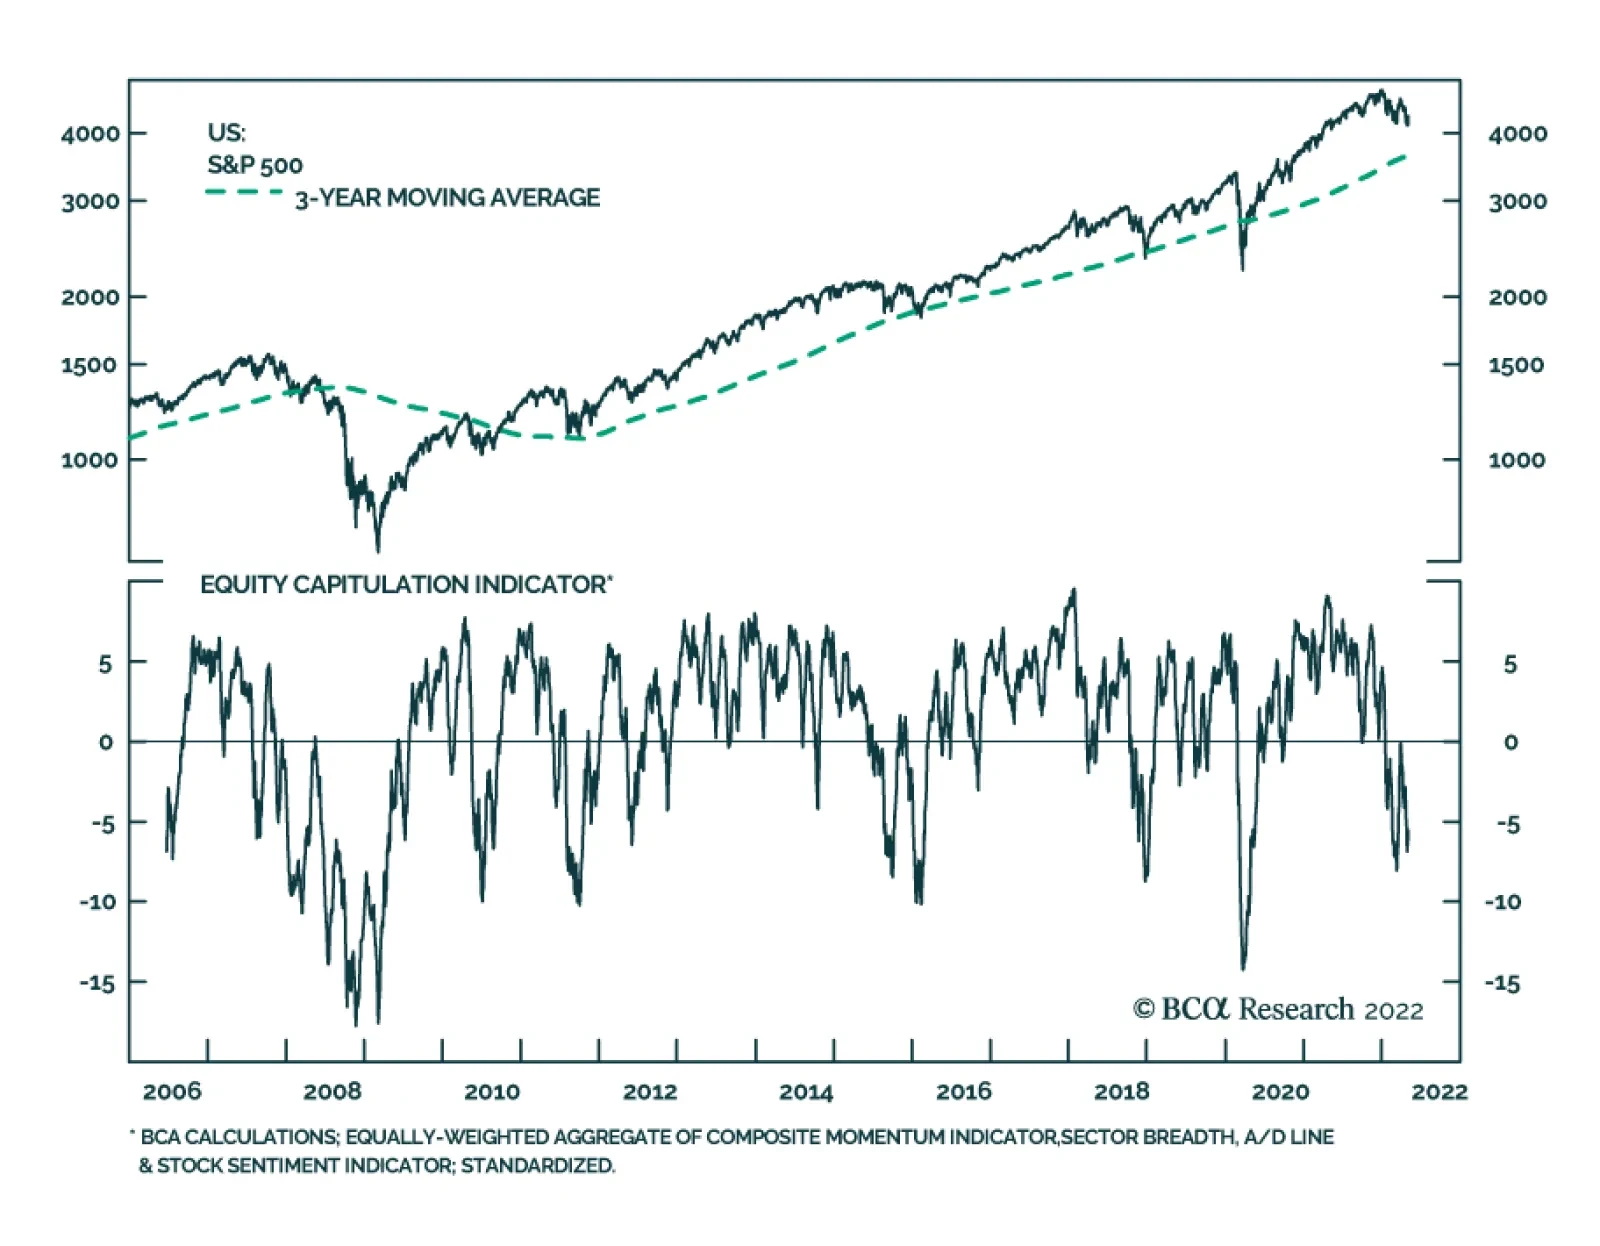
Last Wednesday’s post-FOMC rally proved short-lived. US equities lost all of the prior day’s gains on Thursday, with the selloff continuing on Friday. This sharp reversal tracks moves in the Treasury market. The 10-year bond yield declined by 4bps on…
Executive SummaryIn this report, we look at recent macroeconomic developments through the lens of the business cycle, inflation, and Treasury yield regimes to select winning sectors and styles.The US economy is currently in the slowdown stage of the business cycle, with all of its hallmark attributes, such as slowing growth, elevated inflation, and rising rates.We find that, despite being a real asset, equity performance deteriorates when inflation is on the rise. However, once inflation goes past its apex, the equity rebound is swift.During periods when both inflation and rates are rising, the Energy and Materials sectors tend to outperform, while the Financials and Consumer Discretionary sectors lag.The market is currently in a “high inflation and rising rates” regime but is about to transition to the “inflation is high but falling” regime, and today’s winners may turn into tomorrow’s losers. The new winners are likely to be the Financials, Consumer Discretionary, and Technology sectors.Bottom Line: As inflationary regimes shift, investors can tilt the odds of positive returns in their favor by taking a granular approach to sector selection.
We Are In High Inflation / Rising Rates Regime
We Are In High Inflation / Rising Rates Regime
So far, 2022 has not been a welcoming year for investors. All at once, slowing growth, surging inflation, impending monetary tightening, soaring energy prices, lockdowns in China, and a war in the heart of Europe have been thrown at them.With so much happening, it is difficult to separate signal from noise in the cross-currents of economic data. To make sense of the markets, we will look at recent developments through the lens of macroeconomic regimes, focusing on the stages of the business cycle, level and change in inflation, and the direction of Treasury yields.The Business Cycle Is In A Slowdown StageThe business cycle is a cornerstone of any investment decision as it underpins the fundamentals, and preordains the types of assets likely to outperform based on their level of risk and sensitivity to economic growth. The stage of the business cycle is a succinct way to summarize a wide range of economic data, such as capacity utilization, growth, policy, credit conditions, and valuation (Table 1). Table 1Business Cycle Is In A Slowdown Stage
Macroeconomic Regimes And Their Implications For US Equities
Macroeconomic Regimes And Their Implications For US Equities
While we are barraged with somewhat contradictory economic data, it is still fair to say that we are currently in the middle of the slowdown stage of the business cycle. Our proprietary business cycle indicator, constructed from a mix of soft and hard data across multiple economic dimensions, is trending down, consistent with that position (Chart 1). Furthermore:Growth is slowing, albeit off high levels, and the most recent disappointing ISM PMI is just another case in point. More concerning is that the new orders-to-inventories ratio has plunged (Chart 2);Unemployment is at a 2-year low of 3.6%, and there are currently two job openings per job seeker;Capacity utilization is high;Inflation is elevated;The Fed has commenced a monetary tightening cycle. Chart 1Economic Growth Is Slowing
Business Cycle Is In A Slowdown Stage
Business Cycle Is In A Slowdown Stage
Chart 2ISM PMI Disappointed
ISM PMI Disappointed
ISM PMI Disappointed
As such, during slowdown stage of a business cycle, returns tend to be lower than during recovery and expansion, while volatility is elevated (Chart 3).Chart 3During A Slowdown, Equity Returns Are Paltry, While Volatility Is Elevated
Macroeconomic Regimes And Their Implications For US Equities
Macroeconomic Regimes And Their Implications For US Equities
If equities are set to deliver pedestrian returns, we need to be more discerning in our sector and style selection. In an environment of slowing growth, growth stocks, large caps, and defensives tend to outperform (Chart 4). However, we have all observed that Growth has not fared that well due to rapidly rising interest rates and soaring inflation. In order to better understand the implication of the macroeconomic backdrop for equities, we need to drill further down into the inflation and interest-rate regimes.Chart 4During A Slowdown, Quality, Growth, And Defensives Outperform
Macroeconomic Regimes And Their Implications For US Equities
Macroeconomic Regimes And Their Implications For US Equities
Inflation And Rates RegimesHigh Inflation: Then And NowThe recent spike in inflation came as a shock to most money managers – the last time inflation hit this level was in the 1980s, which predated their investment careers.In the wake of major oil shocks, oil prices quadrupled in 1973-74 and doubled in 1979-80. The combination of high inflation with weak economic growth, fueled by repeated supply shocks, gave rise to the phenomenon of “stagflation”, i.e., soaring inflation accompanied by stagnating economic growth and high unemployment.The high inflation we are living through now was brought about by the pandemic, which ushered in unprecedented fiscal and monetary easing, soaring demand for consumer goods, and a disrupted global supply chain. More recently, inflation has been further exacerbated by the indirect effects of the war in Ukraine, such as skyrocketing energy, food, and materials prices. Despite the challenges of the current period, economic growth is still robust, and unemployment is at historically low levels. Energy and materials prices have soared, but not to the same extent as in the 1970s. And while economic growth is slowing, and stagflation is a risk, it is hardly inevitable.To ensure a more precise study of the sector and style analysis, we will separate the 1970-1984 period and look at it as a template for the performance of equities during a stagflation regime. We will use the 1984 to 2022 period to analyze sector performance during more ordinary inflation regimes.Equities Hate ItEquities are a real asset and, theoretically, should not be affected by inflation – sales and earnings growth are reported in nominal terms, and underlying economic growth is, by far, more important than inflation.Of course, reality is often different from theory, and businesses hate inflation: Not only do they have difficulty budgeting and planning ahead, but they are also often not able to convert sales growth into earnings growth, i.e., their costs may grow faster than their revenues. According to the most recent NFIB survey, 31% of small businesses consider inflation their biggest problem compared to 1-2% in 2019.In addition, high inflation is a harbinger of a hawkish Fed and rising interest rates. Hence, on balance, high inflation is bad news for equities (Chart 5). As inflation climbs, equity returns decline, as multiples contract in anticipation of lower earnings and higher discount rates (Chart 6). Chart 5Equities Underperform In A High-Inflation Environment
Macroeconomic Regimes And Their Implications For US Equities
Macroeconomic Regimes And Their Implications For US Equities
Chart 6High Inflation Leads To Multiple Contraction
Macroeconomic Regimes And Their Implications For US Equities
Macroeconomic Regimes And Their Implications For US Equities
Investing In Periods Of High-Inflation And Rising RatesHigh inflation is often accompanied by rising rates both because of strong economic growth and imminent monetary tightening which aims to arrest growth to combat inflation. As a result, high inflation comes hand in hand with elevated risk aversion and the repricing of more economically sensitive areas of the market.Indeed, when inflation is high (>3.5%) and rates are rising, median three-month equity returns are outright negative, and positive three-months returns occur less than 50% of the time (Chart 7). To beat the market, we need to tilt the return distribution in our favor.Chart 7We Are In High Inflation / Rising Rates Regime
We Are In High Inflation / Rising Rates Regime
We Are In High Inflation / Rising Rates Regime
When inflation is elevated (above 3.5%) and Treasury yields are climbing, the most appropriate portfolio stance is a tilt toward all-weather defensive sectors like Consumer Staples and Health Care, which hold their own in an environment of slowing growth, as well as sectors that command significant pricing power (Chart 8). The following is a brief summary of the winners and losers. Chart 8Sector Performance In High Inflation / Rising Rates Regime
Macroeconomic Regimes And Their Implications For US Equities
Macroeconomic Regimes And Their Implications For US Equities
High Inflation/Rising Rate WinnersEnergy: High oil prices are often one of the culprits behind runaway inflation, with the exception of the mid-1980s episode when Saudi Arabia drowned the world in oil, causing a collapse in oil prices, while inflation was on the rise. The energy sector has significant pricing power as it is upstream of the supply chain and can pass on costs to customers (Chart 9). This sector also benefits from high operating leverage. Outperformance usually peaks when inflation turns.Health Care: Health Care stocks tend to outperform when overall consumer prices advance. The non-cyclical nature of health care services reflects their resilience against economic volatility, irrespective of the direction of pricing pressures (Chart 10). Over the past few years, health care companies have struggled, mostly because of the pressure exerted on pharma by hospitals, insurers, and the government. However, recently, the sector’s pricing power has turned because of pent-up demand for medical procedures. Chart 9The Energy Sector Wields Significant Pricing Power
The Energy Sector Wields Significant Pricing Power
The Energy Sector Wields Significant Pricing Power
Chart 10Pricing Power Of The Health Care Sector Has Picked Up Thanks To Pent-up Demand
Pricing Power Of The Health Care Sector Has Picked Up Thanks To Pent-up Demand
Pricing Power Of The Health Care Sector Has Picked Up Thanks To Pent-up Demand
Consumer Staples: Historically, Consumer Staples have outperformed during periods of high inflation (Chart 11). Just like Health Care, this is a non-cyclical sector, because the demand for necessities is inelastic. While this sector is experiencing challenges because of the rising prices of raw materials, it is able to pass on its costs to customers, who have to allocate an increasing share of their budget to necessities. It has also helped multinationals in the S&P 500 index, as they invest in brand building, which now aids them to differentiate their offerings even when consumers are under duress.Utilities: Utilities is another quintessential defensive sector, with a stable revenue stream, significant pricing power, and profitability controlled by the regulators. Of course, one might argue that this is a highly leveraged sector which may be hurt by rising borrowing costs. However, it fares well, as regulators have a target return-on-investment for utilities companies, thus allowing them to raise prices to offset rising costs. Furthermore, with high inflation, long-term debt is smaller in real terms. Chart 11Consumer Staples Companies Have Invested In Brand-building
Consumer Staples Companies Have Invested In Brand-building
Consumer Staples Companies Have Invested In Brand-building
High Inflation/Rising Rates LosersConsumer Discretionary companies underperform in an environment of high and rising inflation as inflation reduces consumers’ purchasing power and forces them to shift spending away from discretionary goods and services, and toward necessities. The high negative correlation of the sector with the Consumer Drag Indicator is a case in point (Chart 12). Further, rising interest rates often follow high inflation, and weigh on demand for durable goods that require financing.Financials: High inflation is a headwind for the sector because monetary tightening which follows on the heels of high inflation tends to flatten the yield curve, affecting banks’ Net Income Margins (NIM), or the spread between loans and deposits. Inflation also hurts S&P Financials due to the mismatch between bank assets and liabilities. A typical bank has longer maturity for its assets (loans) than for its liabilities (deposits). Consequently, as inflation rises, this reduces the future net inflow because creditors demand higher interest rates, while the returns earned by the bank on its current loan book are mostly fixed by existing contracts. Chart 12Raging Inflation Cuts Into Consumers' Discretionary Spending
Raging Inflation Cuts Into Consumers' Discretionary Spending
Raging Inflation Cuts Into Consumers' Discretionary Spending
Inflation Will Turn Soon (Hopefully), And So Will Sector PerformanceInflation is likely to fade somewhat over the coming quarters, as supply chains normalize, and consumer demand wanes because of saturation and elevated prices. Arithmetic will also help, i.e., the base effect will kick in. Also, aggressive monetary policy is likely to slow economic growth and demand for labor further. With all of that, inflation will trend down but will reach the elusive 2% only years from now.However, when it comes to inflation, it is both the level of inflation and the direction of change that matter. While, overall, high inflation is bad for equities, it is necessary to differentiate between “inflation high and rising” and “inflation high and falling” regimes (Chart 13). As such, it is likely that we are about to shift into the “inflation is above 3.5% but falling” regime, where the median three-month return is 3.0% and returns are positive 69% of the time. We do anticipate a rebound in equities once the tighter monetary regime is priced in, and inflation shows signs of abating.Chart 13When Inflation Turns, Equities Will Rebound
Macroeconomic Regimes And Their Implications For US Equities
Macroeconomic Regimes And Their Implications For US Equities
With the Fed assuming an active role, we believe that going forward, equity returns will be more of a function of the monetary tightening cycle than of inflation. However, falling inflation readings may slow the pace of monetary tightening, or even put the Fed on hold.According to our analysis of sector performance in the “inflation is above 3.5% and is falling” regime, Energy and Materials will be the first sectors to reverse recent gains. The Consumer Discretionary sector is likely to rebound as pressure on consumer purses eases. Financials will also be among sectors that outperform in this regime, since fading inflation will help with asset/liability management. Consumer Staples and Health Care are likely to keep their outperformance going as inflation will continue to be an issue.Last, while empirical analysis does not show that the Technology sector outperforms when inflation is falling, we believe this will be the case based on the simple assumption that falling inflation will imply a lower discount rate (Chart 14). In this regime, we also anticipate a rotation from Value to Growth, and from Large to Small (Chart 15). Chart 14New Inflation Regime Will Usher In New Winners
Macroeconomic Regimes And Their Implications For US Equities
Macroeconomic Regimes And Their Implications For US Equities
Chart 15Changes In Inflation Regimes Brought About Market Rotations
Macroeconomic Regimes And Their Implications For US Equities
Macroeconomic Regimes And Their Implications For US Equities
Stagflation: Magnifying Glass On The 1970sStagflation, along with a recession, is now on investors’ minds – concern about the Fed making a policy mistake. After all, the Fed is already behind the curve, and it is hard to put the inflation genie back into the bottle. What would happen then?In this case, just as in the 1970s, we will see continued growth slowdown accompanied by raging inflation (Chart 16). Back then, equities pulled back every time inflation was on the rise (Chart 17), with Energy, Materials, and Health Care outperforming.The market rebounded at the first signs of inflation abating, reversing sector performance, and turning losers into winners, i.e., Consumer Discretionary and Real Estate started outperforming (Chart 18).Chart 16In The 1970s’ Stagflation Crushed Equities
Macroeconomic Regimes And Their Implications For US Equities
Macroeconomic Regimes And Their Implications For US Equities
Chart 17Energy And Materials Were Biggest Winners In the "Inflation High And Rising" Regime...
Macroeconomic Regimes And Their Implications For US Equities
Macroeconomic Regimes And Their Implications For US Equities
Chart 18...But They Gave Back Their Gains In "Inflation High But Falling" Regime
Macroeconomic Regimes And Their Implications For US Equities
Macroeconomic Regimes And Their Implications For US Equities
Bottom LineWe are in a slowdown stage of the business cycle, and Quality, Defensives, and Growth are expected to outperform. However, high inflation has mixed up all the cards and sent Growth into a tailspin. High inflation is unfavorable, not only for Growth but also for equities in general, even though they are a real asset. However, investors can shift the odds of positive returns in their favor by taking a granular approach to sector selection suitable for different inflation regimes.The market is currently in a “high inflation and rising rates” regime, with Energy and Materials outperforming. However, we are about to transition into the “inflation is high but falling” regime, and today’s winners may turn into losers. Defensives is the only group which holds up across all high inflation regimes, thanks to its earnings resilience even in the face of slowing growth. Irene TunkelChief Strategist, US Equity Strategyirene.tunkel@bcaresearch.com
Executive Summary EM Credit Spreads Correlate With The EM Business Cycle
EM Credit Spreads Correlate With The EM Business Cycle
EM Credit Spreads Correlate With The EM Business Cycle
A buying opportunity in EM local bonds and sovereign credit (EM USD bonds) will open up once US Treasury yields roll over and the US dollar begins its descent. US 10-year Treasury yields will likely peak at around 3.3-3.4%. The US dollar will roll over soon after that. Although we are getting closer to a buying opportunity in EM local currency bonds, it is not imminent. EM sovereign and corporate credit spreads fluctuate with their exchange rates and the EM/global business cycle. The near-term outlook for EM currencies and EM/global growth remains unfavorable. Bottom Line: For now, continue shorting a basket of EM currencies versus the US dollar: ZAR, COP, PEN, PLN, HUF, PHP and IDR. Maintain a defensive tilt within an EM local bond portfolio. Our only outright long has been Brazilian 10-year domestic bonds but we recommend that investors hedge currency risk over the near term. Continue underweighting EM credit relative to US credit, quality adjusted. Feature Bond yields are surging around the world. How advanced are the bond selloffs in the US and in EM? Our short answer is that while the global bond selloff is fairly advanced, volatility will remain high in the near term and yields might rise further. A buying opportunity in EM local bonds and sovereign credit (EM USD bonds) will emerge when US bond yields roll over and the US dollar begins its descent. For now, investors should continue shorting EM currencies versus the US dollar and stay defensive in their EM domestic bond and credit portfolios. US Inflation And Bond Yields Since the top in US bond prices in 2020, US 10-year Treasurys have experienced their second largest drawdown of the past 42 years (Chart 1). The bond rout has pushed net bullish sentiment on US Treasurys to extremely low levels (Chart 2, top panel). From a contrarian perspective, depressed sentiment is positive for the outlook for bonds. Chart 1US 10-Year Treasurys Are Experiencing Their Second Worst Drawdown In 45 years
US 10-Year Treasurys Are Experiencing Their Second Worst Drawdown In 45 years
US 10-Year Treasurys Are Experiencing Their Second Worst Drawdown In 45 years
Chart 2Traders Are Very Bearish On Bonds
Traders Are Very Bearish On Bonds
Traders Are Very Bearish On Bonds
However, the term premium on 10-year bonds is still too low (Chart 2, bottom panel). Extremely high inflation uncertainty warrants a higher risk premium on US bonds. Given that the term premium is a gauge of the risk premium embedded in bonds, it will likely rise further due to inflation and policy uncertainty. Moreover, the tight labor market and surging wages imply that the fundamental outlook for US bonds is also unfavorable. Chart 3 displays that the US labor market has not been this tight since the late 1960s when inflation rose sharply, got embedded in consumer and business expectations and stayed structurally elevated util the early 1980s. The bottom panel of Chart 3 shows the US employment cost index and the Atlanta wage tracker. Both are high and accelerating. Chart 3The US Labor Market Is Very Tight And Wage Growth Is Accelerating
The US Labor Market Is Very Tight And Wage Growth Is Accelerating
The US Labor Market Is Very Tight And Wage Growth Is Accelerating
Critically, US unit labor costs (ULC) – which have a significant impact on core inflation’s medium-term trends – are accelerating (Chart 4). Productivity growth will not be able to keep up with the pace of wage increases, which implies that unit labor costs will continue to rise at a rapid rate. As a result, any decline in core and headline CPI will be technical and limited in nature. US headline and core inflation rates will drop from the current extremely high levels as transitory forces – which exacerbated price pressures over the past 12 months – ebb. Trimmed-mean core PCE and median core CPI measures suggest that underlying US core consumer price inflation is probably in the 3.5% to 4% range (Chart 5). These two measures strip out outliers like used auto prices. Chart 4Unit Labor Costs Drive Core CPI
Unit Labor Costs Drive Core CPI
Unit Labor Costs Drive Core CPI
Chart 5US Core Inflation Will Roll Over But Stay Above 3.5-4%
US Core Inflation Will Roll Over But Stay Above 3.5-4%
US Core Inflation Will Roll Over But Stay Above 3.5-4%
Thus, core PCE and CPI will drop in H2 this year but will stay above 3.5-4%. That is well above the Fed’s 2-2.25% target range for core inflation. Hence, the Fed will maintain its hawkish stance and continue to tighten monetary policy for now. That is why we have been arguing that the Fed and US stocks are on a collision course. The Fed will adopt a dovish tilt only after financial conditions tighten dramatically, i.e., when the S&P500 is down more than 20% from its January high. Bottom Line: Even though headline and core inflation measures will decline later this year, genuine price pressures will remain intense. US government bond yields might be approaching a turning point. Odds are that US 10-year yields will roll over when they reach 3.3-3.4% (Chart 6). EM Domestic Bonds The current drawdown in the total return of EM domestic bonds is the largest on record in local currency terms, but not in US dollar terms (Chart 7, top and middle panels). The basis is that in the current cycle, EM currencies have depreciated less than they did during previous bond selloffs in 2014-15 and 2020. Chart 6The Next Technical Resistance For 10-Year Treasurys Yields Is Around 3.4%
The Next Technical Resistance For 10-Year Treasurys Yields Is Around 3.4%
The Next Technical Resistance For 10-Year Treasurys Yields Is Around 3.4%
Chart 7EM Local Currency GBI Bond Index: Total Return And Yields
EM Local Currency GBI Bond Index: Total Return And Yields
EM Local Currency GBI Bond Index: Total Return And Yields
However, historical comparisons do not take into account changes to the composition of the JP Morgan GBI-EM index. Specifically, China was included in 2020 and it now makes up 10% of the index. Chinese onshore government bond yields have been falling and are now very low (comparable with the yields on US Treasurys). Plus, the Chinese yuan is a low beta currency in the EM universe. In brief, Chinese onshore bonds have been supporting the GBI-EM index’s performance over the past 12 months. However, even after considering this favorable compositional change to the GBI-EM index, the recent drawdowns in both local currency and US dollar terms have been significant (Chart 7, middle panel). From a valuation point of view, EM bonds are beginning to offer value (Chart 7, bottom panel). However, risks to ex-China EM local currency bond yields remain to the upside over the near term. First, as long as EM exchange rates depreciate versus the US dollar, EM ex-China central banks will hike their policy rates because weak currencies will aggravate domestic inflationary pressures. Odds are that the greenback’s rally will continue in the near term. Net bullish sentiment on the US dollar is not yet at a peak level (Chart 8). Plus, investors’ net long positions in high-beta EM currencies was elevated as of April 29 (Chart 9). Chart 8Bullish Sentiment On US Dollar Is Not Extreme
Bullish Sentiment On US Dollar Is Not Extreme
Bullish Sentiment On US Dollar Is Not Extreme
Chart 9EM Currencies Have Near-Term Downside
EM Currencies Have Near-Term Downside
EM Currencies Have Near-Term Downside
Critically, the Chinese yuan’s depreciation versus the US dollar will continue to exert downward pressure on commodity prices and other EM currencies. Besides, EM ex-China currencies have failed to break above the falling trendline (Chart 10). This is a sign that the rebound has been exhausted and a new downleg is in the offing. Second, the pass-through effect of high food and energy prices into core inflation is higher among EM economies than DM ones. Given that food prices are surging and oil prices are elevated, mainstream EM central banks will continue hiking interest rates. Finally, EM local bond yields will not drop until US TIPS yields roll over (Chart 11). TIPS yields are still low, and their path of least resistance would be up. Chart 10Stay Short EM Currencies for Now
Stay Short EM Currencies for Now
Stay Short EM Currencies for Now
Chart 11EM Local Yields Correlate With US TIPS Yields
EM Local Yields Correlate With US TIPS Yields
EM Local Yields Correlate With US TIPS Yields
Bottom Line: A buying opportunity in EM domestic bonds will likely occur when US Treasury yields and the US dollar roll over. These are not imminent. EM local currency bond investors should stay defensive for now. EM Credit Spreads EM sovereign and corporate credit spreads fluctuate with their exchange rates and the EM/global business cycle, as was discussed in A Primer on EM USD Bonds and illustrated in Chart 12 and 13. Chart 12EM Credit Spreads Correlate With EM Currencies
EM Credit Spreads Correlate With EM Currencies
EM Credit Spreads Correlate With EM Currencies
Chart 13EM Credit Spreads Correlate With The EM Business Cycle
EM Credit Spreads Correlate With The EM Business Cycle
EM Credit Spreads Correlate With The EM Business Cycle
As we discussed above, the outlook for EM currencies remains unfavorable. Risks to EM/global business cycle are also to the downside. China’s growth remains weak. The favorable impact of fiscal and monetary stimulus is being offset by the harsh lockdowns. Copper prices seem to be breaking down in line with China’s economic weakness (Chart 14). This is negative for many EM economies that export raw materials. Domestic demand in many emerging economies is subdued (Chart 15). Monetary tightening and negative fiscal thrust will cause domestic demand in the majority of EM economies to slow further. Chart 14Copper Prices Have Broken Down
Copper Prices Have Broken Down
Copper Prices Have Broken Down
Chart 15EM Domestic Demand Has Been Very Weak
EM Domestic Demand Has Been Very Weak
EM Domestic Demand Has Been Very Weak
Finally, global trade volumes will shrink as DM consumption of goods ex-autos declines. Bottom Line: A combination of weakening growth and depreciating currencies will cause EM sovereign and credit spreads to widen further. Investment Recommendations Chart 16EM Credit Spreads Will Widen Further
EM Credit Spreads Will Widen Further
EM Credit Spreads Will Widen Further
US Treasury yields will likely peak at around 3.3-3.4%. The US dollar will roll over soon after. For now, continue shorting a basket of EM currencies versus the US dollar: ZAR, COP, PEN, PLN, HUF, PHP and IDR. Be patient before buying EM local currency bonds. Our current positions are as follows: receiving 10-year swap rates in China and Malaysia, betting on yield curve inversion in Mexico and Colombia (receiving 10-year/paying 1-year and 6-month swap rates, respectively) and paying Polish/receiving Czech 10-year rates. Our only outright long has been Brazilian 10-year bonds but we recommend that investors hedge currency risk in the near term. EM sovereign and credit spreads will widen further (Chart 16). Continue underweighting EM credit relative to US credit, quality adjusted. Our country allocation for EM domestic bond and sovereign credit portfolios is presented in the tables below. Arthur Budaghyan Chief Emerging Markets Strategist arthurb@bcaresearch.com Strategic Themes (18 Months And Beyond) Equities Cyclical Recommendations (6-18 Months) Cyclical Recommendations (6-18 Months)
Chart 1
PMIs Surprise To The Downside
PMIs Surprise To The Downside
Both the US and Global PMIs surprised to the downside this week with the US ISM Manufacturing PMI printing 55.4 vs 57.6 expected. The ISM PMI fell by 1.7 points from 57.1 while its employment sub-component fell by impressive 5 points (from 56 to 50.9). Worse still, the new orders-to-inventories ratio (NOI) remains in the free fall, foreshadowing further weakness in manufacturing activity (see chart). The disappointing NOI ratio is unlikely to be a one-off anomalous print considering a backdrop of the slowing demand for durable goods, falling consumer purchasing power, and surging oil prices. The NOI ratio contraction is also reminiscent of the 2004 episode – one of the few instances when the Fed tightened monetary policy into a slowing economy. Notably, 2004 marked the peak in cyclical/defensive equities for the entire pre-GFC cycle. When it comes to portfolio positioning, weak manufacturing data validates our recent rotation away from cyclical sectors and towards defensives (please see our most recent Strategy Report for a more detailed discussion). Bottom Line: We continue to recommend investors remain cautious and add defensive exposure to reduce portfolio volatility as the global manufacturing cycle slows down.
In lieu of next week’s report, I will be presenting a webcast titled ‘The 5 Big Mispricings In The Markets Right Now, And How To Profit From Them’. I do hope you can join. Executive Summary Just as the railway timetables set in train the First World War, central bank timetables for aggressive rate hikes are setting in train a global recession. Demand is already cool, so aggressive rate hikes will take it to outright cold. The risk is elevated because central banks are desperate to repair their damaged credibility on fighting inflation, and it may be their last chance. Inflationary fears and hawkishness from central banks are weighing on bonds and stocks, and it may take some weeks, or months, for inflation fears to recede. But we could be approaching a turning point. By the summer, core inflation should be receding. Furthermore, the fractal structures of the sell-offs in both the 30-year T-bond and the tech-heavy NASDAQ index are approaching points of extreme fragility that have signalled inflection points. Fractal trading watchlist: 30-year T-bond, NASDAQ, FTSE 100 versus Euro Stoxx 50, Netherlands versus Switzerland, and Petcare (PAWZ). US Inflation Is Hot, But Demand Is Not
US Inflation Is Hot, But Demand Is Not
US Inflation Is Hot, But Demand Is Not
Bottom Line: Tactically cautious, but long-term investors who do not need to time the market bottom should overweight bonds and overweight long-duration defensive equities versus short-duration cyclical equities – for example, overweight US versus non-US equities. Feature The First World War, the historian AJP Taylor famously argued, was “imposed on the statesmen of Europe by railway timetables.” Taylor proposed that the railways and their timetables were so central to troop mobilisation – and specifically, the German Schlieffen Plan – that a plan once set in motion could not be stopped. “Once started the wagons and carriages must roll remorselessly and inevitably to their predestined goal.” Otherwise, the whole process would unravel, and an opportunity to demonstrate military credibility would be lost that might never come again. Today, could a global recession be imposed upon us by central bank timetables for aggressive rate hikes? Just as it was difficult to unwind the troop mobilisation that led to the Great War, it will be difficult to back down from the aggressive rate hikes that the central banks have timetabled, at least in the near term. Otherwise, an opportunity to demonstrate inflation fighting credibility would be lost that might never come again. Just as the railway timetables set in train the First World War, central bank timetables for aggressive rate hikes may set in train another global recession. Unfortunately, central banks do not have precision weapons. Quite the contrary, monetary tightening is a blunt instrument which works by cooling overall demand. But demand is already cool, as evidenced by the contraction of the US economy in the first quarter. In their zeal to repair their damaged credibility on fighting inflation, the danger is that central banks take the economy from cool to outright cold. Granted, the US economy was dragged down by a drop in inventories and net exports. But even US domestic demand – which strips out inventories and net exports – is barely on its pre-pandemic trend (Chart I-1). Meanwhile, the euro area economy is still 5 percent below its pre-pandemic trend (Chart I-2). To reiterate, by hiking rates aggressively into economies that are at best lukewarm, central banks are risking an outright recession. Chart I-1US Inflation Is Hot, But Demand Is Not
US Inflation Is Hot, But Demand Is Not
US Inflation Is Hot, But Demand Is Not
Chart I-2Euro Area Inflation Is Hot, But Demand Is Not
Euro Area Inflation Is Hot, But Demand Is Not
Euro Area Inflation Is Hot, But Demand Is Not
Our Three-Point Checklist For A Recession Has Three Ticks My colleague Peter Berezin has created a three-point checklist for a recession: The build-up of an imbalance makes the economy vulnerable to downturn. A catalyst exposes this imbalance. Amplifiers exacerbate the downturn. Is there a major imbalance? You bet there is. The post-pandemic 26 percent overspend on durable goods in the US constitutes one of the greatest imbalances in economic history. Other advanced economies also experienced unprecedented binges on durable goods. The catalyst that is exposing this major imbalance is the realisation that durable goods are, well, durable. So, if you overspent on durables in 2020/21, then the risk is that you symmetrically underspend in 2022/23 (Chart I-3). The post-pandemic 26 percent overspend on durable goods in the US constitutes one of the greatest imbalances in economic history. Meanwhile, a future underspend on goods cannot be countered by an overspend on services because the consumption of services is constrained by time, opportunity, and biology. There is a limit to how often you can eat out, go to the movies, or go to the doctor (Chart I-4). Indeed, for certain services, an underspend will persist, because we have made some permanent post-pandemic changes to our lifestyles: for example, hybrid office/home working and more online shopping and online medical care. Chart I-3An Overspend On Goods Can Be Corrected By A Subsequent Underspend...
An Overspend On Goods Can Be Corrected By A Subsequent Underspend...
An Overspend On Goods Can Be Corrected By A Subsequent Underspend...
Chart I-4...But An Underspend On Services Cannot Be Corrected By A Subsequent Overspend
...But An Underspend On Services Cannot Be Corrected By A Subsequent Overspend
...But An Underspend On Services Cannot Be Corrected By A Subsequent Overspend
Finally, the amplifier that will exacerbate the downturn is monetary tightening. If central banks follow their railway timetables for aggressive rate hikes, a goods downturn will magnify into an outright recession. So, in Peter’s three-point checklist, we now have tick, tick, and tick. Inflation Is Hot, But Demand Is Not If economic demand is at best lukewarm, then what caused the post-pandemic inflation that central banks are now fighting? The simple answer is massive fiscal stimulus combined with the equally massive shift in spending to durable goods. Locked at home and flush with government supplied cash, we couldn’t spend it on services, so we spent it on goods. This created a massive shock in the distribution of demand, out of services whose supply could easily adjust downwards, and into goods whose supply could not easily adjust upwards. For example, airlines could cut back their flights, but auto manufacturers couldn’t make more cars. So, airfares didn’t collapse but used car prices went vertical! The causality from stimulus payments to durable goods spending to core inflation is irrefutable. The causality from stimulus payments to durable goods spending to core inflation is irrefutable. The biggest surges in US durable goods spending all coincided with the government’s stimulus checks (Chart I-5). And the three separate surges in month-on-month core inflation all occurred after surges in durable goods demand (Chart I-6). As further proof, core inflation is highest in those economies where the stimulus checks and furlough schemes were the most generous – like the US and the UK. Chart I-5Stimulus Checks Caused The Surges in Durable Goods Spending
Stimulus Checks Caused The Surges in Durable Goods Spending
Stimulus Checks Caused The Surges in Durable Goods Spending
Chart I-6The Surges In Durable Goods Spending Caused The Surges In Core Inflation
The Surges In Durable Goods Spending Caused The Surges In Core Inflation
The Surges In Durable Goods Spending Caused The Surges In Core Inflation
What Does All This Mean For Investment Strategy? Our high conviction view is that the pandemic’s inflationary impulse combined with the Ukraine war will turn out to be demand-destructive, and thereby ultimately morph into a deflationary impulse. Yet central banks are all pumped up to demonstrate their inflation fighting credibility. Given that this credibility is badly damaged, it may be their last opportunity to repair it before it is shattered forever. To repeat, just as the railway timetables set in train the First World War, central bank timetables for aggressive rate hikes may set in train another global recession. That said, a recession is not inevitable. The interest rate that matters most for the economy and the markets is not the policy rate that central banks want to hike aggressively, it is the long-duration bond yield. A lower bond yield can underpin both the economy and the financial markets, just as it did during the pandemic in 2020. But to the extent that the bond market is following the real economic data, we are in a dangerous phase. Because, as is typical at an inflection point, the real data will be noisy and ambiguous. Meaning it may take some weeks, or months, for inflation fears to be trumped by growth fears. On March 10th, in Are We In A Slow-Motion Crash? we predicted: “On a tactical (3-month) horizon, the inflationary impulse from soaring energy and food prices combined with the choke on growth from sanctions will weigh on both the global economy and the global stock market. As such, bond yields could nudge higher, the global stock market has yet to reach its crisis bottom, and the US dollar will rally” That prediction proved to be spot on! Recession, or no recession, we are still in a difficult period for markets because inflationary fears and hawkishness from central banks are weighing on bonds and stocks, while buoying the US dollar. As such, tactical caution is still warranted. Fractal structures of the sell-offs in both the 30-year T-bond and the tech-heavy NASDAQ index are approaching points of extreme fragility. But we could be approaching a turning point. By the summer, core inflation should be receding. Furthermore, the fractal structures of the sell-offs in both the 30-year T-bond and the tech-heavy NASDAQ index are approaching points of extreme fragility that have reliably signalled previous inflection points (Chart I-7 and Chart I-8). Chart I-7The Sell-Off In The 30-Year T-Bond Is Approaching Fractal Fragility
The Sell-Off In The 30-Year T-Bond Is Approaching Fractal Fragility
The Sell-Off In The 30-Year T-Bond Is Approaching Fractal Fragility
Chart I-8The Sell-Off In The NASDAQ Is Approaching Fractal Fragility
The Sell-Off In The NASDAQ Is Approaching Fractal Fragility
The Sell-Off In The NASDAQ Is Approaching Fractal Fragility
The advice for long-term investors who do not need to time the market bottom is: Bonds will ultimately rally. Overweight the 30-year T-bond and the 30-year Chinese bond. Equities will be conflicted between slowing growth which will weigh on cyclical profits, and falling bond yields which will buoy long-duration valuations. Therefore, overweight long-duration defensive sectors and markets versus short-duration cyclical sectors and markets. For example, overweight US versus non-US equities. Fractal Trading Watchlist As just discussed, the sell-offs in the 30-year T-bond and the NASDAQ are approaching points of fractal fragility that have signalled previous turning points. Hence, we are adding both investments to our watchlist. Also added to our watchlist is the outperformance of the FTSE100 versus Euro Stoxx 50, and the underperformance of Netherlands versus Switzerland, both of which are approaching potential reversals. Our final addition is Petcare (PAWZ). After a stellar 2020, Petcare gave back most of its gains in 2021. But this underperformance is now approaching a point of fragility which might provide a new entry point. There are no new trades this week, but the full watchlist of investments at, or approaching, turning points is available on our website: cpt.bcaresearch.com Fractal Trading Watchlist: New Additions A Potential New Entry Point Into Petcare
A Potential New Entry Point Into Petcare
A Potential New Entry Point Into Petcare
FTSE100 Outperformance Vs. Euro Stoxx 50 Vulnerable To Reversal
FTSE100 Outperformance Vs. Euro Stoxx 50 Vulnerable To Reversal
FTSE100 Outperformance Vs. Euro Stoxx 50 Vulnerable To Reversal
Netherlands Underperformance Vs. Switzerland Close To Exhaustion
Netherlands Underperformance Vs. Switzerland Close To Exhaustion
Netherlands Underperformance Vs. Switzerland Close To Exhaustion
Chart 1The Strong Trend In The 18-Month-Out US Interest Rate Future Is Fragile
The Strong Trend In The 18-Month-Out US Interest Rate Future Is Fragile
The Strong Trend In The 18-Month-Out US Interest Rate Future Is Fragile
Chart 2The Strong Trend In The 3 Year T-Bond Is Fragile
The Strong Trend In The 3 Year T-Bond Is Fragile
The Strong Trend In The 3 Year T-Bond Is Fragile
Chart 3AUD/KRW Is Vulnerable To Reversal
AUD/KRW Is Vulnerable To Reversal
AUD/KRW Is Vulnerable To Reversal
Chart 4Canada Versus Japan Is Reversing
Canada Versus Japan Is Reversing
Canada Versus Japan Is Reversing
Chart 5Canada's TSX-60's Outperformance Might Be Over
Canada's TSX-60's Outperformance Might Be Over
Canada's TSX-60's Outperformance Might Be Over
Chart 6US Healthcare Providers Vs. Software At Risk of Reversal
US Healthcare Providers Vs. Software At Risk of Reversal
US Healthcare Providers Vs. Software At Risk of Reversal
Chart 7A Potential Switching Point From Tobacco Into Cannabis
A Potential Switching Point From Tobacco Into Cannabis
A Potential Switching Point From Tobacco Into Cannabis
Chart 8Biotech Is A Major Buy
Biotech Is A Major Buy
Biotech Is A Major Buy
Chart 9CAD/SEK Reversal Has Started
CAD/SEK Reversal Has Started
CAD/SEK Reversal Has Started
Chart 10Financials Versus Industrials To Reverse
Financials Versus Industrials To Reverse
Financials Versus Industrials To Reverse
Chart 11Norway's Outperformance Could End
Norway's Outperformance Could End
Norway's Outperformance Could End
Chart 12Greece's Brief Outperformance To End
Greece's Brief Outperformance To End
Greece's Brief Outperformance To End
Chart 13BRL/NZD At A Resistance Point
BRL/NZD At A Resistance Point
BRL/NZD At A Resistance Point
Chart 14The Outperformance Of Resources Versus Healthcare Is Vulnerable To Reversal
The Outperformance Of Resources Versus Healthcare Is Vulnerable To Reversal
The Outperformance Of Resources Versus Healthcare Is Vulnerable To Reversal
Chart 15The Outperformance Of Resources Versus Biotech Has Started To Reverse
The Outperformance Of Resources Versus Biotech Has Started To Reverse
The Outperformance Of Resources Versus Biotech Has Started To Reverse
Chart 16Cotton's Outperformance Is Vulnerable To Reversal
Cotton's Outperformance Is Vulnerable To Reversal
Cotton's Outperformance Is Vulnerable To Reversal
Chart 17US Homebuilders' Underperformance Has Reached A Potential Turning Point
US Homebuilders' Underperformance Has Reached A Potential Turning Point
US Homebuilders' Underperformance Has Reached A Potential Turning Point
Chart 18Switzerland's Outperformance Vs. Germany Has Started To End
Switzerland's Outperformance Vs. Germany Has Started To End
Switzerland's Outperformance Vs. Germany Has Started To End
Chart 19The Rally In USD/EUR Could End
The Rally In USD/EUR Could End
The Rally In USD/EUR Could End
Chart 20The Outperformance Of MSCI Hong Kong Versus China Is Vulnerable To Reversal
The Outperformance Of MSCI Hong Kong Versus China Is Vulnerable To Reversal
The Outperformance Of MSCI Hong Kong Versus China Is Vulnerable To Reversal
Chart 21A Potential New Entry Point Into Petcare
A Potential New Entry Point Into Petcare
A Potential New Entry Point Into Petcare
Chart 22FTSE100 Outperformance Vs. Euro Stoxx 50 Vulnerable To Reversal
FTSE100 Outperformance Vs. Euro Stoxx 50 Vulnerable To Reversal
FTSE100 Outperformance Vs. Euro Stoxx 50 Vulnerable To Reversal
Chart 23Netherlands Underperformance Vs. Switzerland Close To Exhaustion
Netherlands Underperformance Vs. Switzerland Close To Exhaustion
Netherlands Underperformance Vs. Switzerland Close To Exhaustion
Dhaval Joshi Chief Strategist dhaval@bcaresearch.com Fractal Trading System Fractal Trades
Central Bank ‘Railway Timetables’ Are Dragging Us Into Recession
Central Bank ‘Railway Timetables’ Are Dragging Us Into Recession
Central Bank ‘Railway Timetables’ Are Dragging Us Into Recession
Central Bank ‘Railway Timetables’ Are Dragging Us Into Recession
6-Month Recommendations Structural Recommendations Closed Fractal Trades Indicators To Watch - Bond Yields Chart II-1Indicators To Watch - Bond Yields - Euro Area
Indicators To Watch - Bond Yields - Euro Area
Indicators To Watch - Bond Yields - Euro Area
Chart II-2Indicators To Watch - Bond Yields - Europe Ex Euro Area
Indicators To Watch - Bond Yields - Europe Ex Euro Area
Indicators To Watch - Bond Yields - Europe Ex Euro Area
Chart II-3Indicators To Watch - Bond Yields - Asia
Indicators To Watch - Bond Yields - Asia
Indicators To Watch - Bond Yields - Asia
Chart II-4Indicators To Watch - Bond Yields - Other Developed
Indicators To Watch - Bond Yields - Other Developed
Indicators To Watch - Bond Yields - Other Developed
Indicators To Watch - Interest Rate Expectations Chart II-5Indicators To Watch - Interest Rate Expectations
Indicators To Watch - Interest Rate Expectations
Indicators To Watch - Interest Rate Expectations
Chart II-6Indicators To Watch - Interest Rate Expectations
Indicators To Watch - Interest Rate Expectations
Indicators To Watch - Interest Rate Expectations
Chart II-7Indicators To Watch - Interest Rate Expectations
Indicators To Watch - Interest Rate Expectations
Indicators To Watch - Interest Rate Expectations
Chart II-8Indicators To Watch - Interest Rate Expectations
Indicators To Watch - Interest Rate Expectations
Indicators To Watch - Interest Rate Expectations
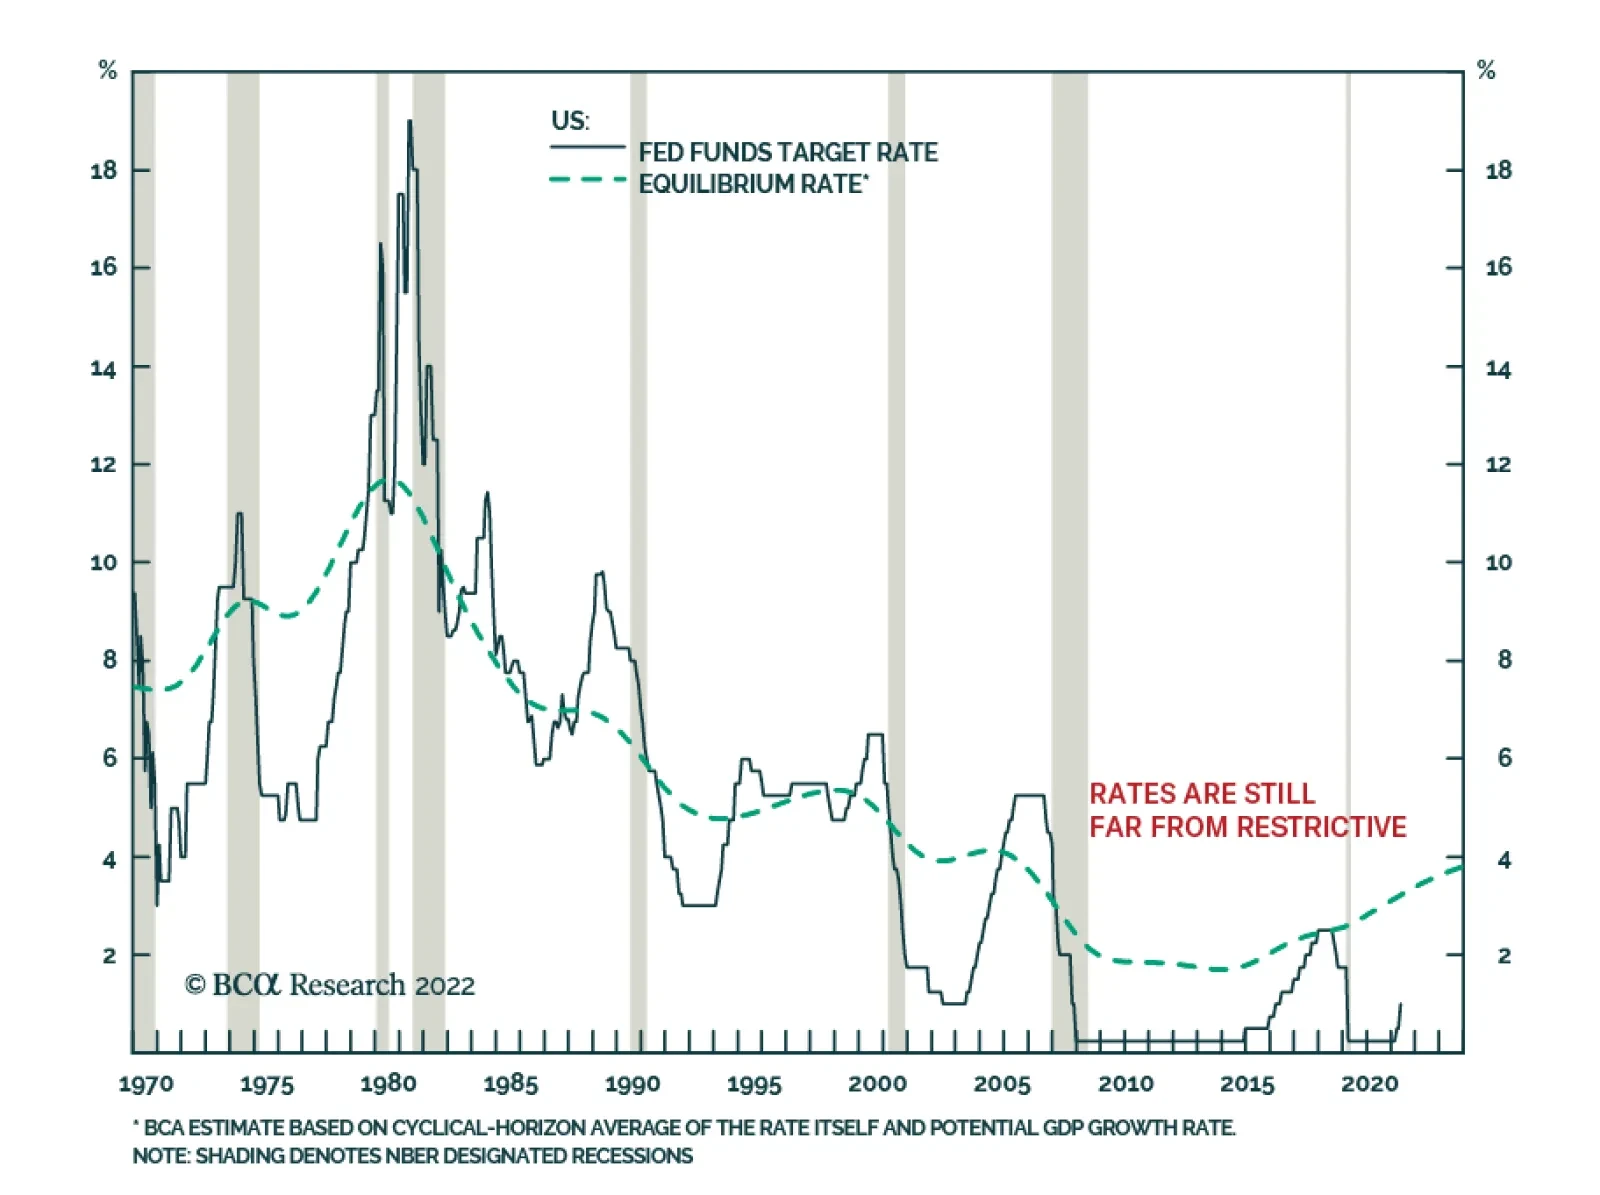
As expected, the Fed hiked interest rates by 50 basis points on Wednesday, lifting the target federal funds rate to a range of 0.75% to 1%. In addition, the central bank released details of its balance sheet reduction plan, which will begin in June. For…
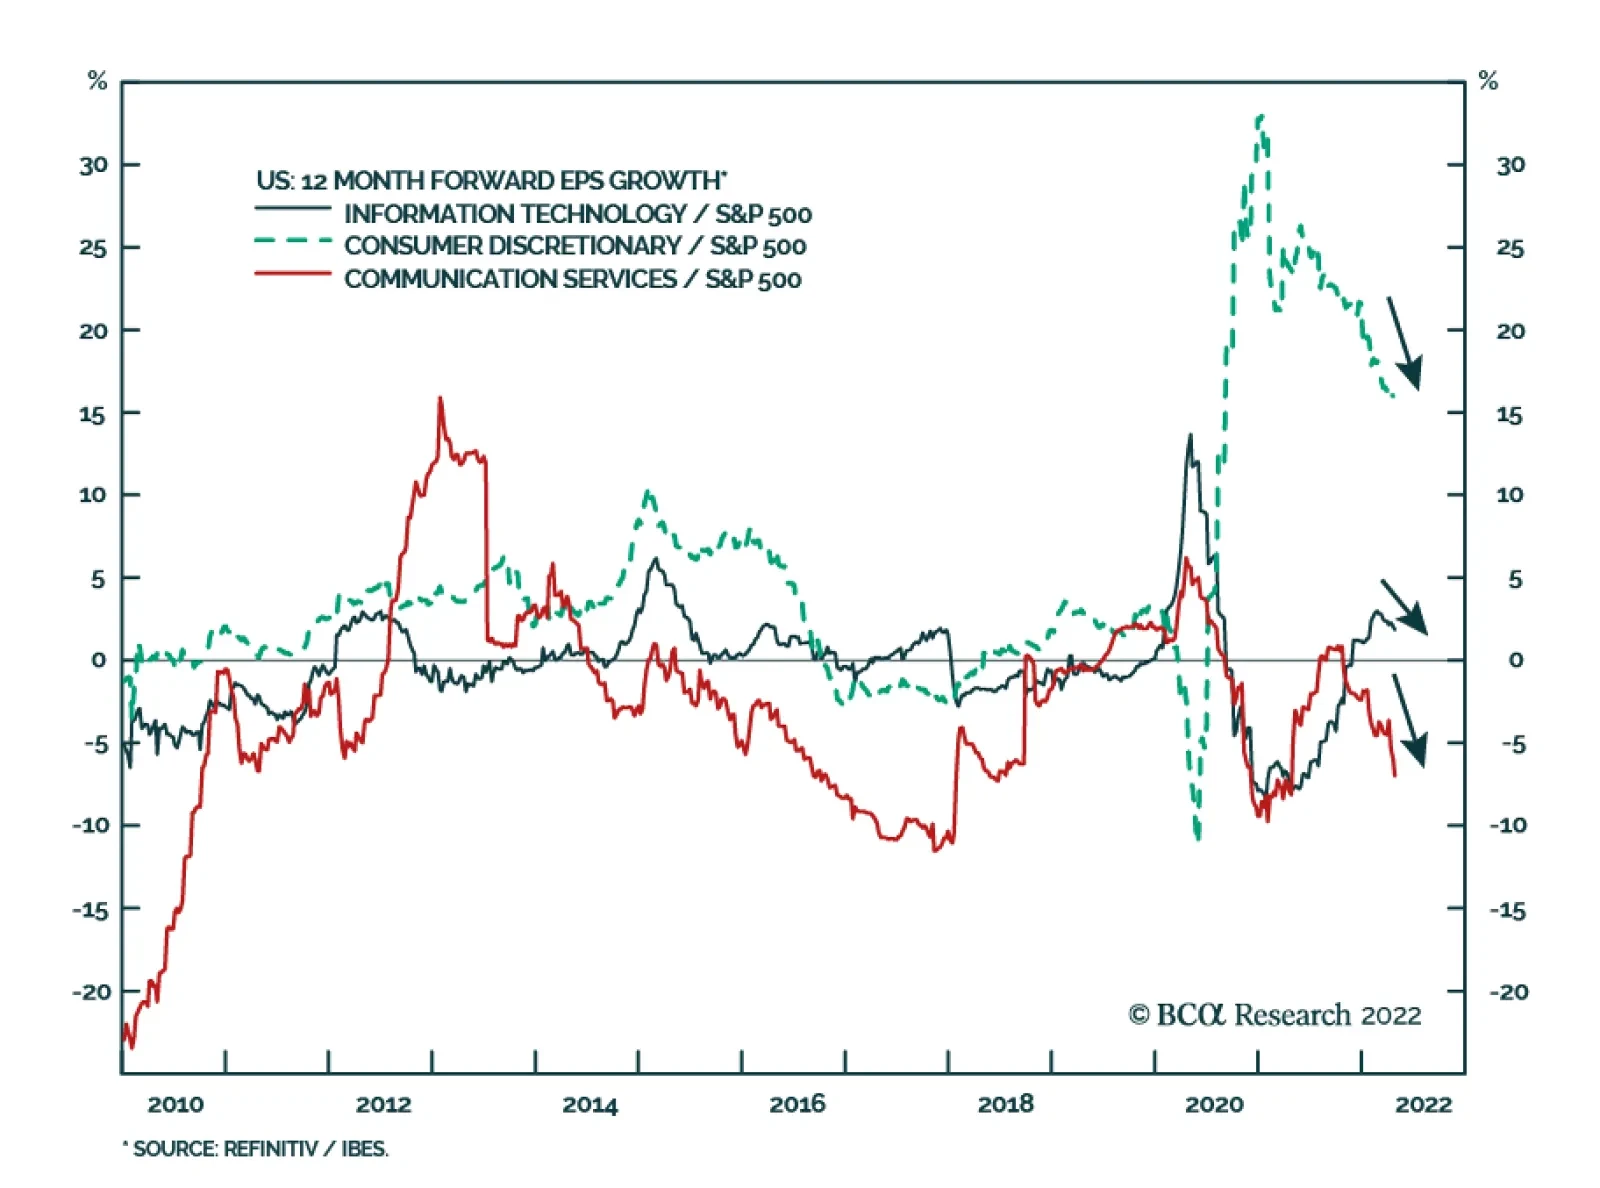
Broadly-defined US technology stocks have been consistently underperforming the S&P 500 since the beginning of the year. Communication Services, Consumer Discretionary, and IT have shed 24%, 20%, and 18% of their value, respectively. Two main headwinds…