United States
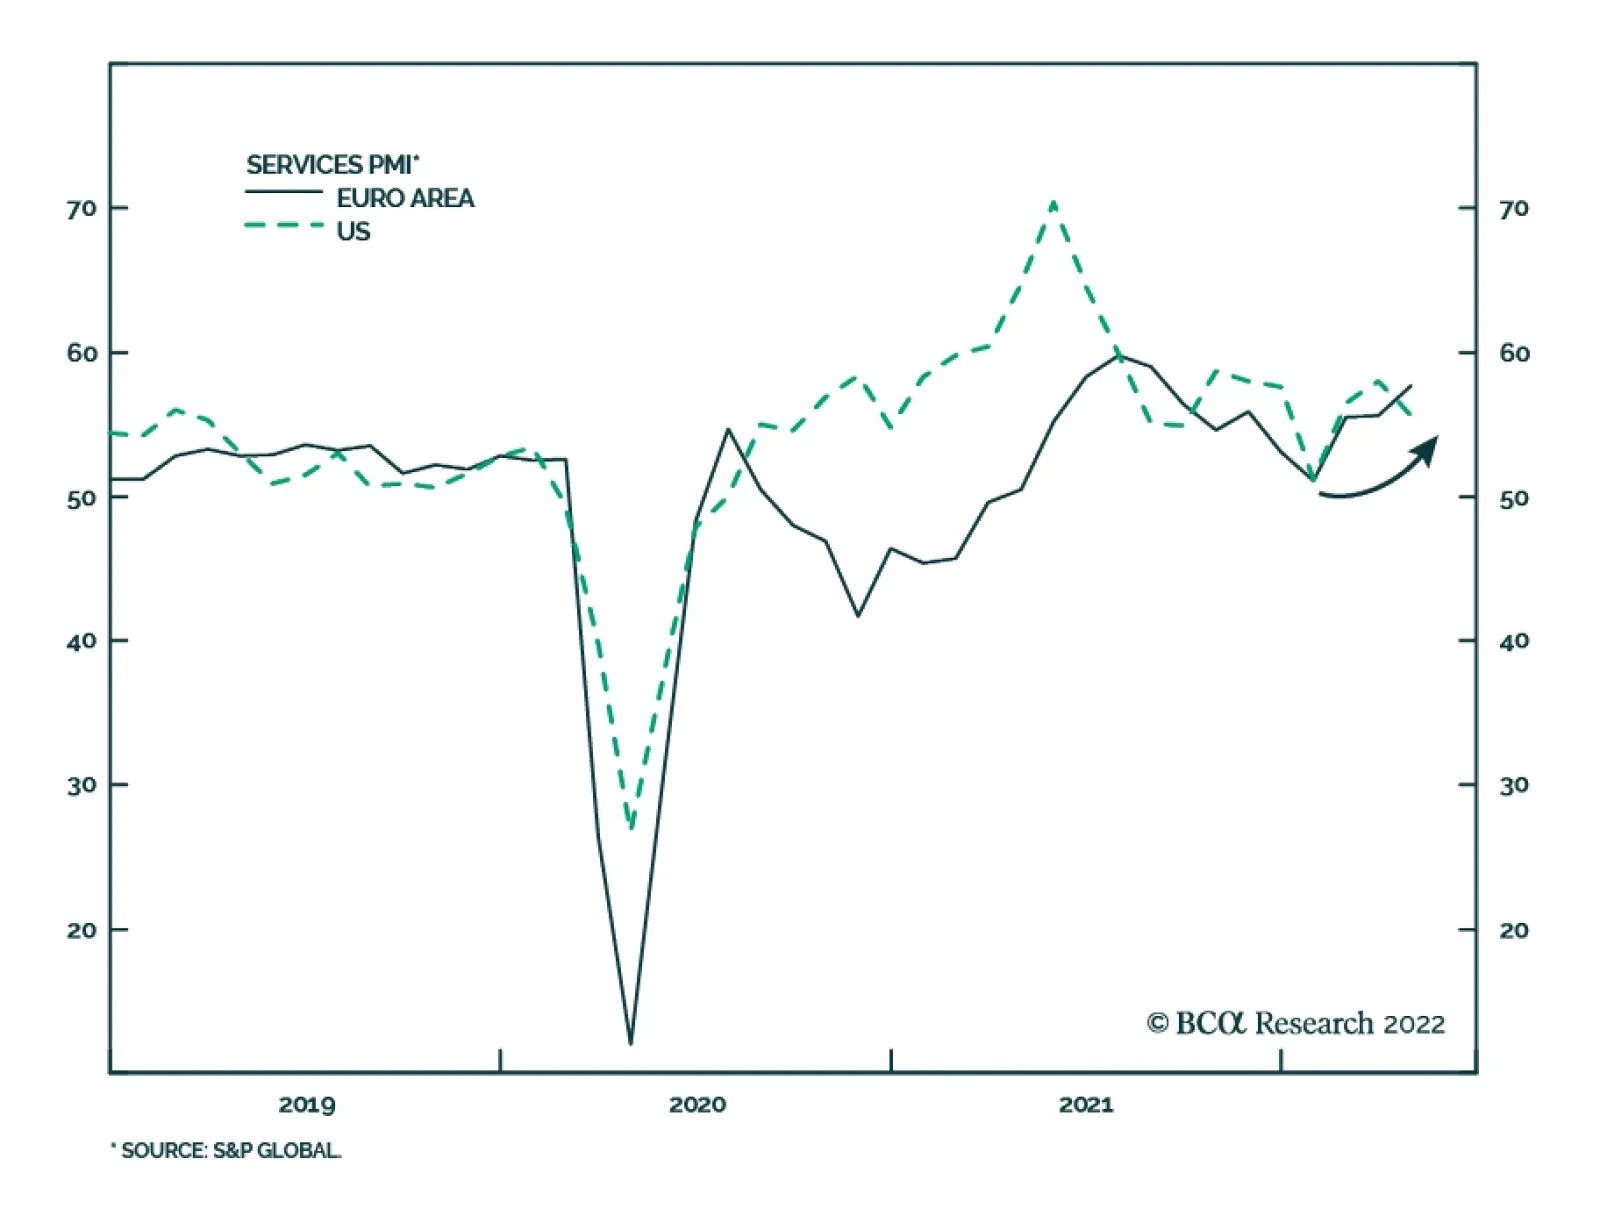
April services PMIs generally testify to the ongoing consumption pivot from goods to services. The S&P Global Eurozone Services PMI rose to 57.7 in April from 55.6 in the prior month, marking the strongest growth in Eurozone services activity since…

Executive Summary Stocks Not Linked To Presidential Approval
Stocks Not Linked To Presidential Approval
Stocks Not Linked To Presidential Approval
President Kennedy’s performance in 1962 would be ideal for the Biden administration in this year’s midterm elections – but today the Russian conflict is less likely to help the Democrats. A threat to the homeland could lift President Biden’s job approval. But most likely inflation and foreign crises will weigh on his approval. A contrarian stock rally would not help Biden’s approval but Biden’s attempts to boost his rating could deliver negative surprises for stocks. US “peak polarization” and Democratic Party policies are negative for the stock market and investor risk appetite over the next zero-to-six months. Our quantitative election models suggest Republicans will win the Senate, though uncertainty will rise as a result of the controversy over the Supreme Court and abortion. Democratic odds of keeping the White House in 2024 are 54.6% but eroding. CLOSE Recommendation (Cyclical) CLOSING Level CLOSING Date RETURN Long Municipal Bonds Vs. Duration Matched Treasuries 93.53 2-MAY-22 -1.50% Bottom Line: Overall Biden policies plus global events are neutral or bullish for US Treasuries while neutral or bearish for US stocks over a tactical time horizon (zero-to-six months). Feature President Biden is doubling down on his support for Ukraine and thus adopting the John F. Kennedy foreign policy playbook of confronting Russia ahead of the US’s midterm elections. Related Report US Political StrategyWar Not Helping Biden So Far Biden’s position today is weaker than Kennedy’s in 1962, so his reaction to Russian aggression will create more market hurdles than it removes. Bad news will come before good news, compounding bearish investor sentiment in the near term. Policy uncertainty should decline after the midterm election on November 8, which is positive for equities in 2023. Democrats Scramble Amid Recession Fear The US economy contracted unexpectedly in the first quarter at an annualized 1.4% rate. The underlying data contained some silver lining – personal consumption grew at 2.7%. But the contraction is bad news for the economy and the ruling Democratic Party. Public approval of Biden’s handling of the economy has fallen to -16.2%. The global economy continues to sputter. Risks to growth are high in Europe and China as well (Chart 1). The US policy response will take shape on the monetary and fiscal level but also on the foreign policy level. First, global risks will not dissuade the Federal Reserve from normalizing interest rates. Chairman Jerome Powell signaled on April 21 that he is willing to hike interest rates 50 basis points at a time to combat core PCE inflation at 5.2%. The market currently expects core inflation to peak at 5.2% while the Fed funds rate will hit 3.3% in 2023 before falling in 2024. The implication is that monetary policy will tighten quickly, even as the economy stutters, which is negative for the US equity market and investor sentiment. However, Fed hawkishness is largely priced. US long-duration treasuries are at or near fair value at 3%, according to our US Bond Strategy. Our US Investment Strategy believes that with the S&P500 already down by 13% so far this year, stocks can begin to grind upward, barring other negative surprises. Chart 1US Slows Amid Global Growth Risks
US Slows Amid Global Growth Risks
US Slows Amid Global Growth Risks
Second, the White House will scramble to try to limit the damage to the Democratic Party in the midterms – with the unintentional result that negative surprises could arise from fiscal policy and especially foreign policy. On the fiscal front, congressional Democrats will redesign their budget reconciliation bill to try to gain a legislative victory. They will need to make it as close to deficit-neutral as possible to avoid fanning inflation. The odds of passage are higher than consensus expectations (26% on PredictIt). But the stock market does not want more government spending or higher taxes in a stagflationary environment. Fiscal policy is still a significant source of uncertainty in 2022, if not in 2023. On the foreign policy front, the greatest trouble looms. Russian aggression has prompted the US and its NATO allies to double down on their support for Ukraine, providing additional arms and aid. Biden’s Secretary of Defense Lloyd Austin said that the US wants to see Ukraine “a democratic country able to protect its sovereign territory … [and] Russia weakened to the point where it can't do things like invade Ukraine.”1 Finland and Sweden are increasingly likely to join NATO, which will antagonize Russia. Russia’s response is not yet known but it has issued aggressive warnings. By cutting off natural gas to Poland and Bulgaria, Moscow is warning that it may cut off natural gas to all Europe. Meanwhile Germany is embracing an oil embargo. A larger energy shock is increasingly likely. Chart 2More Bad News Before Good News
More Bad News Before Good News
More Bad News Before Good News
Bottom Line: Monetary policy hawkishness is largely priced whereas additional fiscal uncertainty and America’s reactive foreign policy are not fully priced. This news is neutral or bullish for US Treasuries while neutral or bearish for US stocks over a tactical time horizon (zero-to-six months) (Chart 2). Biden Can Hurt Stocks, Stocks Cannot Help Biden Before addressing how Biden will try to boost his job approval, we should ask whether approval ratings have any direct impact on financial markets. The answer is largely no – or fleeting at best. During the Trump administration it was easy to get the impression that the president’s approval rating had a substantive impact on the stock market, or at least benefited stocks relative to bonds. After the first year, a correlation developed between presidential approval and the stock-to-bond ratio (Chart 3A, top panel). The passage of tax cuts juiced corporate profits but also suggested that President Trump could get things done, boosting his approval rating. Oddly, however, the relationship continued even after Republicans lost Congress in 2018. Spurious or not, the correlation persisted until Covid-19 erupted. At that point Trump’s approval tanked while the stock market roared on the back of gargantuan monetary and fiscal stimulus. President Biden’s administration started off the same way, with presidential approval falling (the usual honeymoon ended) while stocks rallied relative to bonds (Chart 3A, bottom panel). But Biden’s passage of the American Rescue Plan Act and the bipartisan Infrastructure Investment and Jobs Act in 2021 did not boost his approval rating. Going forward, Biden’s approval rating will probably stabilize at a low level in an inflationary or stagflationary context. Stocks may continue to underperform bonds over a tactical time frame but will not underperform bonds over the cyclical time frame as long as the US avoids a recession. Thus there is not likely to be close correlation between Biden’s approval and the stock-to-bond ratio. From the sector and style perspective, there is also no clear relationship with presidential approval. There may be some basis for seeing Trump’s tax cuts as positive for cyclicals relative to defensives. His term coincided with the second half of a business cycle when growth expanded. But ultimately cyclicals vacillated and went sideways. Moreover growth stocks outperformed value stocks, in accordance with President Obama’s term in office. Yet there was no correlation between Trump’s approval and growth stocks relative to value (Chart 3B, top two panels). In Biden’s case, presidential job approval has no clear correlation with cyclicals relative to defensives. There may be some relationship with value relative to growth stocks but it is far from convincing. Most likely the underlying macroeconomic dynamics that favored value stocks (i.e. recovery, inflation) coincided with Biden’s honeymoon period and then outlasted it. However, if Biden passes a reconciliation bill with tax hikes, the implication should be positive both for value versus growth stocks and for his approval rating (Chart 3B, bottom two panels). Chart 3AStocks Not Linked To Presidential Approval
Stocks Not Linked To Presidential Approval
Stocks Not Linked To Presidential Approval
Chart 3BStocks Not Linked To Presidential Approval
Stocks Not Linked To Presidential Approval
Stocks Not Linked To Presidential Approval
From the above data we can draw a few conclusions. On one hand, the stock-to-bond ratio and cyclicals-versus-defensives could rally again on the back of a resilient global economy and yet Biden’s approval rating could fail to recover. The distribution of wealth means that inflation and rising mortgage rates hit low-to-middle income groups who comprise the bulk of voters. Cyclical assets will rise if the global economy improves relative to the US economy, whereas presidential approval may not. Inflation could subside incrementally with limited benefit to the president. On the other hand, if stocks and cyclical sectors continue to underperform, it will probably be due to even worse economic outcomes that will simultaneously prevent Biden’s approval from recovering. If the economy slows further and inflation remains persistent, disapproval will rise. The problem for investors is that the latter is the likeliest scenario based on the energy supply risks in Europe and China’s difficulties stabilizing growth. The US economy cannot entirely avoid the knock-on effects of slower global growth over the next six months. Bottom Line: There is no stable relationship between presidential approval and the stock market, whether regarding bonds, sectors, or styles. There are occasional correlations that reflect coincidences of macro, market, and political cycles or major policy changes. In today’s context a rebound in cyclical assets may not help the president while a further downturn would hurt him. But the president’s attempts to boost his approval rating could hurt stocks. Inflation And Foreign Wars Tend To Hurt Presidents What can Biden do to boost his approval rating and his party’s odds in the midterm election? Not much. Foreign policy is his best option, though he is limited to a defensive or reactive foreign policy and even then the underlying economy will drive voters the most. Looking at presidential approval over time, upswings occur during periods of economic prosperity and peaks occur amid foreign belligerence that threatens the homeland. Presidential approval has slumped since the subprime mortgage crisis and today it is even lower than under President Obama (Chart 4A). Chart 4APresidential Approval Follows Peace And Prosperity, Not War And Poverty
Biden's Cold War And Culture War
Biden's Cold War And Culture War
Similarly presidential disapproval rises during recessionary and inflationary periods as well as wars and scandals (Chart 4B). The Obama/Trump era saw a rise in disapproval that could resume due to inflation. Foreign wars that do not present a threat to the homeland can increase disapproval. Chart 4BPresidential Approval Follows Peace And Prosperity, Not War And Poverty
Biden's Cold War And Culture War
Biden's Cold War And Culture War
The takeaway is that a homeland threat from abroad could temporarily lift the president’s approval but it will not last for long unless the underlying economic malaise is cured. The problem for Biden is that the most immediate foreign policy challenges emanate from oil producers whose reactions exacerbate the inflation problem (Russia, Iran). Biden may or may not keep relations steady with China, where disputes could drive up import prices. Bottom Line: A reactive foreign policy could provoke a threat to the homeland that boosts the president’s job approval. But more likely the weakening economy, high inflation, and foreign crises that add to inflation will hurt the president. Biden And The Kennedy Playbook President Kennedy’s experience in 1962 presents the best case for Democrats but the underlying economic and political context are different and damaging for Biden. Comparing today’s situation to comparable midterm election years, the negative outlook for Biden and the Democrats becomes clear. Comparable midterm elections feature high international tensions, high inflation, or low presidential approval on a net basis. Today the “Misery Index” (unemployment plus inflation) is comparable to the minimum levels in midterm years in the 1970s – and higher than the maximum levels in other midterm years (Table 1). The House and Senate losses during periods of high misery and low presidential approval are substantial. Table 1Misery And Midterms
Biden's Cold War And Culture War
Biden's Cold War And Culture War
The 1962 midterm election is a notable exception. The Cuban Missile Crisis and Kennedy’s handling of it minimized the Democratic Party’s losses that year, with only four seats lost in the House, plus a gain of three seats in the Senate. Compare this to the typical midterm election, with an average of 27 lost seats in the House (31 for Democrats) and four seats lost in the Senate (five for Democrats) (Table 2). Table 2Kennedy’s Cuban Missile Crisis Midterm, 1962
Biden's Cold War And Culture War
Biden's Cold War And Culture War
Kennedy’s net approval averaged 55% that year, whereas Biden’s today stands at -11%. A threat to the homeland could boost Biden’s approval but today’s likeliest conflicts would worsen inflation if they occurred. The Misery Index stands at 11% this year compared to 6% in 1962. Most importantly, in the Cuban Missile Crisis, the Russians recognized that America would always care about Cuba’s status more than Russia because it posed a proximate strategic threat. Americans had more at stake and could take greater risks to prevent Cuba from hosting nuclear arms. Today, while the US is not trying to supply Ukraine or Finland with nuclear weapons, NATO membership would expand the US nuclear umbrella. Americans do not seem prepared to recognize that Russia will always care more about Ukraine’s and Finland’s status than Americans will. Russians have more at stake and can take greater risks. Thus while Biden’s foreign policy could easily provoke a crisis with Russia, Biden may not get the better end of the crisis like Kennedy did. Meanwhile financial markets will suffer from the spike in tensions. Bottom Line: Biden’s doubling down on support for Ukraine and NATO enlargement suggest that he does not have an interest in reducing tensions with Russia ahead of the midterm election. Yet Biden is unlikely to get the better of any reactive foreign policy that escalates tensions – at least not in time for the midterms. This dynamic is negative for US and global stocks and risk assets. Election Quant Model Updates The Philadelphia Federal Reserve released a second update to its state-level coincident indicators in April, enabling us to update our quant models for the Senate election in 2022 and presidential election in 2024. The model still predicts that Democrats will lose two Senate seats, producing a Republican majority of 52-48 (Chart 5). Arizona and Georgia are the two states in which Democrats won Senate seats in 2022 but are expected to flip to the Republican side. Arizona and Pennsylvania remain toss-up states (odds of Democratic victory range from 45%-55%) but are inching downward toward likely Republican victories. Chart 5GOP Tipped To Take The Senate (Quant Election Model, April 2022)
Biden's Cold War And Culture War
Biden's Cold War And Culture War
Democrats shed probability in all states once again. Odds fell the most in Arizona (-1.08 percentage point since the last update in early April) followed by North Carolina (-1.03ppt) and Pennsylvania (-0.98ppt). In seven states the Democratic odds of victory fell by more than 0.5ppts, including Arizona and Nevada (Chart 6). Overall the probability for Democrats retaining control of the Senate now stands at 48.2% (down 0.2ppt). These odds are higher than consensus even though they agree with the consensus on expecting Republican victory. Online betting markets like PredictIt are pricing in Republican control at around 79%, up 3ppt from our last update. This is overstated and the new controversy over the Supreme Court and abortion will fire up Democratic voters, making the Senate race closer to what our model suggests. Chart 6Democrats Falter Across Senate Races: AZ, PA, NC
Biden's Cold War And Culture War
Biden's Cold War And Culture War
Looking ahead to 2024, our presidential election model still predicts 308 Electoral College votes for the Democratic Party, a number that has not changed since the 2020 election (Chart 7). Democrats have a 54.6% chance overall of retaining the White House. Chart 7Biden Still Tipped For 2024 (Quant Election Model, April 2022)
Biden's Cold War And Culture War
Biden's Cold War And Culture War
The trend is negative for the incumbent party. North Carolina slipped out of the toss-up category and into Republican category – i.e. Democrats now have only a 44% chance of winning it. Democrats’ odds of winning Florida moved lower – it is now in toss-up territory at 54%, which comes closer to our subjective judgment that Republicans are favored there. The toss-up states have remained well anchored in the range of 40%-60% since 2020 and will play a pivotal role in future predictions. Generally the trend is for falling odds that Democrats will win these states (PA, FL, NC, AZ, and GA). Both Pennsylvania and Florida account for a combined 49 electoral votes and Florida is probably more Republican-leaning than the model says. If the three critical Rust Belt states (Pennsylvania, Wisconsin, Michigan) slip into toss-up territory then the model will be flagging serious trouble for Democrats. But a lot can happen between now and 2024. In the latest update Democrats are shedding probability of winning in all states, although to a lesser degree than the past two updates. Economic data, while still negative for the incumbent party, may be deteriorating less rapidly. Biden’s approval rating improved marginally since our last update and we expect it to stabilize, albeit at a low level. Michigan recorded the largest decline in Democratic odds of victory (-1.07ppt) followed by Minnesota (-0.79ppt) and New Hampshire (-0.78ppt). Democrats shed more than 0.5ppts from their odds of victory in twelve states, nine of which they won in 2022 (Chart 8). Chart 8Democrats Shedding Odds Of Winning States In 2024
Biden's Cold War And Culture War
Biden's Cold War And Culture War
Bottom Line: Republicans are favored to take the Senate (as well as the House) in 2022. Democrats are slightly favored to retain the White House in 2024, though the model is optimistic by granting Florida to the Democrats and the election odds look to be razor-thin yet again. Investment Takeaways As we go to press, the unusual leak of a draft opinion of Supreme Court Justice Samuel Alito has roiled US politics. The draft argues that the landmark court case of Roe Versus Wade should be overturned. This incident reflects our “Peak Polarization” theme – that polarization will remain very disruptive in the short term yet subside over the long term. It also suggests an activist effort to escalate the culture wars ahead of the midterm election, which we have argued would be the case and implies that more unrest will follow from this event. Whether the Supreme Court overturns the landmark Roe versus Wade ruling of 1973, the battle for women voters will help sustain election-year policy uncertainty, as women’s approval for Democrats will start to recover (Chart 9). Investor sentiment will remain bearish in the very near term. A series of hurdles need to be cleared before we close our tactical long DXY trade and defensive sector tilt. We are closing our long municipal bond relative to Treasury trade for a loss of 1.5% (Chart 10). Chart 9Women Are Key Constituencies In The Midterm
Biden's Cold War And Culture War
Biden's Cold War And Culture War
Chart 10Municipal Trade Fizzled Out Despite Strong Local Government Finance
Municipal Trade Fizzled Out Despite Strong Local Government Finance
Municipal Trade Fizzled Out Despite Strong Local Government Finance
The overall analysis of US politics is neutral or bullish for US Treasuries while neutral or bearish for US stocks over a tactical time horizon (zero-to-six months). If recession is avoided at the critical juncture this year, then 2023 will see a rising stock market as the economy expands and political risks fall. Matt Gertken Senior Vice President Chief US Political Strategist mattg@bcaresearch.com Footnotes 1 Peter Weber, “Defense Secretary Lloyd Austin says U.S. believes Ukraine can win, wants to 'see Russia weakened,'” The Week, April 25, 2022, theweek.com. Strategic View Open Tactical Positions (0-6 Months) Open Cyclical Recommendations (6-18 Months) Table A2Political Risk Matrix
Biden's Cold War And Culture War
Biden's Cold War And Culture War
Table A3US Political Capital Index
Biden's Cold War And Culture War
Biden's Cold War And Culture War
Chart A1Presidential Election Model
Biden's Cold War And Culture War
Biden's Cold War And Culture War
Chart A2Senate Election Model
Biden's Cold War And Culture War
Biden's Cold War And Culture War
Table A4APolitical Capital: White House And Congress
Biden's Cold War And Culture War
Biden's Cold War And Culture War
Table A4BPolitical Capital: Household And Business Sentiment
Biden's Cold War And Culture War
Biden's Cold War And Culture War
Table A4CPolitical Capital: The Economy And Markets
Biden's Cold War And Culture War
Biden's Cold War And Culture War
Executive Summary A True Bond Bear Market, USD-Hedged Or Unhedged
A True Bond Bear Market, USD-Hedged Or Unhedged
A True Bond Bear Market, USD-Hedged Or Unhedged
The US dollar has appreciated in 2022, most notably against the euro and Japanese yen. The rally has been more muted against the currencies of major US trading partners like the Canadian dollar and Chinese yuan. The dollar strength to date has had minimal impact on US inflation and will not force any adjustment in the Fed’s hawkish path on interest rates. The weakness of the euro and yen versus the USD will not turn the ECB or Bank of Japan more hawkish, given the lack of visible pass-through from currency depreciation to domestic inflation in Europe and Japan. The two largest owners of US Treasuries, China and Japan, have not increased Treasury purchases in response to higher US yields and a firmer US dollar. Geopolitical tensions and a desire to diversify out of US assets will continue to limit China buying of US Treasuries. Even higher US yields will be needed to compensate Japanese investors for higher bond and currency volatility at a time when the cost to hedge USD exposure is high and rising. Bottom Line: An appreciating US dollar is not yet a reason to expect a peak in US inflation or Treasury yields, or a change in ECB/BoJ policy. Maintain a neutral global duration stance and continue to underweight US Treasuries versus German Bunds and JGBs. Feature The strengthening US dollar (USD) has gotten the attention of investors, with the DXY index up +8.1% since the start of 2022 and threatening a major breakout from the range that has prevailed since 2016 (Chart 1). There have been notable moves in the major currencies that are in the DXY index, especially the euro (EUR) and Japanese yen (JPY). EUR/USD now sits at 1.05 and is threatening a move towards the parity level last seen in 2002. USD/JPY has seen a stunningly rapid increase to the current 130 level, rising 15 big figures in just two months. On a broader basis, the USD rally has been less impressive. The Federal Reserve’s nominal broad trade-weighted dollar index is up a more modest +3.7% year-to-date (Chart 2). Currencies of the major US trading partners have seen less impressive moves versus the dollar compared to the euro and yen. The Canadian dollar is down -1.9%, while the Mexican peso is flat, versus the dollar so far in 2022. Even the tightly managed Chinese currency (CNY) has belatedly joined the depreciation party, with USD/CNY up +4% since mid-April. Chart 1USD Breaking Out Against The Majors
USD Breaking Out Against The Majors
USD Breaking Out Against The Majors
Chart 2Smaller FX Moves From The Larger US Trade Partners
Smaller FX Moves From The Larger US Trade Partners
Smaller FX Moves From The Larger US Trade Partners
For bond markets, the move towards a stronger US dollar is relevant if a) it is sustainable; b) it helps cool off the overheating US economy; and c) it induces capital flows into US Treasuries. On all three counts, the current bout of dollar strength has not been enough to reverse the upward trajectory of US Treasury yields, in absolute terms and relative to government bonds in Europe and Japan. Multiple Drivers Of The USD Rally First and foremost, the latest appreciation of the USD has been about rising US interest rate expectations. The Fed’s increasingly hawkish rhetoric in response to surging inflation has forced a sharp upward adjustment of both the near-term and medium-term path for US bond yields. This has been most evident in the real yield component of yields, with the yield on the 10-year inflation-protected TIPS now in positive territory at +0.15% - a big increase from the -0.5 to -1% range that has prevailed during the past two years of the COVID pandemic. Related Report Global Fixed Income StrategyWe’re All Yield Chasers Now The momentum of the USD rally, with a +13.6% year-over-year gain in the DXY index, has been robust compared to the outright level of US bond yield spreads versus the major developed markets, especially after adjusting for realized inflation differentials (Chart 3). This reflects other USD-bullish factors beyond US interest rate expectations. The US dollar typically behaves as a defensive currency, appreciating during periods of slowing global growth and/or rising investor risk aversion. Both are happening at the same time right now, boosting the safe haven appeal of the US dollar. Global growth expectations are depressed, with the ZEW survey of investment professionals back down to the pandemic lows of 2020 (Chart 4, top panel).1 Worries about slowing growth and high inflation, and the rapid tightening of global monetary policies needed to combat that inflation, are also weighing on investor confidence. US equity market volatility has picked up and investors are paying up to protect their portfolios via options - the VIX index is back above 30 and the CBOE put/call ratio is at a two-year high (middle panel). Chart 3A Big USD Rally Fueled By Wider Real Yield Differentials
A Big USD Rally Fueled By Wider Real Yield Differentials
A Big USD Rally Fueled By Wider Real Yield Differentials
Chart 4Slowing Global Growth & Rising Risk Aversion Weighing On USD
Slowing Global Growth & Rising Risk Aversion Weighing On USD
Slowing Global Growth & Rising Risk Aversion Weighing On USD
This “perfect storm” of USD-bullish factors – rising US interest rate expectations, slowing global growth expectations and increased investor nervousness – has pushed to USD to a level that now appears stretched. BCA Research’s US Dollar Composite Technical Indicator, which combines measures of breadth, momentum, sentiment and trader positioning, is now at an overbought extreme that has heralded past US dollar reversals (bottom panel). Bottom Line: The rising US dollar now discounts a lot of Fed tightening, growth pessimism and investor fear. Conditions for a reversal are in place if any of those USD-bullish factors lose influence, most notably Fed expectations. USD Strength Does Not Impact The Outlook For The Fed, ECB Or BoJ Chart 5A True Bond Bear Market, USD-Hedged Or Unhedged
A True Bond Bear Market, USD-Hedged Or Unhedged
A True Bond Bear Market, USD-Hedged Or Unhedged
USD strength has made life even more difficult of bond investors, at a time when returns across the fixed income universe have suffered because of the duration-related losses from rising bond yields. The Bloomberg Global Treasury index is down -12.2% so far in 2022, and down -18% from the 2020 peak, on a currency-unhedged basis (Chart 5). The returns are not much better this year on a USD-hedged basis, down -6.8% since the start of the year. The latter is suffering from both duration losses and the rising cost to hedge the US dollar. An investor hedging USD exposure into JPY must pay an annualized 165bps (using 3-month currency forwards), while hedging USD exposure into EUR costs 200bps. Those hedging costs primarily reflect higher US interest rate expectations versus Europe and Japan. They will only come down when markets believe that the Fed will stop raising interest rates and begin to easy policy. It is not clear that the current bout of USD strength, on its own, is enough to change the Fed’s plans. Typically, a substantially stronger US dollar would lead the Fed along a less hawkish path, as it would act to slow imported inflation pressures. However, this is not a typical Fed cycle with US headline CPI inflation at a 41-year high of 8.5%. A huge part of that US inflation overshoot is due to global supply squeezes that have impacted the prices of traded goods and commodities. On a rate-of-change basis, the appreciating US dollar is coinciding with some slowing of commodity price momentum, but less so for goods prices. The index of world export prices compiled by the CPB Research Bureau in the Netherlands is up +12.2% on a year-over-year basis, a rapid pace that typically exists during periods of US dollar depreciation (Chart 6, top panel). The annual growth of the CRB commodity index is +17.2%, down from the peak of +54.4% in June 2021, and has roughly tracked the acceleration of the US dollar (middle panel). Yet even with the moderation of commodity inflation, the US dollar strength seen to date has not been enough to slow overshooting global goods price inflation – a necessary condition for central banks like the Fed to turn less hawkish (bottom panel). We do expect global goods price inflation to moderate over the rest of 2022, especially in the US, as post-pandemic consumer spending patterns shift away from goods back towards services. This will be a demand-related story, however, not a USD-strength-related story. Until there is more decisive evidence that goods inflation is slowing meaningfully, the Fed will be forced to deliver on its latest hawkish rhetoric. This includes shifting to a path of hiking rates by 50bps per meeting and moving towards a faster reduction of the Fed’s balance sheet. Right now, there is not much evidence suggesting that the stronger dollar should derail that trajectory (Chart 7): Chart 6USD Strength Not Helping To Slow Global Inflation
USD Strength Not Helping To Slow Global Inflation
USD Strength Not Helping To Slow Global Inflation
Chart 7The Fed Will Remain Hawkish, Despite A Firmer USD
The Fed Will Remain Hawkish, Despite A Firmer USD
The Fed Will Remain Hawkish, Despite A Firmer USD
Non-oil import prices are expanding at a +7.5% pace and accelerating in the face of a firmer US dollar that would normally coincide with slowing import price growth (top panel) The overall level of US financial conditions – which includes not only the currency but other variables like equity prices and corporate bond yields - remains stimulative, both in absolute terms and relative to the level of the trade-weighted US dollar (middle panel). One area of concern is the widening US trade deficit, now nearly -5% of GDP in nominal terms (bottom panel). That wider deficit is primarily related to the combination of strong import demand (and soaring import prices) and soft export demand given slowing global growth. A stronger US dollar does not help reverse either of those trends. However, it is difficult for the Fed to isolate the impact of the currency on the trade deficit given the other non-currency-related factors weighing on US export and import demand (i.e. weaker exports because of the Ukraine war and China COVID lockdowns). In sum, the US dollar strength seen so far does not change our expectations on the path of US inflation, and the pace of Fed tightening, over the next 6-12 months. We still see the Fed delivering multiple rate hikes, but less than the 298bps discounted in the US overnight index swap (OIS) curve over the next year. Conversely, the weakness of the euro and yen versus the US dollar does not change our outlook for the ECB and Bank of Japan. We see both central banks not delivering anything close to the rate hikes discounted in OIS curves. Chart 8Not Much Inflation From A Weaker Euro & Yen
Not Much Inflation From A Weaker Euro & Yen
Not Much Inflation From A Weaker Euro & Yen
On a trade-weighted basis, the euro is only down -5% over the past year - a modest move in comparison to soaring euro area inflation, which hit +7.5% on a headline basis and +3.5% on a core basis in April (Chart 8, middle panel). The ECB is under pressure to end its asset purchases very quickly and begin raising rates, but the euro does not appear to be a reason to accelerate the ECB’s timetable. In Japan, the very rapid weakening of the yen has generated shockingly little inflation, especially in the current environment of strong global goods/commodities inflation. The trade-weighted yen is down -12.7% on a year-over-year basis, yet Japan’s “core-core” CPI index that excludes food and energy prices remains in deflation hitting -0.7% in March – a move exaggerated by plunging mobile phone prices, but still very weak compared to the path of the yen and global goods prices. OIS curves are currently discounting 183bps of ECB rate hikes and 9bps of Bank of Japan rate hikes over the next year. We recommend fading that pricing by staying overweight core Europe and Japan in global bond portfolios, especially versus the US where the Fed is far more likely to follow through on discounted rate hikes. Bottom Line: The dollar strength to date has had minimal impact on US inflation and will not force any adjustment in the Fed’s hawkish path on interest rates. At the same time, the weakness of the euro and yen versus the USD will not turn the ECB or Bank of Japan more hawkish, given the lack of visible pass-through from currency depreciation to domestic inflation in Europe and Japan. Can Foreign Investors Replace Fed Treasury Buying? Chart 9UST Demand Shifting To More Price-Sensitive Buyers
UST Demand Shifting To More Price-Sensitive Buyers
UST Demand Shifting To More Price-Sensitive Buyers
For bond investors, the role of non-US demand for US Treasuries has always been a source of mystery that is often used to explain yield movements. Rumors of flows from major emerging market currency reserve managers or large Asian pension funds has often been used to justify a bullish or bearish view on Treasuries – even when hard data that could prove the existence of such flows is published with long lags that make it useless for timely analysis. The impact of potential foreign bond buying on US Treasury yields has been less influential over the past couple of years. Fed buying via quantitative easing (QE) has swamped all other sources of demand for Treasuries. With the Fed now in a rate hiking cycle that will also lead to a rapid start of quantitative tightening (QT) this summer, the question of who will replace the Fed’s demand for US Treasuries becomes once again relevant for the future path of US bond yields beyond the expected path of the fed funds rate. Already, there has been an adjustment in the term premium for longer-term US Treasury yields – the component of bond yield valuation that would be most impacted by large flows - as the Fed has slowed its pace of bond buying (Chart 9). The New York Fed’s estimates of the term premium on the 10-year Treasury yield reached deeply depressed levels – around -100bps - at the peak of the Fed’s pandemic QE program in 2020. As the US economy has recovered from the 2020 COVID recession, US interest rate expectations have increased but so have estimates of the term premium, which are now back to zero or even slightly positive. The Fed’s QE bond buying has been purely volume driven, with the size and timing of the purchases announced well in advance. The Fed is often called a “price insensitive” buyer since its buying is done without any consideration of yield levels. Other Treasury investors, including foreign buyers, are more price sensitive, with demand influenced by the level of yields. According to the TIC database on US capital flows produced by the US Treasury Department, net foreign buying of Treasuries has picked up, totaling +$346 billion over the 12 months to the most recently available data from February 2022 (Chart 10). That increase has entirely come from private investors, as so-called “official” flows have been flat. Chart 10China Remains On A UST Buyer's Strike
China Remains On A UST Buyer's Strike
China Remains On A UST Buyer's Strike
Chart 11European Buying Of USTs Set To Peak?
European Buying Of USTs Set To Peak?
European Buying Of USTs Set To Peak?
The latter is a continuation of the trend seen over the past few years where China, the nation with the second largest holdings of US Treasuries, has stopped buying them. This is a decision rooted in both geopolitics and economics. Smaller trade surpluses mean China has fewer new currency reserves to invest, while worsening Sino-US tensions have led Chinese authorities to diversify existing reserve holdings away from US Treasuries into gold and other assets. Looking ahead, China is unlikely to significantly ramp up its Treasury purchases despite more attractive US yields and Chinese policymakers tolerating some mild currency weakness versus the US dollar. Beyond China, demand for Treasuries from Europe and Japan has picked up but remains moderate by historical standards. For European investors, there has been a major swing in the TIC data, moving from a net outflow (on a 12-month running total basis) of -$194 billion in December 2020 to a net inflow of +$24 billion in February 2022 (Chart 11, top panel). Typically, net inflows into Treasuries are linked to the FX-hedged spread between US and German government debt. Specifically, when the hedged 10-year Treasury-Bund spread widens to a level between 100-150bps, the flows from Europe into Treasuries begin to improve (middle panel) When that hedged spread narrows to zero or lower, the flows turn the other way and European demand for Treasuries begins to wane. That is typically followed by a widening of the unhedged Treasury-Bund spread (bottom panel). With the current FX-hedged Treasury-Bund spread now at zero, a result of the high cost of hedging US dollars into euros given elevated US rate expectations, we expect European demand for Treasuries to diminish over the rest of 2022. This will help support a wider Treasury-Bund spread as the Fed delivers far more rate hikes than the ECB. For Japan, the largest holder of Treasuries, there has only been a stabilization of outflows over the 12 months to February 2022 (Chart 12, top panel). Past periods of large net inflows from Japan into US Treasuries have occurred when the hedged 10-year US Treasury-JGB spread has approached 200bps (middle panel). With the current spread at only 112bps, Japanese investor demand for Treasuries is unlikely to return without a significant increase in US yields. Chart 12UST Yields Not Attractive Enough To Induce More Japanese Demand
UST Yields Not Attractive Enough To Induce More Japanese Demand
UST Yields Not Attractive Enough To Induce More Japanese Demand
Chart 13Foreign Bond Investing Is Too Volatile For Japanese Investors Right Now
Foreign Bond Investing Is Too Volatile For Japanese Investors Right Now
Foreign Bond Investing Is Too Volatile For Japanese Investors Right Now
More timely weekly capital flow data from Japan shows that Japanese investors have been reluctant to move money into foreign bonds (Chart 13). Elevated levels of bond/rate volatility, and currency volatility given the huge rally in USD/JPY, have made large Japanese bond investors more cautious on increasing foreign bond allocations, even on a currency-hedged basis. If bond/FX volatility subsides, Japanese investors will become “better buyers” of foreign bonds once again. However, Japanese investors may opt to increase allocations to European bonds rather than US Treasuries, with European yields at comparable levels to US Treasuries in JPY-hedged terms (Tables 1-4). For example, a 30-year German Bund hedged into yen now yields 1.46%, compared to a JPY-hedged 30-year US Treasury yield of 1.33%. Table 12-Year Developed Market Government Bond Yields, Hedged Into USD, EUR & JPY
Recent USD Strength Is Not Bond Bullish
Recent USD Strength Is Not Bond Bullish
Table 25-Year Developed Market Government Bond Yields, Hedged Into USD, EUR & JPY
Recent USD Strength Is Not Bond Bullish
Recent USD Strength Is Not Bond Bullish
Table 310-Year Developed Market Government Bond Yields, Hedged Into USD, EUR & JPY
Recent USD Strength Is Not Bond Bullish
Recent USD Strength Is Not Bond Bullish
Table 430-Year Developed Market Government Bond Yields, Hedged Into USD, EUR & JPY
Recent USD Strength Is Not Bond Bullish
Recent USD Strength Is Not Bond Bullish
Bottom Line: Foreign demand for US Treasuries is unlikely to accelerate enough to replace diminished Fed QE purchases over the next 6-12 months, given high USD-hedging costs and elevated Treasury yield volatility. Non-US investors will not help bring an end to the US bond bear market. Robert Robis, CFA Chief Fixed Income Strategist rrobis@bcaresearch.com Footnotes 1 The Global ZEW expectations series shown in Chart 4 is an equal-weighted average of the individual expectations series for the US and euro area. GFIS Model Bond Portfolio Recommended Positioning Active Duration Contribution: GFIS Recommended Portfolio Vs. Custom Performance Benchmark
Recent USD Strength Is Not Bond Bullish
Recent USD Strength Is Not Bond Bullish
The GFIS Recommended Portfolio Vs. The Custom Benchmark Index Global Fixed Income - Strategic Recommendations* Cyclical Recommendations (6-18 Months)
Recent USD Strength Is Not Bond Bullish
Recent USD Strength Is Not Bond Bullish
Tactical Overlay Trades
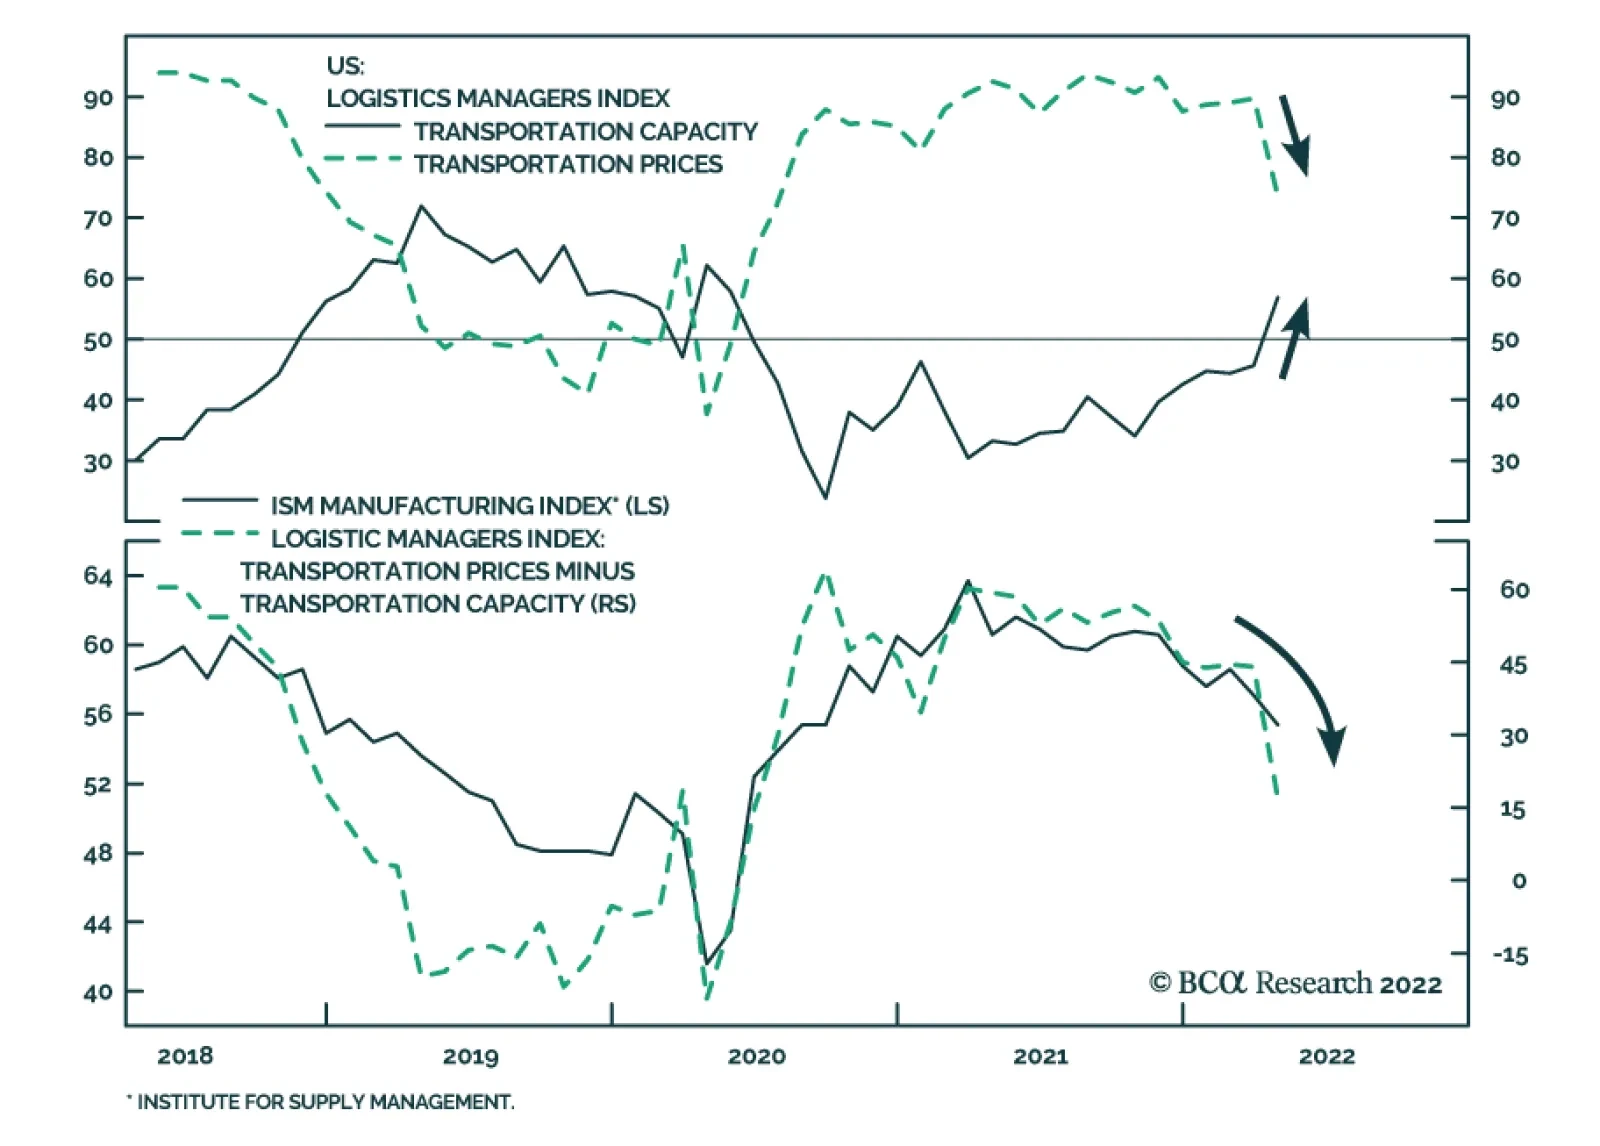
The Logistics Manager’s Index (LMI) is a survey-based indicator of supply chain stress in the US economy. This diffusion index is compiled monthly and is based on eight components that capture trends in transportation, warehousing, and inventory. The…
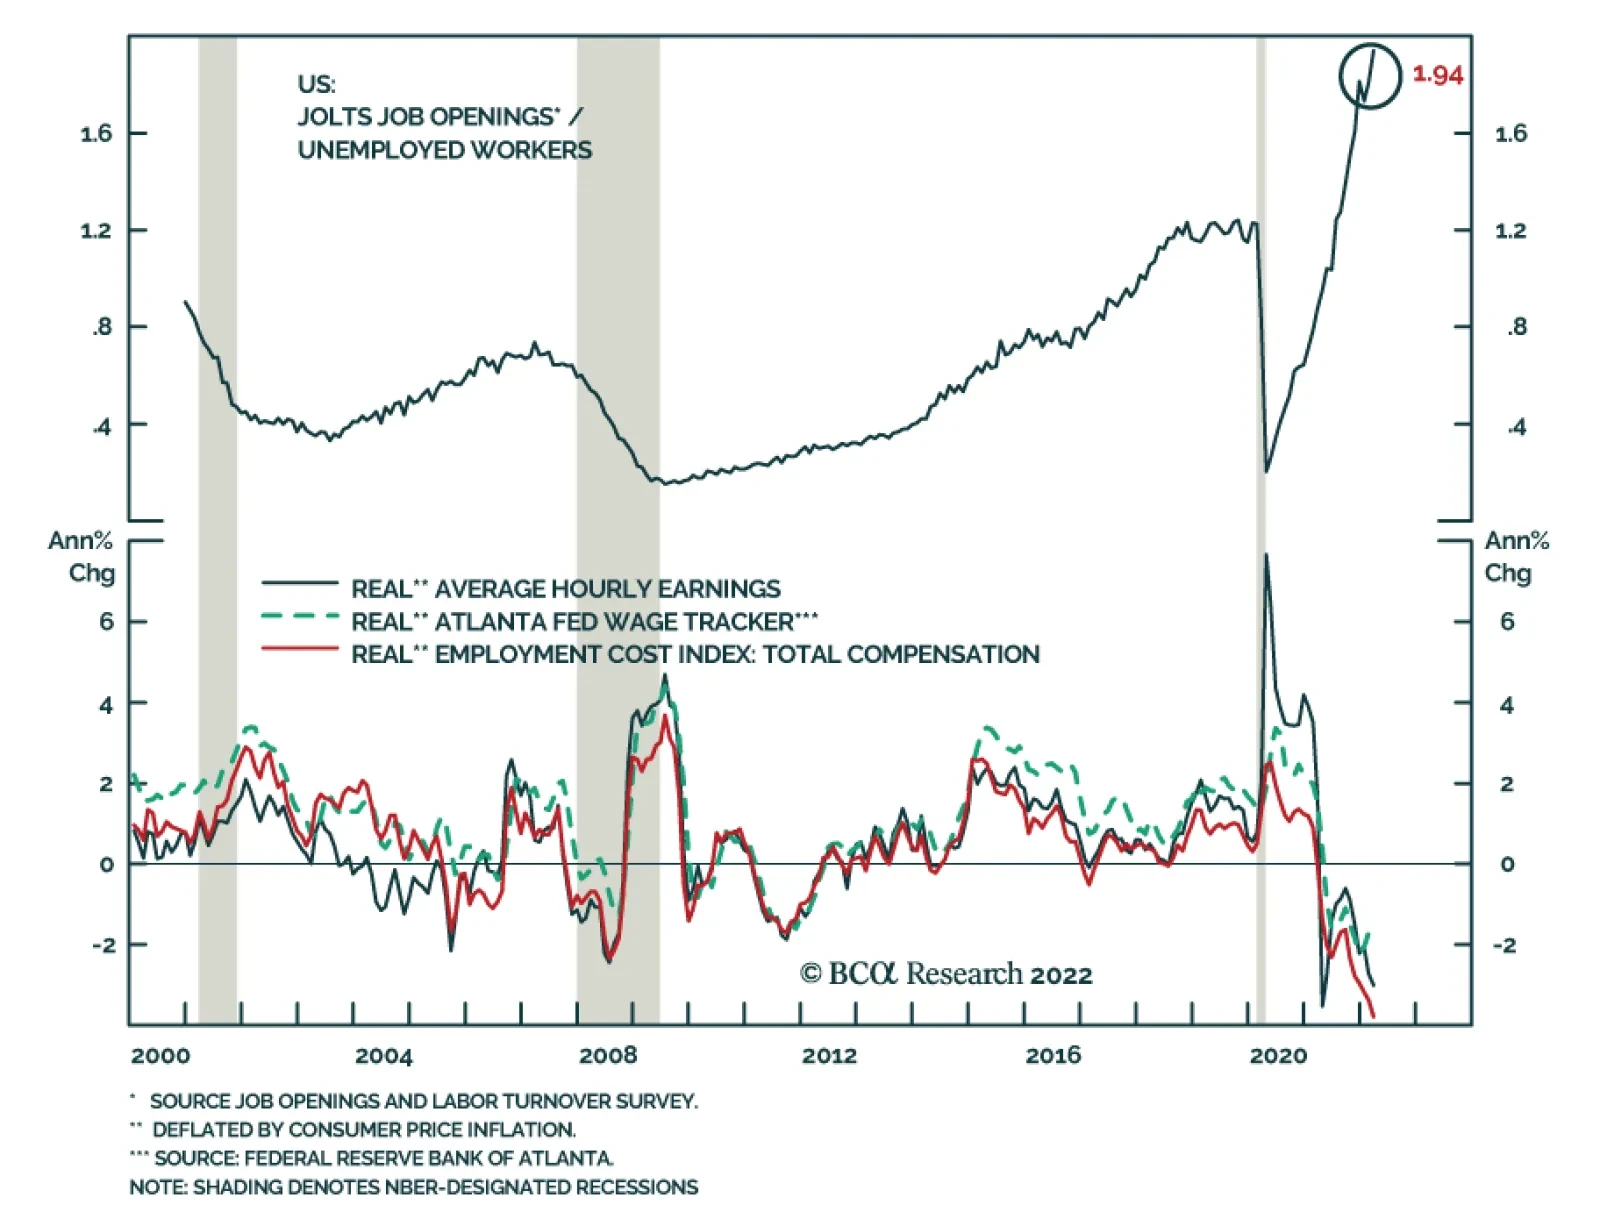
Job openings in the US climbed to a record 11.5 million in March, beating expectations of a decline to 11.2 million. The number of unemployed workers now stands at 5.9 million, implying that there are nearly twice as many vacancies as there are Americans…
Highlights Chart 1Past Peak Inflation
Past Peak Inflation
Past Peak Inflation
The Fed is all set to deliver a 50 basis point rate hike when it meets this week and with inflation still well above target Chair Powell will be keen to re-affirm the Fed’s commitment to tighter policy. However, with the market already priced for a 3% fed funds rate by the end of this year – 267 bps above the current level – we don’t see much scope for further hawkish surprises during the next eight months. Core PCE inflation posted a monthly growth rate of 0.29% in March. This is consistent with an annual rate of 3.6%, below the Fed’s median 4.1% forecast for 2022. Slowing economic activity between now and the end of the year will also weigh on inflation going forward (Chart 1). All in all, we see the Fed delivering close to (or slightly less) than the amount of tightening that is already priced into the curve for 2022. US bond investors should keep portfolio duration close to benchmark. Feature Table 1 Recommended Portfolio Specification Table 2Fixed Income Sector Performance
No More Hawkish Surprises
No More Hawkish Surprises
Investment Grade: Underweight Chart 2Investment Grade Market Overview
Investment Grade Market Overview
Investment Grade Market Overview
Investment grade corporate bonds underperformed the duration-equivalent Treasury index by 140 basis points in April, dragging year-to-date excess returns down to -292 bps. The average index option-adjusted spread widened 19 bps on the month to reach 135 bps, and our quality-adjusted 12-month breakeven spread moved up to its 48th percentile since 1995 (Chart 2). In a recent report we made the case for why investors should underweight investment grade corporate bonds on a 6-12 month horizon.1 First, we noted that while investment grade spreads had jumped off their 2021 lows, they remained close to the average level from 2017-19 (panel 2). Spreads have widened even further during the past two weeks, but they are not sufficiently attractive to entice us back into the market given the stage of the economic cycle. The 2-year/10-year Treasury slope has un-inverted, but it remains very flat at 19 bps. The flat curve tells us that we are in the mid-to-late stages of the economic cycle. Corporate bond performance tends to be weak during such periods unless spreads start from very high levels. Finally, we noted in our recent Special Report that corporate balance sheets are in excellent shape. In fact, total debt to net worth for the nonfinancial corporate sector has fallen to its lowest level since 2008 (bottom panel). Strong corporate balance sheets will prevent spreads from rising dramatically during the next 6-12 months, but with profit growth past its cyclical peak, balance sheets will look considerably worse by this time next year. Table 3A Corporate Sector Relative Valuation And Recommended Allocation* Table 3BCorporate Sector Risk Vs. Reward*
No More Hawkish Surprises
No More Hawkish Surprises
High-Yield: Neutral Chart 3High-Yield Market Overview
High-Yield Market Overview
High-Yield Market Overview
High-Yield underperformed the duration-equivalent Treasury index by 187 basis points in April, dragging year-to-date excess returns down to -281 bps. The average index option-adjusted spread widened 54 bps on the month to reach 379 bps. The 12-month spread-implied default rate – the default rate that is priced into the junk index assuming a 40% recovery rate on defaulted debt and an excess spread of 100 bps – shifted up to 4.7% (Chart 3). As we discussed in our recent Special Report, a very flat yield curve sends the same negative signal for high-yield returns as it does for investment grade.2 However, we maintain a neutral allocation to high-yield bonds compared to an underweight allocation to investment grade bonds for three reasons. First, relative valuation remains favorable for high-yield. The spread advantage in Ba-rated bonds over Baa-rated bonds continues to trade significantly above its pre-COVID low (panel 3). Second, there are historical precedents for high-yield bonds outperforming investment grade during periods when the yield curve is very flat but when corporate balance sheet health is strong. The 2006-07 period is a prime example. Finally, we calculate that the junk index spread embeds an expected 12-month default rate of 4.7%. Given our macroeconomic outlook, we expect the high-yield default rate to be in the neighborhood of 3% during the next 12 months. This would be consistent with high-yield outperforming duration-matched Treasuries. MBS: Underweight Chart 4MBS Market Overview
MBS Market Overview
MBS Market Overview
Mortgage-Backed Securities underperformed the duration-equivalent Treasury index by 105 basis points in April, dragging year-to-date excess returns down to -178 bps. We discussed the incredibly poor performance of Agency MBS in last week’s report.3 We noted that MBS’ poor performance has been driven by duration extension. Fewer homeowners refinanced their loans as mortgage rates rose, and the MBS index’s average duration increased (Chart 4). But now, the index’s duration extension is at its end. The average convexity of the MBS index is close to zero (panel 3), meaning that duration is now insensitive to changes in rates. This is because hardly any homeowners have the incentive to refinance at current mortgage rates (panel 4). The implication is that excess MBS returns will be stronger going forward. That said, we still don’t see enough value in MBS spreads to increase our recommended allocation. The average index spread for conventional 30-year Agency MBS remains close to its lowest level since 2000 (bottom panel). At the coupon level, we observe that low-coupon MBS have much higher duration than high-coupon MBS and that convexity is close to zero for the entire coupon stack. This makes the relative coupon trade a direct play on bond yields. Given that we see potential for yields to fall somewhat during the next six months, we recommend favoring low-coupon MBS (1.5%-2.5%) within an overall underweight allocation to the sector. Emerging Market Bonds (USD): Underweight Chart 5Emerging Markets Overview
Emerging Markets Overview
Emerging Markets Overview
Emerging Market (EM) bonds underperformed the duration-equivalent Treasury index by 92 basis points in April, dragging year-to-date excess returns down to -592 bps. EM Sovereigns underperformed the Treasury benchmark by 181 bps on the month, dragging year-to-date excess returns down to -779 bps. The EM Corporate & Quasi-Sovereign Index underperformed by 37 bps, dragging year-to-date excess returns down to -474 bps. The EM Sovereign Index underperformed duration-equivalent US corporate bonds by 2 bps in April. The yield differential between EM sovereigns and duration-matched US corporates remains negative. As such, we continue to recommend a maximum underweight allocation (1 out of 5) to EM sovereigns. The EM Corporate & Quasi-Sovereign Index outperformed duration-matched US corporates by 79 bps in April (Chart 5). This index continues to offer a significant yield advantage versus US corporates (panel 4). As such, it makes sense to maintain a neutral allocation (3 out of 5) to the sector. The EM manufacturing PMI fell into contractionary territory in March (bottom panel). The wide divergence between US and EM PMIs will pressure the US dollar higher relative to EM currencies. This argues for the continued underperformance of hard currency EM assets. Municipal Bonds: Overweight Chart 6Municipal Market Overview
Municipal Market Overview
Municipal Market Overview
Municipal bonds underperformed the duration-equivalent Treasury index by 17 basis points in April, dragging year-to-date excess returns down to -139 bps (before adjusting for the tax advantage). We view the municipal bond sector as better placed than most to cope with the recent bout of spread product volatility. Trailing 4-quarter net state & local government savings are incredibly high (Chart 6) and it will take some time to deplete those coffers even as economic growth slows and federal fiscal thrust turns into drag. On the valuation front, munis have cheapened up relative to both Treasuries and corporates during the past few months. The 10-year Aaa Muni/Treasury yield ratio is currently 94%, up significantly from its 2021 trough of 55%. The yield ratio between 12-17 year munis and duration-matched corporate bonds is also up significantly off its lows (panel 2). We reiterate our overweight allocation to municipal bonds within US fixed income portfolios, and we continue to have a strong preference for long-maturity munis. The yield ratio between 17-year+ General Obligation Municipal bonds and duration-matched corporates is 94%. The same measure for 17-year+ Revenue bonds stands at 99%, just below parity even without considering municipal debt’s tax advantage. Treasury Curve: Buy 5-Year Bullet Versus 2/10 Barbell Chart 7Treasury Yield Curve Overview
Treasury Yield Curve Overview
Treasury Yield Curve Overview
The Treasury curve rose dramatically and steepened in April. The 2-year/10-year Treasury slope steepened 15 bps, from 4 bps to 19 bps. Meanwhile, the 5-year/30-year slope steepened 2 bps, from 2 bps to 4 bps. In a recent Special Report we noted the unusually large divergence between flat slopes at the long end of the curve and steep slopes at the front end.4 For example, the 5-year/10-year Treasury slope is -3 bps while the 3-month/5-year slope is 209 bps. This divergence is happening because the market has moved quickly to price-in a rapid near-term pace of rate hikes that will end in roughly one year. However, so far, the Fed has only delivered 25 bps of those hikes (with another 50 bps due tomorrow) and this is holding down the very front-end of the curve. The oddly shaped curve presents us with an excellent trading opportunity. Specifically, we recommend buying the 5-year Treasury note versus a duration-matched barbell consisting of the 2-year and 10-year notes. This trade looks attractive on our model (Chart 7) and will profit if the rate hike cycle moves more slowly than what is currently priced but lasts longer, as is our expectation. We also continue to recommend a position long the 20-year bullet versus a duration-matched 10/30 barbell as an attractive carry trade. TIPS: Underweight Chart 8TIPS Market Overview
TIPS Market Overview
TIPS Market Overview
TIPS outperformed the duration-equivalent nominal Treasury index by 113 basis points in April, bringing year-to-date excess returns up to +387 bps. The 10-year TIPS breakeven inflation rate rose 3 bps on the month to reach 2.90% and the 5-year/5-year forward TIPS breakeven inflation rate rose 12 bps to reach 2.47%. The 10-year TIPS breakeven inflation has moved up to well above the Fed’s 2.3%-2.5% comfort zone (Chart 8) and the 5-year/5-year forward breakeven rate is at the top-end of that range. Concurrently, our TIPS Breakeven Valuation Indicator has shifted into “expensive” territory (panel 2). In a recent report we made the case for why inflation has already peaked for the year.5 Given that outlook and the message from our valuation indicator, it makes sense to underweight TIPS versus nominal Treasuries on a 6-12 month horizon. In addition to trending down, we expect the TIPS breakeven inflation curve to steepen as inflation heads lower between now and the end of the year. This is because short-maturity inflation expectations are more tightly linked to the incoming inflation data than long-maturity expectations. Investors can position for this outcome by entering inflation curve steepeners or real (TIPS) yield curve flatteners. We also continue to recommend holding an outright short position in 2-year TIPS. ABS: Overweight Chart 9ABS Market Overview
ABS Market Overview
ABS Market Overview
Asset-Backed Securities underperformed the duration-equivalent Treasury index by 7 basis points in April, dragging year-to-date excess returns down to -38 bps. Aaa-rated ABS underperformed by 5 bps on the month, dragging year-to-date excess returns down to -32 bps. Non-Aaa ABS underperformed by 16 bps on the month, dragging year-to-date excess returns down to -67 bps. During the past two years, substantial federal government support for household incomes has caused US households to build up an extremely large buffer of excess savings. During this period, many households have used their windfalls to pay down consumer debt and credit card debt levels have fallen to well below pre-COVID levels (Chart 9). Though consumer credit growth has rebounded, debt levels are still low. This indicates that the collateral quality backing consumer ABS remains exceptionally strong. This also indicates that while surging gasoline prices will weigh on consumer activity in the coming months, household balance sheets are starting from such a good place that we don’t expect a meaningful increase in consumer credit delinquencies. Investors should remain overweight consumer ABS and should take advantage of the high quality of household balance sheets by moving down the quality spectrum, favoring non-Aaa rated securities over Aaa-rated ones. Non-Agency CMBS: Overweight Chart 10CMBS Market Overview
CMBS Market Overview
CMBS Market Overview
Non-Agency Commercial Mortgage-Backed Securities underperformed the duration-equivalent Treasury index by 6 basis points in April, dragging year-to-date excess returns down to -84 bps. Aaa Non-Agency CMBS underperformed Treasuries by 2 bps on the month, dragging year-to-date excess returns down to -69 bps. Non-Aaa Non-Agency CMBS underperformed by 18 bps on the month, dragging year-to-date excess returns down to -128 bps. CMBS spreads remain wide compared to other similarly risky spread products. Further, last week’s Q1 GDP report confirmed that commercial real estate (CRE) investment remains weak (Chart 10, panel 4). Weak investment will continue to support CRE price appreciation (panel 3) which will benefit CMBS spreads. Agency CMBS: Overweight Agency CMBS underperformed the duration-equivalent Treasury index by 4 basis points in April, dragging year-to-date excess returns down to -43 bps. The average index option-adjusted spread widened 2 bps on the month. It currently sits at 50 bps, not that far from its average pre-COVID level (bottom panel). Agency CMBS spreads also continue to look attractive compared to other similarly risky spread products. Stay overweight. Appendix A: The Golden Rule Of Bond Investing We follow a two-step process to formulate recommendations for bond portfolio duration. First, we determine the change in the federal funds rate that is priced into the yield curve for the next 12 months. Second, we decide – based on our assessments of the economy and Fed policy – whether the change in the fed funds rate will exceed or fall short of what is priced into the curve. Most of the time, a correct answer to this question leads to the appropriate duration call. We call this framework the Golden Rule Of Bond Investing, and we demonstrated its effectiveness in the US Bond Strategy Special Report, “The Golden Rule Of Bond Investing”, dated July 24, 2018. Chart 11 illustrates the Golden Rule’s track record by showing that the Bloomberg Barclays Treasury Master Index tends to outperform cash when rate hikes fall short of 12-month expectations, and vice-versa. At present, the market is priced for 296 basis points of rate hikes during the next 12 months. Chart 11The Golden Rule's Track Record
The Golden Rule's Track Record
The Golden Rule's Track Record
We can also use our Golden Rule framework to make 12-month total return and excess return forecasts for the Bloomberg Barclays Treasury index under different scenarios for the fed funds rate. Excess returns are relative to the Bloomberg Barclays Cash index. To forecast total returns we first calculate the 12-month fed funds rate surprise in each scenario by comparing the assumed change in the fed funds rate to the current value of our 12-month discounter. This rate hike surprise is then mapped to an expected change in the Treasury index yield using a regression based on the historical relationship between those two variables. Finally, we apply the expected change in index yield to the current characteristics (yield, duration and convexity) of the Treasury index to estimate total returns on a 12-month horizon. The below tables present those results, along with excess returns for a front-loaded and a back-loaded rate hike scenario. Excess returns are calculated by subtracting assumed cash returns in each scenario from our total return projections.
No More Hawkish Surprises
No More Hawkish Surprises
Appendix B: Butterfly Strategy Valuations The following tables present the current read-outs from our butterfly spread models. We use these models to identify opportunities to take duration-neutral positions across the Treasury curve. The following two Special Reports explain the models in more detail: US Bond Strategy Special Report, “Bullets, Barbells And Butterflies”, dated July 25, 2017, available at usbs.bcaresearch.com US Bond Strategy Special Report, “More Bullets, Barbells And Butterflies”, dated May 15, 2018, available at usbs.bcaresearch.com Table 4 shows the raw residuals from each model. A positive value indicates that the bullet is cheap relative to the duration-matched barbell. A negative value indicates that the barbell is cheap relative to the bullet. Table 4Butterfly Strategy Valuation: Raw Residuals In Basis Points (As Of April 29, 2022)
No More Hawkish Surprises
No More Hawkish Surprises
Table 5 scales the raw residuals in Table 4 by their historical means and standard deviations. This facilitates comparison between the different butterfly spreads. Table 5Butterfly Strategy Valuation: Standardized Residuals (As Of April 29, 2022)
No More Hawkish Surprises
No More Hawkish Surprises
Table 6 flips the models on their heads. It shows the change in the slope between the two barbell maturities that must be realized during the next six months to make returns between the bullet and barbell equal. For example, a reading of -56 bps in the 5 over 2/10 cell means that we would expect the 5-year to outperform the 2/10 if the 2/10 slope flattens by less than 56 bps during the next six months. Otherwise, we would expect the 2/10 barbell to outperform the 5-year bullet. Table 6Discounted Slope Change During Next 6 Months (BPs)
No More Hawkish Surprises
No More Hawkish Surprises
Appendix C: Excess Return Bond Map The Excess Return Bond Map is used to assess the relative risk/reward trade-off between different sectors of the US bond market. It is a purely computational exercise and does not impose any macroeconomic view. The Map’s vertical axis shows 12-month expected excess returns. These are proxied by each sector’s option-adjusted spread. Sectors plotting further toward the top of the Map have higher expected returns and vice-versa. Our novel risk measure called the “Risk Of Losing 100 bps” is shown on the Map’s horizontal axis. To calculate it, we first compute the spread widening required on a 12-month horizon for each sector to lose 100 bps or more relative to a duration-matched position in Treasury securities. Then, we divide that amount of spread widening by each sector’s historical spread volatility. The end result is the number of standard deviations of 12-month spread widening required for each sector to lose 100 bps or more versus a position in Treasuries. Lower risk sectors plot further to the right of the Map, and higher risk sectors plot further to the left. Chart 12Excess Return Bond Map (As Of April 29, 2022)
No More Hawkish Surprises
No More Hawkish Surprises
Ryan Swift US Bond Strategist rswift@bcaresearch.com Footnotes 1 Please see US Bond Strategy / Global Fixed Income Strategy Special Report, “Turning Defensive On US Corporate Bonds”, dated April 12, 2022. 2 Please see US Bond Strategy / Global Fixed Income Strategy Special Report, “Turning Defensive On US Corporate Bonds”, dated April 12, 2022. 3 Please see US Bond Strategy Weekly Report, “The Bond Market Implications Of A 5% Mortgage Rate”, dated April 26, 2022. 4 Please see US Bond Strategy / US Investment Strategy / US Equity Strategy Special Report, “The Yield Curve As An Indicator”, dated March 29, 2022. 5 Please see US Bond Strategy Weekly Report, “Peak Inflation”, dated April 19, 2022. Recommended Portfolio Specification Other Recommendations Treasury Index Returns Spread Product Returns
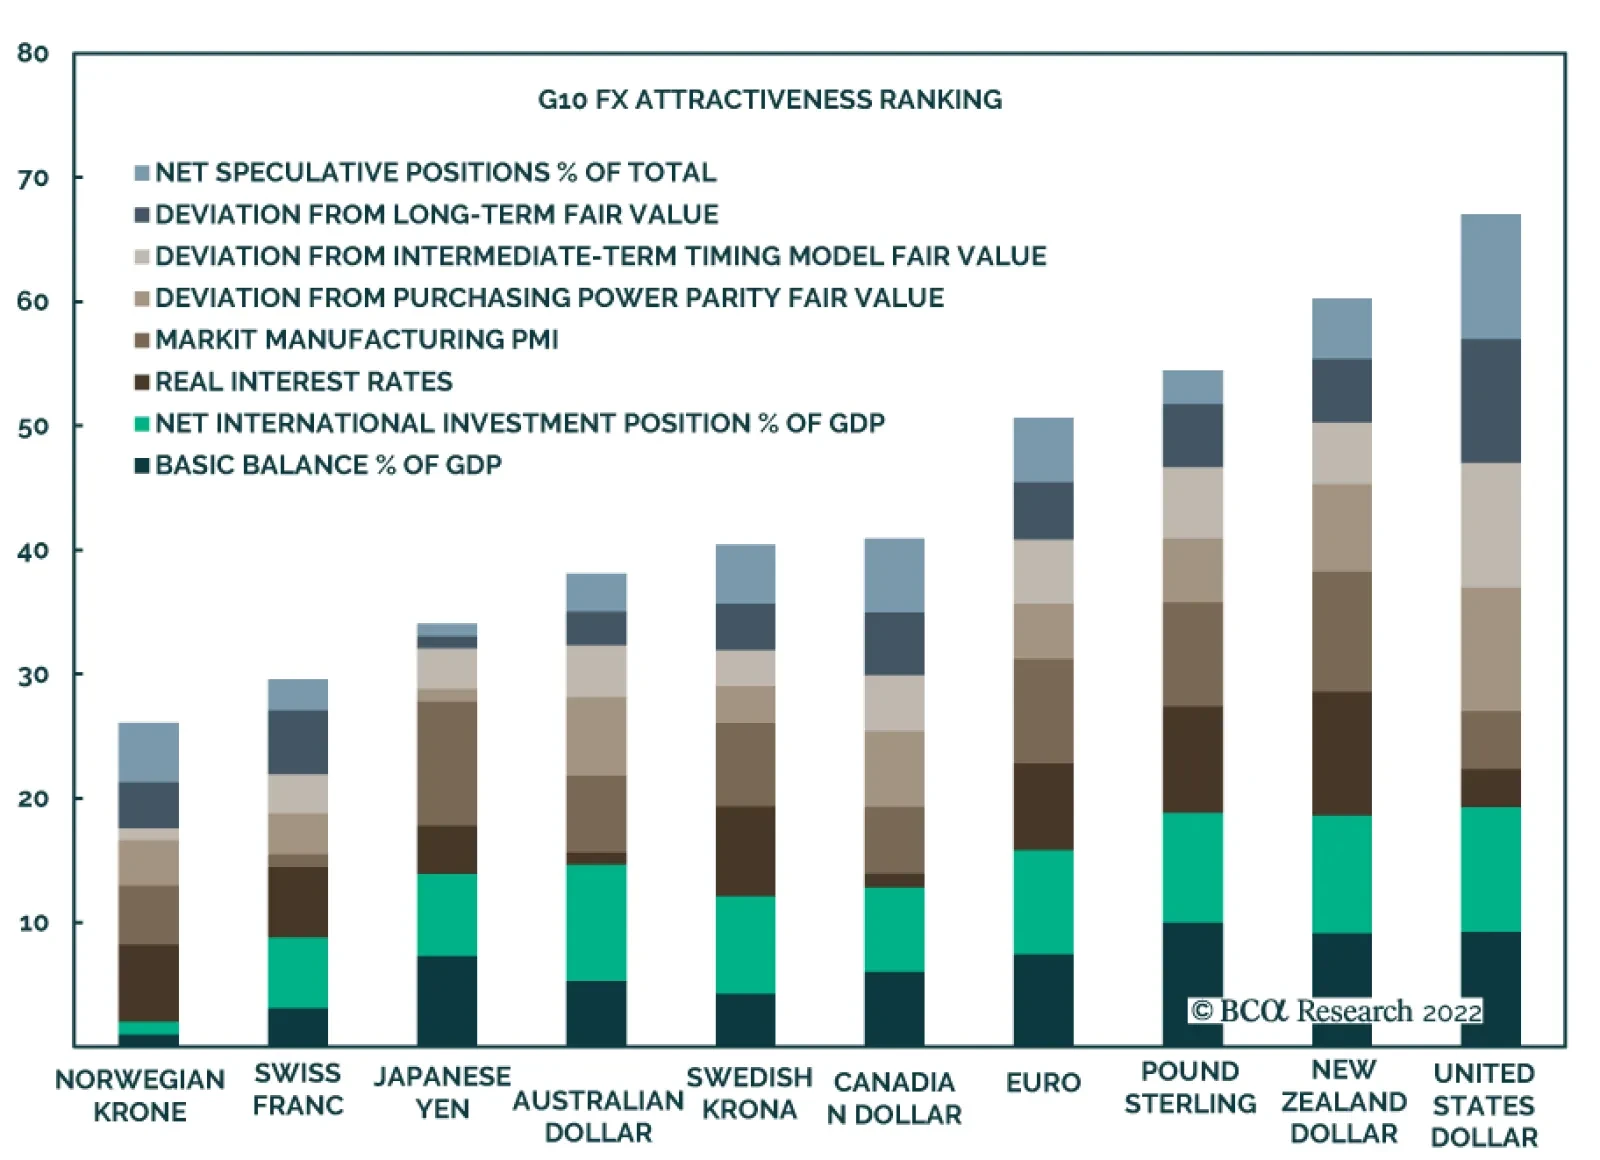
The DXY has returned 7.8% so far this year, making the US dollar the best performing currency within the G10 universe. While commodity currencies such as the AUD, CAD, BRL and MXN have been under less pressure, a vicious liquidation has weighed down on the…
Executive Summary Rampant talk of a wage-price spiral is premature, ginned up by media reports about union organizing successes and union negotiators’ wins. Recent agreements negotiated by unions have not lit an inflationary fuse, as all major compensation series are contracting in real terms. The full sweep of US labor market history, buttressed by the history of the last four decades, suggests that labor has a steep hill to climb to reverse its fortunes. The president has a bully pulpit and the executive branch has a lot of enforcement levers at its disposal, but the judicial and legislative branches are powerful counterweights and the state-level climate is decidedly unfriendly to workers. Labor could regain the upper hand but we’ve been underwhelmed by its victories thus far in the pandemic. We will not believe that it’s turned the tide until we see definitive evidence. The Labor Tide Is Out
The Labor Tide Is Out
The Labor Tide Is Out
Bottom Line: Investors assume that a wage-price spiral is inevitable, or has already begun, at their own peril. The playing field is still heavily tilted in employers’ favor and mainstream media has exaggerated labor’s pandemic gains. Feature Dear Client, This Special Report, updating and elaborating upon our view of the likelihood of a US wage-price spiral, will be our last written output until Monday, May 23rd. We are vacationing this week and we will be holding our quarterly webcast on May 16th in lieu of a publication. Please join us with your questions on the 16th to make it a fully interactive event. Best regards, Doug Peta The term “wage-price spiral” is being increasingly bandied about by the media, broker-dealers and independent strategists and economists. The talk has been prevalent enough that a significant proportion of investors seem to believe a spiral is inevitable if it hasn’t already begun. There is more to the history of US labor market relations than the stagflation seventies and early eighties, however, and we are tempted to see the early-thirties-to-late-seventies New Deal era as the anomaly and the Reagan era that began in 1981 as the rule. Much may hinge on just how much the administration of the “most pro-union president you’ve ever seen” will be able to accomplish when it faces the prospect of the loss of its Congressional majorities in six months. After restating our framework for thinking about the origins and outcomes of strikes and lockouts, we examine the outcomes of the pandemic-era work stoppages tracked by the Bureau of Labor Statistics (BLS). The BLS’ database only covers strikes involving at least 1,000 workers, effectively limiting its scope to strikes involving large union locals. Though the database is not comprehensive, we strongly believe that the incidence of large strikes and their outcomes offer meaningful insight into the evolving balance of power between employees and employers. Our conclusion is that management retains the upper hand; it will take more than a pandemic and one friendly administration’s term to turn the tables. Strikes Occur When One Side Overplays Its Hand Chart 1The Strike-Slack Link Has Been Shattered
The Strike-Slack Link Has Been Shattered
The Strike-Slack Link Has Been Shattered
Strikes (and lockouts) occur when labor and management cannot reach a mutually acceptable settlement, often because at least one side overestimates its bargaining power. It is easy to agree when labor and management hold similar views about each side’s relative position, as when both perceive that one of them is considerably stronger. In that case, a settlement favoring the stronger side can be reached quickly, especially if the stronger side exercises some restraint and does not seek to impose terms that the weaker side can scarcely abide. Restraint is rational in repeated games like employer-employee bargaining, especially if the stronger party recognizes that its advantage is not permanent. 40 years of waxing management power, however, may have imbued both sides with a sense that employers have insurmountable structural advantages. Since the early eighties, private sector union membership has withered, taboos against hiring strikebreakers have disappeared, the Federal bench has been filled with judges disposed to see things from management’s perspective, and state legislatures have increasingly weakened union protections to attract businesses. Since the Reagan administration took office, the incidence of major work stoppages (Chart 1, top panel) has ceased to correlate with the state of labor market slack (Chart 1, bottom panel). With the JOLTS, consumer confidence and NFIB surveys indicating that the pandemic has made it as easy as it has ever been to find a job (and extremely difficult to fill one), it is notable that so few unionized employees are playing their trump card of withholding their labor to extract concessions from their employers. Related Report US Investment StrategyLabor Strikes Back, Part 2: Where Strikes Come From And Who Wins Them With the link between labor market tightness and strikes severed, game theory offers the best insight into the origin of strikes. We posit a simple framework in which each side can hold any of five perceptions of its own bargaining power, resulting in a total of 25 possible joint perceptions. Labor (L) can believe it is way stronger than Management (M), L >> M; stronger than Management, L > M; roughly equal, L ≈ M; weaker than Management, L < M; or way weaker than Management, L << M. Management also holds one of these five perceptions, and the interaction of the two sides’ perceptions establishes the path negotiations will follow. Limiting our focus to today’s prevailing conditions, Figure 1 displays only the outcomes consistent with labor’s belief that it has the upper hand. For completeness, the exhibit lists all of management’s potential perceptions, but we deem the three away from the extremes to be most likely. Record job openings and quits rates (Chart 2) should convince even the most cocksure management negotiators that the landscape has tilted at least a little in labor’s favor. On the other hand, four consecutive decades of victories will make it hard for all but the most objective management negotiators to believe that the tables have completely turned. Figure 1Lots Of Room For Disagreement
Wage-Price Spiral? Not So Fast
Wage-Price Spiral? Not So Fast
Chart 2It's A(Labor)Seller's Market...
It's A(Labor)Seller's Market...
It's A(Labor)Seller's Market...
The Availability Of Substitutes Chart 3... And Mothballed Supply Is Coming Back On Line
... And Mothballed Supply Is Coming Back On Line
... And Mothballed Supply Is Coming Back On Line
Ultimately, leverage derives from the availability of substitutes. If employees can easily switch jobs and obtain better terms because employers are actively competing for scarce labor inputs, they should be able to extract concessions simply by threatening to strike. If employers can replace union members with cheaper non-union workers, substitute cheaper foreign labor for domestic labor while meeting less onerous working standards, or invest in automation to reduce the need for human inputs, employees will have little recourse but to accept whatever terms management dictates. The prevailing view is that there are precious few substitutes for domestic labor. The pandemic has exposed global supply chains' inherent vulnerability, forcing businesses to consider onshoring some functions. The labor market is exceedingly tight, as early retirements and the Great Resignation will suppress labor availability into the intermediate term. Quickening increases in labor force participation among those aged 55 to 59 (Chart 3, top panel) and 60 and 64 (Chart 3, bottom panel), however, are casting doubt on the narrative. We additionally expect that younger workers will not be able to hold themselves aloof from the work force indefinitely in the absence of new fiscal transfers. The explosion in nominal wage growth lends credence to the prevailing view (Chart 4). But none of the three main series, average hourly earnings (Chart 5, top panel), the Atlanta Fed wage tracker (Chart 5, middle panel) or the Employment Cost Index (Chart 5, bottom panel) is keeping pace with inflation. A wage-price spiral, as commonly understood, results when wages and consumer prices chase each other higher in something like a game of tag. Average hourly earnings got the game going in 2020, when essential workers received hazard pay for braving infection risks, but they’ve lagged consumer prices ever since. Chart 4Nominal Wages Are Surging ...
Nominal Wages Are Surging ...
Nominal Wages Are Surging ...
Chart 5... But They're Not Keeping Up With Inflation
... But They're Not Keeping Up With Inflation
... But They're Not Keeping Up With Inflation
This Is Not The Sixties And Seventies The wage-price spiral gained momentum when the unemployment rate spent eleven consecutive years (1964 through 1974) below or just barely above the CBO’s estimate of its natural rate (Chart 6, bottom panel). That helped feed consistently positive real wage gains through the seventies whenever the economy was expanding (Chart 6, top panel). Upward price pressures were stoked by profligate government spending (funding the war in Vietnam concurrently with Great Society programs) and a complacent Fed. The pandemic fiscal and monetary backdrop may look uncomfortably familiar, but today’s workers are far less equipped to turn it to its advantage. Chart 6The Wage-Price Spiral Of The Seventies Was A Long Time In The Making
The Wage-Price Spiral Of The Seventies Was A Long Time In The Making
The Wage-Price Spiral Of The Seventies Was A Long Time In The Making
Union membership is way down from the mid-to-late sixties (Chart 7), leaving unions with far fewer resources and much less of a corner on available labor. They also have less public support, less likelihood of benefiting from sympathy strikes or other support from unionized workers elsewhere in the chain and little to no lived experience with striking. They confront better organized and more determined opposition, as business concentration has reduced competition for their services to the point of establishing near-monopsonies in localized labor markets. The only way to confront the monopsony power of very few buyers is to organize a monopoly of suppliers, but private-sector union membership is mired at post-Depression lows despite The New York Times’ and other outlets’ relentless cheerleading. Chart 7It's Hard To Be An Influencer When You're Hemorrhaging Followers
It's Hard To Be An Influencer When You're Hemorrhaging Followers
It's Hard To Be An Influencer When You're Hemorrhaging Followers
I Walked A Picket Line For Four Weeks And All I Got Was This Lousy T-Shirt If workers are to change their fortunes (Chart 8), they need to achieve large-scale victories that win national attention, inspiring other workers to challenge management and laying out a roadmap for their own success. With that in mind, we examined the BLS’ detailed compilation of work stoppages since the beginning of 2020 to see what strikes were able to achieve. If striking reveals that labor truly has the whip hand, employers should accede en masse to employees’ demands, signaling that a broad compensation reset is afoot. Chart 8The Hazard-Pay Pop Was Short Lived
The Hazard-Pay Pop Was Short Lived
The Hazard-Pay Pop Was Short Lived
After backing out graduate student attempts to escape indentured servitude as sub-minimum-wage instructors, we examined the outcomes of the 22 large-scale strikes since 2020 (Table 1). In terms of base wage and salary gains, the results were decidedly underwhelming. Two of the union walkouts produced nothing (Swedish Medical Centers, 2020, and Kaiser Permanente Oakland sympathy strike, 2021) and prospects are not favorable for the United Mine Workers’ strike against Warrior Met Coal (2021) that is entering its fourteenth month. Public workers’ walkouts generally yielded nothing more than compensation increases around the Fed’s 2% annual inflation target. Teachers and front-line healthcare workers touted agreements to reduce class sizes, increase support staffs, formalize hazard pay and stockpile personal protective equipment but they’ve fallen further behind economically. Table 1Large-Scale Pandemic-Era Strikes
Wage-Price Spiral? Not So Fast
Wage-Price Spiral? Not So Fast
Private-sector workers have fared better, though one must often squint to see it. Kellogg’s cereal plant workers hit a home run, gaining cost-of-living adjustments on top of nominal salary increases, better retirement benefits and an accelerated path for new employees to transition to the more remunerative legacy employee tier, all without making a single concession. Seattle’s unionized carpenters also did well for themselves, gaining three 4.5% annual raises and a 50% increase in hourly parking reimbursements (no small matter in a full-to-bursting coastal city). Their fellows got some cash in their pockets via one-time bonuses for ratifying their deals, but whether they’ll be better off on an inflation-adjusted basis by the time they expire is an open question. In reading about the walkouts, negotiations and settlements, we were struck by how long it had been since many of these union locals had walked off the job. Minneapolis teachers last struck in 1970; the last nationwide Kellogg’s strike was in 1972; the UAW hadn’t struck John Deere since 1986; aside from a one-day 2017 walkout, Sacramento teachers hadn’t struck since 1989; and United Steelworkers hadn’t walked out from Allegheny Technologies in 30 years. Perhaps an unfamiliarity with striking among union leadership and rank-and-file made the unions timid and inclined to settle a little sooner than may have been optimal. Perhaps they were starting on the back foot and anchoring to that position, as many of the unions trumpeted that they refused management's concession demands. Workers in this round of negotiations may have been more concerned about working conditions than money and simply wanted to be heard and seen after running the COVID infection gauntlet. There’s no guarantee that will last, but it’s a good sign for corporate margins and municipal budgets in the near term. Management showed little inclination to cede its advantages: hospitals brought in temporary replacements like pricey traveling nurses at a cost far exceeding the raises unions sought, the two-tier compensation system for legacy and newer workers largely remains intact and companies preferred one-time bonuses to salary increases to pacify employees. It’s possible that workers simply lack much leverage; after securing 2% annual raises for 2020 and 2021 that woefully failed to keep pace with inflation, St. Paul teachers agreed to an eleventh-hour deal for 2022-23 that will provide another two years of 2% raises, though they also won $3,000 retention bonuses/recognition awards for their trouble. Looking Ahead When watching future negotiations between employers and unions, we will be looking out for the fate of the two-tier compensation model and the balance between salary/wage increases and one-time bonuses. Two-tier compensation has allowed employers to drive a wedge between senior employees and their successors. The model incents grandfathered employees to ratify deals that preserve their above-market compensation and benefits at the expense of less senior employees. “We can’t afford to pay all of you like UAW workers in the ‘70s and ‘80s, but we want to reward those who’ve demonstrated their loyalty to the company …” (and will disappear by attrition over the next ten years or so, bending our cost curve way down in real terms). We are also watching the mix of base salary and wage increases and bonus payments. We think of the former as akin to a public company’s dividends and the latter to their stock buybacks. Dividend payments (and wages) are sticky on the downside, as companies don’t want to signal financial weakness by cutting them and employees are loath to see their nominal pay decline. Once dividends and base salaries are raised, it’s hard to cut them. Buybacks, on the other hand, are purely discretionary and shareholders don’t count on them year after year. The same goes with bonuses – future base wages and salaries are a rigid function of previous base wages and salaries, but bonus payments are a one-off that don’t get directly factored into ongoing compensation. We thought John Deere’s agreement with the UAW preserved the status quo to management’s benefit. Per the terms of the new six-year contract, workers got splashy odd-year raises of 10%, 5% and 5%, interspersed with even-year bonuses. The compounded annual growth rate of their base pay is therefore 3.3% over the life of the contract [(1.1*1.05*1.05)^(1/6) – 1]. We’d bet the 3.3% growth will yield very close to zero real gains, and it seems like the 8.5% signing bonus workers received for ratifying the contract was a reasonable up-front price for Deere to pay to lock in six years of nearly flat real increases. The company must pay bonuses in years 2, 4 and 6 as well, but that might be a small price to pay to preserve the divide between workers hired before and after 1997. By the time the deal is up, the least senior of the expensive legacy employees will have been punching the clock for 30 years and their numbers will be thinning at a rapid rate. Ruth Milkman, a sociologist of labor and labor movements who has written or collaborated on over a dozen books in her half-century career, was recently asked when she last felt hopeful about workers’ outlook. After laughing, she said, “I remember when Obama was elected and I made a fool of myself predicting a big labor resurgence.”1 In a pattern reminiscent of Lucy pulling the football away from Charlie Brown, labor hopes pinned on the Obama administration failed to be realized. The Biden administration can direct the Department of Justice, Department of Labor, National Labor Relations Board and OSHA to enforce the laws on the books more vigorously, but it can’t write new ones without both houses of Congress and the Senate lacks the president's appetite to do so. “It’s a story of endless disappointments,” according to Milkman, “and it seems like that’s where we are now, too.” We will believe in labor’s renaissance only after we see it. The course of labor negotiations since the pandemic in no way suggests that a wage-price spiral is inevitable, nor that it is probable. Doug Peta, CFA Chief US Investment Strategist dougp@bcaresearch.com Footnotes 1 https://www.nytimes.com/2022/02/17/magazine/unions-amazon.html. Accessed 4/27/22.
Listen to a short summary of this report. Executive Summary Second Fastest Hiking Cycle Ever?
Monthly Portfolio Update: Can The Fed Achieve A Soft Landing? Hint: It Doesn’t Have A Good Track Record
Monthly Portfolio Update: Can The Fed Achieve A Soft Landing? Hint: It Doesn’t Have A Good Track Record
Can the Fed achieve a soft landing, bringing inflation back to its 2% target without causing growth to slow significantly below trend? It has managed this only once in the past (in 2004). Every other cycle triggered a recession or, at best, a fall in the PMI to below 50. Recession is not a certainty. A higher neutral rate than in the past – partly due to the build-up of household savings – means the economy may be unusually robust this time. But the risk is high. We recommend a neutral weighting in equities, with a tilt to more defensive positioning: Overweight the US, and a focus on quality and defensive growth sectors. China’s slowdown is particularly worrying. We expect the RMB to fall, which will put downward pressure on other Emerging Markets.
Monthly Portfolio Update: Can The Fed Achieve A Soft Landing? Hint: It Doesn’t Have A Good Track Record
Monthly Portfolio Update: Can The Fed Achieve A Soft Landing? Hint: It Doesn’t Have A Good Track Record
Bottom Line: Investors should maintain low-risk portfolio positioning until the outcome of the sharp tightening of financial conditions is clearer. Recommended Allocation
Monthly Portfolio Update: Can The Fed Achieve A Soft Landing? Hint: It Doesn’t Have A Good Track Record
Monthly Portfolio Update: Can The Fed Achieve A Soft Landing? Hint: It Doesn’t Have A Good Track Record
The key to the performance of financial markets over the next year is whether the Fed and other central banks can kill inflation without killing economic growth. This is not impossible. But the risk that aggressive tightening of monetary policy triggers a recession – or at best a sharp slowdown – is high. Investors should maintain relatively low-risk portfolio positioning. If the Fed raises rates in line with what the futures market is projecting – by 286 basis points over the next 12 months – it will be the second fastest tightening on record, after only the “full Volcker” of 1980-1981 (Chart 1). Other central banks, even in countries and regions with much weaker growth than the US, are predicted to tighten almost as aggressively (Table 1). At the same time, the Fed will start to run down its balance-sheet rapidly; we estimate its holdings of US Treasurys will fall by more than $1 trillion by end-2023 (Chart 2). What was the impact on the economy of previous Fed hiking cycles? It varied, but on only one occasion in the past 50 years (2004) was there neither a recession nor a fall of the Manufacturing ISM to below 50 in the two years or so following the first hike (Table 2).1 The ISM (and other global PMIs) falling to below 50 is important because that is typically the dividing line between equities outperforming bonds and vice versa (Chart 3). Chart 1Second Fastest Hiking Cycle Ever?
Monthly Portfolio Update: Can The Fed Achieve A Soft Landing? Hint: It Doesn’t Have A Good Track Record
Monthly Portfolio Update: Can The Fed Achieve A Soft Landing? Hint: It Doesn’t Have A Good Track Record
Table 1Futures Projected Interest Rate Hikes
Monthly Portfolio Update: Can The Fed Achieve A Soft Landing? Hint: It Doesn’t Have A Good Track Record
Monthly Portfolio Update: Can The Fed Achieve A Soft Landing? Hint: It Doesn’t Have A Good Track Record
Chart 2Fed Balance-Sheet Will Shrink Rapidly Too
Fed Balance-Sheet Will Shrink Rapidly Too
Fed Balance-Sheet Will Shrink Rapidly Too
Table 2What Happened To The Economy In Fed Hiking Cycles
Monthly Portfolio Update: Can The Fed Achieve A Soft Landing? Hint: It Doesn’t Have A Good Track Record
Monthly Portfolio Update: Can The Fed Achieve A Soft Landing? Hint: It Doesn’t Have A Good Track Record
Chart 3Will PMIs Fall Below 50?
Will PMIs Fall Below 50?
Will PMIs Fall Below 50?
A recent paper by Alex Domash and Larry Summers showed that, since 1955, when US inflation was above 4% and unemployment below 5%, there was a 73% probability of recession over the next four quarters, and 100% over the next eight quarters (Table 3). On each of the three occasions when inflation was above 5% and unemployment below 4% (as is the case now), recession followed within a year. How could the Fed avoid a hard landing? Inflation could come down quickly, which would allow the Fed to ease back on tightening. As consumption switches back to services from durables, and the supply side succeeds in increasing production, the price of manufactured goods could fall (Chart 4). There were signs of this happening already in March, when US durables prices fell by 0.9% month-on-month. The problem, however, is that because of rising energy costs and lockdowns in China, the supply-side response has been delayed. The fall in semiconductor and shipping costs, which we previously argued would happen this year, is not yet clearly coming through (Chart 5). There are also signs of a price-wage spiral, with US wages rising (with a lag) in line with prices (Chart 6). Table 3This Level of Inflation And Unemployment Usually Leads To Recession
Monthly Portfolio Update: Can The Fed Achieve A Soft Landing? Hint: It Doesn’t Have A Good Track Record
Monthly Portfolio Update: Can The Fed Achieve A Soft Landing? Hint: It Doesn’t Have A Good Track Record
Chart 4Can The Price Of Durables Now Fall?
Can The Price Of Durables Now Fall?
Can The Price Of Durables Now Fall?
Chart 5Supply-Side Recovery Delayed?
Supply-Side Recovery Delayed?
Supply-Side Recovery Delayed?
The economy could be more robust than in the past, leaving it unscathed by higher rates. Our model of the equilibrium level of short-term rates is 3.2%, well above the Fed’s estimate of 2.4% (Chart 7). Our colleague Peter Berezin has argued that the neutral rate could be as high as 4%.2 In particular, the $2 trillion-plus of excess US household savings (equal to 10% of GDP) could support consumption for some years even if real wage growth is negative (Chart 8). However, there are already signs that higher rates are hurting the housing market, the most interest-rate sensitive part of the economy. The average US 30-year fixed-rate mortgage rate has risen to 5.1% from 3.2% since the start of the year. This is negatively impacting home sales and mortgage applications (Chart 9). Moreover, even if the Fed can succeed in raising rates without killing the expansion, the markets – for a while – will worry that it cannot. Chart 6A Price-Wage Spiral?
A Price-Wage Spiral?
A Price-Wage Spiral?
Chart 7Rates Are Still A Long Way Below Neutral
Rates Are Still A Long Way Below Neutral
Rates Are Still A Long Way Below Neutral
Chart 8Excess Savings Could Support The Economy
Excess Savings Could Support The Economy
Excess Savings Could Support The Economy
Chart 9Higher Rates Already Impacting Home Sales
Higher Rates Already Impacting Home Sales
Higher Rates Already Impacting Home Sales
There are clear signs of a slowdown in the global economy. Europe may already be in recession, with sentiment indicators collapsing to recessionary levels (Chart 10). More esoteric indicators, which have historically signaled slowing growth ahead, such as the Swedish new orders/inventories ratio, are also flashing a warning signal (Chart 11). Global financial conditions have tightened at the fastest pace since 2008 (Chart 12). Corporate earnings forecasts have started to be revised down for the first time in this cycle (Chart 13). Chart 10Is Europe Already In Recession?
Is Europe Already In Recession?
Is Europe Already In Recession?
Chart 1111. Signs Of Trouble Ahead
11. Signs Of Trouble Ahead
11. Signs Of Trouble Ahead
Chart 12Financial Conditions Have Tightened Significantly
Financial Conditions Have Tightened Significantly
Financial Conditions Have Tightened Significantly
Chart 13Corporate Earnings Forecasts Being Revised Down
Corporate Earnings Forecasts Being Revised Down
Corporate Earnings Forecasts Being Revised Down
But what of the argument that investors have already turned ultra-pessimistic and that all the bad news is in the price? Global equities are down only 14% from their historic peak, barely in correction territory. It is true that sentiment (historically a contrarian indicator) is very poor, with twice as many respondents to the American Association of Individual Investors’ weekly survey expecting the stock market to fall over the next six months as expect it to rise (Chart 14). But, despite investor pessimism, there are few signs that investors have made their portfolios more defensive. The same AAII survey shows little decline in equity weightings, and no big shift into cash (Chart 15). Chart 14Investors Are Very Pessimistic...
Investors Are Very Pessimistic...
Investors Are Very Pessimistic...
Chart 15...But Haven't Moved More Defensive
...But Haven't Moved More Defensive
...But Haven't Moved More Defensive
Equities: The US is the best house on a tough street. Growth is likely to remain more robust than in the euro area or Japan. The US stock market has a lower beta (Chart 16). And, while the US is more expensive, valuations do not drive the 12-month relative performance of stocks and, anyway, the US premium valuation can be justified by higher ROE and the lower volatility of profits (Chart 17). Emerging markets continue to look vulnerable to the slowdown in China and tighter US financial conditions (Chart 18). We remain underweight. Chart 16US Stocks Are Lower Risk
US Stocks Are Lower Risk
US Stocks Are Lower Risk
Chart 17US Premium Valuation Is Justified
Monthly Portfolio Update: Can The Fed Achieve A Soft Landing? Hint: It Doesn’t Have A Good Track Record
Monthly Portfolio Update: Can The Fed Achieve A Soft Landing? Hint: It Doesn’t Have A Good Track Record
Chart 18Tightening Financial Conditions Are Bad For EM
Tightening Financial Conditions Are Bad For EM
Tightening Financial Conditions Are Bad For EM
Chart 19Consumer Staples Are Defensive
Consumer Staples Are Defensive
Consumer Staples Are Defensive
Chart 20IT Earnings Will Continue To Grow Strongly
IT Earnings Will Continue To Grow Strongly
IT Earnings Will Continue To Grow Strongly
Within sectors, our preference remains for quality and defensive growth. Consumer staples tend to outperform when PMIs are falling (Chart 19) and are supported by attractive dividend yields. Information Technology is a more controversial overweight, given that it is expensive and sensitive to rising rates. Nevertheless, investment in tech hardware and software is likely to continue, giving the sector strong structural earnings growth in coming years (Chart 20). Currencies: The dollar has risen by 7.3% year-to-date driven by interest-rate differentials and the Fed being expected to be more aggressive than other central banks. But we are only neutral, since the Fed will probably not raise rates by as much as the market is pricing in, and because the dollar looks very overvalued (Chart 21). We lower our recommendation on the Chinese yuan to underweight. Interest-rate differentials with the US clearly point to it falling further – also the outcome desired by the authorities to help bolster growth (Chart 22). The likely CNY weakness will put further downward pressure on other EM currencies, particularly in Asia, given their high correlation to the Chinese currency (Chart 23). Chart 21The Dollar Is Very Overvalued
The Dollar Is Very Overvalued
The Dollar Is Very Overvalued
Chart 22Rate Differentials Point To A Weaker RMB...
Rate Differentials Point To A Weaker RMB...
Rate Differentials Point To A Weaker RMB...
Chart 23...Which Is Bad News For Other EM Currencies
...Which Is Bad News For Other EM Currencies
...Which Is Bad News For Other EM Currencies
Fixed Income: With the 10-year US Treasury yield at 2.9% and that in Germany at 0.9%, there is a stronger argument for marginally raising weightings in government bonds. We are neutral on government bonds within the (underweight) fixed-income category. Remember, though, that real yields are still negative: -0.1% in the US and -2.1% in Germany. We do not expect long-term rates to rise much over the next 6-9 months, and so remain neutral on duration. The “golden rule of bond investing” says that government bond returns are driven by whether the central bank is more or less hawkish than expected over the next 12 months (Chart 24). We would expect the Fed to be slightly less hawkish than currently forecast. US high-yield bonds offer an attractive yield pick-up – as long as US growth does not collapse. In a way, HY bonds are like defensive equities, given their high correlation with equities but beta only one-third that of equities (Chart 25). Chart 24Will The Fed Be More Or Less Hawkish Than Expected?
Will The Fed Be More Or Less Hawkish Than Expected?
Will The Fed Be More Or Less Hawkish Than Expected?
Chart 25High Yield Bonds Are Like MinVol Equities
High Yield Bonds Are Like MinVol Equities
High Yield Bonds Are Like MinVol Equities
Chart 26Russian Oil Is Going Cheap
Russian Oil Is Going Cheap
Russian Oil Is Going Cheap
Commodities: Oil prices are likely to fall back to around $90 a barrel by year-end, as demand softens and increased supply (from Saudi Arabia, UAE, and North American shale, and maybe from Venezuela and Iran) enters the market. But the risk is to the upside if this extra supply does not emerge. In particular, possible bans on Russian oil and gas into the European Union (or Russia blocking sales) could disturb the market. It will take time for Russia’s 11 million b/d of oil production, which used to go mainly to Europe, to be rerouted to Asia. This is why the Urals benchmark is at a 30% discount to Brent (Chart 26). The long-term story for industrial commodities remains good, but there is downside risk – especially for iron ore and steel – from China’s slowdown (Chart 27). Gold is an obvious hedge against geopolitical risks and high inflation. But over the past 20 years, it has been negatively correlated to real interest rates and the US dollar, suggesting upside is capped. There is a chance, however, that the relationship between rates and gold breaks down, as it did in the 1970s and 1980s (Chart 28). We, therefore, remain neutral on gold, believing that a moderate holding is a good diversifier for portfolios. Chart 27Chinese Slowdown Is Negative For Commodities
Chinese Slowdown Is Negative For Commodities
Chinese Slowdown Is Negative For Commodities
Chart 28Will Gold Start To Behave As It Did Before 1990?
Will Gold Start To Behave As It Did Before 1990?
Will Gold Start To Behave As It Did Before 1990?
Garry Evans, Senior Vice President Global Asset Allocation garry@bcaresearch.com Footnotes 1 In 2015, the ISM was already below 50 when the Fed hiked in December. 2 Please see Global Investment Strategy Report, “Is A Higher Neutral Rate Good Or Bad For Stocks?” dated March 18, 2022. Recommended Asset Allocation Model Portfolio (USD Terms)
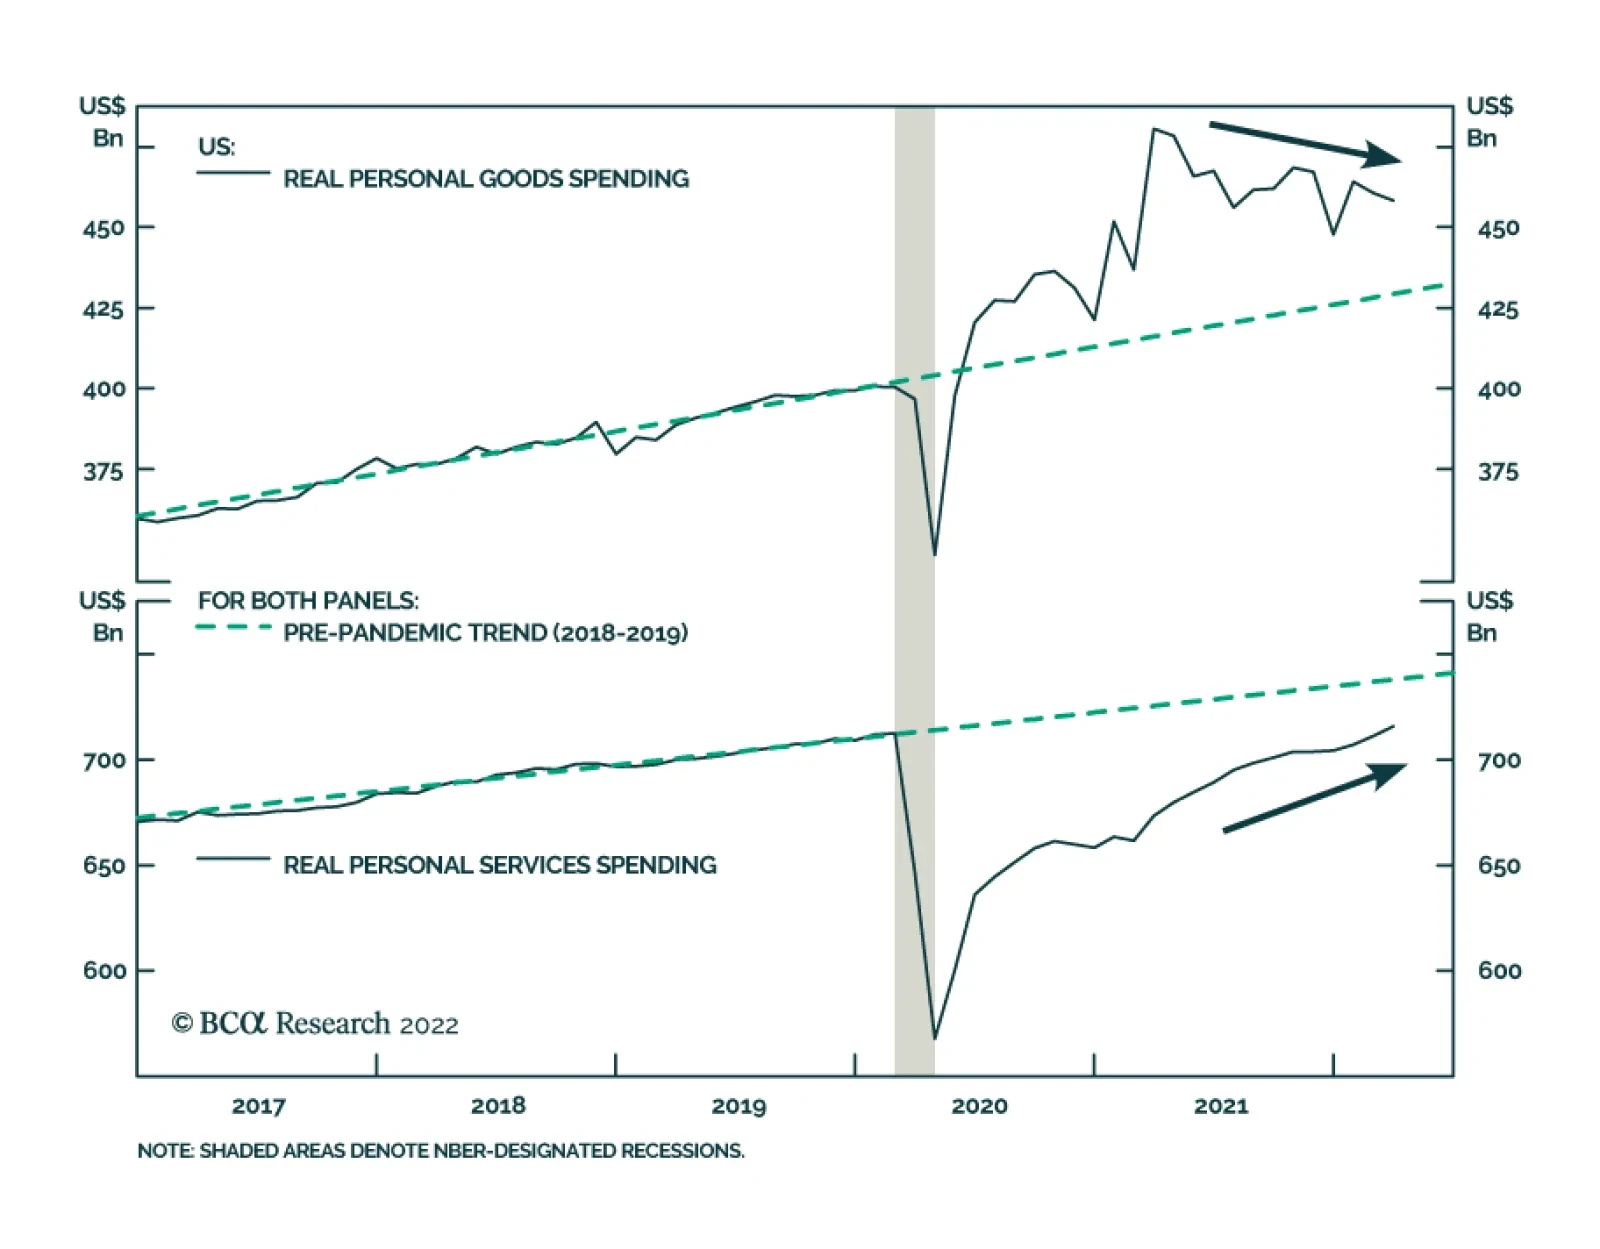
The US Personal Income and Outlays report for March confirms the signal from the Q1 GDP report that consumption continues to support the US economy. Notably, personal spending expanded by 0.2% m/m in real terms, surprising expectations of a 0.1% m/m…