United States
According to BCA Research’s US Bond Strategy service, Agency MBS returns will improve going forward, but the sector is still not sufficiently attractive to increase exposure. Agency Mortgage-Backed Securities (MBS) have performed terribly during the past…
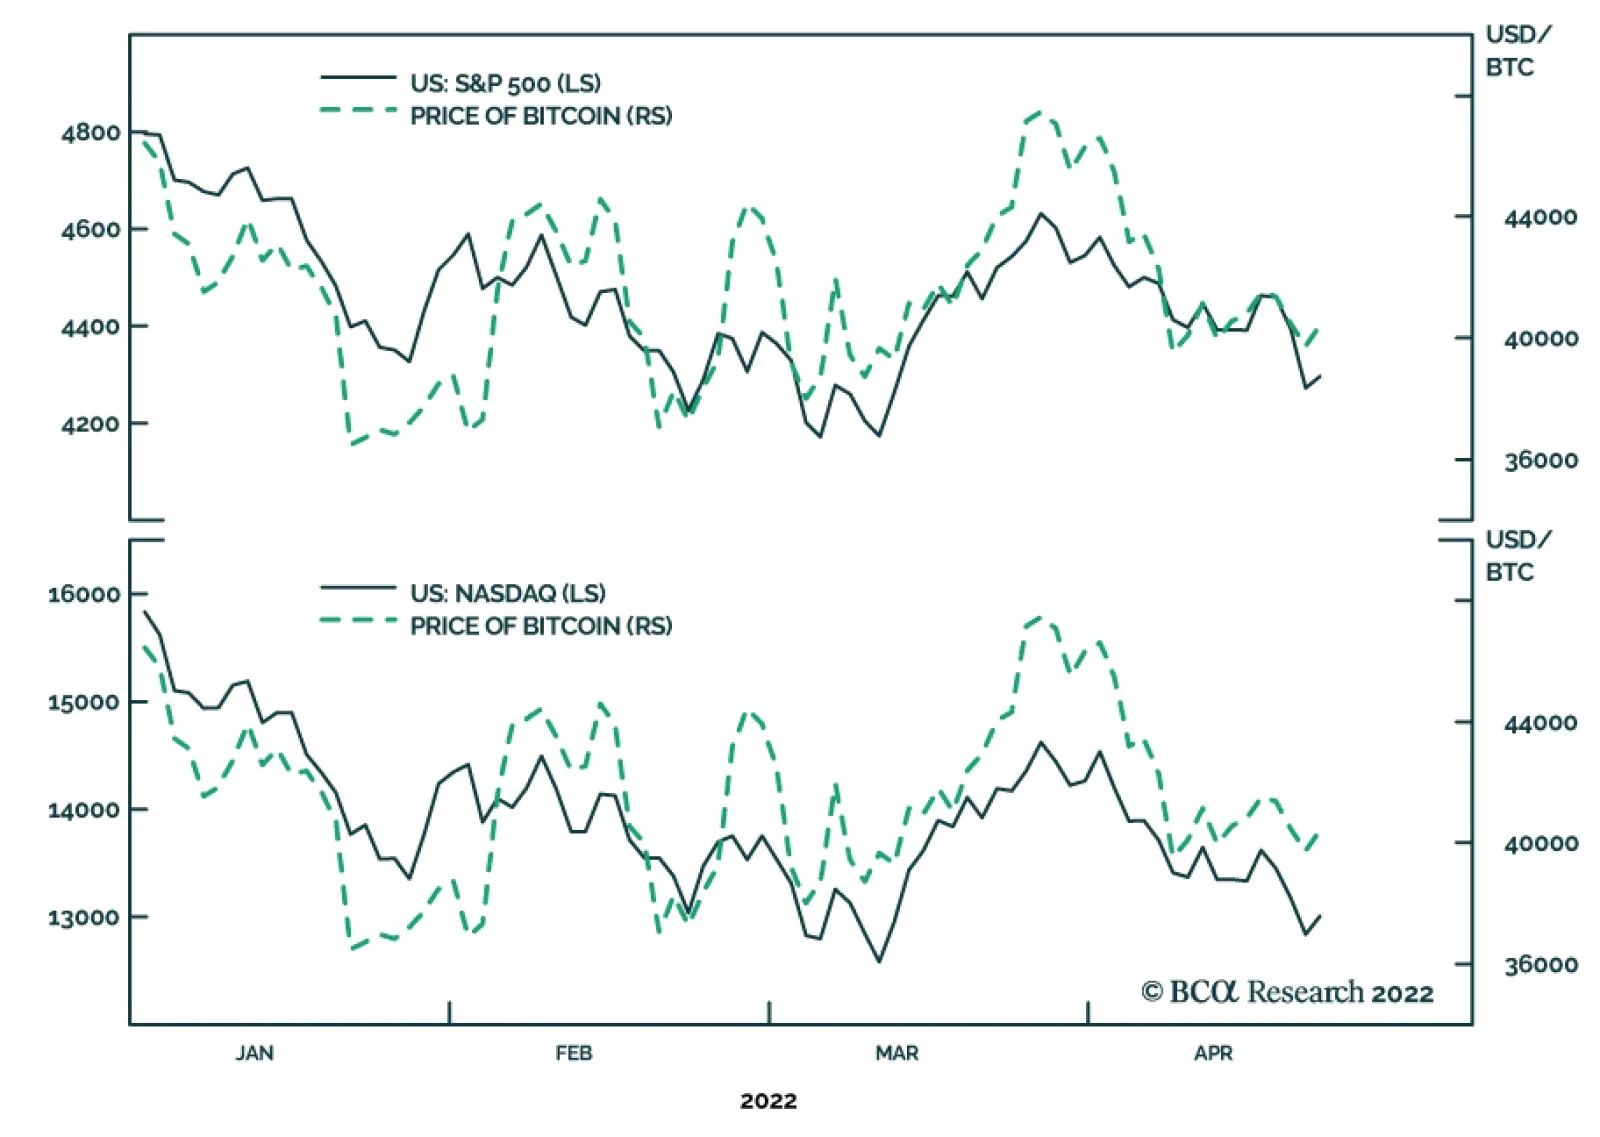
S&P 500 Drops To Near 2022 Low
…
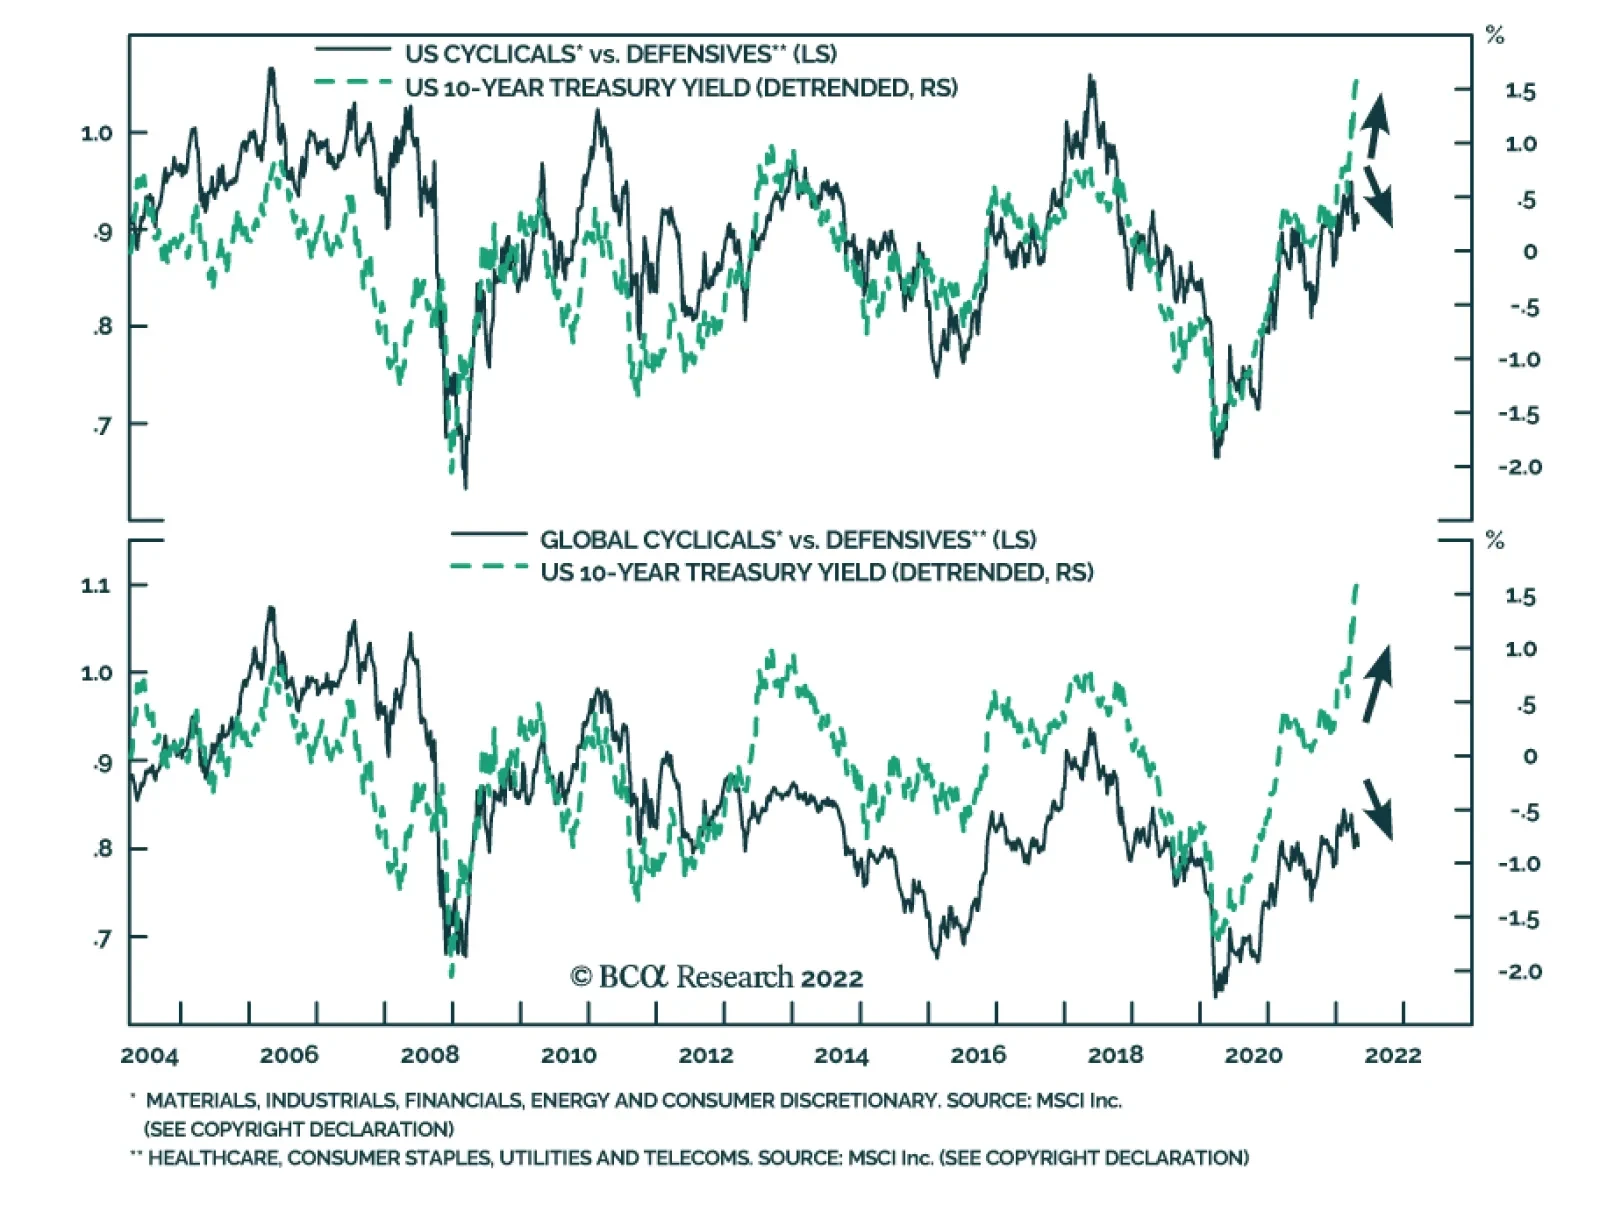
The outperformance of cyclical sectors relative to their defensive peers has historically coincided with periods of rising 10-year Treasury yields. Increasing government bond yields tend to signal an improving growth landscape which benefits the more cyclical…
The Conference Board’s US Consumer Confidence Index inched down to 107.3 in April, short of expectations that it would continue to firm. The present situation component fell to 152.6 from 153.8 while the forward-looking expectations index ticked up to 77.2…

Executive Summary A housing slowdown has begun and it will proceed in three stages. First, rising mortgage rates will lead to slowing demand. Second, weak demand will push inventories higher and cause home prices to decelerate. Finally, construction activity will trend down signaling a peak in the fed funds rate. We are at least one year away from housing signaling a peak in interest rates. Agency MBS returns will improve going forward, but the sector is still not sufficiently attractive to increase exposure. Housing Starts Are A Useful Fed Indicator
Housing Starts Are A Useful Fed Indicator
Housing Starts Are A Useful Fed Indicator
Bottom Line: Maintain an underweight allocation to agency MBS within US bond portfolios and favor low coupons (1.5%-2.5%) over high coupons (3%-4.5%). Feature Chart 1The Highest Mortgage Rate Since 2011
The Highest Mortgage Rate Since 2011
The Highest Mortgage Rate Since 2011
The biggest question for investors continues to be how the economy and financial markets will react to the Federal Reserve’s hawkish pivot, a pivot that has led to sharply higher bond yields and a much flatter yield curve. However, it’s not just this re-shaping of the Treasury curve that has changed the economic landscape. The Fed’s hawkish pivot has also sent the mortgage rate back above 5% for the first time since 2011 (Chart 1). This week’s report considers what an elevated mortgage rate means for the future path of Fed rate hikes. It also updates our view on Agency MBS. Housing Is Critical For Fed Policy Housing is probably the most important channel through which monetary policy impacts the economy. This is simply the result of the fact that monetary policy directly influences mortgage rates and mortgage rates are a major determinant of housing demand. Not only that, but empirical research has shown residential investment to be an excellent leading indicator of recession.1 Related Report Global Fixed Income StrategyGlobal Bond Yields Take A Breather From these facts we can draw two conclusions. First, monetary policy works in large part through its influence on housing activity. Second, trends in housing activity can send important signals about the stance of monetary policy. For example, we observe that periods of Fed tightening tend to occur when the 12-month moving average of housing starts is above the 24-month moving average. Meanwhile, periods of Fed rate cuts tend to occur when the 12-month moving average of housing starts is below the 24-month moving average (Chart 2). This is a fairly reliable relationship going back to the early 1970s, the sole exception being the late-1980s when the Fed delivered a series of rate hikes as housing activity trended down. Chart 2Housing Starts Are A Useful Fed Indicator
Housing Starts Are A Useful Fed Indicator
Housing Starts Are A Useful Fed Indicator
Chart 2 shows us that housing starts are currently trending higher, consistent with a period of Fed tightening. However, it also tells us that we should start to anticipate the end of the tightening cycle when the 12-month moving average of housing starts falls below the 24-month moving average. While the elevated mortgage rate will certainly slow housing activity going forward, we expect that we are still at least one year away from receiving that signal from the housing starts data. A Housing Slowdown In Three Steps We see the coming housing slowdown proceeding in three steps. First, higher mortgage rates will crimp demand. This is already starting to occur. New and existing home sales have both dipped in recent months, and mortgage purchase applications are down off their highs (Chart 3). Chart 3Phase 1: Weaker Demand
Phase 1: Weaker Demand
Phase 1: Weaker Demand
Demand weakness will continue until the housing slowdown reaches its second phase. The second phase will be characterized by rising home inventories and decelerating home prices. This has still not occurred. The total inventory of new and existing homes is near its all-time low and home prices were up 18% during the 12-month period ending in January (Chart 4). The second phase of the housing slowdown is critical because builders will be incentivized to add supply as long as inventories remain low and prices remain elevated. That is, the housing slowdown will not reach its third phase – declining housing starts – until weak demand pushes inventories up and prices down, making new construction less attractive. Presently, while homebuilder equities have sold off as mortgage rates have risen, homebuilder confidence is still extremely high (Chart 5). This tells us that we are still quite far away from seeing a trend reversal in housing starts. Chart 4Phase 2: Falling Prices
Phase 2: Falling Prices
Phase 2: Falling Prices
Chart 5Phase 3: Less Construction
Phase 3: Less Construction
Phase 3: Less Construction
Bottom Line: A trend reversal in housing starts, as indicated by the 12-month moving average dipping below the 24-month moving average, will send a strong signal that the Fed is near the peak of its tightening cycle. Given that the housing slowdown is still in its early stages, we view this development as at least one year away. Agency MBS: The Rout Is Over, But It’s Still Too Soon To Buy Chart 6Poor MBS Performance
Poor MBS Performance
Poor MBS Performance
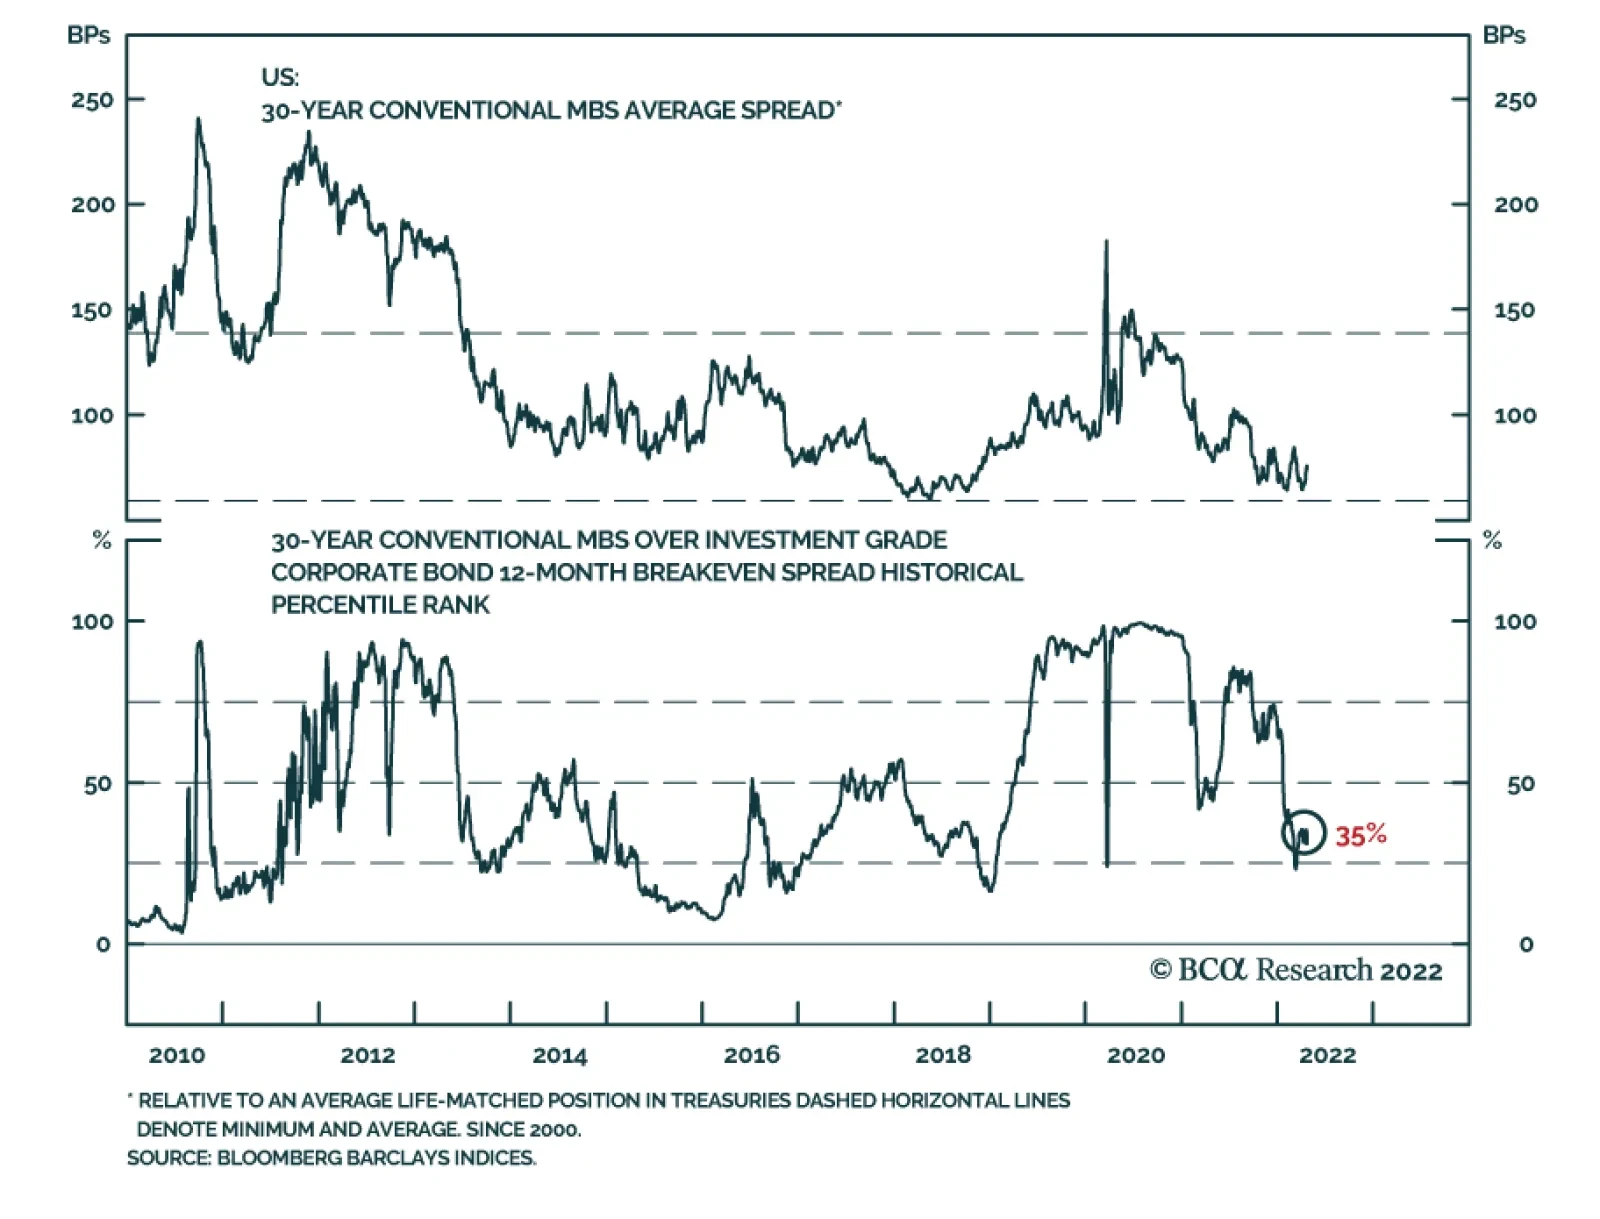
Agency Mortgage-Backed Securities (MBS) have performed terribly during the past year (Chart 6). Not only have the securities drastically underperformed duration-matched Treasuries, but they have also performed worse than investment grade corporate bonds and Agency-backed Commercial Mortgage-Backed Securities. The chief reason for the poor performance has been the surge in bond yields and the resulting increase in Agency MBS duration. It became less attractive for homeowners to prepay their mortgages as mortgage rates rose. This caused MBS duration to extend, meaning that every further increase in yields led to a more severe drop in price. Chart 7 shows that the average duration of the conventional 30-year Agency MBS index was around 3.0 at the beginning of 2021. It is now above 6.0! The good news is that this is probably about as high as the index duration will get. The refi option on most mortgages is already out-of-the-money. That is, close to 0% of the amount outstanding of the conventional 30-year MBS index can profitably refinance with the mortgage rate at its current level (Chart 7, panel 2). We also observe that the average price of the index has fallen to well below par (Chart 7, panel 3) and the average convexity of the index is close to zero (Chart 7, bottom panel). The key point is that there is now very little convexity risk in the MBS index, so further movements in bond yields will lead to much smaller changes in index duration. Low convexity risk means that the worst of the MBS duration extension has already passed. MBS returns should be somewhat better going forward, though we still don’t recommend increasing exposure to the sector. At this juncture, the main reason to stay defensive on Agency MBS is that spreads simply don’t offer sufficient value. The average index spread versus Treasuries is close to its lowest level since 2000 (Chart 8). Interestingly, dramatic MBS underperformance didn’t lead to spread widening during the past year because MBS yields kept getting compared to longer and longer duration Treasuries as the MBS index duration extended. Chart 7The Extension Trade Is Over
The Extension Trade Is Over
The Extension Trade Is Over
Chart 8MBS Spreads Are Too Tight
MBS Spreads Are Too Tight
MBS Spreads Are Too Tight
MBS value is also relatively poor compared to investment grade rated corporate bonds. The option-adjusted spread differential between Agency MBS and investment grade corporates is close to its median since 2000 (Chart 8, panel 2). MBS value looks slightly more expensive if we adjust for index duration by using the 12-month breakeven spread (Chart 8, bottom panel). With value relative to investment grade corporates either at its historical median or slightly more expensive, we don’t see a compelling case for favoring Agency MBS over investment grade corporates. Bottom Line: MBS index duration extension has likely run its course. We therefore expect MBS returns to improve somewhat during the next 6-12 months. That said, we continue to recommend an underweight allocation to the sector as current spreads don’t justify favoring MBS over Treasuries or investment grade corporates. Take A Look At Low Coupons We think investors should consider favoring low coupons (1.5%-2.5%) within an overall underweight allocation to agency MBS. We view this recommendation as a way to position for a drop in Treasury yields between now and the end of the year. In prior reports we noted that long-dated forward Treasury yields are elevated relative to survey estimates of the long-run neutral fed funds rate, and also that we expect inflation to trend down in the coming months.2 While we continue to recommend keeping portfolio duration close to benchmark on a 6-12 month horizon, a low-coupon bias within Agency MBS is a good way to position for the possibility that falling inflation will push bond yields down. To see why, we need to simply consider that low coupon mortgages are the least likely to refinance and thus low-coupon MBS have the highest durations (Chart 9). With convexity currently close to zero for the entire coupon stack (Chart 10), MBS relative coupon positioning can really be boiled down to a play on rates and duration risk. Chart 9Agency MBS 30-Year Conventional Coupon Stack: OAS vs. Duration
The Bond Market Implications Of A 5% Mortgage Rate
The Bond Market Implications Of A 5% Mortgage Rate
Chart 10Agency MBS 30-Year Conventional Coupon Stack: OAS vs. Convexity
The Bond Market Implications Of A 5% Mortgage Rate
The Bond Market Implications Of A 5% Mortgage Rate
A further rise in bond yields will cause higher coupon MBS (3%-4.5%) to outperform lower coupon MBS (1.5%-2.5%), while a drop in bond yields will lead to low-coupon outperformance. Given our current macro outlook, we think it makes sense to bet on the latter. Ryan Swift US Bond Strategist rswift@bcaresearch.com Footnotes 1 https://www.nber.org/papers/w13428 2 Please see US Bond Strategy Weekly Report, “Peak Inflation”, dated April 19, 2022. Recommended Portfolio Specification
The Bond Market Implications Of A 5% Mortgage Rate
The Bond Market Implications Of A 5% Mortgage Rate
Other Recommendations
The Bond Market Implications Of A 5% Mortgage Rate
The Bond Market Implications Of A 5% Mortgage Rate
Treasury Index Returns Spread Product Returns
According to BCA Research’s US Investment Strategy service, the biggest banks’ observations support a rosy near-term outlook – the consumer is firing on all cylinders, businesses are well positioned and there is no credit distress on the horizon. The…
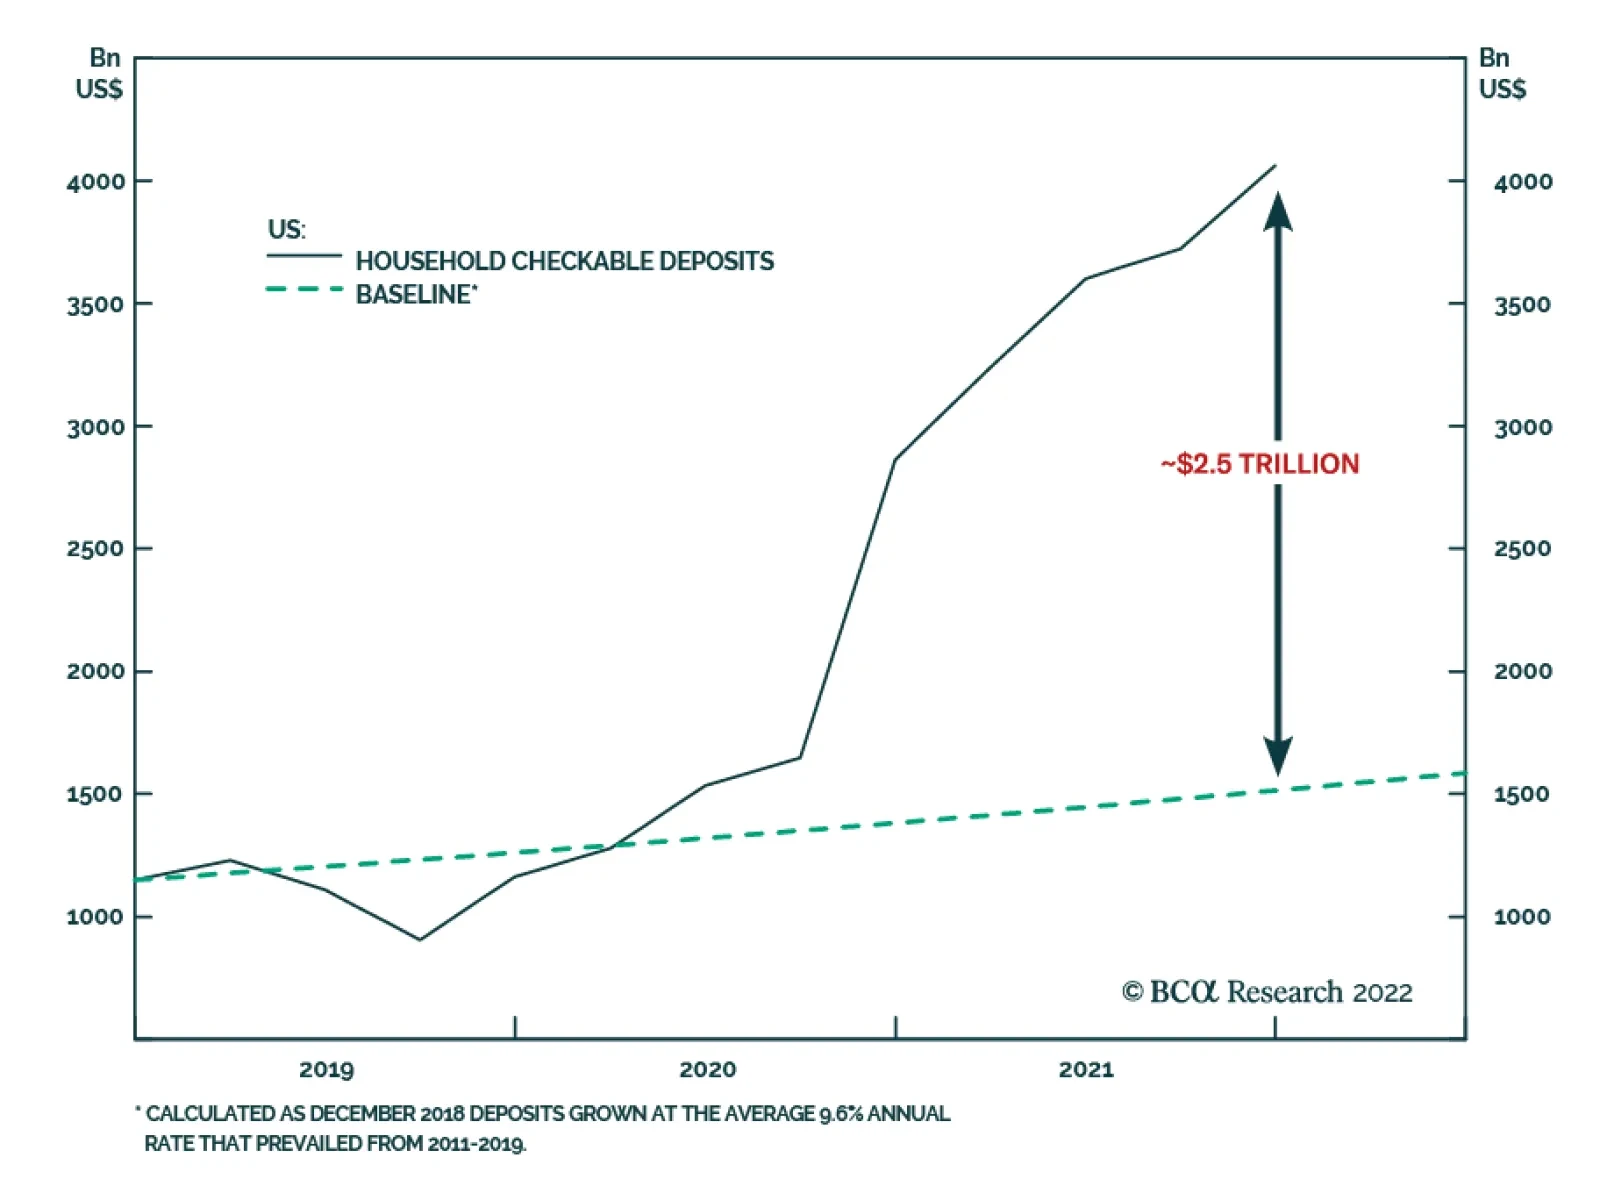
Executive Summary Everything the banks see indicates that their household customers are in fantastic shape, with overstuffed checking accounts and unusually low outstanding credit card balances. Despite low confidence measures, they are spending with vigor, showering revenue on pandemic-squeezed businesses. Inflation in the price of necessities like food and gasoline most harms households at the low end of the wealth and income distributions, but the banks report that they are bearing up remarkably well so far. Credit quality remains exceptionally good and delinquencies and other leading indicators are still flashing the all-clear sign. Growing deposits demonstrate that the world is still awash in liquidity and credit stresses are not at hand, but highlight the challenges the Fed faces in trying to cool the economy. The banks expressed little to no appetite for deploying their idle cash into securities. It appears that another constituency will have to step up to replace the Fed’s QE purchases of Treasuries and agencies. A Blessing And A Curse
A Blessing And A Curse
A Blessing And A Curse
Bottom Line: The biggest banks’ observations support a rosy near-term outlook – the consumer is firing on all cylinders, businesses are well positioned and there is no credit distress on the horizon. The Fed will have its hands full slowing an economy that has so much momentum, however, and there is little chance that volatility will not be elevated over the rest of the year. What The Banks See The SIFI banks (BAC, C, JPM and WFC) and USB kicked off fourth quarter earnings across three days bracketing Easter weekend. Their results were ho-hum – it remains our view that the banks lack a fundamental catalyst to drive relative outperformance – and mainly illustrated that higher interest rates, despite boosting net interest income, are far from the industry cure-all they’re cracked up to be. The SIFIs have languished over the last three months after consistently outperforming the overall market since late 2020, often by wide margins, and now find themselves modestly leading since the first effective COVID vaccines were developed in November 2020 (Chart 1). Chart 1An Incomplete Comeback
An Incomplete Comeback
An Incomplete Comeback
We do not compile the Big Bank Beige Book every quarter to assess the banks’ relative investment merits, however. The S&P 500 Diversified Banks have a uniquely privileged vantage point into activity across the economy and we are simply trying to look over their shoulders. The banks’ earnings releases and analyst calls offer insight into the broad macro backdrop via borrower performance, lender willingness, financial system liquidity and the actions, intentions and financial capabilities of households and businesses. The following is what we heard and how it informs our take on financial markets and the economy. Households Are Still Flush … Related Report US Investment StrategyThe Big Bank Beige Book, January 2022 Bank of America consumers spent at the highest-ever [first quarter] level, … [a] double-digit percentage increase over 2021, … despite the stimulus bonus [boosting the year-ago numbers]. (Moynihan, BAC CEO) [C]ombined credit and debit [card] spend was up 21% year-on-year, with growth stronger in credit as we see a continued pickup in travel and dining. And as the quarter progressed, we saw robust reacceleration of T[ravel] and E[ntertainment] spend, up 64%. (Barnum, JPM CFO) Consumer credit card spend remained strong, up 33% from a year ago. All spending categories were up (Chart 2) with the highest growth in travel, entertainment, fuel and dining. … Discretionary [debit card] spending remained strong with entertainment up 39% and travel up 29% from a year ago. (Scharf, WFC CEO) Chart 2Making Up For Lost Time
Making Up For Lost Time
Making Up For Lost Time
In the first quarter …, credit and debit card travel volumes exceeded pre-pandemic levels. March airline volume was flat compared to March 2019, the first … [monthly] recovery to pre-pandemic levels. Although corporate T&E-related volumes … are still below pre-pandemic levels, they continue their upward trajectory … [and were] 75% of their pre-pandemic level in March. (Dolan, USB CFO) We’re still seeing quite a bit of excess liquidity sitting there in the back pocket of our consumers and very healthy balance sheets (Chart 3). I think [credit card payment rates] have peaked … and I think that’s good, because it should be the return this year to more healthy behavior. The spend is obviously … quite remarkable, … up in the mid-20s%. [It’s] also great to see the experience side, and … services coming back in again. We’ve been seeing it in travel, we’ve been seeing it in apparel. People like getting dressed up to go to dinner again in their [favorite] restaurant. (Fraser, C CEO) Chart 3Up, Up And Away
Up, Up And Away
Up, Up And Away
… Even The Ones In Higher Inflation’s Crosshairs [Today’s] very strong underlying growth will go on. It’s not stoppable. The consumer has money. They pay down credit card debt. Confidence isn’t high, but the fact that they have money, they’re spending their money. They have $2 trillion still in their savings and checking accounts. Businesses are in good shape. Home prices are up. Credit is extraordinarily good. … That’s going to continue in the second quarter, third quarter. After that, it’s hard to predict. (Dimon, JPM CEO) Q: Are you seeing any signs of pullbacks and shifts in the type of [consumer] spend[ing] that could point to some softening there? A1: What we are continuing to see [across the board] … is good, strong, both [in terms of] year-over-year growth and comparisons back to 2019. … I would expect that there’s probably going to be a shift to some extent from … durable goods … to more service-oriented sorts of activities, but in terms of the overall level of spend, I feel like that will continue at least for some period of time. (Dolan, USB) A2: Consumer credit card spend is up 35% versus pre-pandemic. … [W]e’re not seeing any negative trends thus far and it continues to be very strong. (Cecere, USB CEO) March was the eighth straight month in which inflation outpaced income, with lower-income consumers being most impacted by rising energy and food prices. That said, higher deposit balances and rising wages have thus far allowed consumers to weather these headwinds. (Scharf, WFC) Our data show continued growth in average deposit balance[s] across all customer levels … , suggest[ing] … strong spending [can] continue. On an aggregated basis, average deposit balances were up 47% from pre-pandemic levels … and the momentum continued through the first quarter, particularly in the low-balance accounts. [C]ustomers who had $1,000 to $2,000 of balances [pre-pandemic], with an average $1,400 balance … now have $7,400. [T]hose with $2,000 to $5,000 [and a pre-pandemic average of $3,250] today have an average … of $12,500. … Consumers are sitting on lots of cash. (Moynihan, BAC) Q: Are you starting to see any drawdown [of consumer deposits] because of inflation? A: It’s actually the opposite; they grew faster from February to March. That [jump is] probably because of tax refunds, but … beginning around May of last year, they pretty consistently grew 1-2% per month, [with the most growth in] lower-end balances. [The only exception was] November, [when] we saw a slight downdraft in lower-end balances and [then it] picked back up in December. … It grew [every] month this quarter and March had the strongest growth. We haven’t seen the data for April yet, but [deposits are still growing very strongly] all the way up into the people who carried balances of $10,000 – 20,000 pre-pandemic. We’re not seeing that deteriorate at all yet. (Moynihan, BAC) Some Business Loan Demand Is Returning (Chart 4) Chart 4No Thanks For The Loan; We Issued Bonds Instead
No Thanks For The Loan; We Issued Bonds Instead
No Thanks For The Loan; We Issued Bonds Instead
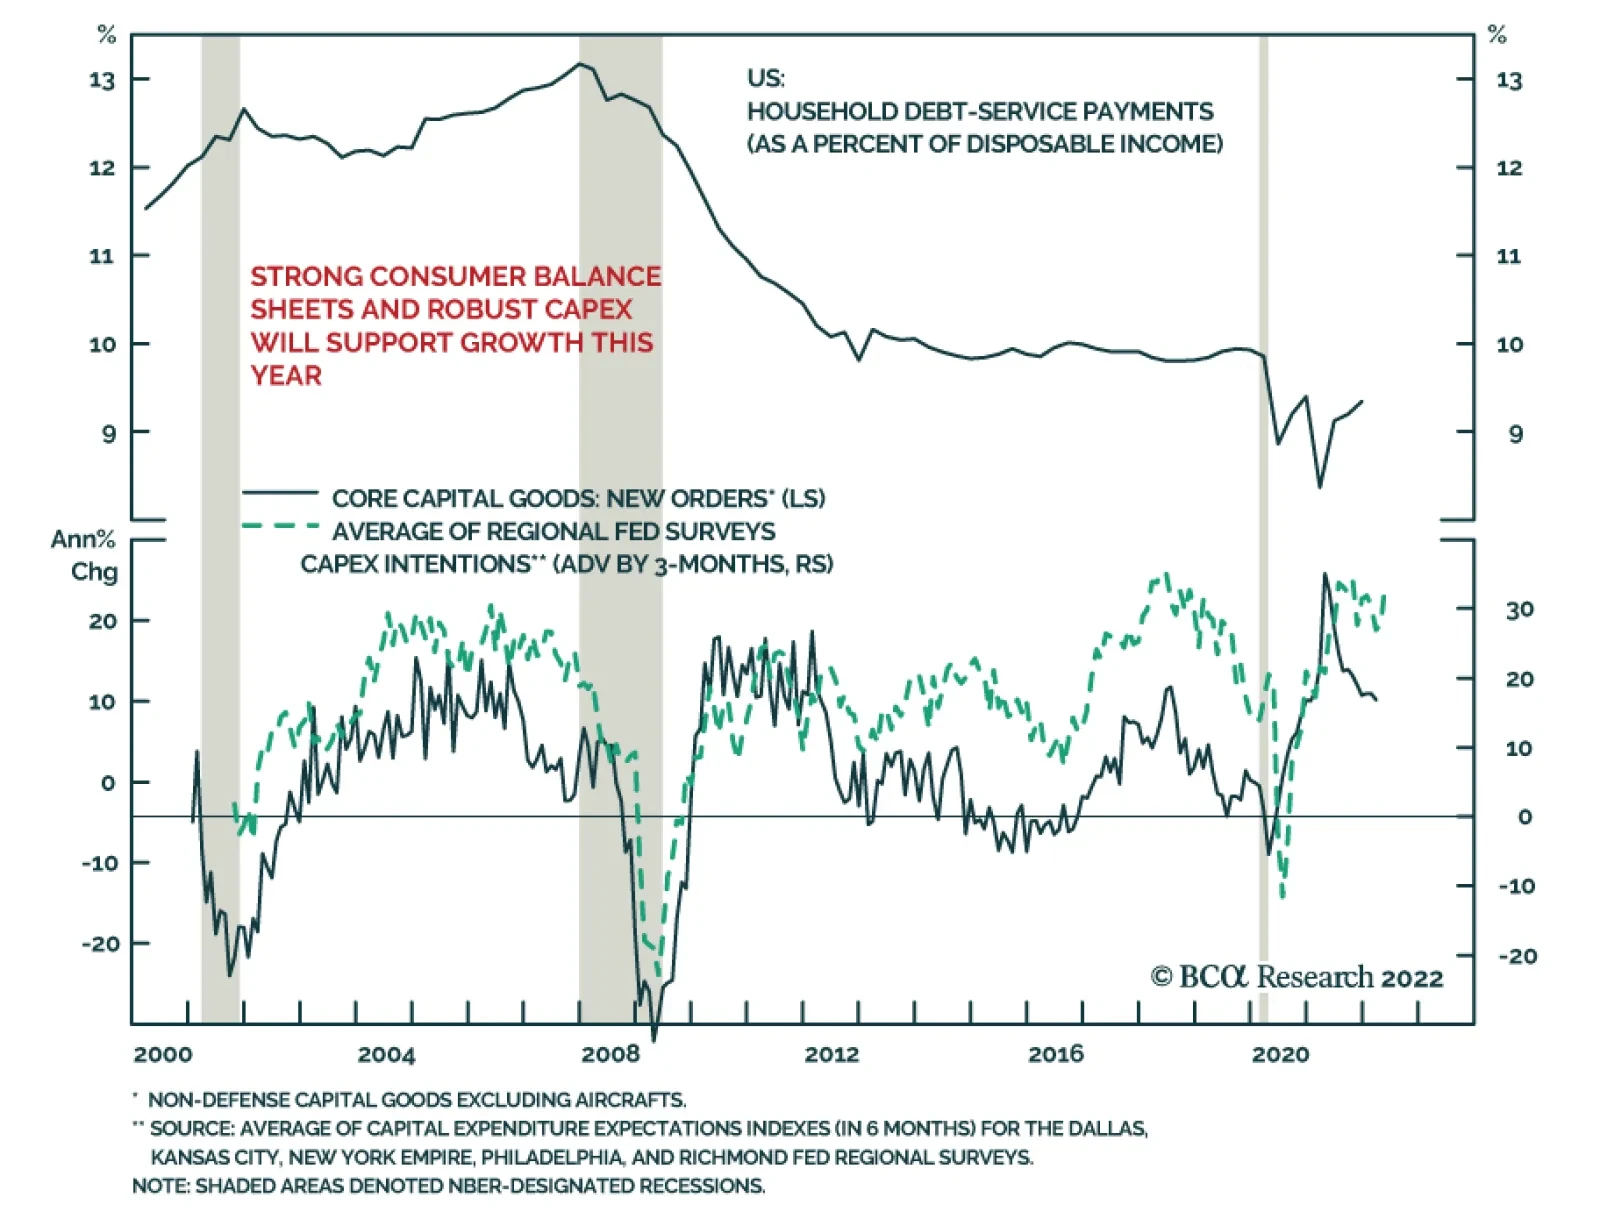
C[ommercial]&I[ndustrial] loans were up 3% sequentially, ex-PPP [Paycheck Protection Plan loans], reflecting higher revolver utilization and originations across middle market and in corporate client banking. (Barnum, JPM) We do see pretty nice loan growth in the commercial bank. There’s a bunch of different factors there, it could be [some pent-up capex,] some inventory effects and so on. (Barnum, JPM) The economy is returning more towards normal and our line utilization is, … too. That’s part of what’s driving our loan growth. Revolver utilization in commercial banking now is 31.7%; pre-pandemic, our normal was around 35%. (Borthwick, BAC CFO) I think that most businesses have been kind of holding back … on capex [over the last couple of years] and so I think there’s a bit of an increase in that spend related to it. And then as companies see more and more inflationary pressure, they’re going to look to automation as a way of offsetting some of the [cost] pressure they see [when they try to hire]. At least in the near term, our expectation is that capex will continue to be reasonably strong. And our utilization rates support that. We’ve been running [around] 19%, plus or minus, for a number of quarters and we saw an increase, certainly not to normal levels, but up to 22-23% in the last few months. (Dolan and Cecere, USB) Revolver utilization rates have increased, but are still well below historical levels. Loan demand has been driven by larger clients who are increasing borrowing due to the impact of inflation on material and transportation costs as well as to support inventory growth. We’re also seeing new demand from some clients who are catching up from underinvestment in projects and capex over the past couple of years. (Santomassimo, WFC CFO) No Credit Warning Signals Yet Q: Are you seeing any stresses in the levered parts of the debt markets, … levered loan, high yield, CLO, private credit? A: Obviously, in this environment, everyone’s looking very closely everywhere for any risks and trying to see around the corner. But as of right now, we’re really not seeing anything of concern in the … spot metrics. (Barnum, JPM) Q: Are there any [household] income buckets where you’re seeing early-stage delinquencies picking up? A: In short, no. It’s an interesting question as you look across our customer base, particularly in card, that heavily debated question of real income growth and gas prices and what’s that doing to consumer balance sheets. And so we’re watching that, especially in the kind of LMI [lower-to-middle-income] segment of our customer base. But right now, we’re not actually seeing anything that gives us reason to worry. (Barnum, JPM) Consumers remain in good shape. … The average card balances of our credit card customers [with whom we have] deposit relationships are 8% lower than they were pre-pandemic. … These [card and deposit] customers have built significant additional savings and their average deposit balances are up 39%. … The small low-FICO-score subset of our customer base was even stronger [in terms of higher] cash balances and lower debt levels. We believe this is not a [BAC-specific] phenomenon, as … debt service levels are hovering near historic lows (Chart 5) and household deposit and cash levels are $3 trillion higher than when we entered the crisis. (Moynihan, BAC) Chart 5Debt Service Is Easy For Households
Debt Service Is Easy For Households
Debt Service Is Easy For Households
We continue to see strong credit performance across our [U.S.] portfolio as clients’ balance sheets remain healthy. (Mason, C CFO) Credit is still exceptionally good, and certainly will be into the next quarter based on everything that we see and possibly beyond (Chart 6), even though at one point [charge-offs] will go up. (Scharf, WFC) Chart 6Consumer Credit Leading Indicators Are Healthy
The Big Bank Beige Book, April 2022
The Big Bank Beige Book, April 2022
Credit quality remains strong. Over the next few quarters, we expect the net charge-off ratio will remain lower than historical levels, but continue to normalize over time. (Dolan, USB) The Banks Aren’t Eager To Buy Securities Deposits continued to grow in the first quarter and despite a pickup in loan growth, the largest banks continue to hold a great deal of cash (Chart 7). The sharp rise in interest rates affords them an opportunity to put that cash to work, potentially driving a big increase in net interest income (NII). Every bank that raised its NII guidance, however, stated that the increased guidance was independent of any growth in the aggregate size of its loan and securities portfolios. The banks’ priority is to lend to household and business customers (Chart 8) and if demand for loans continues to rise, their commentary implied that securities holdings may well shrink. Chart 7Demand For Loans Is Still Lagging ...
Demand For Loans Is Still Lagging ...
Demand For Loans Is Still Lagging ...
Chart 8... Banks' Willingness To Make Them
... Banks' Willingness To Make Them
... Banks' Willingness To Make Them
Q: Any appetite to deploy the excess liquidity? A: No, don’t expect that. (Dimon, JPM) Guys, we were just talking about interest rates going up maybe more than 3%. Convexity is going up. [Mark-to-market loss on available-for-sale securities] is going up. There are all these various reasons not to [move cash into securities]. We’re not going to do it just to give you a little bit more NII next quarter. (Dimon, JPM) When it comes to deploying liquidity, it’s going to be loans first. … And then based on what we see there, we will decide if we’re going to grow the securities portfolio. (Santomassimo, WFC) At the end of the day, the reason why we have securities investments is because we have $2 trillion of deposits and $1 trillion of loans, and we got to do something with the money. (Moynihan, BAC) We’re not interest rate traders, we’re interest rate managers through a cycle. (Borthwick, BAC) What Ails The Banks’ Stocks? We did not join the chorus of investors and strategists at the beginning of the year who were singing the praises of bank stocks in a rising rate environment. We loved the SIFIs back in 2020 when they built up enormous loan-loss reserves in the first two quarters of the pandemic because we believed they would not be needed given monetary and fiscal efforts to shield the economy from COVID disruptions. Those reserves were eventually released back into earnings, pumping the banks' per-share book values above expectations, but once the truing up of actual versus expected credit losses was complete, the stocks had no apparent outperformance catalyst. Rising rates didn’t do much to entice us because we believe investors dramatically overestimate banks’ earnings sensitivity to interest rates and the slope of the yield curve. Higher rates help boost net interest income, but they are not an unmitigated positive, as first-quarter results and management commentary indicated. Every bank suffered hits to its accumulated other comprehensive income (AOCI) from the decrease in the value of the securities it holds in the available-for-sale bucket. AOCI is not an income statement item, but it does reduce equity and thereby undermines the banks’ regulatory capital positions and makes regulatory constraints more binding. Rising rates also entice depositors to shift some money away from banks and raise the cost of retaining deposits and every call featured analyst questions about the sensitivity of bank deposit pricing to changes in interest rates (deposit betas). Rising rates might also lead to pressure on non-interest income, which is nearly equal to the SIFIs' net interest income. As WFC CEO Charlie Scharf put it, “The mortgage origination market experienced one of its largest quarterly declines that I can remember, and it will take time for the industry to reduce excess capacity.” Volumes will fall as that capacity is reduced and so will gain-on-sale margins as the banks shed their remaining inventory. The bottom line is that somewhat higher rates are a net positive but much higher rates will be a drag on bank earnings, just as they will on the overall economy, and investors right now seem to be skipping to the end of the rate hike story and ignoring the benign chapters along the way. Finally, it appears that the extraordinary volume of bond issuance over the last two years displaced some of the need for C&I loans. Given that any CFO or corporate treasurer who didn’t term out company debt in 2020-21 ought to have his or her head examined, the shortfall in credit line utilization and sharply below trend C&I loans outstanding may extend well into the intermediate term. Investment Implications The banks’ calls reinforced our take that the economy has a lot of momentum in the form of flush consumers and amply funded businesses. Credit performance is tremendously strong and net charge-off rates will remain subdued for the foreseeable future. Low delinquency rates will not suddenly spike when business and consumer deposit balances are extremely high and still growing. The Fed’s response to uncomfortably high inflation was a shadow looming over all the calls, just as it was over equities at the end of last week, but it will take a steady diet of rate hikes to rein in a galloping economy. While there is no shortage of concerns, our view remains that they will not be realized in 2022 and that it is therefore too soon to take evasive action in individual portfolios or at the broad asset allocation level. We still recommend that investors with a six-to-twelve-month timeframe remain at least equal weight equities in a multi-asset portfolio, though we are more confident about the next six months than we are about the next twelve and believe it is appropriate to manage portfolios more tactically. We wholeheartedly agree with JPM CEO Jamie Dimon’s assessment and think investors would do well to try to manage in accordance with it. I cannot foresee any scenario at all where you’re not going to have a lot of volatility in markets going forward. We’ve … spoken about the enormous strength of the economy, QT, inflation, war, commodity prices – there’s almost no chance that you won’t have volatile markets … and I think people should be prepared for that. Doug Peta, CFA Chief US Investment Strategist dougp@bcaresearch.com
Listen to a short summary of this report. Executive Summary Small Caps Are Looking Attractive Relative To Their Large Cap Peers
Small Caps Are Looking Attractive Relative To Their Large Cap Peers
Small Caps Are Looking Attractive Relative To Their Large Cap Peers
Adverse supply shocks have pushed down global growth this year, while pushing up inflation. With the war raging in Ukraine and China trying to contain a major Covid outbreak, these supply shocks are likely to persist for the next few months. Things should improve in the second half of the year. Inflation will come down rapidly, probably even more than what markets are discounting. Global growth will reaccelerate as pandemic headwinds abate. The return of Goldilocks will allow the Fed and other central banks to temper their hawkish rhetoric, helping to support equity prices while restraining bond yields. Unfortunately, this benign environment will sow the seeds of its own demise. Falling inflation during the remainder of the year will lift real incomes, leading to increased consumer spending. Inflation will pick up towards the end of 2023, forcing central banks to turn hawkish again. Trade Inception Level Initiation Date Stop Loss Long iShares Core S&P Small Cap ETF (IJR) / SPDR S&P 500 ETF (SPY) 100 Apr 21/2022 -5% Trade Recommendation: Go long US small caps vs. large caps via the iShares Core S&P Small-Cap ETF (IJR) and the SPDR S&P 500 ETF (SPY). Bottom Line: Global equities are heading towards a “last hurrah” starting in the second half of this year. Stay overweight stocks on a 12-month horizon. Push or Pull? Economists like to distinguish between “demand-pull” and “cost-push” inflation. The former occurs in response to positive demand shocks while the latter reflects negative supply shocks. In order to tell one from the other, it is useful to look at real wages. When real wages are rising briskly, households tend to spend more, leading to demand-pull inflation. In contrast, when wages fail to keep up with rising prices, it is a good bet that we have cost-push inflation on our hands. Chart 1 shows that real wages have been falling across the major economies over the past year. The decline in real wages has coincided with a steep drop in consumer confidence (Chart 2). This points to cost-push forces as the main culprits behind today’s high inflation rates. Chart 1Real Wages Are Declining
Real Wages Are Declining
Real Wages Are Declining
Chart 2Consumer Confidence Has Soured
Consumer Confidence Has Soured
Consumer Confidence Has Soured
A close look at the breakdown of recent inflation figures supports this conclusion. The US headline CPI rose by 8.5% year-over-year in March. The bulk of the inflation occurred in supply-constrained categories such as food, energy, and vehicles (Chart 3). Chart 3The Acceleration In Inflation Has Been Driven By Pandemic And War-Impacted Categories
Here Comes Goldilocks
Here Comes Goldilocks
The Toilet Paper Economy When the pandemic began, shoppers rushed out to buy essential household supplies including, most famously, toilet paper. Chart 4In A Break From The Past, Goods Prices Soared During The Pandemic
In A Break From The Past, Goods Prices Soared During The Pandemic
In A Break From The Past, Goods Prices Soared During The Pandemic
The toilet paper used in offices is somewhat different than the sort used at home. So, to some extent, work-from-home (and do other stuff-at-home) arrangements did boost the demand for consumer-grade toilet paper. However, a much more important factor was household psychology. People scrambled to buy toilet paper because others were doing the same. As often occurs in prisoner-dilemma games, society moved from one Nash equilibrium – where everyone was content with the amount of toilet paper they had – to another equilibrium where they wanted to hold much more paper than they previously did. What has gone largely unnoticed is that the toilet paper fiasco was replicated across much of the global supply chain. Worried that they would not have enough intermediate goods on hand to maintain operations, firms began to hoard inputs. Retailers, anxious at the prospect of barren shelves, put in bigger purchase orders than they normally would have. All this happened at a time when demand was shifting from services to goods, and the pandemic was disrupting normal goods production. No wonder the prices of goods – especially durable goods — jumped (Chart 4). Peak Inflation? The war in Ukraine could continue to generate supply disruptions over the coming months. The Covid outbreak in China could also play havoc with the global supply chain. While the number of Chinese Covid cases has dipped in recent days, Chart 5 highlights that 27 out of 31 mainland Chinese provinces are still reporting new cases, up from 14 provinces in the beginning of February. The number of ships stuck outside of Shanghai has soared (Chart 6). Chart 527 Out Of 31 Chinese Provinces Are Reporting New Cases, Up From 14 Provinces In The Beginning Of February
Here Comes Goldilocks
Here Comes Goldilocks
Chart 6The Clogged-Up Port Of Shanghai
Here Comes Goldilocks
Here Comes Goldilocks
Chart 7Inflation Will Decelerate This Year Thanks To Base Effects
Inflation Will Decelerate This Year Thanks To Base Effects
Inflation Will Decelerate This Year Thanks To Base Effects
Nevertheless, the peak in inflation has probably been reached in the US. For one thing, base effects will push down year-over-year inflation (Chart 7). Monthly core CPI growth rates were 0.86% in April, 0.75% in May, and 0.80% in June of 2021. These exceptionally high prints will fall out of the 12-month average during the next few months. More importantly, goods inflation will abate as spending shifts back toward services. Chart 8 shows that spending on goods remains well above the pre-pandemic trend in the US, while spending on services remains well below. Excluding autos, US retail inventories are about 5% above their pre-pandemic trend (Chart 9). Core goods prices fell in March for the first time since February 2021. Fewer pandemic-related disruptions, and hopefully a stabilization in the situation in Ukraine, could set the stage for sharply lower inflation and a revival in global growth in the second half of this year. How long will this Goldilocks environment last? Our guess is that it will endure until the second half of next year, but probably not much beyond then. As inflation comes down over the coming months, real income growth will rise. What began as cost-push inflation will morph into demand-pull inflation by the end of 2023. The Fed will need to resume hiking at that point, potentially bringing rates to over 4% in 2024. Chart 8Spending On Services Remains Well Below The Pre-Pandemic Trend, While Spending On Goods Is Above It
Spending On Services Remains Well Below The Pre-Pandemic Trend, While Spending On Goods Is Above It
Spending On Services Remains Well Below The Pre-Pandemic Trend, While Spending On Goods Is Above It
Chart 9Shelves Are Well Stocked In The US
Shelves Are Well Stocked In The US
Shelves Are Well Stocked In The US
Investment Implications Wayne Gretzky famously said that he always tries to skate to where the puck is going to be, not where it has been. Macro investors should follow the same strategy: Ask what the global economy will look like in six months and invest accordingly. The past few months have been tough for the global economy and financial markets. Last week, bullish sentiment fell to the lowest level in 30 years in the American Association of Individual Investors poll (Chart 10). Global growth optimism dropped in April to a record low in the BofA Merrill Lynch Fund Manager Survey. Chart 10AAII Survey: Equity Bulls Are In Short Supply
AAII Survey: Equity Bulls Are In Short Supply
AAII Survey: Equity Bulls Are In Short Supply
Chart 11The Equity Risk Premium Remains Elevated
The Equity Risk Premium Remains Elevated
The Equity Risk Premium Remains Elevated
Yet, a Goldilocks environment of falling inflation and supply-side led growth awaits in the second half of the year. Even if this environment does not last beyond the end of 2023, it could provide a “last hurrah” for global equities. Despite the spike in bond yields, the earnings yield on stocks still exceeds the real bond yield by 5.4 percentage points in the US, and by 7.8 points outside the US (Chart 11). TINA’s siren song may have faded but it is far from silent. Global equities have about 10%-to-15% upside from current levels over a 12-month horizon. We recommend that investors increase allocations to non-US stock markets, value stocks, and small caps over the coming months (see trade recommendation below). Consistent with our view that the neutral rate of interest is higher than widely believed in the US and elsewhere, we expect the 10-year Treasury yield to eventually rise to around 4% in 2024. However, with US inflation likely to trend lower in the second half of this year, we do not expect much upside for yields over a 12-month horizon. If anything, the fact that bond sentiment in the latest BofA Merrill Lynch survey was the most bearish in 20 years suggests that the near-term risk to yields is to the downside. Trade Idea: Go Long US Small Caps Versus Large Caps Small caps have struggled of late. Over the past 12 months, the S&P 600 small cap index has declined 3%, even as the S&P has managed to claw out a 5% gain. At this point, small caps are starting to look relatively cheap (Chart 12). The S&P 600 is trading at 14-times forward earnings compared to 19-times for the S&P 500. Notably, analysts expect small cap earnings to rise more over the next 12 months, as well as over the long term, than for large caps. Chart 12Small Caps Are Looking Attractive Relative To Their Large Cap Peers
Small Caps Are Looking Attractive Relative To Their Large Cap Peers
Small Caps Are Looking Attractive Relative To Their Large Cap Peers
Chart 13Small Caps Tend To Outperform When Growth Is Picking Up And The Dollar Is Depreciating
Small Caps Tend To Outperform When Growth Is Picking Up And The Dollar Is Depreciating
Small Caps Tend To Outperform When Growth Is Picking Up And The Dollar Is Depreciating
Small caps tend to perform best in settings where growth is accelerating and the US dollar is weakening (Chart 13). Economic growth should benefit from a supply-side boost later this year as pandemic headwinds fade and more low-skilled workers rejoin the labor market. With inflation set to decline, the need for the Fed to generate hawkish surprises will temporarily subside, putting downward pressure on the dollar. Investors should consider going long the S&P 600 via the iShares Core S&P Small-Cap ETF (IJR) versus the S&P 500 via the SPDR S&P 500 ETF (SPY). Peter Berezin Chief Global Strategist peterb@bcaresearch.com Follow me on LinkedIn Twitter Global Investment Strategy View Matrix
Here Comes Goldilocks
Here Comes Goldilocks
Special Trade Recommendations Current MacroQuant Model Scores
Here Comes Goldilocks
Here Comes Goldilocks
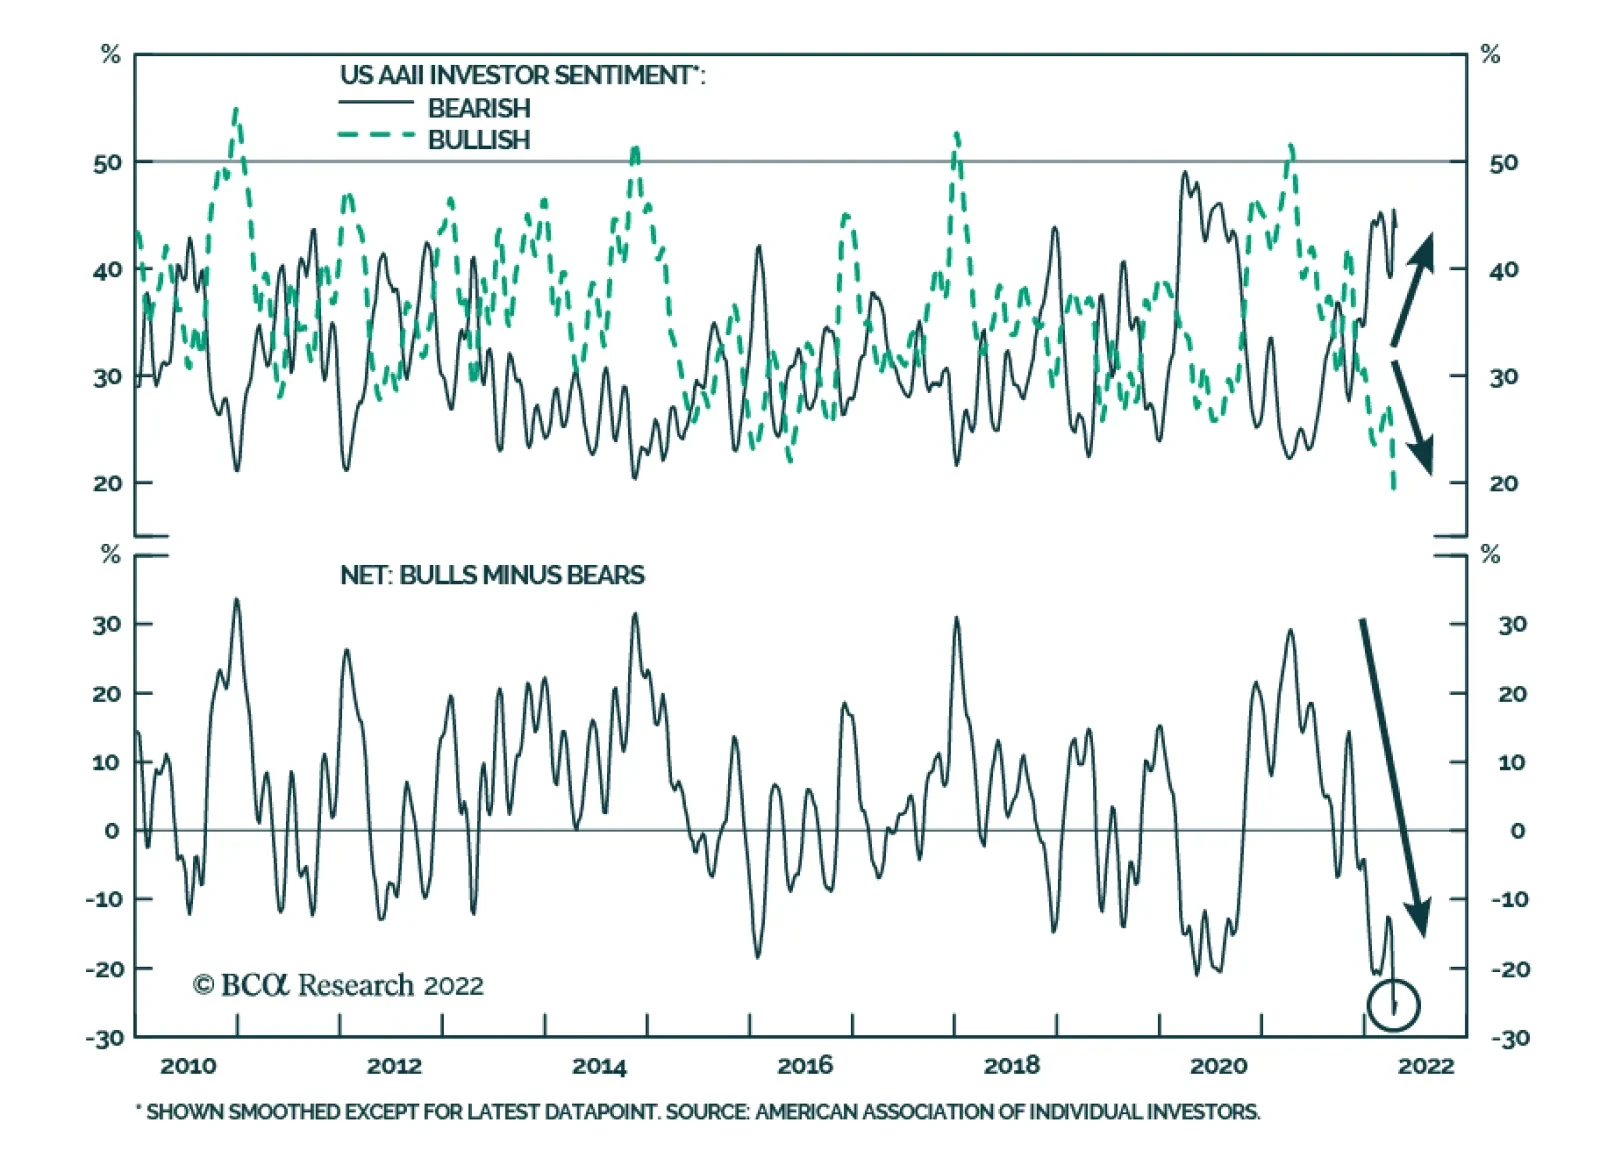
Investor sentiment has deteriorated sharply over the past few months. In last week’s AAII survey, the share of respondents with a bullish outlook dropped to the lowest since September 1992 before rebounding slightly in this week’s survey. At 43.9%, the share…
The Fed’s Beige Book signaled a relatively robust outlook for economic conditions. Economic activity was reported to have expanded at a “moderate” pace, which is an improvement from the March assessment of a “modest to moderate pace.” Moreover, the report…