United States

Executive Summary After having overspent on goods ex-autos over the past two years and experiencing contracting incomes in real terms, US and European households will reduce their purchases of goods ex-autos. Risks to global growth stemming from China remain to the downside. Leading indicators from Asia and global financial markets are signaling a contraction in global trade. Yet, US core inflation will not drop below 4% for the rest of this year. Consequently, the Fed will likely end up hiking rates and sounding hawkish amidst a major global trade slump. This will give rise to stagflation anxiety among investors and will be negative for global risk assets in general and EM equities, currencies and credit markets in particular. The yuan is breaking down versus the US dollar. A weaker RMB will pull down Emerging Asian as well as other EM currencies. Does This Divergence From A Historic Correlation Signify Stagflation?
Does This Divergence From A Historic Correlation Signify Stagflation?
Does This Divergence From A Historic Correlation Signify Stagflation?
Bottom Line: Global equity and credit portfolios should remain defensive and continue underweighting EM. Currency investors should be positioned for another upleg in the US dollar and a downleg in EM currencies. Feature The volume of global trade is about to contract. Meantime, US inflation will remain well above the Fed’s target. This combination will produce stagflation anxiety among investors. It is impossible to know whether stagflation will be a long-lasting phenomenon in the real economy. In our view, the stagflation narrative will dominate global financial markets in the coming months. This heralds a cautious stance on global and EM risk assets. The slowdown in global manufacturing and trade will be pervasive and broad-based but will exclude auto production. The latter will in fact recover as chip/input shortages ease. The main drivers of the slowdown are (1) a mean reversion in US and European demand for goods ex-autos; (2) China’s economic woes and (3) moribund domestic demand in mainstream EM. Shrinking DM Household Demand For Goods ex-Autos Chart 1DM Household Demand For Goods ex-Autos Will Experience Mean Reversion
DM Household Demand For Goods ex-Autos Will Experience Mean Reversion
DM Household Demand For Goods ex-Autos Will Experience Mean Reversion
After having overspent on goods ex-autos over the past two years and experiencing contracting income in real terms (after adjusting for inflation), US and European households will reduce their purchases of goods ex-autos. US and European consumption of goods ex-autos exploded at the onset of the pandemic two years ago and has stayed robust until now. Chart 1 illustrates that since mid-2020, the consumption of goods ex-autos was running well above its trend, which signifies excessive demand over the past two years. Such excessive demand has led to bottlenecks and shortages, giving producers an opportunity to hike prices. In a nutshell, inflation in tradable goods in the past 18 months was primarily driven by demand, not supply constraints. A portion of future goods consumption has been pulled forward, which implies that household demand for these goods has become saturated. Moreover, as the pandemic subsides, consumers are shifting their spending from goods to services. These dynamics could create an air pocket in the demand for certain goods. Chart 2DM Household Real Incomes Are Contracting
DM Household Real Incomes Are Contracting
DM Household Real Incomes Are Contracting
Critically, US and European household income is contracting in real terms (Chart 2). Wage growth has not kept up with the surge in inflation. Due to shrinking disposable real income, consumers in advanced economies will curtail their consumption of discretionary items, primarily goods ex autos on which they have overspent during the past two years. Bottom Line: Demand for goods ex-autos will shrink in advanced economies in the next 6-12 months. This will weigh on global merchandise trade. China’s Trilemma Chinese authorities are facing an “impossible trinity” in their attempts to simultaneously achieve three objectives: (1) pursuing the dynamic zero-Covid policy, (2) delivering decent economic growth, and (3) not resorting to “irrigation-style” massive stimulus. We do not think all three objectives can be achieved. China’s economy was struggling prior to the recent lockdowns. The COVID-related restrictions have only made matters worse and have weighed heavily on economic activities and household income. Domestic orders for industrial enterprises plunged below 50, i.e., they are in contraction territory (Chart 3). These surveys, released on March 30-31, were not affected by the Shanghai lockdowns, which have proliferated since March 28. Exports orders are also contracting (Chart 4). Chart 3China: Domestic Orders Were Plunging Prior To Lockdowns
China: Domestic Orders Were Plunging Prior To Lockdowns
China: Domestic Orders Were Plunging Prior To Lockdowns
Chart 4China: Exports Are Set To Contract
China: Exports Are Set To Contract
China: Exports Are Set To Contract
Further, China’s import and export volumes were contracting in January – prior to the Ukraine war and the recent lockdowns. Notably, Chart 5 highlights that prior to the recent lockdowns, import weakness was broad-based, including commodities, machinery and semiconductors. In particular, total imports in USD are flat in March compared to a year ago. With commodity prices up significantly, it is clear that import volumes in March have shrunken substantially. National disposable income per capita was growing at about 6% in nominal terms before the lockdowns (Chart 6, top panel). Household mortgage growth had decelerated considerably before lockdowns became widespread (Chart 6, bottom panel). Chart 5Chinese Imports Were Shrinking Before Lockdowns
Chinese Imports Were Shrinking Before Lockdowns
Chinese Imports Were Shrinking Before Lockdowns
Chart 6China: Household Income And Mortgage Borrowing
China: Household Income And Mortgage Borrowing
China: Household Income And Mortgage Borrowing
As the lockdowns wreak havoc on the economy and household income, and with the government not providing direct transfers to the population, household consumption will be severely affected in the months ahead. The property market remains in the doldrums and is unlikely to recover soon. As we have highlighted in previous reports, structural headwinds, continue to weigh down on the property market. Since 2009, there has been no business cycle recovery in China without the real estate market playing the leading role. Residential floor space sold was down by 20% in Q1 from a year ago (Chart 7, top panel). House prices have begun deflating in tier-3 cities. Deflation will likely spread to tier-1 and -2 cities due to a pandemic-driven decline in income and confidence. Critically, the plunge in property developers’ financing entails shrinkage in housing completion (construction work) (Chart 7, bottom panel). The latter has so far held up as authorities have been forcing developers to use their limited financing to complete projects that they had already started. The massive issuance of local government bonds will spur an acceleration in infrastructure spending. China’s government gave the green light already this year to infrastructure projects worth nearly 70% of what was allowed for the whole of last year. Yet, this might be insufficient to produce a rapid business cycle recovery in an environment of rolling lockdowns and with other segments of the economy facing challenges. Related Report Emerging Markets StrategyGlobal Semi Stocks: More Downside Given these negative forces, the Chinese economy requires massive government stimulus in the form of direct transfers to households and SMEs – as the US offered in the spring of 2020. Yet, it does not seem that the government is rushing to provide such direct and significant stimulus. In our opinion, the policy stimulus measures announced so far by the government fall short of what is required to lift the economy. Policymakers are neither ready to abandon the dynamic zero-Covid policy nor provide “irrigation-type” stimulus, especially for households and the property market. With these two constraints, economic growth in China is set to underwhelm. Bottom Line: Risks to global growth stemming from China remain to the downside. In EM ex-China, ongoing fiscal tightening, monetary tightening in LATAM and feeble household income growth in India and ASEAN will all cap consumer spending and business investment (Chart 8). Chart 7China: Property Construction Is Set To Shrink
China: Property Construction Is Set To Shrink
China: Property Construction Is Set To Shrink
Chart 8EM ex-China: Domestic Demand Will Remain Sluggish
EM ex-China: Domestic Demand Will Remain Sluggish
EM ex-China: Domestic Demand Will Remain Sluggish
Signs Of A Global Trade Contraction There is already evidence to suggest that a major relapse in global manufacturing and trade is beginning: Taiwanese shipments to China are dipping into negative territory, and they lead global exports (Chart 9). Taiwanese exports to China are a good leading indicator of global trade dynamics because mainland producers order inputs from Taiwan first before they produce final goods for export. When producers located in China order less inputs, they evidently expect less in the way of production and shipments. Korea’s business survey of exporting companies indicates a substantial deterioration in their business conditions in April (Chart 10). This points to a major slump in the nation’s exports and, hence, global trade. Chart 9Global Trade Is Set To Contract
Global Trade Is Set To Contract
Global Trade Is Set To Contract
Chart 10Korean Exporters Are Downgrading Their Expectations
Korean Exporters Are Downgrading Their Expectations
Korean Exporters Are Downgrading Their Expectations
Korean and Japanese non-financial share prices have plunged despite considerable currency depreciation, which is typically positive for their competitiveness. As many of these non-financial companies are major exporters, this development points to a major downtrend in global trade. Global cyclicals have been underperforming global defensives. This dynamic has historically been a good leading indicator for the global industrial downturn (Chart 11). Finally, early cyclical stocks in the US have sold off and have substantially underperformed domestic defensives (Chart 12). This also points to a slowdown in US growth. Chart 11Global Equity Sector Performance Points To A Relapse In Global Manufacturing
Global Equity Sector Performance Points To A Relapse In Global Manufacturing
Global Equity Sector Performance Points To A Relapse In Global Manufacturing
Chart 12Beware Of A Relapse in US Early Cyclical Stocks
Beware Of A Relapse in US Early Cyclical Stocks
Beware Of A Relapse in US Early Cyclical Stocks
Bottom Line: Leading indicators from Asian economies and global financial markets are signaling that global trade will experience a contraction and global growth will slow. Inflation Amid A Global Trade Contraction? Chart 13US Wages Are Surging in Nominal Terms Yet Shrinking In Real Terms
US Wages Are Surging in Nominal Terms Yet Shrinking In Real Terms
US Wages Are Surging in Nominal Terms Yet Shrinking In Real Terms
A natural question is why worry about inflation when global trade volumes will be contracting? The primary source of anxiety in this context is US inflation and the Fed’s tightening. A decline in global trade will not be enough to bring down US core inflation substantially. By contrast, China and Asia do not face an inflation problem. US inflation worries will persist, and the Fed will likely continue to hike rates and sound hawkish for the following reasons: First, US capital expenditures by companies and household spending on services will remain robust. US services make up a larger share of the American economy and employment than do goods-producing sectors. Hence, we do not expect a broad-based recession in the US this year. Second, as we have previously noted, the US has a genuine inflation problem. American wages are accelerating, and a tight labor market will push up wage growth above 5-6% (Chart 13, top panel). Importantly, real wages in the US have contracted (Chart 13, bottom panel). Faced with a decline in purchasing power, employees will demand higher wages. The tight labor market raises the odds that companies will likely accommodate higher wages. Chart 14Unit Labor Costs Are The Key To Core Inflation
Unit Labor Costs Are The Key To Core Inflation
Unit Labor Costs Are The Key To Core Inflation
Given that US productivity growth is no more than 1.5-2%, wage growth over 5-6% means that unit labor costs will be rising by more than 3-4%. This will prevent core inflation from falling a lot. Unit labor costs have historically been the main driver of core inflation in the US (Chart 14). Finally, inflation is a lagging and inert phenomenon. It takes a long time (more than six to nine months) of sub-par growth for inflation to subside. Odds are that even though global trade volumes will be contracting, the Fed will continue hiking rates and sounding hawkish because US inflationary pressures will remain acute. Bottom Line: Annual core CPI inflation will drop in the US due to the base effect and a drop in some goods prices. Yet, we expect core CPI and PCE to remain above 4% for the rest of this year. Underlying inflationary pressures have spilled over into the labor market, and the wage-price spiral has probably unraveled. Therefore, inflation cannot be reduced meaningfully without bringing economic growth down below potential growth and weakening the labor market for a few quarters. Investment Implications Shrinking global trade volumes and a hawkish Fed are bearish for global risk assets in general and EM equities, currencies and credit markets in particular. Contracting exports and a hawkish Fed are negative for the Chinese yuan and other Asian currencies. The CNY/USD exchange rate has broken below its 200-day moving average and odds are that it will depreciate further (Chart 15). Our target for CNY/USD is 6.7. The broad trade-weighted US dollar has more upside and EM currencies will depreciate. Chart 16 illustrates that investors’ net long positions in ZAR, BRL and MXN are high. Chart 15The RMB Is Breaking Down
The RMB Is Breaking Down
The RMB Is Breaking Down
Chart 16Investors Are Long EM Commodity Currencies
Investors Are Long EM Commodity Currencies
Investors Are Long EM Commodity Currencies
Our recommended currency shorts for now are ZAR, PHP, IDR, COP, HUF, PEN and PLN. Global equity and credit portfolios should continue underweighting EM. Notably, global defensive equity sectors have been outperforming non-TMT stocks despite rising US/global bond yields (Chart 17). This is a major departure from the historical relationship and likely signifies a period of slower global growth ahead but continuous Fed tightening. Global equity managers should favor defensive stocks. Chart 17Does This Divergence From A Historic Correlation Signify Stagflation?
Does This Divergence From A Historic Correlation Signify Stagflation?
Does This Divergence From A Historic Correlation Signify Stagflation?
For EM equity managers, we also recommend favoring defensive sectors like consumer staples. Presently, our country overweights are Korea, Singapore, Chinese A-shares, Mexico and Brazil. Our underweights are India, Central Europe, Indonesia, Turkey, South Africa, Colombia and Peru. In local rates, we continue recommending receiving Chinese and Malaysian 10-year swap rates, a long position in Brazilian 10-year bonds, betting on yield curve flattening in Mexico and paying Polish 10-year swap rates while receiving Czech 10-year swap rates. Arthur Budaghyan Chief Emerging Markets Strategist arthurb@bcaresearch.com
A Whiff Of Stagflation?
A Whiff Of Stagflation?
A Whiff Of Stagflation?
A Whiff Of Stagflation?
Executive Summary In this first of a regular series of ‘no holds barred’ conversations with a concerned client we tackle the hot topic of inflation. Month-on-month US core inflation has already peaked, 12-month US core inflation is about to peak, and demand destruction will ultimately pull down headline inflation too. Given modest and slowing growth in unit labour costs, there is no imminent risk of a wage-price spiral. Surging inflation expectations are just capturing the frothiness in inflation protected bond prices that massive hedging demand is creating. This recent massive demand for inflation hedges such as inflation protected bonds and commodities will recede and take the frothiness out of their prices. On a 6-12 month horizon, underweight inflation protected bonds and commodities… …overweight conventional bonds and stocks… …and tilt towards healthcare and biotech. The Performance Of Inflation Protected Bonds Versus Conventional Bonds Just Tracks The Oil Price
The Performance Of TIPS Versus T-Bonds Is Just A Play On The Oil Price
The Performance Of TIPS Versus T-Bonds Is Just A Play On The Oil Price
Bottom Line: US core inflation is about to peak, demand destruction will ultimately pull down headline inflation, and there is no imminent risk of a wage-price spiral. On a 6-12 horizon, overweight stocks and conventional bonds versus commodities and inflation protected bonds. Feature Welcome to the first of a regular series of Counterpoint reports that takes the form of a ‘no holds barred’ conversation with a concerned client. Roughly once a month, our open and counterpoint conversations will address a major question or concern for investors. This inaugural conversation tackles the hot topic of inflation. On Peak Inflation Client: Thank you for addressing my worries. Like many people right now, I am concerned about inflation. My first question is, when is inflation going to peak? CPT: The good news is that, in an important sense, inflation has already peaked. Month-on-month core inflation in the US reached a high of 0.9 percent through April-June last year. In the more recent pickup through October-January it reached a ‘lower peak’ of 0.6 percent. And in March it dropped to 0.3 percent. Client: Ok, but inflation usually refers to the 12-month inflation rate – when will that peak? CPT: The 12-month inflation rate is just the sum of the last twelve month-on-month rates. So, when the big numbers of April-June of last year drop off to be replaced by the smaller numbers of April-June of this year, the 12-month inflation rate will fall sharply (Chart I-1). Chart I-1Month-On-Month Core Inflation Has Already Peaked, And 12-Month Core Inflation Is About To Peak
Month-On-Month Core Inflation Has Already Peaked, And 12-Month Core Inflation Is About To Peak
Month-On-Month Core Inflation Has Already Peaked, And 12-Month Core Inflation Is About To Peak
Client: Even if the 12-month inflation rate does peak soon, it will still be far too high. When will it return to the 2 percent target? CPT: In the pandemic era, monthly core inflation has been non-linear. Meaning it has been either ‘high-phase’ of 0.5 percent and above, or ‘low-phase’ of 0.3 percent and below. In March it returned to low-phase. If it stays in low-phase, then as an arithmetic identity, the 12-month core inflation rate will be close to its target twelve months from now. Client: So far, you have just talked about core inflation which excludes energy and food prices. What about headline inflation? Specifically, isn’t the Ukraine crisis a massive supply shock for Russian and Ukrainian sourced energy and food? Demand destruction will ultimately pull down headline inflation too. CPT: Yes, headline inflation may take longer to come down than core inflation. But supply shocks ultimately resolve themselves through demand destruction. Client: Could you elaborate on that? CPT: Sure. With fuel and food prices surging, many people are asking: do I really need to make that journey? Do I really need to keep the heating on? Can I buy a cheaper loaf of bread? So, they will cut back, and to the extent that they can’t cut back on energy and food, demand for other more discretionary items will come down, and eventually weigh on prices. Client: At the same time, the pandemic is still raging – look at what’s happening in Shanghai right now. Won’t further disruptions to supply chains just add further fuel to inflation? CPT: Yes, but to repeat, inflation that is entirely due to a supply shock ultimately resolves itself through demand destruction. On The Source Of The Inflation Crisis Client: I am puzzled. If supply shock generated inflation resolves itself, then what has caused the post-pandemic inflation to be anything but ‘transitory’? CPT: The simple answer is the pandemic’s draconian lockdowns combined with massive handouts of government cash unleashed a massive demand shock. But it wasn’t a shock in the magnitude of demand, it was a shock in the distribution of demand (Chart I-2). Chart I-2The Pandemic's Draconian Lockdowns Combined With Massive Government Stimulus Unleashed A Massive Shock In The Distribution Of Demand
The Pandemic's Draconian Lockdowns Combined With Massive Government Stimulus Unleashed A Massive Shock In The Distribution Of Demand
The Pandemic's Draconian Lockdowns Combined With Massive Government Stimulus Unleashed A Massive Shock In The Distribution Of Demand
Client: Could you explain that? CPT: Well, we were all locked at home and flush with government supplied cash, and we couldn’t spend the cash on services. So, we spent it on what we could spend it on – namely, durable goods. This created a massive shock in the distribution of demand, out of services whose supply could easily adjust downwards, and into goods whose supply could not easily adjust upwards. Client: Can you give me some specific examples? CPT: Sure. Airlines could cut back their flights, but auto manufacturers couldn’t make more cars. So, airfares didn’t collapse but used car prices went vertical! The result being the surge in inflation. Client: Do you have any more evidence? Inflation is highest in those economies where the cash handouts and furlough schemes were the most generous, like the US and the UK. CPT: Yes, the three separate surges in month-on-month core inflation all occurred after surges in durable goods demand (Chart I-3). Additionally, inflation is highest in those economies where the cash handouts and furlough schemes were the most generous – like the US and the UK. Chart I-3The Three Surges In Month-On-Month Core Inflation All Occurred After Surges In Durable Goods Demand
The Three Surges In Month-On-Month Core Inflation All Occurred After Surges In Durable Goods Demand
The Three Surges In Month-On-Month Core Inflation All Occurred After Surges In Durable Goods Demand
Client: If we get more waves of Covid, what’s to stop all this happening again? CPT: Nothing, so we should be vigilant. That said, we now have coping strategies for Covid that do not necessitate massive handouts of government cash. Also, we have already binged on durable goods, making it much harder to repeat that trick. On Wages And Inflation Expectations Client: I am still worried that if workers can negotiate much higher wages in response to higher prices, then it would threaten a wage-price spiral. CPT: Agreed, but it is technically incorrect to focus on wage inflation. The correct metric to focus on is unit labour cost inflation – which is wage growth in excess of productivity growth. In the US, this was 3.5 percent through 2021, slowing to just a 0.9 percent annual rate in the fourth quarter. So, it is not flashing danger, at least yet. Client: Ok, but what about the surge in inflation expectations. Isn’t that flashing danger? CPT: We should treat inflation expectations with a huge dose of salt, as they simply track the oil price, and therefore provide a nonsensical prediction of future inflation! (Chart I-4) Chart I-4The Tight Relationship Between The Oil Price And Inflation Expectations Is Intuitive, Appealing... And Nonsense
The Tight Relationship Between The Oil Price And Inflation Expectations Is Intuitive, Appealing... And Nonsense
The Tight Relationship Between The Oil Price And Inflation Expectations Is Intuitive, Appealing... And Nonsense
Client: What can explain this nonsense? CPT: Simply that when the oil price is high, investors flood into inflation hedges such as inflation protected bonds. So, the surge in inflation expectations is just capturing the frothiness in inflation protected bond prices that this massive hedging demand is creating. We can see similar frothiness in some commodity prices. The recent massive demand for inflation hedges such as inflation protected bonds and commodities will recede and take the frothiness out of their prices. Client: How so? CPT: Well to the extent that commodity prices drive headline inflation, the apples-for-apples relationship should be between commodity price inflation and headline inflation, and this is what we generally see (Chart I-5). But recently, this relationship has broken down and instead we see a tighter relationship between headline inflation and commodity price levels (Chart I-6 and Chart I-7). The likely causality here is that, just as for inflation protected bonds, massive inflation hedging demand has created frothiness in some commodity prices. Chart I-5Commodity Price Inflation Usually Drives Headline Inflation, But Recently The Relationship Broke Down
Commodity Price Inflation Usually Drives Headline Inflation, But Recently The Relationship Broke Down
Commodity Price Inflation Usually Drives Headline Inflation, But Recently The Relationship Broke Down
Chart I-6Recently, We See A Weak Relationship Between Commodity Price Inflation And Headline Inflation...
Recently, We See A Weak Relationship Between Commodity Price Inflation And Headline Inflation...
Recently, We See A Weak Relationship Between Commodity Price Inflation And Headline Inflation...
Chart I-7...But A Tight Relationship Between Headline Inflation And Commodity Price Levels
...But A Tight Relationship Between Headline Inflation And Commodity Price Levels
...But A Tight Relationship Between Headline Inflation And Commodity Price Levels
On The Investment Implications Client: To sum up your view then, month-on-month US core inflation has already peaked, 12-month US core inflation is about to peak, and demand destruction will ultimately pull down headline inflation. Given modest and slowing growth in unit labour costs, there is no imminent risk of a wage-price spiral, and surging inflation expectations are just capturing the frothiness in inflation protected bond prices that massive hedging demand is creating. What does this view mean for investment strategy? On a 6-12 horizon, overweight stocks and conventional bonds versus commodities and inflation protected bonds. CPT: Well given that inflation is peaking, one obvious implication is that the massive demand for inflation hedges will recede and take the frothiness out of their prices. On a 6-12 month horizon this means underweighting inflation protected bonds and commodities (Chart I-8). Chart I-8The Performance Of Inflation Protected Bonds Versus Conventional Bonds Just Tracks The Oil Price
The Performance Of Inflation Protected Bonds Versus Conventional Bonds Just Tracks The Oil Price
The Performance Of Inflation Protected Bonds Versus Conventional Bonds Just Tracks The Oil Price
Client: What about the surge in bond yields – when will that reverse? CPT: Empirically, we have seen that bond yields turn just ahead of the turn in the 12-month core inflation rate. Hence, on a 6-12 month horizon this means overweighting bonds. Client: Finally, what does all this mean for stock markets? CPT: The weakness of stock markets this year has been entirely due to falling valuations, rather than falling profits. If the headwind to valuations from rising bond yields turns into a tailwind from falling bond yields, it will boost stocks – especially long-duration stocks with relatively defensive profits. On a 6-12 month horizon this means overweighting stocks, and our favourite sectors are healthcare and biotech. Client: Thank you very much for this open and counterpoint conversation. Fractal Trading Watchlist Due to the Easter holidays, there are no new trades this week. However, the full updated watchlist of 20 investments that are experiencing or approaching turning points is available on our website: cpt.bcaresearch.com Chart 1The Strong Trend In The 18-Month-Out US Interest Rate Future Is Fragile
The Strong Trend In The 18-Month-Out US Interest Rate Future Is Fragile
The Strong Trend In The 18-Month-Out US Interest Rate Future Is Fragile
Chart 2The Strong Trend In The 3 Year T-Bond Is Fragile
The Strong Trend In The 3 Year T-Bond Is Fragile
The Strong Trend In The 3 Year T-Bond Is Fragile
Chart 3AUD/KRW Is Vulnerable To Reversal
AUD/KRW Is Vulnerable To Reversal
AUD/KRW Is Vulnerable To Reversal
Chart 4Canada Versus Japan Is Vulnerable To Reversal
Canada Versus Japan Is Vulnerable To Reversal
Canada Versus Japan Is Vulnerable To Reversal
Chart 5Canada's TSX-60's Outperformance Might Be Over
Canada's TSX-60's Outperformance Might Be Over
Canada's TSX-60's Outperformance Might Be Over
Chart 6US Healthcare Providers Vs. Software At Risk of Reversal
US Healthcare Providers Vs. Software At Risk of Reversal
US Healthcare Providers Vs. Software At Risk of Reversal
Chart 7Bitcoin's 65-Day Fractal Support Is Holding For Now
Bitcoin's 65-Day Fractal Support Is Holding For Now
Bitcoin's 65-Day Fractal Support Is Holding For Now
Chart 8A Potential Switching Point From Tobacco Into Cannabis
A Potential Switching Point From Tobacco Into Cannabis
A Potential Switching Point From Tobacco Into Cannabis
Chart 9Biotech Is A Major Buy
Biotech Is A Major Buy
Biotech Is A Major Buy
Chart 10CAD/SEK Reversal Has Started
CAD/SEK Reversal Has Started
CAD/SEK Reversal Has Started
Chart 11Financials Versus Industrials To Reverse
Financials Versus Industrials To Reverse
Financials Versus Industrials To Reverse
Chart 12Norway's Outperformance Could End
Norway's Outperformance Could End
Norway's Outperformance Could End
Chart 13Greece's Brief Outperformance To End
Greece's Brief Outperformance To End
Greece's Brief Outperformance To End
Chart 14BRL/NZD At A Resistance Point
BRL/NZD At A Resistance Point
BRL/NZD At A Resistance Point
Chart 15The Outperformance Of Resources Versus Healthcare Is Vulnerable To Reversal
The Outperformance Of Resources Versus Healthcare Is Vulnerable To Reversal
The Outperformance Of Resources Versus Healthcare Is Vulnerable To Reversal
Chart 16The Outperformance Of Resources Versus Biotech Is Vulnerable To Reversal
The Outperformance Of Resources Versus Biotech Is Vulnerable To Reversal
The Outperformance Of Resources Versus Biotech Is Vulnerable To Reversal
Chart 17Cotton's Outperformance Is Vulnerable To Reversal
Cotton's Outperformance Is Vulnerable To Reversal
Cotton's Outperformance Is Vulnerable To Reversal
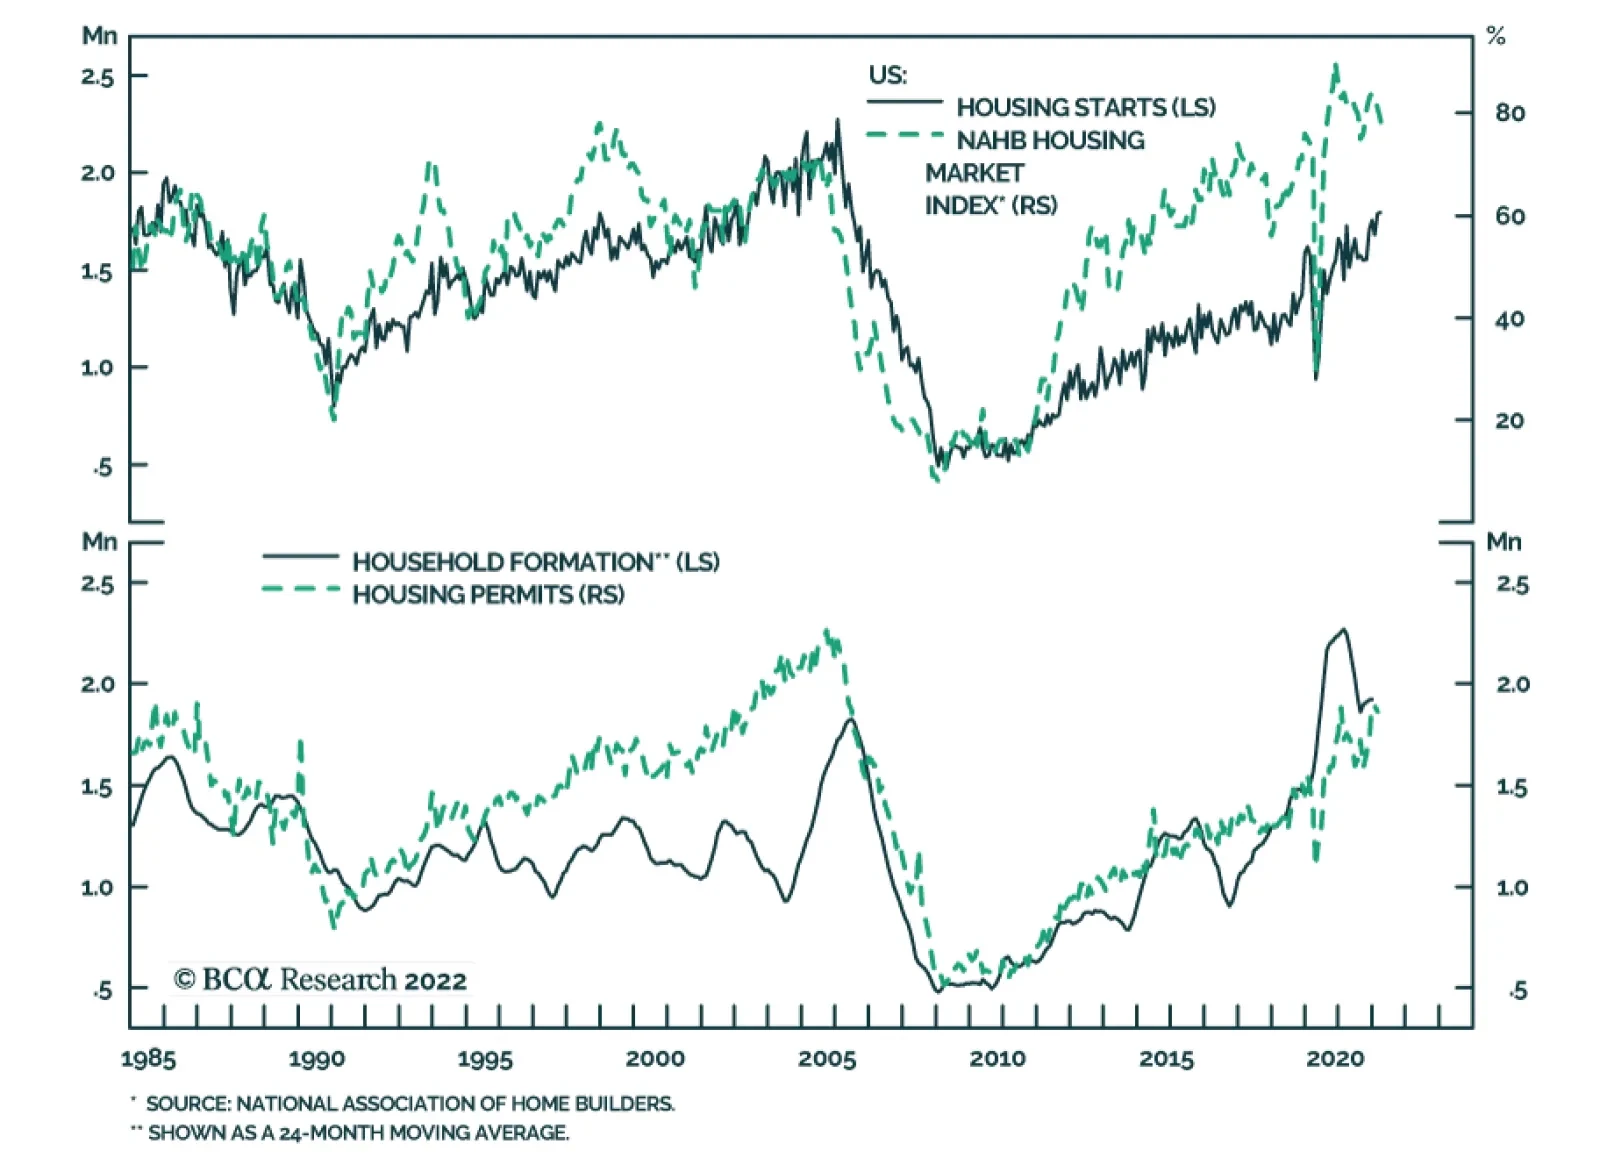
Chart 18US Homebuilders' Underperformance Is At A Potential Turning Point
US Homebuilders' Underperformance Is At A Potential Turning Point
US Homebuilders' Underperformance Is At A Potential Turning Point
Chart 19Fractal Trading Watch List
Fractal Trading Watch List
Fractal Trading Watch List
Chart 20Fractal Trading Watch List
Fractal Trading Watch List
Fractal Trading Watch List
Dhaval Joshi Chief Strategist dhaval@bcaresearch.com Fractal Trading System Fractal Trades
Conversation With A Concerned Client: On Inflation
Conversation With A Concerned Client: On Inflation
Conversation With A Concerned Client: On Inflation
Conversation With A Concerned Client: On Inflation
6-Month Recommendations Structural Recommendations Closed Fractal Trades Indicators To Watch - Bond Yields Chart II-1Indicators To Watch - Bond Yields - Euro Area
Indicators To Watch - Bond Yields - Euro Area
Indicators To Watch - Bond Yields - Euro Area
Chart II-2Indicators To Watch - Bond Yields - Europe Ex Euro Area
Indicators To Watch - Bond Yields - Europe Ex Euro Area
Indicators To Watch - Bond Yields - Europe Ex Euro Area
Chart II-3Indicators To Watch - Bond Yields - Asia
Indicators To Watch - Bond Yields - Asia
Indicators To Watch - Bond Yields - Asia
Chart II-4Indicators To Watch - Bond Yields - Other Developed
Indicators To Watch - Bond Yields - Other Developed
Indicators To Watch - Bond Yields - Other Developed
Indicators To Watch - Interest Rate Expectations Chart II-5Indicators To Watch - Interest Rate Expectations
Indicators To Watch - Interest Rate Expectations
Indicators To Watch - Interest Rate Expectations
Chart II-6Indicators To Watch - Interest Rate Expectations
Indicators To Watch - Interest Rate Expectations
Indicators To Watch - Interest Rate Expectations
Chart II-7Indicators To Watch - Interest Rate Expectations
Indicators To Watch - Interest Rate Expectations
Indicators To Watch - Interest Rate Expectations
Chart II-8Indicators To Watch - Interest Rate Expectations
Indicators To Watch - Interest Rate Expectations
Indicators To Watch - Interest Rate Expectations
Netflix delivered a sobering account of its Q1 performance and outlook at its earnings call on Tuesday. The tech giant lost 200,000 subscribers in the first quarter – the first decline in customers since 2011. Moreover, the company expects to lose another two…
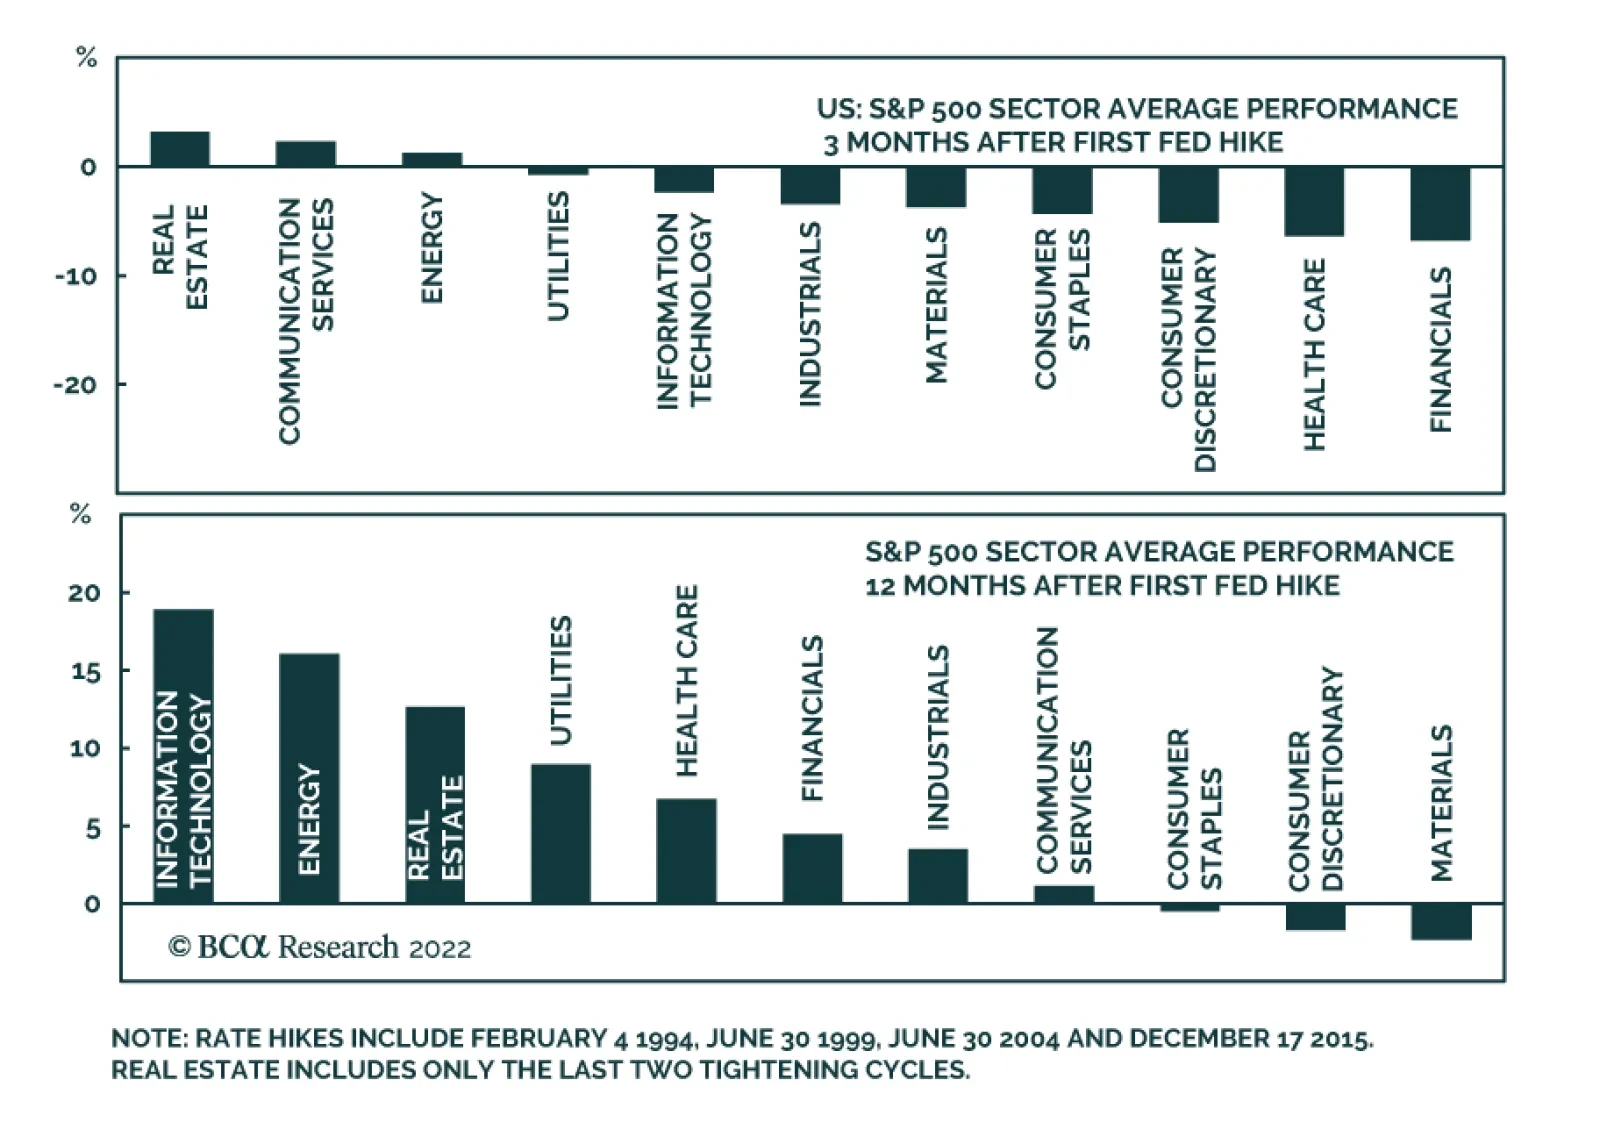
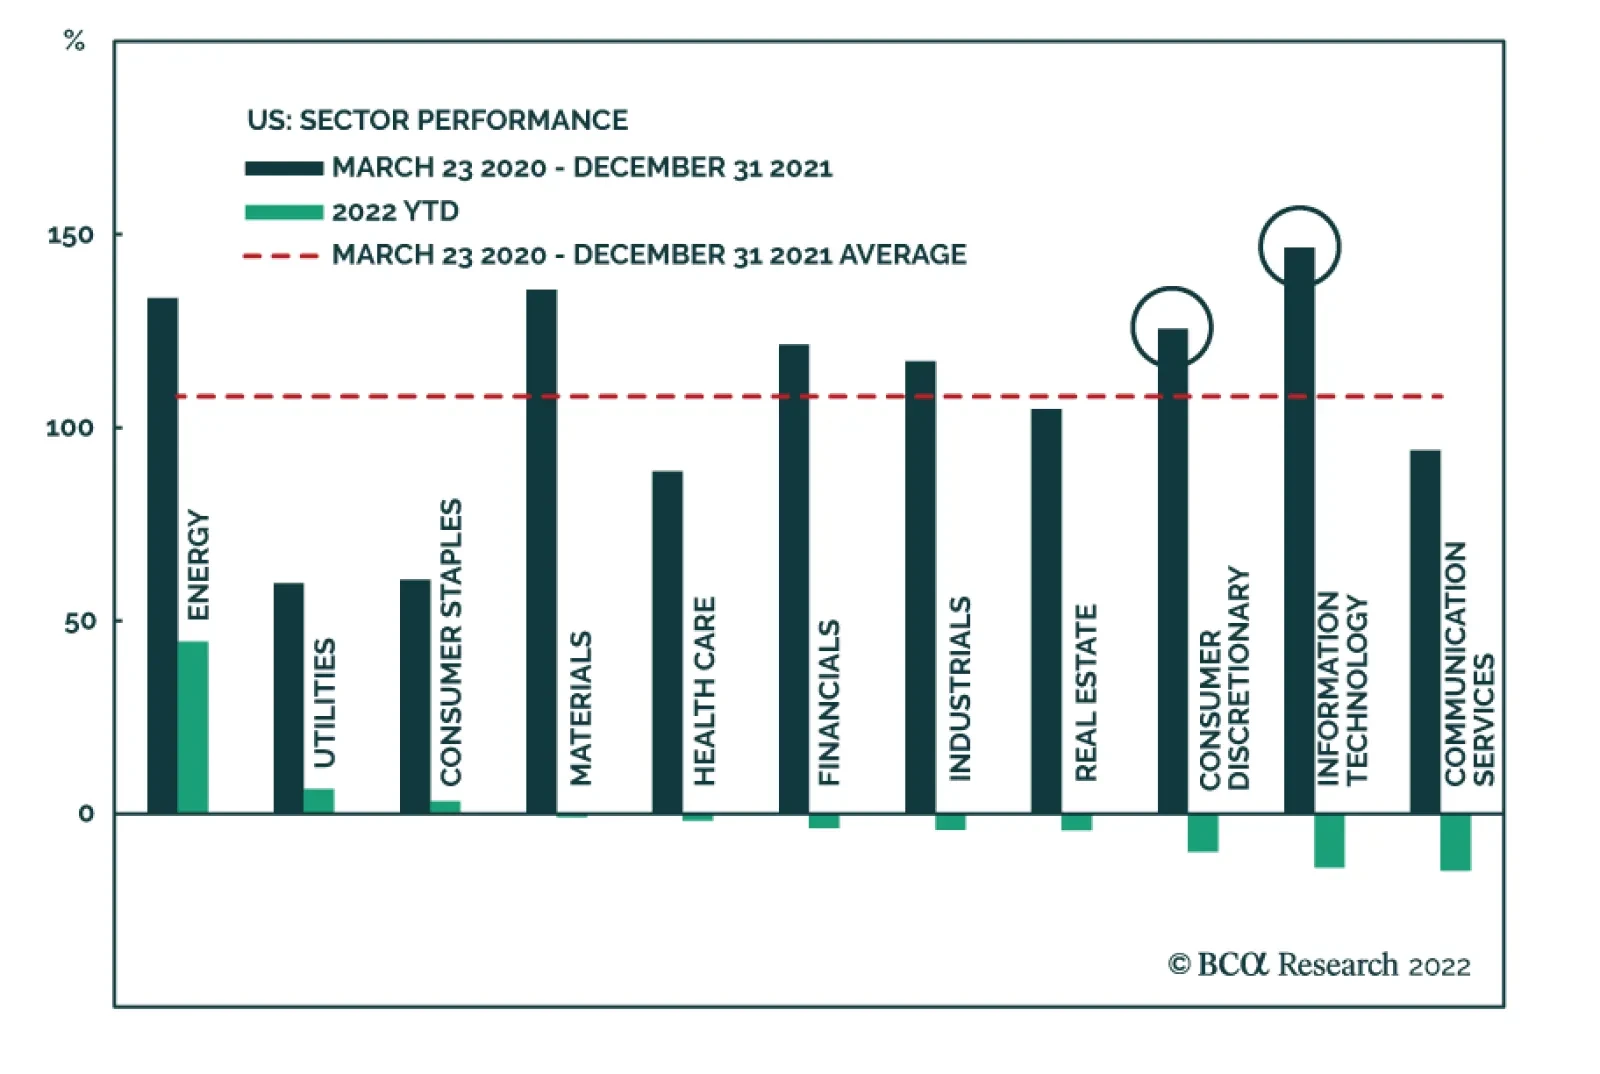
In an insight earlier this year, we showed an analysis by our Global Asset Allocation team of the performance of stocks in the early phases of Fed tightening cycles. The results reveal that while stocks typically wobble in the first few months following the…
Last week marked the beginning of the 2021 Q1 earnings season, with the largest money center banks reporting. We will publish an in-depth analysis of the bank earnings on Monday, April 25, 2022, together with our colleagues from the US Investment Strategy team. This week, 69 companies are reporting. In terms of market expectations: Quarter-on-Quarter earnings growth is expected to be -5% (Chart 1). Similar to previous quarters, we may expect a high number of earnings and sales beats. However, it is forward guidance that will matter. Chart 1
How High Is The Bar Set?
How High Is The Bar Set?
Year-on-year earnings growth is expected to be 6.3% and 0.7% excluding the Energy sector Year-on-year revenue is expected to be 10.9%. Excluding the energy sector, the growth estimate is 8.3%. Clearly, analysts expect increasing cost pressures to take their toll on corporate profitability. There is a wide dispersion in sector-level expectations (Table 1). Commodity sectors, such as Energy and Materials are expected to deliver the highest rates of earnings growth, driven by the shortages, exacerbated by the indirect effects of the war in Ukraine. These are also the best-performing sectors YTD. Technology and Healthcare are expected to deliver strong earnings and sales growth, and so far appear to be immune to slowing growth and inflationary pressures. Earnings of the Consumer Discretionary sector are expected to contract as a result of soaring prices of food and energy, that sap consumer confidence and cut into discretionary spending. In addition, demand for durable goods was pulled forward by the pandemic and is now waning. The Financials sector is expected to experience a sharp drop in earnings. Based on the earnings commentary of the largest banks that have reported so far (JPM, BAC, WFC, C, and MS), there are significant headwinds, which were widely anticipated. A major drought in deal flow and slowing growth decreased demand for loans. On the bright side, banks with sizeable loan books announced that they expect net interest margins to expand. Table 1
How High Is The Bar Set?
How High Is The Bar Set?
Bottom Line: We continue monitoring 2022 Q1 earnings season for any anomalous results to gauge the health of the US corporations.
Executive Summary A Good Time For A Pause In The Bond Bear Market
A Good Time For A Pause In The Bond Bear Market
A Good Time For A Pause In The Bond Bear Market
The global government bond selloff looks stretched from a technical perspective, and a consolidation phase is likely over the next few months as global growth and inflation momentum both roll over. Central banks are starting to turn more aggressive on the pace of rate hikes in the face of elevated inflation expectations, as evidenced by the 50bp rate hikes in Canada and New Zealand last week (and the likely similar move the Fed next month). However, forward pricing of policy rates over the next 12-18 months is already at or above policymaker estimates of neutral in most developed countries. Global bond yields will be capped until central banks and markets revise higher their estimates of neutral policy rates. This is more a 2023/24 story than a 2022 story. Interest rate expectations are too high in Canada. High household debt will limit the ability for the Bank of Canada to match the Fed’s rate hikes during the current tightening cycle without bursting the Canadian housing bubble. Bottom Line: Maintain a neutral stance on overall global duration exposure. Upgrade Canadian government bonds to neutral (3 out of 5) in global bond portfolios, ideally funded out of US Treasury allocations. How To Interpret Rising Real Bond Yields Chart 1Bonds Under Pressure From Both Inflation & Real Yields
Bonds Under Pressure From Both Inflation & Real Yields
Bonds Under Pressure From Both Inflation & Real Yields
The sharp rise in global government bond yields seen so far in 2022 has been driven by both rising inflation expectations and higher real yields (Chart 1). The former is a function of the war-fueled surge in oil prices at a time of high realized inflation, while the latter is a consequence of expectations for tighter monetary policy to fight that inflation. The magnitude of the yield increases seen year-to-date is surprising given the downgrades to global growth expectations. Just this week, the IMF downgraded its growth forecasts for the second time this year. It now expects global growth to reach 3.6% in both 2022 and 2023, shaving 0.8 and 0.2 percentage points, respectively, from the last set of yearly forecasts made back in January. The World Bank similarly chopped its growth forecast for 2022 to 3.2% from 4.1%. Spillovers from the Russia/Ukraine war were the main factor behind the downgrades, including more aggressive monetary tightening by global central banks in response to commodity-fueled inflation. We’re already seeing a faster pace of rate hikes from developed market central banks. The Bank of Canada (BoC) and Reserve Bank of New Zealand (RBNZ) lifted policy rates by 50bps last week and the Fed is signaling a similar move in May. Not all policymakers are sending hawkish signals, however. The ECB last week opted to not commit to the timing and pace of any future moves on rates, while the Bank of Japan has pledged to maintain monetary stimulus measures even in the face of a collapsing yen. Related Report Global Fixed Income StrategyPolicymakers Face The No-Win Scenario While government bond yields have risen across the developed world so far in 2022, the drivers of the yield increase have not been the same in all countries when looking at moves in benchmark 10-year nominal and inflation-linked bonds (Chart 2). About three-quarters of the nominal yield moves seen year-to-date in the US (+134bps), Canada (+136bps) and Australia (+130bps) have come from higher real yields, while the increase in the Gilt yield (+92bps) was more of an equal split between real yields and inflation breakevens. In Germany (+102bps) and Japan (+17bps), the upward move in 10-year yields this year has all been from higher breakevens, as real yields have fallen in both countries. Chart 2Real Yields (ex-Europe/Japan) Driving Nominal Yields Higher In 2022
Global Bond Yields Take A Breather
Global Bond Yields Take A Breather
In the US, Canada and UK – three countries where central banks have delivered rate hikes this year and are promising to do more – real yields have been highly correlated to rising interest rate expectations for the next two years taken from overnight index swap (OIS) curves (Chart 3). Meanwhile, in Germany, Japan and Australia - where central banks have kept rates steady and not sending strong messages on when that will change – the correlation between real yields and OIS-derived interest rate expectations has not been as strong (Chart 4). Chart 3Rising Real Yields Where Central Banks Have Been Hiking
Rising Real Yields Where Central Banks Have Been Hiking
Rising Real Yields Where Central Banks Have Been Hiking
Chart 4More Stable Real Yields Where CBs Are More Dovish
More Stable Real Yields Where CBs Are More Dovish
More Stable Real Yields Where CBs Are More Dovish
Chart 5Real Rate Expectations Have Risen Much Faster In The US
Global Bond Yields Take A Breather
Global Bond Yields Take A Breather
The link between interest rate expectations and real yields is intuitive after factoring in inflation expectations. In Chart 5, we show actual real interest rates (policy rates minus headline CPI inflation) in the US, euro area and UK, as well as a “market-based” measure of real interest rate expectations derived as the difference between forward rates from the nominal OIS and CPI swap curves (the dotted lines). The current path for real rates is the black dotted line, while the path as of the start of 2022 is the green dotted line. In all three countries, the market-derived path for real rates over the next decade has shifted upward since the start of the year, which is consistent with a rising path for real bond yields. Yet the largest move has been in the US where real rates are expected to average around zero over the next ten years. This lines up logically with the more hawkish messaging on rates from the Fed, leading to a repricing of the 10-year TIPS yield from -1% at the start of the year to a mere -0.04% today. By contrast, real rate expectations and real yields remain negative in the euro area and UK, as both the ECB and Bank of England have been much less hawkish compared to the Fed in terms of signaling the timing and magnitude of future rate hikes. We have long flagged deeply negative real bond yields, especially in the US, as the greatest source of vulnerability for global bond markets. Such yield levels can only be sustained in a rising inflation environment if central banks deliberately keep policy rates below inflation for a long time. The Fed was not going to allow that to happen with inflation reaching levels not seen since the early 1980s, leaving US Treasuries vulnerable to a sharp repricing of fed funds rate expectations that would drive real bond yields higher. Looking ahead, we do not expect to see much additional bearish repricing of global rate expectations and real yields over the rest of 2022, for the following reasons: Global growth momentum is slowing The combined shock of geopolitical uncertainty from the Ukraine war, high oil prices and tightening global monetary policy – in addition to the expected slump in Chinese growth due to the latest wave of COVID lockdowns – has damaged economic confidence. The April reading from global ZEW survey of professional forecasters and investors showed another modest decline in US and euro area growth expectations after the huge drop in March (Chart 6). Interestingly, the ZEW survey also showed a big decline in the net number of respondents expecting higher inflation and a small dip in the number of respondents expecting higher bond yields – both potential signals that the increase in global bond yields is ready to pause. Medium-term US inflation expectations have remained relatively contained The sharp run-up in US inflation has boosted survey-based measures of inflation expectations, although the increase has been much higher for shorter-term expectations (Chart 7). One-year-ahead inflation expectations from the University of Michigan and New York Fed consumer surveys have doubled over the past year and now sit at 6.6% and 5.4%, respectively. Yet the 5-10 year ahead inflation expectation from the Michigan survey has seen a much smaller increase and is holding stable around 3%. The 5-year/5-year forward TIPS breakeven is at even less worrisome levels and now sits at a trendline resistance level of 2.4% (bottom panel). Chart 6ZEW Survey Shows Weaker Growth & Inflation Expectations
ZEW Survey Shows Weaker Growth & Inflation Expectations
ZEW Survey Shows Weaker Growth & Inflation Expectations
Chart 7Medium-Term US Inflation Expectations Have Not Broken Out
Medium-Term US Inflation Expectations Have Not Broken Out
Medium-Term US Inflation Expectations Have Not Broken Out
US inflation is showing early signs of peaking Year-over-year headline US CPI inflation reached another cyclical high of 8.6% in March. However, core CPI inflation rose by a less-than-expected +0.3% on the month and the year-over-year rate of 6.5% was essentially unchanged versus the February level (Chart 8). Used car prices, a huge driver of the surge in US goods inflation in 2021, fell by a sizeable -3.8% in March, the second consecutive monthly decrease. Chart 8A Peak In US Core Inflation?
A Peak In US Core Inflation?
A Peak In US Core Inflation?
Chart 9Housing Cost Inflation Is A Global Problem
Housing Cost Inflation Is A Global Problem
Housing Cost Inflation Is A Global Problem
We expect US consumer spending to shift more towards services from goods over the next 6-12 months, which should lead to overall US inflation rates converging more towards lower services inflation. Services inflation is still well above the Fed’s inflation target, however, particularly with shelter inflation – one-third of the overall US CPI index – now at 5.0% and showing no signs of slowing. Chart 10A Good Time For A Pause In The Bond Bear Market
A Good Time For A Pause In The Bond Bear Market
A Good Time For A Pause In The Bond Bear Market
Rising housing costs are not only a problem in the US, and house prices and valuations have soared across the developed world (Chart 9). This suggests that housing and rental costs will remain an important driver of underlying inflation in many countries, not just the US. Summing it all up, we continue to see conditions conducive to a period of relative global bond market stability, with government bond yields remaining rangebound over the next several months. The stimulus for higher yields – from even more hawkish repricing of central bank expectations, even higher real bond yields or additional increases in inflation expectations – is not evident. Bond yields look stretched from a technical perspective, and our Global Duration Indicator continues to signal that global yield momentum should soon peak (Chart 10). Bottom Line: Maintain a neutral stance on overall global bond portfolio duration. Upgrade Canadian Government Bonds To Neutral The Bank of Canada (BoC) hiked its policy interest rate by 50bps last week to 1%, the first rate increase of that size since 2000. The BoC also announced that it will begin quantitative tightening of its balance sheet at the end of April when it stops buying Canadian government bonds to replace maturing debt it currently owns. In the press conference explaining the move, BoC Governor Tiff Macklem noted that the central bank now saw the Canadian economy in a state of “excess demand” with inflation that was “expected to be elevated for longer than we previously thought” and that “the economy could handle higher interest rates, and they are needed.” Chart 11Canadian Growth Momentum Peaking?
Canadian Growth Momentum Peaking?
Canadian Growth Momentum Peaking?
This is a very clear hawkish message from Macklem, who hinted that the BoC may have to lift rates above neutral for a period to bring Canadian inflation back down to the central bank’s target. We have our doubts that the BoC will be able to raise rates that far, and keep them there for long, before inflation pressures ease. The BoC Business Outlook Survey plays an important role in the central bank’s policy decisions. The survey for Q1/2022 showed dips in the overall survey, and the individual components related to sales growth expectations, investment intentions and hiring plans (Chart 11). There were even small drops in the net number of survey respondents seeing intense labor shortages and expecting faster wage growth (bottom panel). The moves in these survey components were modest, but they are important coming after the relentless upward rise since the trough in mid-2020. Importantly, this survey was conducted before the Russian invasion of Ukraine, which likely provided an additional drag on business confidence. The components of the Business Outlook Survey related to prices and costs continued to show that Canadian firms are facing lingering capacity constraints and intense cost pressures from both labor and supply chain disruption. A net 80% of respondents – a survey record – report they would have some or significant difficulty meeting an unexpected increase in demand. A net 35% of respondents in the Q1/2022 survey cited “labor cost pass through” as a source of upward pressure on their output prices, a huge jump from the Q4/2022 reading of 19% (Chart 12). Also, a net 33% of respondents noted “non labor cost pass through”, i.e. higher prices due to supply chain disruption, as a source of pressure on output prices. Only a net 12% of respondents cited strong demand as a source of pressure on prices, and the net balance of respondents noting that the competitive environment was inflationary was effectively zero. Chart 12Canadian Businesses See More Cost-Push Inflation Pressures
Global Bond Yields Take A Breather
Global Bond Yields Take A Breather
The two main messages from the Business Outlook Survey are: a) Canadian growth momentum likely cooled in Q1, and b) Canadian inflation pressures remain significant, but are more supply driven than demand driven. Overall Canadian inflation is still accelerating rapidly, with headline CPI hitting an 31-year high of 5.7% in February. Underlying measures of inflation are more subdued, but still elevated: the BoC’s CPI-trim and CPI-median measures are at 4.3% and 3.5%, respectively, both above the BoC’s 1-3% target band (Chart 13). Chart 13Mixed Messages On Canadian Inflation Expectations
Mixed Messages On Canadian Inflation Expectations
Mixed Messages On Canadian Inflation Expectations
There are more mixed messages coming out of Canadian inflation surveys. The 1-year-ahead inflation expectation from the BoC’s Survey of Consumer Expectations climbed to 5.1% in Q1/2022 from 4.9% in Q4, while the 5-year-ahead expectation dropped to 3.2% from 3.5%. The 10-year breakeven inflation rate on Canadian inflation linked bonds is even lower, now sitting near at 2.2%. There are also very mixed signals on wage expectations, even with the Canadian unemployment rate dropping to a record low of 5.3% in March. Canadian consumers expect wage growth to reach 2.2% over the next year, below the latest reading on actual wage growth of 2.5% and far below the 5.2% growth expected by Canadian businesses (bottom panel). If medium-term consumer inflation expectations are not rising in the current high inflation environment, and consumer wage expectations are not increasing with a record-low unemployment rate, then the BoC can potentially move slower than markets expect on rate hikes over the next year if realized inflation peaks. On that front there are tentative signs of optimism. When breaking down Canadian inflation into goods and services components, both are still accelerating rapidly (Chart 14). Goods inflation reached 7.6% in February, while services inflation hit 3.8%. However, the pace of year-over-year inflation for some key durable goods components like new cars, household appliances and furniture – items that saw demand and prices increase during the worst of the pandemic – appears to have peaked (middle panel). This may be a sign that overall goods inflation is set to roll over, similarly to what we expect in the US in the coming months. Also like the US, services inflation is less likely to decelerate, as rent inflation is accelerating and the housing cost component of Canadian inflation (home replacement costs) is still expanding at a 13.2% annual rate. On that note, housing remains the key component to watch to determine the BoC’s next move, given highly levered household balance sheets exposed to house prices and higher mortgage rates. The robust strength of the Canadian housing market has driven house prices to some of the most overvalued levels among the developed economies. There is a speculative aspect to the housing boom, with Canadian households expecting house prices to appreciate by 7.1% over the next year according to the BoC consumer survey (Chart 15). Canadian housing demand has also become more sensitive to rate increases by the choice of mortgages. 30% of outstanding mortgages are now variable rate, up from 18% at the start of the pandemic in 2020 after the BoC cut rates to near-0%. Chart 14The Goods-Driven Canadian Inflation Surge May Be Peaking
The Goods-Driven Canadian Inflation Surge May Be Peaking
The Goods-Driven Canadian Inflation Surge May Be Peaking
Chart 15BoC Rate Hikes Will Cool Off Canadian Housing
BoC Rate Hikes Will Cool Off Canadian Housing
BoC Rate Hikes Will Cool Off Canadian Housing
During the BoC’s last rate hiking cycle in 2017-19, national house price inflation slowed from 15% to 0%. Policy rates had to only reach 1.75% to engineer that outcome. With household balance sheets even more levered today, and with greater exposure to variable rate mortgages, it is unlikely that a policy rate higher than the previous cycle peak will be needed to cool off house price growth – an outcome that should also dampen Canadian services inflation with its large housing related component. In addition to the rate hike at last week’s policy meeting, the BoC also announced the results of its annual revision to its estimated range for the neutral policy rate. The range is now 2-3%, up slightly from 1.75%-2.75%. The current pricing of interest rate expectations from the Canadian OIS curve has the BoC lifting rates to the high-end of that new neutral range by the first quarter of 2023, then keeping rates near those levels over at least the next five years (Chart 16). Chart 16Markets Expect The BoC To Keep Rates Elevated For Longer
Global Bond Yields Take A Breather
Global Bond Yields Take A Breather
Chart 17Upgrade Canadian Government Bonds To Neutral
Upgrade Canadian Government Bonds To Neutral
Upgrade Canadian Government Bonds To Neutral
We doubt the BoC will be able to raise rates all the way to 3% without inducing instability in the housing market. More importantly, the current surge in inflation is not becoming embedded in medium-term inflation and wage expectations – outcomes that would require the BoC to keep policy rates at the high end of its neutral range or even move them into restrictive territory. Turning to bond strategy, we have had Canada on “upgrade watch” in recent weeks, with rate hike expectations looking a bit too aggressive. We now see it as a good time to pull the trigger on that upgrade. Thus, this week, we are moving our recommended exposure to Canadian government bonds to neutral (3 out of 5) from underweight (Chart 17). We are “funding” that move in our model bond portfolio by reducing exposure to US Treasuries (see the tables on pages 15-16), as we see the Fed as being more likely than the BoC to deliver on the rate hike expectations discounted in OIS curves. A move to an outright overweight stance, versus all countries and not just the US, will be appropriate once Canadian inflation clearly peaks and interest rate expectations begin to decline. It is too soon to make that move now, but we will revisit that call later this year. Bottom Line: Interest rate expectations are too high in Canada with medium-term inflation expectations relatively subdued. High household debt in Canada will limit the ability for the Bank of Canada to match the Fed’s rate hikes during the current tightening cycle without bursting the Canadian housing bubble. Upgrade Canadian government bonds to neutral (3 out of 5) in global bond portfolios, ideally funded out of US Treasury allocations. Robert Robis, CFA Chief Fixed Income Strategist rrobis@bcaresearch.com GFIS Model Bond Portfolio Recommended Positioning Active Duration Contribution: GFIS Recommended Portfolio Vs. Custom Performance Benchmark
Global Bond Yields Take A Breather
Global Bond Yields Take A Breather
The GFIS Recommended Portfolio Vs. The Custom Benchmark Index Global Fixed Income - Strategic Recommendations* Cyclical Recommendations (6-18 Months)
Global Bond Yields Take A Breather
Global Bond Yields Take A Breather
Tactical Overlay Trades
The IMF revised down its 2022 global growth projections in its latest World Economic Outlook. It now expects global GDP to expand by 3.6% in real terms, down from its earlier estimate of 4.4%. The 2023 forecast was also lowered from 3.8% to 3.6%. While the…
BCA Research’s US Bond Strategy service recommends several ideas to profit from peak inflation. Last week’s March CPI report showed that 12-month core consumer price inflation came in at 6.44%, a level that will almost certainly mark the peak for the year.…
US housing starts and building permits sent a positive signal about the US housing market on Tuesday. Housing starts increased by 0.3% m/m in March, surprising expectations of a 1.6% m/m decline. Similarly, building permits rose by 0.4% m/m versus consensus…
Executive Summary Above Fair Value
Above Fair Value
Above Fair Value
March’s CPI report will mark peak inflation for 2022. We recommend several ideas to profit from peak inflation. First, investors should keep portfolio duration close to benchmark. The bond market is fairly priced for the likely near-term pace of rate hikes, and long-dated forward yields are now above fair value. Second, investors should underweight TIPS versus nominal Treasuries. They should also favor inflation curve steepeners, real yield curve flatteners and outright short positions in 2-year TIPS. Third, investors should favor the 5-year nominal Treasury note relative to a duration-matched barbell consisting of the 2-year and 10-year notes. The Fed published its plan for shrinking its balance in the minutes from the last FOMC meeting. We estimate that the Fed will be able to shrink its balance sheet at its intended pace for at least the next two years before it is forced to stop. Bottom Line: Investors should position for peak inflation by keeping portfolio duration close to benchmark, by underweighting TIPS versus nominal Treasuries and by favoring the 5-year nominal Treasury note versus the 2-year and 10-year. Feature Chart 1Base Effects Kick In Next Month
Base Effects Kick In Next Month
Base Effects Kick In Next Month
Last week’s March CPI report showed that 12-month core consumer price inflation came in at 6.44%, a level that will almost certainly mark the peak for the year. Several reasons justify our peak inflation call. First, base effects will send year-over-year core CPI sharply lower during the next three months (Chart 1). Monthly core CPI growth rates were 0.86%, 0.75% and 0.80% in April, May and June 2021 (Chart 1, bottom panel). These exceptionally high prints will roll out of the 12-month average during the next three months. Second, monthly core CPI grew 0.32% in March, a significant step down from the 0.5%-0.6% range that had been the norm since October. If monthly core CPI growth rates remain between 0.3% and 0.4% from now until the end of the year, then 12-month core CPI will fall to a range of 4.19% to 5.13%. We think that trends in the major components of core inflation make this outcome likely, and we could even see inflation falling to below that range. Chart 2 shows the contributions of shelter, goods and services (ex. shelter) to overall core CPI. Chart 2Monthly Core Inflation By Major Component
Peak Inflation
Peak Inflation
Starting with core goods, we see that prices fell in March for the first time since February 2021. This represents an important inflection point. Core goods, particularly autos, have been the principal driver of current extremely high inflation rates (Chart 3), and these prices will continue to fall in the coming months as supply chain issues are resolved and as goods spending reverts to its pre-pandemic trend (Chart 3, bottom panel). Few dispute that core goods inflation will be weaker going forward. However, one critical question is whether the impact from falling goods prices will simply be offset by the rising cost of services. There was indeed some evidence for this in March. Core services (ex. shelter) prices rose 0.71% in March, up from 0.55% in February. While this is a strong print, it was not sufficient to prevent a drop in overall core inflation from 0.51% to 0.32%. What’s more, March’s core services print was heavily influenced by a surge in airfares that represents a rebound from steep declines seen near the end of last year. With airfares excluded, core services inflation would have only come in at 0.50% in March (Chart 4). Chart 3Goods Inflation
Goods Inflation
Goods Inflation
Chart 4Services & Shelter Inflation
Services & Shelter Inflation
Services & Shelter Inflation
Finally, we turn to the outlook for shelter inflation. Monthly shelter inflation has rebounded to above its pre-COVID levels, but its acceleration has abated during the past few months (Chart 4, bottom panel). Trends in home prices and some indicators of market rents suggest that shelter inflation has some further near-term upside.1 However, shelter inflation is also very sensitive to the economic cycle and the unemployment rate. With that in mind, rapid shelter inflation during the past 12 months is mostly explained by the fact that the unemployment rate fell by almost 2.5%! With the labor market already close to full employment, this sort of cyclical economic improvement will not be repeated during the next 12 months. All in all, we think monthly shelter inflation will average close to its current level during the next nine months. Bottom Line: March’s CPI report marked an inflection point for inflation. Year-over-year inflation will fall sharply during the next few months and will settle close to 4% by the end of the year. Profiting From Peak Inflation Portfolio Duration We have been recommending an “at benchmark” portfolio duration stance in US bond portfolios since mid-February, yet Treasury yields have continued their upward march during the past two months. Our sense is that bond yields now look somewhat too high, and some pullback is likely as inflation moves lower during the next few months. First, let’s consider that the bond market is priced for 262 bps of tightening during the next 12 months (Chart 5), the equivalent of more than ten 25 basis point rate hikes at the next eight FOMC meetings. Our view is that this pricing is close to fair. Chart 5Rate Expectations
Rate Expectations
Rate Expectations
A 50 basis point rate hike at the May FOMC meeting is now a near certainty. The minutes from the last meeting revealed that “many” participants would have preferred a 50 bps increase in March, but uncertainty surrounding the war in Ukraine prevented that view from becoming consensus. The Treasury curve has also re-steepened significantly during the past few weeks, a development that will ease any concerns about near-term over-tightening. It’s also worth noting that the precedent for a 50 bps hike has now been set by the Reserve Bank of New Zealand and the Bank of Canada. Both central banks lifted their policy rates by 50 bps at their most recent meetings. Chart 6Above Fair Value
Above Fair Value
Above Fair Value
Beyond May, we expect to see more 25 basis point rate hikes than 50 basis point hikes. Falling inflation will ease some of the Fed’s urgency and the Fed will continue to tighten policy with the goal of getting the fed funds rate close to estimates of the long-run neutral rate by the end of the year. A 25 basis point rate increase at every meeting after May would bring the fed funds rate to a range of 2.0% - 2.25% by the end of the year, just below the Fed’s median estimate of the long-run neutral rate (2.4%). One additional 50 bps hike would bring the funds rate right up to neutral, and such a path would still be consistent with what is currently priced in the curve. Meanwhile, bond pricing at the long end of the yield curve now looks a touch cheap. The 5-year/5-year forward Treasury yield – a market proxy for the long-run neutral rate – has moved up to 2.87%, significantly above survey estimates of the long-run neutral rate (Chart 6). Some pullback closer to survey levels is likely as inflation trends lower. Bottom Line: Keep portfolio duration close to benchmark. Front-end pricing looks fair and long-dated forward yields are somewhat too high. TIPS Perhaps the most obvious way to profit from peak inflation in 2022 is by shorting TIPS versus nominal Treasuries. The 10-year TIPS breakeven inflation rate has risen to 2.91%, well above the Fed’s target range of 2.3%-2.5% (Chart 7). The combination of Fed tightening and falling inflation will send this rate back toward the Fed’s target between now and the end of the year. However, the potential downside in the 10-year TIPS breakeven inflation rate is nothing compared to the 2-year rate. The 2-year TIPS breakeven inflation rate is 4.4% (Chart 7, panel 2) and this short-maturity rate is much more sensitive to the incoming inflation data. Finally, long-maturity TIPS breakeven inflation rates look elevated compared to survey estimates of long run inflation. The 5-year/5-year forward TIPS breakeven inflation rate is currently 2.46%, above the range of estimates from the New York Fed’s Survey of Primary Dealers (Chart 7, bottom panel). In addition to underweight positions in TIPS versus nominal Treasuries, we continue to see the opportunity for an outright short position in 2-year TIPS. The 2-year TIPS yield has risen significantly since the end of last year, but this has been driven by a rising 2-year nominal yield (Chart 8). Going forward, the 2-year TIPS yield still has room to rise but it’s increase will be driven less by a rising nominal yield and more by a falling 2-year TIPS breakeven inflation rate. Chart 7Inflation Expectations
Inflation Expectations
Inflation Expectations
Chart 8Sell 2-Year TIPS
Sell 2-Year TIPS
Sell 2-Year TIPS
Consistent with our view that the cost of short-maturity inflation compensation has more downside than the cost of long-maturity inflation compensation, we view positions in 2-year/10-year inflation curve steepeners and 2-year/10-year TIPS curve flatteners as likely to profit during the next nine months (Chart 8, bottom panel). Bottom Line: Investors should underweight TIPS versus nominal Treasuries. They should also position in inflation curve steepeners and real yield curve flatteners and hold outright short positions in 2-year TIPS. Nominal Treasury Curve Chart 9Go Long 5yr Versus 2/10
Go Long 5yr Versus 2/10
Go Long 5yr Versus 2/10
One final idea is for investors to take a long position in the 5-year Treasury note versus a short position in a duration-matched barbell consisting of the 2-year and 10-year notes. This 5 over 2/10 trade currently offers an attractive 18 bps of yield pick-up, which is much higher than we normally see when the 2-year/10-year Treasury slope is this flat (Chart 9). In fact, a simple model of the 2/5/10 butterfly spread versus the 2-year/10-year slope shows the 5-year bullet to be very cheap relative to history (Chart 9, panel 2). This position will profit from continued 2-year/10-year curve steepening, or more likely, it will profit if the 2-year/10-year slope remains near its current level but the 2-year/5-year slope flattens as the Fed tightening cycle progresses (Chart 9, panel 3). Bottom Line: The recent steepening trend in the 2-year/10-year Treasury slope is likely exhausted, but the 5-year Treasury yield is too high relative to the current 2-year/10-year slope. Investors should go long the 5-year bullet versus a duration-matched 2-year/10-year barbell. The Fed’s Balance Sheet Plan The minutes from the March FOMC meeting revealed the Fed’s plan for shrinking its balance sheet. This plan will likely be put into action at either the May or June FOMC meeting. Specifically, the Fed intends to allow a maximum of $60 billion of Treasuries and $35 billion of MBS to passively run off its portfolio each month. The Fed also hinted that it may decide to start with lower caps and raise them up to the $60 billion and $35 billion targets over a period of three months. However, with the market already well positioned for Quantitative Tightening (QT), this phase-in period will probably not be deemed necessary. For its Treasury securities, the Fed intends to allow a maximum of $60 billion of coupon securities to run off its portfolio each month. If fewer than $60 billion of coupon securities are maturing that month, then the Fed will redeem T-bills to reach the $60 billion target. For MBS, the Fed’s $35 billion per month cap will probably not be binding. Given the slow pace of mortgage refinancings, which will only slow further as interest rates rise, it is unlikely that there will be many months with more than $35 billion of maturing MBS. In fact, some recent Fed research estimated that average MBS runoff will be closer to $25 billion per month going forward.2 Assuming the Fed’s plan starts in June and that MBS runoff averages $25 billion per month, we calculate that the Fed’s Treasury holdings and total assets will still be above pre-COVID levels in 2026 (Chart 10). More important than the Fed’s total assets, however, are the total reserves supplied to the banking system. It is the amount of reserves, after all, that determine whether the Fed can maintain adequate control over interest rates. If too few reserves are supplied, then the fed funds rate will threaten to break above the upper end of the Fed’s target band and the Fed will be forced to increase reserves by either re-starting purchases or engaging in repo transactions. This is exactly what happened when the Fed was forced to abandon its last QT effort in September 2019 (Chart 11). Chart 10Fed Asset Projections
Fed Asset Projections
Fed Asset Projections
Chart 11Reserve Projections
Reserve Projections
Reserve Projections
Making a few additional assumptions about the growth rate of currency-in-circulation and the size of the Treasury’s General Account, we are able to forecast the path for reserves going forward (Chart 11, top panel). We estimate that reserves will fall to roughly $2 trillion by the end of 2025, still slightly above the levels that caused problems in fall 2019. Ultimately, neither us nor the Fed knows exactly what level of reserves will be adequate to maintain control of interest rates going forward. The Fed will track usage of its new Standing Repo Facility as it shrinks its balance sheet. If usage of the repo facility increases, that will be the sign that the Fed has done enough QT and it is time to start slowly increasing the balance sheet once again. Given the recently published pace of runoff, we think this won’t be story for at least another two years. Ryan Swift US Bond Strategist rswift@bcaresearch.com Footnotes 1 For more details please see US Bond Strategy Weekly Report, “A Soft Landing Is Still Possible”, dated March 15, 2022. 2 https://www.newyorkfed.org/newsevents/speeches/2022/log220302 Recommended Portfolio Specification
Peak Inflation
Peak Inflation
Other Recommendations
Peak Inflation
Peak Inflation
Treasury Index Returns Spread Product Returns