United States

Executive Summary The Ukraine war reinforces our key view that commodity producers will use their geopolitical leverage this year. The market is growing complacent again about Russian risks. Iran is part of the same dynamic. If US-Iran talks fail, as we expect, the Middle East will destabilize and add another energy supply risk on top of the Russian risk. The Ukraine war also interacts with our other two key views for 2022: China’s reversion to autocracy and the US’s policy insularity. Both add policy uncertainty and weigh on risk sentiment. The war also reinforces our strategic themes for the 2020s: Great Power Rivalry, Hypo-Globalization, and Populism/Nationalism. Stagflation Cometh
Stagflation Cometh
Stagflation Cometh
Trade Recommendation Inception Date Return Cyclically Long Global Defensives Versus Cyclicals 2022-01-20 10.8% Bottom Line: Tactically stay long global defensives and large caps. Cyclically stay long gold, US equities, aerospace/defense, and cyber security. Feature In our annual outlook, “The Gathering Storm,” we argued that the post-pandemic world economy would destabilize due to intensifying rivalry among the leading nations. We argued that China’s reversion to autocracy, US domestic divisions, and Russia’s commodity leverage would produce a toxic brew for global investors in 2022. By January 27 it was clear to us that Russia would invade Ukraine, so the storm was arriving sooner than we thought, and we doubled down on our defensive and risk-averse market positioning. We derived these three key views from new cyclical trends and the way they interact with our underlying strategic themes – Great Power Rivalry, Hypo-Globalization, and Populism/Nationalism (Table 1). These themes are mutually reinforcing, rooted in solid evidence over many years, and will not change easily. Table 1Three Geopolitical Strategic Themes
Second Quarter Outlook 2022: When It Rains, It Pours
Second Quarter Outlook 2022: When It Rains, It Pours
Related Report Geopolitical Strategy2022 Key Views: The Gathering Storm The Ukraine war reinforces them: Russia took military action to increase its security relative to the US and NATO; the West imposed sanctions that reduce globalization with Russia and potentially other states; Russian aggression stemmed from nationalism and caused a spike in global prices that will spur more nationalism and populism going forward. In this report we examine how these trends will develop in the second quarter and beyond. We see stagflation taking shape and recommend investors prepare for it by continuing to favor defensive sectors, commodities, and value plays. Checking Up On Our Russia View For 2022 Our third key view for 2022 – that oil producers like Russia and Iran possessed immense geopolitical leverage and would most likely use it – is clearly the dominant geopolitical trend of the year, as manifested in the Russian invasion of Ukraine.1 Russia first invaded Ukraine in 2014 and curtailed operations after commodity prices crashed. It launched a new and larger invasion in 2022 when a new commodity cycle began (Chart 1). Facing tactical setbacks, Russia has begun withdrawing forces from around the Ukrainian capital Kyiv. But it will redouble its efforts to conquer the eastern Donbas region and the southern coastline. The coast is the most strategic territory at stake (Map 1). Chart 1Russia's Commodity-Enabled Aggression
Russia's Commodity-Enabled Aggression
Russia's Commodity-Enabled Aggression
Map 1Russian Invasion Of Ukraine, 2022
Second Quarter Outlook 2022: When It Rains, It Pours
Second Quarter Outlook 2022: When It Rains, It Pours
The most decisive limitation on Russia’s military effort would come from a collapse of commodity exports or prices, which has not happened yet. Europe continues to buy Russian oil and natural gas, although it is debating a ban on the $4.4 billion worth of coal that it imports. With high energy prices making up for a drop in export volumes, Russian armed forces can still attempt a summer and fall campaign (Chart 2). The aim would be to conquer remaining portions of Donetsk and Luhansk, the “land bridge” to Crimea, and potentially the stretch of land between the Dnieper river and eastern Moldova, where Russian troops are already stationed. Chart 2Russia’s War Financing
Second Quarter Outlook 2022: When It Rains, It Pours
Second Quarter Outlook 2022: When It Rains, It Pours
Ukraine’s military neutrality is the core Russian objective. Ukraine is offering neutrality in exchange for security guarantees in the current ceasefire talks. Hence a durable ceasefire is possible if the details of neutrality are agreed – Ukraine forswears joining NATO and hosting foreign military infrastructure while accepting limitations on military exercises and defense systems. The security guarantees that Ukraine demands are mostly symbolic, as the western powers that would be credible guarantors are already unwilling to use military force against Russia (e.g. the US, UK, NATO members). However, Russia’s withdrawal from Kyiv will embolden the Ukrainians, so we do not expect a durable ceasefire in the second quarter. Global investors will be mistaken if they ignore Ukraine in the second quarter, at least until core problems are resolved. What matters most is whether the war expands beyond Ukraine: The likelihood of a broader war is low but not negligible. So far the Russian regime is behaving somewhat rationally: Moscow attacked a non-NATO member to prevent it from joining NATO; it limited the size of the military commitment; and it is now accepting reality and withdrawing from Kyiv while negotiating on Ukrainian neutrality. But a major problem emerges if Russia’s military fails in the Donbas while Ukraine reneges on offers of neutrality. Any ceasefire could fall apart and the war could re-escalate. Russia could redouble its attacks on the country or conduct a limited attack outside of Ukraine to trigger a crisis in the western alliance. Moreover, if sanctions keep rising until Russia’s economy collapses, Moscow could become less rational. Finland and Sweden have seen a shift of public opinion in favor of joining NATO. Any intention to do so would trigger a belligerent reaction from Russia. These governments are well aware of the precarious balance that must be maintained to prevent war, so war is unlikely. But if their stance changes then Russia will threaten to attack. Russia would threaten to bomb these states since it cannot now credibly threaten invasion by land (Charts 3A & 3B). Chart 3ANordic States Joining NATO Would Trigger Larger War
Second Quarter Outlook 2022: When It Rains, It Pours
Second Quarter Outlook 2022: When It Rains, It Pours
Chart 3BNordic States Joining NATO Would Trigger Larger War
Second Quarter Outlook 2022: When It Rains, It Pours
Second Quarter Outlook 2022: When It Rains, It Pours
The Black Sea is vulnerable to “Black Swan” events or military spillovers. Russia is re-concentrating its military efforts in the Donbas and land bridge to Crimea. Russia could expand its offensive to Odessa and the Moldovan border. Or Russia could attempt to create a new norm of naval dominance in the Black Sea. Or ships from third countries could hit mines or become casualties of war. For these and other reasons, investors should not take on additional risk in their portfolios on the basis that a durable ceasefire will be concluded quickly. Russia’s position is far too vulnerable to encourage risk-taking. Moscow could escalate tensions to try to save face. It is also critical to ensure that Russia and Europe maintain their energy trade: Neither side has an interest in total energy cutoff. Russia needs the revenue to finance its war and needs to discourage Europe from fulfilling its pledges to transition rapidly to other sources and substitutes. Europe needs the energy to avoid recession, maintain some tie with Russia, and enable its energy diversification strategy. So far natural gas flows are continuing (Chart 4). Chart 4Natural Gas Flows Continuing (So Far)
Natural Gas Flows Continuing (So Far)
Natural Gas Flows Continuing (So Far)
Chart 5Global Oil Supply/Demand Balance
Global Oil Supply/Demand Balance
Global Oil Supply/Demand Balance
However, risks to energy trade are rising. Russia is threatening to cut off energy exports if not paid in rubles, while the EU is beginning to entertain sanctions on energy. Russia can reduce oil or gas flows incrementally to keep prices high and prevent Europe from rebuilding stockpiles for fall and winter. Partial energy cutoff is possible. Europe’s diversification makes Russia’s predicament dire. Substantial sanction relief is highly unlikely, as western powers will want to prevent Russia from rebuilding its economy and military. Russia could try to impose significant pain on Europe to try to force a more favorable diplomatic solution. A third factor that matters is whether the US will expand its sanction enforcement to demand strict compliance from other nations, at pain of secondary sanctions: Secondary sanctions are likely in the case of China and other nations that stand at odds with the US and help Russia circumvent sanctions. In China’s case, the US is already interested in imposing sanctions on the financial or technology sector as part of its long-term containment strategy. While the Biden administration’s preference is to control the pace of escalation with China, and thus not to slap sanctions immediately, nevertheless substantial sanctions cannot be ruled out in the second quarter. Secondary sanctions will be limited in the case of US allies and partners, such as EU members, Turkey, and India. Countries that do business with Russia but are critical to US strategy will be given waivers or special treatment. Russia is not the only commodity producer that enjoys outsized geopolitical leverage amid a global commodity squeeze. Iran is the next most critical producer. Iran is also critical for the stability of the Middle East. In particular, the consequential US-Iran talks over whether to rejoin the 2015 nuclear deal are likely to come to a decision in the second quarter. Chart 6Failure Of US-Iran Talks Jeopardizes Middle East Oil Supply
Failure Of US-Iran Talks Jeopardizes Middle East Oil Supply
Failure Of US-Iran Talks Jeopardizes Middle East Oil Supply
If the US and Iran agree to a strategic détente, then regional tensions will briefly subside, reducing global oil disruption risks and supply pressures. Iran could bring 1.3 million barrels per day of oil back online, adding to President Biden’s 1 million per day release of strategic petroleum reserves. The combination would amount to 2.3% of global demand and more than cover the projected quarterly average supply deficit, which ranges from 400k to 900k barrels per day for the rest of 2022 (Chart 5). If the US and Iran fail to agree, then the Middle East will suffer another round of instability, adding a Middle Eastern energy shock on top of the Russian shock. Not only would Iran’s 1.3 million barrels per day be jeopardized but so would Iraq’s 4.4 million, Saudi Arabia’s 10.3 million, the UAE’s 3.0 million, or the Strait of Hormuz’s combined 24 million per day (Chart 6). This gives Iran leverage to pursue nuclear weaponization prior to any change in US government that would strengthen Israel’s ability to stop Iran. We would not bet on an agreement – but we cannot rule it out. The Biden administration can reduce sanctions via executive action to prevent a greater oil shock, while the Iranians can accept sanction relief in exchange for easily reversible moves toward compliance with the 2015 nuclear deal. But this would be a short-term, stop-gap measure, not a long-term strategic détente. Conflict between Iran and its neighbors will revive sooner than expected after the deal is agreed, as Iran’s nuclear ambitions will persist. OPEC states are already producing more oil rapidly, suggesting no quick fix if the US-Iran deal falls apart. While core OPEC states have 3.5 million barrels per day in spare capacity to bring to bear, a serious escalation of tensions with Iran would jeopardize this solution. Finally, if commodity producers have geopolitical leverage, then commodity consumers are lacking in leverage. This is clear from Europe’s inability to prevent Russia’s attack or ban Russian energy. It is clear from the US’s apparent unwillingness to give up on a short-term deal with Iran. It is clear from China’s inability to provide sufficient monetary and fiscal stimulus as it struggles with Covid-19. Turkey, Egypt, and Pakistan are geopolitically significant importers of Russian and Ukrainian grain that are likely to face food insecurity and social unrest. We will address this issue below under our Populism/Nationalism theme. Bottom Line: Investors should not be complacent. Russia’s military standing in Ukraine is weak, but its ability to finance the war has not yet collapsed, which means that it will escalate the conflict to save face. What About Our Other Key Views For 2022? Our other two key views for 2022 are even more relevant in the wake of the Ukraine re-invasion. China’s reversion to autocracy is a factor in China’s domestic and foreign policy: Domestically China needs economic and social stability in the advance of the twentieth national party congress, when President Xi Jinping hopes to clinch 10 more years in power. In pursuit of this goal China is easing monetary and fiscal policy. However, with depressed animal spirits, a weakening property sector, and high debt levels, monetary policy is proving insufficient. Fiscal policy will have to step up. But even here, inflation is likely to impose a limitation on how much stimulus the authorities can utilize (Chart 7). Chart 7China Stimulus Impaired By Inflation
China Stimulus Impaired By Inflation
China Stimulus Impaired By Inflation
Chart 8Chinese Supply Kinks To Persist Due To Covid-19
Chinese Supply Kinks To Persist Due To Covid-19
Chinese Supply Kinks To Persist Due To Covid-19
China is also trying but failing to maintain a “Covid Zero” policy. The more contagious Omicron variant of the virus is breaking out and slipping beyond the authorities’ ability to suppress cases of the virus to zero. Shanghai is on lockdown and other cities will follow suit. China will attempt to redouble its containment efforts before it will accept the reality that the virus cannot be contained. Chinese production and shipping will become delayed and obstructed as a result, putting another round of upward pressure on global prices (Chart 8). Stringent pandemic restrictions could trigger social unrest. China is ripe for social unrest, which is why it launched the “Common Prosperity” program last year to convince citizens that quality of life will improve. But this program is a long-term program that will not bring immediate relief. On the contrary, the economy is still suffering and the virus will spread more widely, as well as draconian social restrictions. The result is that the lead up to the national party congress will not be as smooth as the Xi administration had hoped. Global investors will remain pessimistic toward Chinese stocks. In foreign affairs, China’s reversion to autocracy is reinforced by Russia’s clash with the West and the need to coordinate more closely. Xi hosted Putin in Beijing on February 4, prior to the invasion, and the two declared that their strategic partnership ushers in a “new era” of “multipolarity” and that their cooperation has “no limits,” which really means that military cooperation is not forbidden. China agreed to purchase an additional 10 billion cubic meters of Russian natural gas over 30-years. While this amount would only replace 3% of Russian natural gas exports to Europe, it would mark a 26% increase in Russian exports to China. More importantly it acts as a symbol of Chinese willingness to substitute for Europe over time. There is a long way to go for China to replace Europe as a customer (Chart 9). But China knows it needs to convert its US dollar foreign exchange reserves, vulnerable to US sanctions, into hard investments in supply security within the Eurasian continent. Chart 9Long Way To Go For China NatGas Imports To Replace EU
Second Quarter Outlook 2022: When It Rains, It Pours
Second Quarter Outlook 2022: When It Rains, It Pours
China is helping Russia circumvent sanctions. China’s chief interest is to minimize the shock to its domestic economy. This means keeping Russian energy and commodities flowing. China could also offer military equipment for Russia. The US has expressly warned China against taking such an action. China could mitigate the blowback by stipulating that the assistance cannot be used in Ukraine. This would be unenforceable but would provide diplomatic cover. While China is uncomfortable with the disturbance of the Ukraine war – it does not want foreign affairs to cause even larger supply shocks. At the same time, China does not want Russia to lose the war or Putin’s regime to fall from power. If Russia loses, Taiwan and its western allies would be emboldened, while Russia could pursue a détente with the West, leaving China isolated. Since China faces US containment policy regardless of what happens in Russia, it is better for China to have Putin making an example out of Ukraine and keeping the Americans and Europeans preoccupied. Chart 10China Strives To Preserve EU Trade Ties
China Strives To Preserve EU Trade Ties
China Strives To Preserve EU Trade Ties
China must also preserve ties with Europe. Diplomacy will likely succeed in the short run since Europe has no interest or desire to expand sanctions to China. The Biden administration will defer to Europe on the pace of sanctions – it is not willing or able to force Europe to break with China suddenly. Eventually Europe and China may sever relations but not yet – China has a powerful incentive to preserve them (Chart 10). China will also court India and other powers in an attempt to hedge its bets on Russia while weakening any American containment. Beyond the party congress, China will be focused on securing the economic recovery and implementing the common prosperity agenda. The first step is to maintain easy monetary and fiscal policy. The second step is to “let 100 flowers bloom,” i.e. relaxing social and regulatory controls to try to revive entrepreneurship and animal spirits, which are heavily depressed. Xi will have the ability to do this after re-consolidating power. The third step will be to try to stabilize economic relations with Europe and others (conceivably even the US temporarily, though no serious détente is likely). The remaining key view for 2022 is that the Biden administration’s domestic focus will be defensive and will invite foreign policy challenges. The Ukraine war vindicates this view but the question now is whether Biden has or will change tack: The Biden administration is focused on the midterm elections and the huge risk to the Democratic Party’s standing. Biden has not received a boost in opinion polls from the war. He is polling even worse when it comes to handling of the economy (Chart 11). While he should be able to repackage his budget reconciliation bill as an energy security bill, his thin majorities in both houses make passage difficult. Chart 11Biden And Democrats Face Shellacking In Midterm Election
Second Quarter Outlook 2022: When It Rains, It Pours
Second Quarter Outlook 2022: When It Rains, It Pours
Biden’s weak standing – with or without a midterm shellacking – raises the prospect that Republicans could take back the White House in 2024, which discourages foreign nations from making any significant concessions to the United States in their negotiations. They must assume that partisanship will continue to contaminate foreign policy and lead to abrupt policy reversals. In foreign policy, the US remains reactive in the face of Russian aggression. If Russia signs a ceasefire, the US will not sabotage it to prolong Russian difficulties. Moreover Biden continues to exempt Europe and other allies and partners from enforcing the US’s most severe sanctions for fear of a larger energy shock. Europe’s avoidance of an energy ban is critical and any change in US policy to try to force the EU to cut off Russian energy is unlikely. China will not agree to structural reform or deep concessions in its trade negotiations, knowing that former President Trump could come back. The Biden administration’s own trade policy toward China is limited in scope, as the US Trade Representative Katherine Tai admitted when she said that the US could no longer aim to change China’s behavior via trade talks. Biden’s only proactive foreign policy initiative, Iran, will not bring him public kudos if it is achieved. But American inconstancy is one of the reasons that Iran may walk away from the 2015 nuclear deal. Why should Iran’s hawkish leaders be expected to constrain their nuclear program and expose their economy to future US sanctions if they can circumvent US sanctions anyway, and Republicans have a fair chance of coming back into power as early as January 2025? Biden’s unprecedented release of strategic petroleum reserves will not be able to prevent gasoline prices from staying high given the underlying supply pressures at home and abroad. This is especially true if the Iran talks fail as we expect. Even if inflation abates before the election, it is unlikely to abate enough to save his party from a shellacking. That in turn will weaken the global impression of his administration’s staying power. Hence Biden will focus on maintaining US alliances, which means allowing Europe, India, and others to proceed at a more pragmatic and dovish pace in their relations with Russia and China. Bottom Line: China’s reversion to autocracy and America’s policy insularity suggest that global investors face considerable policy uncertainty this year even aside from the war in Europe. Checking Up On Our Strategic Themes For The 2020s Russia’s invasion strongly confirmed our three strategic themes of Great Power Rivalry, Hypo-Globalization, and Populism/Nationalism. These themes are mutually reinforcing: insecurity among the leading nation-states encourages regionalization rather than globalization, while populism and nationalism encourage nations to pursue economic and security interests at the expense of their neighbors. First, the Ukraine war confirms and exacerbates Great Power Rivalry: Chart 12China And Russia Both Need To Balance Against US Preponderance
Second Quarter Outlook 2022: When It Rains, It Pours
Second Quarter Outlook 2022: When It Rains, It Pours
Russia’s action vindicates the “realist” school of international relations (in which we count ourselves) by forcing the world to wake up to the fact that nations still care primarily about national security defined in material ways, such as armies, resources, and territories. The paradox of realism is that if at least one of the great nations pursues its national self-interest and engages in competition for security, then all other nations will be forced to do the same. If a nation neglects its national security interests in pursuit of global economic engagement and cooperation, then it will suffer, since other nations will take advantage of it to enhance their security. Hence, as a result of Ukraine, nations will give a higher weight to national security relative to economic efficiency. The result will be an acceleration of decisions to use fiscal funds and guide the private economy in pursuit of national interests – i.e. the Return of Big Government. Since actions to increase deterrence will provoke counteractions for the same reason, overall insecurity will rise. For example, the US and China will take extra precautions in case of future sanctions and war. But these precautions will reduce trust and cooperation and increase the probability of war over the long run. For the same reason, China cannot reject Russia’s strategic overture – it cannot afford to alienate and isolate Russia. China and Russia have a shared interest in countering the United States because it is the only nation that could conceivably impose a global empire over all nations (Chart 12). The US could deprive Beijing and Moscow of the regional spheres of influence that they each need to improve their national security. This is true not only in Ukraine and Taiwan but in other peripheral areas such as Belarus, the Caucasus, Central Asia, and Southeast Asia. China has much to gain from Russia. Russia is offering China privileged overland access to Russian, Central Asian, and Middle Eastern resources and markets. This resource base is vital to China’s strategic needs, given its import dependency and vulnerability to US maritime power (Chart 13). Chart 13China’s Maritime Vulnerability Forces Eurasian Strategy, Russian Alliance
Second Quarter Outlook 2022: When It Rains, It Pours
Second Quarter Outlook 2022: When It Rains, It Pours
Investors should understand Great Power Rivalry in a multipolar rather than bipolar sense. As Russia breaks from the West, investors are quick to move rapidly to the bipolar Cold War analogy because that is what they are familiar with. But the world today has multiple poles of political power, as it did for centuries prior to the twentieth. While the US is the preponderant power, it is not hegemonic. It faces not one but two revisionist challengers – Russia and China. Meanwhile Europe and India are independent poles of power that are not exclusively aligned with the US or China. For example, China and the EU need to maintain economic ties with each other for the sake of stability, and neither the US nor Russia can prevent them from doing so. The same goes for India and Russia. China will embrace Russia and Europe at the same time, while hardening its economy against US punitive measures. India will preserve ties with Russia and China, while avoiding conflict with the US and its allies (the maritime powers), whom it needs for its long-term strategic security in the Indian Ocean basin. Ultimately bipolarity may be the end-game – e.g. if China takes aggressive action to revise the global order like Russia has done – but the persistence of Sino-European ties and Russo-Indian ties suggest we are not there yet. Second, the Ukraine war reinforces Hypo-Globalization: Since the pandemic we have argued that trade would revive on the global economic snapback but that globalization – the deepening of trade integration – would ultimately fall short of its pre-2020 and pre-2008 trajectory. Instead we would inhabit a new world of “hypo-globalization,” in which trade flows fell short of potential. So far the data support this view (Chart 14). Chart 14Globalization Falling Short Of Potential
Second Quarter Outlook 2022: When It Rains, It Pours
Second Quarter Outlook 2022: When It Rains, It Pours
The Ukraine war has strengthened this thesis not only by concretely reducing Russia’s trajectory of trade with the West – reversing decades of integration since the fall of the Soviet Union – but also by increasing the need for nations to guard against a future Chinese confrontation with the Western world. Trust between China and the West will further erode. China will need to guard against any future sanctions, and thus diversify away from the US dollar and assets, while the US will need to do a better job of deterring China against aggression in Asia, and will thus have to diversify away from Chinese manufacturing and critical resources like rare earths. While China and Europe need each other now, the US and China are firmly set on a long-term path of security competition in East Asia. Eventually either the US or China will take a more aggressive stance and Europe will be forced to react. Since Europe will still need US support against a decaying and aggressive Russia, it will likely be dragged into assisting the US against China. Third, the Ukraine war reflects and amplifies Populism/Nationalism: Populism and nationalism are not the same thing but they both stem from the slowing trend of global income growth, the rise of inequality, the corruption of the elite political establishments, and now the rise in inflation. Nations have to devote more resources to pacifying an angry populace, or distracting that populace through foreign adventures, or both. The Ukraine war reflects the rise in nationalism. First, the collapse of the Soviet Union ushered in a period in which Moscow lost control of its periphery, while the diverse peoples could pursue national self-determination and statehood. The independence and success of the Baltic states depended on economic and military cooperation with the West, which eroded Russian national security and provoked a nationalist backlash in the form of President Putin’s regime. Ukraine became the epicenter of this conflict. Ukraine’s successful military resistance is likely to provoke a dangerous backlash from Moscow until either policy changes or the regime changes. American nationalism has flared repeatedly since the fall of the Soviet Union, namely in the Iraq war. The American state has suffered economically and politically for that imperial overreach. But American nationalism is still a potent force and could trigger a more aggressive shift in US foreign policy in 2024 or beyond. European states have kept nationalism in check and tried to subsume their various nationalist sentiments into a liberal and internationalist project, the European Union. The wave of nationalist forces in the wake of the European debt crisis has subsided, with the exception of the United Kingdom, where it flowered in Brexit. The French election in the second quarter will likely continue this trend with the re-election of President Emmanuel Macron, but even if he should suffer a surprise upset to nationalist Marine Le Pen, Europe’s centripetal forces will prevent her from taking France out of the EU or euro or NATO (Chart 15). Over the coming decade, nationalist forces will revive and will present a new challenge to Europe’s ruling elites – but global great power competition strongly supports the EU’s continued evolution into a single geopolitical entity, since the independent states are extremely vulnerable to Russia, China, and even the US unless they unite and strengthen their superstructure. Chart 15Macron Favored, Le Pen Would Be Ineffective
Macron Favored, Le Pen Would Be Ineffective
Macron Favored, Le Pen Would Be Ineffective
In fact the true base of global nationalism is migrating to Asia. Chinese and Indian nationalism are very potent forces under President Xi Jinping and Prime Minister Narendra Modi. Xi is on the verge of clinching another ten years in power while Modi is still favored for re-election in 2024, so there is no reason to anticipate a change anytime soon. The effects are various but what is most important for investors is to recognize that as China’s potential GDP has fallen over the past decade, the Communist Party has begun to utilize nationalism as a new source of legitimacy, and this is expressed through a more assertive foreign policy. President Xi is the emblem of this shift and it will not change, even if China pursues a lower profile over certain periods to avoid provoking the US and its allies into a more effective coalition to contain China. Chart 16Food Insecurity Will Promote Global Unrest, Populism
Food Insecurity Will Promote Global Unrest, Populism
Food Insecurity Will Promote Global Unrest, Populism
The surge in global prices will destabilize regimes that lack food security and contribute to new bouts of populism and nationalism. Turkey is the most vulnerable due to a confluence of political, economic, and military risks that will unsettle the state. But Egypt is vulnerable to an Arab Spring 2.0 that would have negative security implications for Israel and add powder to the Middle Eastern powder keg. Pakistan is already witnessing political turmoil. Investors may overlook any Indonesian unrest due to its attractiveness in a world where Russia and China are scaring away western investment (Chart 16). All three of these strategic themes are mutually reinforcing – and they tend to be inflationary over the long run. Great powers that redouble the pursuit of national interest – through defense spending and energy security investments – while simultaneously being forced to expand their social safety nets to appease popular discontent, will drive up budget deficits, consume a lot of natural resources, and purchase a lot of capital equipment. They will also more frequently engage in economic or military conflicts that constrain supply (Chart 17). Chart 17War And Preparation For War Are Inflationary
War And Preparation For War Are Inflationary
War And Preparation For War Are Inflationary
Bottom Line: The Ukraine war is a powerful confirmation of our three strategic themes. It is also a confirmation that these themes have inflationary macroeconomic implications. Investment Takeaways Chart 18Global Investors Still Flee To US For Safety
Global Investors Still Flee To US For Safety
Global Investors Still Flee To US For Safety
Now that great power rivalry is intensifying immediately and rapidly, and yet China’s and Europe’s economies are encountering greater difficulties, we expect stagflation to arrive sooner rather than later. High headline and core inflation, the Ukraine war, tacit Chinese support for Russia, persistent Chinese supply kinks, US and EU sanctions, US midterm elections, and a potential US-Iran diplomatic breakdown will all weigh on risk sentiment in the second quarter. In Ukraine, Russia’s position is too weak to give comfort for investors, who should continue to favor defensive over cyclical equities and US stocks over global stocks. Russia’s break with the West, and the West’s use of sanctions to prevent Russia from accessing its foreign exchange reserves, has raised new questions about the global currency reserve system and the dollar’s status within that system. Over the coming years China will redouble the efforts it began in the wake of the Great Recession to reduce its dependency on US dollar assets within its reserve basket, while also recycling new current account surpluses into non-dollar assets. However, the evidence does not suggest that King Dollar will suffer a structural breakdown. First, the world lacks alternative safe-haven assets to US Treasuries – and net foreign purchases of US bonds rose in the face of the Ukraine war (Chart 18). Second, the return of war to Europe will weaken the perceived long-term security of European currency and government bonds relative to US counterparts. Even if the Ukraine war is contained in the short run, as we expect, Russia is in structural decline and will remain a disruptive player for some time. We are not at all bearish on the euro or European bonds but we do not see the Ukraine war as increasing their value proposition, to put it lightly. The same logic extends to Japanese bonds, since China, like Russia, is an autocratic and revisionist state that threatens to shake up the security order in its neighborhood. Japan is relatively secure as a nation and we are bullish on the yen, but China’s de facto alliance with Russia weakens Japan’s security outlook over the very long run, especially relative to the United States. Thus, on a cyclical basis the dollar can depreciate, but on a structural basis the US dollar will remain the dominant reserve currency. The US is not only the wealthiest and most secure country in the world but also the largest oil producer. Meanwhile Chinese potential growth, domestic political stability, and foreign relations are all worsening. The US-Iran talks are the most critical geopolitical dynamic in the second quarter aside from Russia’s clash with the West. The fate of the 2015 nuclear deal will be decided soon and will determine whether an even bigger energy shock begins to emanate from the Middle East. We would not bet on a new US-Iran deal but we cannot rule it out. Any deal would be a short-term, stop-gap deal but would prevent an immediate destabilization of the Middle East this year. As such it would reduce the risk of stagflation. Since we expect the deal to fail, we expect a new energy shock to emerge. We see stagflation as more likely than the BCA House View. It will be difficult to lift productivity in an environment of geopolitical and political uncertainty combined with slowing global growth, rising interest rates, and a worsening commodity shock (Chart 19). We will gladly revise this stance if Biden clinches an Iran deal, China relaxes its Covid Zero policy and stabilizes domestic demand, Russia and Europe maintain energy trade, and commodity prices fall to more sustainable levels for global demand. Chart 19Stagflation Cometh
Stagflation Cometh
Stagflation Cometh
Strategically we remain long gold, overweight US equities, overweight UK equities, long British pound and Japanese yen, long aerospace/defense stocks and cyber security stocks. We remain short Chinese renminbi and Taiwanese dollar and short emerging European assets. Our short Chinese renminbi trade and our short Taiwanese versus Korean equity trade are our worst-performing recommendations. However, the above analysis should highlight – and the Ukraine war should underscore – that these two economies face a fundamentally negative geopolitical dynamic. Both Chinese and Taiwanese stocks have been underperforming global peers since 2021 and our short TWD-USD trade is in the money. While we do not expect war to break out in Taiwan this year, we do expect various crisis events to occur, particularly in the lead up to the crucial Taiwanese and American 2022 midterms and 2024 presidential election. We also expect China to depreciate the renminbi when inflation peaks and commodity prices subside. Cyclically we remain long North American and Latin American oil producers and short Middle Eastern producers, based on our pessimistic read of the Iran situation. The Americas are fundamentally better protected from geopolitical risks than other regions, although they continue to suffer from domestic political risks on a country-by-country basis. Cyclically we continue to take a defensive positioning, overweighting defensive sectors and large cap equities. Matt Gertken Chief Geopolitical Strategist mattg@bcaresearch.com Footnotes 1 That the Russian threat fell under our third key view for 2022 implies that we did not get our priorities straight. However, consider the timing: shortly after publishing our annual outlook on December 15, the Russians issued an ultimatum to the western powers demanding that NATO stop expanding toward Russia. Diplomats from Russia and the West met on January 12-13 but Russia’s demands were not met. We upgraded the odds that Russia would invade Ukraine from 50% to 75% on January 27. Shuttle diplomacy ensued but failed. Russia invaded on February 24. Strategic Themes Open Tactical Positions (0-6 Months) Open Cyclical Recommendations (6-18 Months) Regional Geopolitical Risk Matrix "Batting Average": Geopolitical Strategy Trades () Section II: Special (EDIT this Header) Section III: Geopolitical Calendar
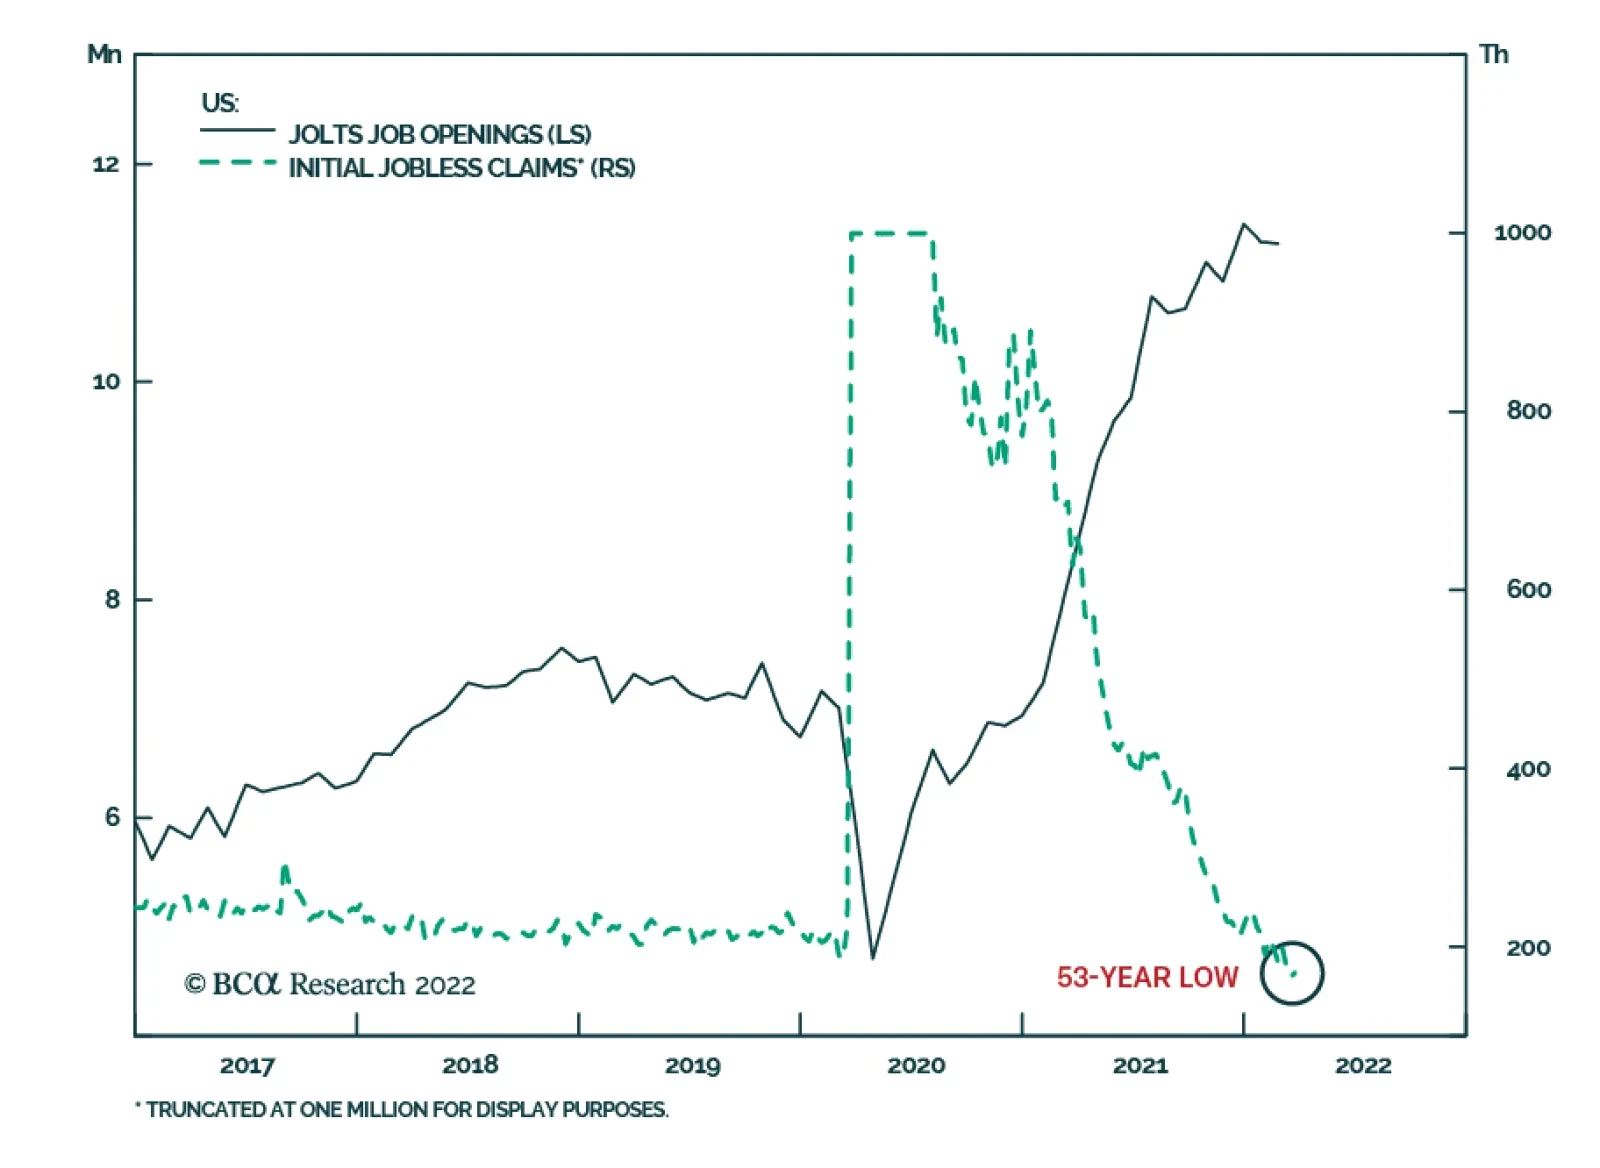
US initial jobless claims dropped by 5 thousand to 166 thousand in the week ended April 2. This marks the lowest level of jobless claims since November 1968 and is below expectations of 200 thousand. Moreover, the prior week’s number was revised down…
Executive Summary Fed policy and the US stock market are on a collision course. US core inflation will not fall below 3.5% unless the economy slows considerably below its potential for a few quarters. As long as US share prices do not fall considerably, i.e., financial conditions do not tighten substantially, the Fed has no reason to halt its tightening and revert its hawkish posture. Odds are that US profit margins and equity multiples will compress, leading to lower share prices in the coming months. In China, monetary and fiscal stimulus have so far been insufficient to produce an economic recovery given the headwinds from the property sector and the rolling lockdowns. A broad-based EM rally will occur only when a commodity bull market is demand driven. The recent spike in commodity prices has been due to supply curtailment. Unit Labor Costs Are The Key To Core Inflation
Unit Labor Costs Are The Key To Core Inflation
Unit Labor Costs Are The Key To Core Inflation
Bottom Line: Maintain an underweight position in EM equities and credit in global equity and credit portfolios, respectively. EM local currency bonds are becoming attractive. We are waiting to buy EM local bonds later this year using the potential weakness in their currencies. After a two-year hiatus, I traveled to the US last week for in-person meetings with clients. This report summarizes the key questions and points of discussion that emerged during these exchanges. Question: What are the key risks to EM markets at the moment? Answer: First, Fed policy and the US stock market are on a collision course. This is in fact a threat to global risk assets – not just US ones. Second, rolling lockdowns in China and the property market slump will delay the recovery of the mainland economy. Third, after the latest rebound in risk assets, geopolitical risks are underestimated. Before the situation in Ukraine stabilizes, President Putin will likely escalate the conflict to obtain a better negotiating position. The combination of these three risks warrants a cautious stance on EM assets. Chart 1The 1960s: US Inflation Outbreak And Negative Stock Price-To-Bond Yield Correlation
The 1960s: US Inflation Outbreak And Negative Stock Price-To-Bond Yield Correlation
The 1960s: US Inflation Outbreak And Negative Stock Price-To-Bond Yield Correlation
Question: Let’s start with the Fed. Why do you think US share prices and the Fed are on a collision course? Historically, there were episodes during which the S&P 500 rallied even though the Fed was hiking rates. Why is this time different? Answer: Extremely elevated US core inflation, rising inflation expectations as well as very expensive equity valuations make this current episode different from those periods in the 1990s, 2000s and even 2010s when US equities advanced amid Fed tightening. In fact, share prices and bond yields were negatively correlated for 30 years between 1966 and 1997. The current episode is reminiscent of the late 1960s when core inflation spiked, and equity prices became negatively correlated with Treasury yields (Chart 1). As to the interaction between the Fed and financial markets, our reasoning is as follows: As long as US share prices do not fall and US credit spreads do not widen considerably, i.e., financial conditions do not tighten substantially, then the Fed has no reason to halt its tightening and revert its hawkish posture. The basis is that US core inflation is well above target, and inflation expectations are ratcheting up and could become entrenched. Question: Do you expect US inflation to moderate and in turn allow the Fed to go on hold? Answer: Investors and policymakers should differentiate between the annual inflation rate (a statistical measure) and a genuine inflation outbreak. The annual inflation rate is too high, and will likely drop in H2 this year. Chart 2Super Core US Consumer Inflation Is At 5%
Super Core US Consumer Inflation Is At 5%
Super Core US Consumer Inflation Is At 5%
However, US inflationary pressures are genuine and broad-based. If these pressures are not contained, they will spiral out of control. Our measure of US average core inflation is currently around 5% (Chart 2). This series is an average of seven measures of core consumer price inflation from the Fed: core CPI and PCE, median CPI, market-based core PCE, trimmed-mean CPI and PCE, and sticky core CPI. Hence, this measure is not influenced by price movements of individual components. The annual rate of core CPI will drop in the US but we do not expect core CPI and PCE to fall below 3.5% unless the economy slows considerably below its potential for a few quarters, and labor market conditions deteriorate leading to lower wage growth. The reasoning is that underlying inflationary pressures have spilled over into the labor market, and the wage-price spiral has probably unraveled. Therefore, inflation cannot be contained without bringing economic growth down below potential growth and weakening the labor market. Chart 3US Wage Growth Is Between 4.3% and 7.7%
US Wage Growth Is Between 4.3% and 7.7%
US Wage Growth Is Between 4.3% and 7.7%
The labor market is presently very tight, and wage growth will continue accelerating. Given that real wages have shrunk dramatically in the past 12 months, labor will be demanding wage increases that are on par or above the inflation rate. With sales still strong, companies will have to pay higher wages to maintain and attract skilled employees. US nominal wage growth is presently ranging between 4.3-7.7%, depending on the measure (Chart 3). With US underlying productivity growth unlikely to be more than 2% at best, unit labor costs are therefore rising at a rate of 2.5-5.5% and will accelerate further. Chart 4 illustrates that unit labor costs have been a major driver of core consumer price inflation in the US over the past 60 years. If unit labor costs accelerate, core inflation will not drop much from its current elevated levels. As core inflation proves to be sticky and does not fall rapidly below 3.5%, the Fed will have no choice but to keep raising interest rates… until something breaks. Chart 4Unit Labor Costs Are The Key To Core Inflation
Unit Labor Costs Are The Key To Core Inflation
Unit Labor Costs Are The Key To Core Inflation
Question: What will be the first thing to break? Do you think Fed rate hikes will push the US economy into recession? Answer: Equity markets will be the first to break. It is hard to make a judgement about whether US real GDP will contract, but odds are high that US/global share prices will drop as the Fed tightens. The S&P 500 can drop 20-25% from its early January high without a recession in the American economy. Drivers of this selloff will be compressing equity multiples and shrinking profit margins. Chart 5Rising Rates = Lower Equity Multiples
Rising Rates = Lower Equity Multiples
Rising Rates = Lower Equity Multiples
First, there are three drivers of equity returns – the top line, profit margins and valuation multiples. We believe that two of these three – profit margins and multiples – will be negative for the US market in the coming months. Valuation multiples will compress as US interest rates rise further (Chart 5). Profit margins will shrink as wage growth accelerates well above productivity gains, i.e., unit labor costs spike. Even if corporates’ top-line growth stays robust, the negative impact of compressing valuation multiples and lower profit margins will be overwhelming for equities. Hence, corporate profits could shrink mildly and share prices would drop materially even as real GDP does not contract. Second, it is important to mention that equity returns could be negative outside reccessions. Let’s recall what happened in 2000-2001 in the US. Nominal growth was robust, real GDP contracted only slightly, household spending in real terms did not contract at all, and the housing market was booming (Chart 6, top panel). Yet, the S&P 500 EPS plunged by 30% and the stock index was down by 50% (Chart 6, bottom two panels). We do not mean that US profits are about to crash by 30% and share prices will plunge by 50% like they did in the bear market of 2000-2002. The point is that profits could experience a mild contraction despite solid consumer spending. Chart 6S&P 500 EPS Can Shrink Even If Nominal GDP Growth Is Solid, As Happened In 2001
S&P 500 EPS Can Shrink Even If Nominal GDP Growth Is Solid, As Happened In 2001
S&P 500 EPS Can Shrink Even If Nominal GDP Growth Is Solid, As Happened In 2001
Chart 7US Real Consumption Of Goods: A Mean Reversion Ahead?
US Real Consumption Of Goods: A Mean Reversion Ahead?
US Real Consumption Of Goods: A Mean Reversion Ahead?
Third, there is chance of a stagflation scare. US purchases of goods ex-autos have been extremely strong due to generous fiscal transfers to households and pandemic dynamics that discouraged service spending and boosted goods purchases. Americans’ real spending on goods ex-autos has been running well above its pre-pandemic trend and is likely to experience some sort of mean reversion (Chart 7). A shift in consumption away from goods ex-autos will weigh down on goods producers globally. Notably, manufacturers rather than service providers dominate equity markets outside the US. Hence, a period when US inflation is sticky, and the Fed is tightening while the global manufacturing cycle is slowing is a possibility. This will upset investors and lead them to pare back their equity holdings. Question: As we all know, the US dollar is very important for EM economies and financial markets. So, what is the outlook for the greenback? Answer: As long as the Fed sounds hawkish and continues tightening, the US dollar will strengthen. The motive is that when the central bank is willing to tighten and the economy does not collapse, the currency tends to appreciate. Even as the S&P 500 sells off, the risk-off phase is also positive for the US currency. The trade-weighted dollar will put a major top and will start depreciating only when the Fed does a dovish tilt. Odds are that this will take place later this year when the S&P 500 is down 25% or so. Yet, US inflation will still be entrenched. In other words, the Fed will fall behind the inflation curve. A central bank falling behind the inflation curve is bearish for the currency. Chart 8Mainstream EM Currencies: An Air Pocket?
Mainstream EM Currencies: An Air Pocket?
Mainstream EM Currencies: An Air Pocket?
Concerning mainstream EM (excluding China, Korea and Taiwan) currencies, the total return index (including carry) versus the US dollar has hit a technical resistance (Chart 8). We expect a near-term relapse in EM exchange rates as a mirror image of US dollar strength and the risk-off trade in global markets. However, a major buying opportunity in EM currencies and fixed-income markets as well as EM equity markets will transpire later this year when the US dollar peaks. Question: Let’s turn to China. Growth continues to be disappointing. The COVID-related lockdowns are depressing economic activity. Have authorities stimulated enough for the business cycle to recover soon? Answer: We believe that monetary and fiscal stimulus have so far been insufficient to produce a major economic recovery given the headwinds from the property sector and the harsh lockdowns. The enacted fiscal stimulus is sizable (Chart 9), but it has not yet fully entered the economy. On the monetary front, the credit impulse – excluding local government bond issuance (which is counted in our fiscal spending impulse) – has not yet bottomed (Chart 10). Chart 9China's Fiscal Stimulus Is In The Pipeline
China's Fiscal Stimulus Is In The Pipeline
China's Fiscal Stimulus Is In The Pipeline
Chart 10China: Corporate and Household Credit Impulse Has Not Bottomed Yet
China: Corporate and Household Credit Impulse Has Not Bottomed Yet
China: Corporate and Household Credit Impulse Has Not Bottomed Yet
With rolling lockdowns impairing service employment and, hence, denting household income, and without sizable fiscal transfers to consumers, the economy will struggle to recover. Local government finances are squeezed by lack of revenues from land sales and their borrowing is limited by quotas set by the central government. So, only the central government is in a position to provide meaningful fiscal support to households, but it has not yet done so. Question: You mentioned that the current geopolitical climate remains a risk to financial markets as Putin will likely escalate before de-escalating. Is this not bullish for commodities? Also, you have argued over the years that commodity prices positively correlate with EM equity performance. Yet, there has been a major decoupling between commodity prices and EM equity absolute and relative performance (Chart 11). How do you explain this phenomenon? Chart 11Decoupling Between EM Stocks And Commodity Prices
Decoupling Between EM Stocks And Commodity Prices
Decoupling Between EM Stocks And Commodity Prices
Answer: Re-escalation on the part of the Kremlin will be bullish for commodities in the short run. In the medium term however, as we argued in a report in early March, commodity prices will be very volatile, with upside risks for some (like wheat) but not for all of them. It all depends on how much of its resource exports Russia can sell/ship abroad. It is hard to forecast this in view of sanctions by Western governments and their private sectors, as well as the breakdown in existing market infrastructures (such as payment systems, freight, insurance, etc.). The breakdown between commodity prices and EM absolute and relative share prices is due to the following: When commodity prices rise due to demand from the real economy, EM stocks tend to rally and outperform. This is especially true when it is China’s demand that is driving commodity prices higher. The reason is that China is important for overall EM economies, and robust demand growth in China is bullish for EM assets. In such a scenario (a demand-driven commodity bull market), not only do commodity producers rally (Latin America) but also commodity consumers (Asia) perform well in absolute terms. The recent spike in commodity prices has been due to supply curtailment rather than demand strength. That has benefited commodity producers (Latin America) but not commodity consumers (Asia). Finally, TMT stocks have come to make up a large share of EM markets in recent years. So wild swings in their performance have distorted the correlation between the EM equity index and commodity prices. Question: Will equity and currency markets of commodity producers continue rallying? Answer: The key signals to monitor are the trend in the US dollar and the global risk-on/risk-off environment. If a risk-off move transpires and the US dollar firms (as we expect), share prices and currencies in commodity-producing countries will relapse in absolute terms. Also, Chart 12 illustrates net long positions in ZAR, BRL and MXN among asset managers and leveraged funds are elevated. In short, investors are already very long, and these currencies could correct. Finally, the prices of some commodities for which Russia and Ukraine are not major producers, like platinum, have already been relapsing. In fact, platinum prices correlate well with EM non-TMT share prices in US dollar terms and are currently pointing to downside risks (Chart 13). Chart 12Investors Are Very Long EM Commodity Currencies
Investors Are Very Long EM Commodity Currencies
Investors Are Very Long EM Commodity Currencies
Chart 13Not All Commodity Prices Are Rising
Not All Commodity Prices Are Rising
Not All Commodity Prices Are Rising
Question: Could high food and energy prices heighten political risks in some developing countries? How serious is this risk? Answer: This risk has already manifested itself in some countries, with protests in Peru and the 15% devaluation in Egypt. More countries could experience public demonstrations and political turbulence. An overarching theme for many developing nations will be a drag on growth from high food and energy prices. Unlike the US, wages in emerging economies are not rising fast, and labor markets are not tight. As a result, employees have no bargaining power, and their wages will shrink in real terms (adjusted for headline inflation). Given that food and energy make up a larger share of the consumer basket in emerging economies, high energy and food prices will meaningfully reduce household income available for discretionary spending. Consequently, EM household spending will disappoint. In light of lackluster consumer demand, business investment will not pick up much either. Finally, monetary and fiscal policies in EM are reasonably tight. In Latin America, the credit and fiscal spending and monetary impulses are pointing to economic weakness ahead (Chart 14). Overall, potential political volatility and disappointing domestic demand are risks to EM financial markets. Chart 14Latin American Economies Will Decelerate
Latin American Economies Will Decelerate
Latin American Economies Will Decelerate
Chart 15A Buying Opportunity in EM Domestic Bonds Will Occur Later This Year
A Buying Opportunity in EM Domestic Bonds Will Occur Later This Year
A Buying Opportunity in EM Domestic Bonds Will Occur Later This Year
Question: What is your recommended investment strategy for EM overall and country allocation? Answer: We continue recommending an underweight position in EM equities and credit in global equity and credit portfolios, respectively. EM local currency bonds are becoming attractive as their yields have spiked (Chart 15). We are waiting to buy EM local bonds later this year using the potential weakness in their currencies. For now, we have the following positions in individual local rates: long 10-year Brazilian bonds, currency unhedged; receiving 10-year swap rates in China and Malaysia; betting on yield curve flattening in Mexico; receiving 10-year Czech / paying 10-year Polish swap rates. The list of country allocation for EM equity, credit and domestic bond portfolios is presented in Table 1. Table 1Our Country Allocation Across Asset Classes
What Are Clients Asking?
What Are Clients Asking?
Arthur Budaghyan Chief Emerging Markets Strategist arthurb@bcaresearch.com
What Are Clients Asking?
What Are Clients Asking?
What Are Clients Asking?
What Are Clients Asking?
Executive Summary Natgas Price Surge Boosts Hydrogen's Prospects
EU Gas Crisis Boosts Hydrogen's Prospects
EU Gas Crisis Boosts Hydrogen's Prospects
Russia's invasion of Ukraine and the surge in EU natural gas prices it provoked will accelerate investment in clean-hydrogen technology, which uses renewable energy to separate water into hydrogen and oxygen. This already has pushed the cost of clean – or "green" – hydrogen below the cost of competing forms of the fuel on the continent. Widespread adoption of carbon pricing will further enhance the attractiveness of green hydrogen, making it more competitive in transportation and refining applications. The cost of producing clean hydrogen in China also has fallen, owing to the competition for liquified natural gas (LNG) with the EU. Relatively low US natural gas prices are keeping the cost of green hydrogen above alternatives. The US DOE is prioritizing hydrogen development, and is funding research to reduce its cost from ~ $5/kg to $1/kg over the next 10 years. Falling clean-hydrogen costs raise the risk of stranded investment in natural-gas exploration and production. Bottom Line: The EU's drive to diversify away from Russian natural gas as quickly as possible will keep competition for scarce LNG between the EU and Asian markets high, as both bid for scarce supplies. This will redound to the benefit of clean hydrogen and its supporting technology, but might limit natgas E+P. Feature The war in Ukraine will keep the price of natural gas, particularly in its liquid state (LNG), elevated, as the EU and Asia compete for scarce supplies to refill inventories and prepare for the coming winter, along with keeping their heavy industries operating (Chart 1). In the Europe-Middle East-Africa (EMEA) markets and China, higher natgas prices, including LNG, already have lifted the cost of pulling hydrogen from natgas – so-called blue and grey hydrogen – above that of green (or "clean") hydrogen, which is produced by separating the hydrogen and oxygen in water via electrolysis. With natgas prices remaining elevated this year and next, investment in clean-hydrogen technology and its supporting infrastructure can be expected to increase. Government support for hydrogen as a clean fuel – i.e., research funding and tax support – will allow this technology to reach economies of scale and lower costs over the coming decade. Chart 1Russia's Invasion Of Ukraine Will Boost Hydrogen's Prospects
EU Gas Crisis Boosts Hydrogen's Prospects
EU Gas Crisis Boosts Hydrogen's Prospects
Related Report Commodity & Energy StrategySurging Metals Prices And The Case For Carbon-Capture Government policy can increase the advantage of green-hydrogen and other clean-energy technologies by adopting carbon-pricing schemes on a large scale, as well. Such schemes would assess actual – and avoidable – costs of pollution to incentivize investment in non-polluting technologies. We have argued in the past that this is best done via taxes that can provide revenues to support and fund the development of renewable energy. Ideally, such schemes would include mechanisms to offset the regressive nature of such taxes. Absent a tax, Carbon Clubs that impose tariffs or duties on states not abiding by carbon-reduction policies seeking to export to states that do employ such policies, as developed by William Nordhaus, would be useful.1 Ukraine War Improves Hydrogen Economics Governments supporting low- or zero-carbon emission technologies in their push to contain the rise in the Earth's temperature are focused on hydrogen, which, when consumed in a fuel cell, emits no pollution. Apart from being a fuel source, hydrogen also can be used to store energy. It can power electric grids when there is intermittent electricity supply, making it ideal as a back-up energy source for renewable-energy technologies – solar and wind, in particular – which, as the UK and Europe discovered last summer, can be extremely variable and unreliable. Based on its method of production, hydrogen is assigned a color – grey, blue, or green (Chart 2). In a nutshell: Chart 2Types of Hydrogen By Color
EU Gas Crisis Boosts Hydrogen's Prospects
EU Gas Crisis Boosts Hydrogen's Prospects
Grey hydrogen is produced when steam reacts with a hydrocarbon fuel (typically natural gas) to produce hydrogen via a process known as steam-methane reforming (SMR). The downside of this technology is it can result in CO2 and carbon escaping into the environment. Blue hydrogen is created by the same SMR process as grey hydrogen; however, carbon capture and storage (CCS) technology is added to the process to reduce carbon emissions from the steam and fuel reaction. Green hydrogen – aka "clean hydrogen" – is produced with electricity from renewables like wind or solar – in a process that separates water into oxygen and hydrogen via electrolysis. Electricity is the primary cost driver in the production of green hydrogen, followed by the elctrolyzers used to separate oxygen and hydrogen (Chart 3). For this reason, countries where renewable electricity is abundant will be ideal candidates for so-called clean hydrogen. Among renewables, wind and solar are the most developed, and cheapest sources of electricity (Chart 4). As a result, the International Renewable Energy Agency (IRENA) believes countries in the Middle East, Africa, and Oceania have the highest potential to become green hydrogen exporters.2 A constant electric load is crucial for efficient and cost-effective hydrogen production. Electrolyzers will either underperform or overheat if subjected to a variable electric load, reducing their lifespan, and hence increasing overall capital costs. This is yet another reason why countries with vast quantities of wind and solar energy will be at an advantage producing clean hydrogen. Chart 3Renewables Are Primary Cost For Green Hydrogen
EU Gas Crisis Boosts Hydrogen's Prospects
EU Gas Crisis Boosts Hydrogen's Prospects
Chart 4Cheap Wind And Solar Electricity Can Reduce Green Hydrogen Costs
EU Gas Crisis Boosts Hydrogen's Prospects
EU Gas Crisis Boosts Hydrogen's Prospects
Until now, deficient electrolyzer investment and production have resulted in high capital costs. Low innovation in the technology is due to a dearth of consumer demand due to the high prices, leading to a vicious cycle (Diagram 1). According to IRENA, increasing the manufacturing intensity of stacks – the primary component of the electrolyzer – could reduce the share of its cost from 45% to 30% of the total.3 Russia's invasion of Ukraine and the surge in EU natural gas prices it provoked will accelerate investment in green-hydrogen technology. The war already has pushed the cost of clean hydrogen below the cost of competing grey and blue forms of the fuel on the continent. We expect this will persist over the next two years, as the EU and Asia compete for scarce natural gas and LNG supplies going into the coming winter to rebuild depleted gas inventories, and to keep base metals smelters and refineries up and running. Diagram 1The Vicious Cycle Plaguing Hydrogen
EU Gas Crisis Boosts Hydrogen's Prospects
EU Gas Crisis Boosts Hydrogen's Prospects
The cost of grey hydrogen from natgas was ~ $6.70/kg last month vs a mid-point estimate of ~ $5.75/kg for green hydrogen in the Europe-Middle East-Africa (EMEA) markets.4 In China, green hydrogen was running at ~ $3.20/kg vs a grey cost of ~ $5.30/kg. The US is the outlier here, given its abundance of natural gas production. Grey hydrogen cost $1.20/kg, while green hydrogen was running at ~ $3.30/kg. It is difficult to determine whether green hydrogen will remain cheaper than blue in the EMEA and China markets. Under normal conditions – absent highly backwardated fuel markets – blue hydrogen is considered a bridge to the green variant, since it only builds on the incumbent grey hydrogen production process and is cheaper (Chart 5). Approximately 90% of total hydrogen produced annually is grey. If the EU is forced to ration natgas – Germany, e.g., is preparing its population for such a contingency in the event Russian supplies are shut off – reduced fuel availability will act as a hard constraint for blue-hydrogen production. This would prolong green-hydrogen's cost advantage. Chart 5Green Hydrogen Typically Most Expensive Hue
EU Gas Crisis Boosts Hydrogen's Prospects
EU Gas Crisis Boosts Hydrogen's Prospects
That being said, green hydrogen has its own geopolitical problems. Procuring the critical minerals and metals required to build electrolyzers can prove to be challenging, given the metals’ locations are highly concentrated in states with stressed electrical infrastructures like South Africa, which produces 85% and 70% of global iridium and platinum supply respectively (Chart 6). Both metals are in commonly used electrolyzers. Metals supply disruptions in China similar to those that occurred this past winter can affect numerous metal supply chains necessary for hydrogen production. Chart 6Concentration Risks In Hydrogen Materials
EU Gas Crisis Boosts Hydrogen's Prospects
EU Gas Crisis Boosts Hydrogen's Prospects
Displacing High-Polluting Technology According to the IRENA, hydrogen could cover up to 12% of global energy use by 2050.5 Green hydrogen has numerous potential applications: Backstopping intermittent renewable energy; Performing as a “zero-emissions” fuel for maritime shipping and aviation; An energy source for high-heat industrial processes that cannot otherwise be electrified; A feedstock in some industrial processes, like steel production.6 The adoption of hydrogen for new applications has been slow, with uptake limited to the last decade, when fuel cell electric vehicle (FCEV) deployment started gaining traction. In addition, this energy source can be used to produce commodities such as steel, cement and glass used in construction, and ammonia needed to fertilize crops.7 In terms of size, global hydrogen demand was 90 Mt in 2020, with most of it coming from refining and industrial uses. Governments have committed to greater hydrogen use, but not nearly enough to meet net-zero energy emissions by 2050 (Chart 7).8 IRENA estimates that over 30% of hydrogen could be traded across borders by 2050, a higher share than natural gas today.9 According to the Energy Networks Association, up to a fifth of natural gas consumption currently used could be replaced by hydrogen.10 Countries most able to generate cheap renewable electricity will be best placed to produce competitive green hydrogen.11 Chart 7Hydrogen Contributes To Lower Emissions
EU Gas Crisis Boosts Hydrogen's Prospects
EU Gas Crisis Boosts Hydrogen's Prospects
Investment Implications High natgas prices – in its pipeline and liquid forms – will redound to the benefit of clean hydrogen and its supporting technology. The relative cost advantage green hydrogen has over its grey and blue competition will persist this year and most likely in 2023, as the EU and China continue to bid for scarce natgas supplies in the wake of Russia's invasion of Ukraine. This could persist, if markets begin pricing the availability and future reliability of clean hydrogen on par with fossil-fuel availability. However, this will require significant increases in green-hydrogen technology investment, particularly in electrolysers. Government support – e.g., the US DOE's efforts to reduce the cost of green hydrogen to $1/kg over the next 10 years from $5/kg – will be important in this regard. The development of green-hydrogen capacity and its infrastructure could limit the further development of natural gas, which will be increasingly important during the global energy transition. The conventional natgas resource base benefits from a fully developed global infrastructure, which, if augmented with funding and tax support for carbon-capture and storage technology, will provide a necessary bridge to a low-carbon energy grid. Robert P. Ryan Chief Commodity & Energy Strategist rryan@bcaresearch.com Ashwin Shyam Research Associate Commodity & Energy Strategy ashwin.shyam@bcaresearch.com Paula Struk Research Associate Commodity & Energy Strategy paula.struk@bcaresearch.com Commodity Round-Up Industrial bulks (iron ore and steel) and metals are becoming more expensive, increasing the cost of Europe’s effort to diversify away from Russian natural gas. European countries that relied on pipeline natgas from Russia will need to construct import facilities and regasification plants to switch to LNG from other exporters. Cross-border European pipelines also will be required to transport imported natural gas from the Iberian Peninsula and Eastern Europe to inland Europe. The US will be expanding LNG export facilities in the Gulf out to 2025, after which growth in export capacity will level off at ~ 10 Bcf/d. It has a large latent export capacity of ~ 187 million tons of LNG, however 48% of that capacity will come via projects currently under construction or awaiting permits. The build-out and expansion of LNG import and export facilities will be steel- and metals- intensive. Renewables-based energy the EU will look to as another alternative to Russian gas will compete with new LNG facilities’ metal demand, given green energy’s infrastructure requirements (Chart 8). The US and China will compete with the EU for these metals, as the world aims to achieve net-zero carbon emissions by 2050. The downside risk is the current COVID wave in China, and the stringent lockdown accompanying it, which started in end-March. Lockdowns will slow down economic activity and demand for metals. So far, however, copper - widely used in the nation’s large property sector - seems to have been untouched by activity in China. This is likely due to low inventory levels, the Ukraine crisis, and political uncertainty in the copper rich countries of Peru and Chile, which has slowed investment activity in the region. According to BCA’s China Investment Strategy, China’s zero-tolerance COVID policy will lead to frequent lockdowns and outweigh the positive effects of stimulus, given the high transmissibility of the Omicron variant now spreading there. Copper demand growth likely slows in China, but outside China demand for steel and base metals is holding up.. Chart 8
EU Gas Crisis Boosts Hydrogen's Prospects
EU Gas Crisis Boosts Hydrogen's Prospects
Footnotes 1 Please see Surging Metals Prices And The Case For Carbon-Capture, which we published 13 May 2021. It is available at ces.bcaresearch.com. Nordhaus is the 2018 Nobel Laureate in Economics in 2018. Please see Carbon Market Clubs and the New Paris Regime published by the World Bank in July 2016. The intellectual and computational framework for this technology was developed by Nordhaus. 2 Please see Geopolitics of The Energy Transformation: The Hydrogen Factor, published by IRENA. 3 Please see Green Hydrogen Cost Reduction: Scaling Up Electrolyzers to Meet the 1.5°C Climate Goal, published by IRENA. 4 Please see Ukraine war | Green hydrogen 'now cheaper than grey in Europe, Middle East and China': BNEF, published by rechargenews.com on March 7, 2022. 5 https://www.irena.org/newsroom/pressreleases/2022/Jan/Hydrogen-Economy-… 6 Please see Hydrogen: Future of Clean Energy or a False Solution? published by Sierra Club 5 January 2022. 7 Please see Green hydrogen has long been hyped as a replacement for fossil fuels. Now, one of the industry’s biggest players is preparing its IPO published by Fortune on January 10, 2022. 8 Please see Global Hydrogen Review 2021 published by IEA November 2021. 9 Please see Hydrogen Economy Hints at New Global Power Dynamics published by IRENA on January 15, 2022. 10 Please see Hydrogen could replace 20% of natural gas in the grid from next year published by Institution for Mechanical Engineers 14 January 2022. 11 See footnote #9. Investment Views and Themes Strategic Recommendations Trades Closed in 2021
Image
Executive Summary To understand the economy and the market we must think of them as non-linear systems which experience sudden phase-shifts. The pandemic introduced phase-shifts in our lives, which led to phase-shifts in our goods demand, which led to phase-shifts in monthly core inflation. As our lives phase-shift back to normality, goods demand will phase-shift back to low growth, and monthly core inflation prints will phase-shift from ‘high phase’ to ‘low phase’. With the 12-month core US inflation rate likely to peak by June at the latest, the long bond yield is likely to peak at some point in April/May, justifying a cyclical overweight position in T-bonds. Go overweight healthcare and biotech versus resources and financials. The leadership of the equity market will once more flip from short-duration sectors to long-duration sectors. Fractal trading watchlist additions: JPY/CHF, non-life insurance versus homebuilders, US homebuilders (XHB), cotton versus platinum, healthcare versus resources, and biotech versus resources.
The Bond Yield Turns About 2-3 Months Before Core Inflation
The Bond Yield Turns About 2-3 Months Before Core Inflation
Bottom Line: With the 12-month core US inflation rate likely to peak by June at the latest, the long bond yield is likely to peak at some point in April/May, and the leadership of the equity market will flip back to long-duration sectors such as healthcare and biotech. Feature Inflation is a non-linear system, meaning that you cannot just dial it up or down gradually like the volume on your music system. Instead of gradual changes, non-linear systems suddenly phase-shift from quiet to loud, from cold to hot, from solid to liquid, or from stability to instability (Box I-1). Box 1: A Classic Non-Linear System – A Brick On An Elastic Band To experience the sudden phase-shift in a non-linear system, attach an elastic band to a brick and try pulling it across a table. As you start to pull, the brick doesn’t move because of the friction with the table. But as you increase your pull there comes a tipping point, at which the brick does move and the friction simultaneously decreases, self-reinforcing the brick’s acceleration. Meanwhile, your pull on the elastic continues to increase as you react with a time-lag. The result is that this non-linear system suddenly phase-shifts from stability – the brick doesn’t move – to instability – the brick hits you in the face! Try as hard as you might, it is impossible to pull the brick across the table smoothly. In this non-linear system, the choice is either stability or instability. Back in 2017, in Mission Impossible: 2% Inflation – An Update, I posed a crucial question: “Given that price stability could phase-shift to instability, when should we worry about it?” I answered that “the risk remains low until the next severe downturn – when policymakers may be forced into desperate measures for a desperate situation.” The words proved prescient. Three years later, the desperate situation was a global pandemic, and the desperate measures were economic shutdowns combined with fiscal stimuluses of unprecedented scope and size. A Phase-Shift In Our Lives Produced A Phase-Shift In Inflation Developed economy inflation has just experienced a stark non-linearity. Since 2007, the US core month-on-month inflation rate remained consistently below 3.5 percent.1 Then came the pandemic’s shutdowns combined with policymakers’ massive response, and month-on-month inflation didn’t just rise to above 3.5 percent, it phase-shifted to well over 6 percent. Developed economy inflation has just experienced a stark non-linearity. The remarkable fact is that since 2007, there have been over a hundred monthly core inflation prints below 4 percent, and nine prints above 6 percent, but just one solitary print between 4 and 6 percent! In other words, monthly core inflation shows the classic hallmark of a non-linear system. It can be cold or hot, but not warm (Chart I-1). Chart I-1Monthly Core Inflation Shows The Classic Hallmark Of A Non-Linear System
Monthly Core Inflation Shows The Classic Hallmark Of A Non-Linear System
Monthly Core Inflation Shows The Classic Hallmark Of A Non-Linear System
So, what caused the phase-shift in core inflation? The simple answer is a phase-shift in durable goods spending, which itself was caused by the pandemic’s shutdown of services combined with massive fiscal stimulus. Again, this is supported by a remarkable fact. Since 2007, the monthly increase in US (real) spending on durables remained consistently below 3.5 percent. Then came the pandemic’s shutdowns and stimulus checks, and the growth in durables demand didn’t just rise to above 3.5 percent, it phase-shifted to well over 8 percent. In other words, the growth in durable goods demand also shows the classic hallmark of a non-linear system. It can be cold or hot, but not warm (Chart I-2). Chart I-2Goods Demand Shows The Classic Hallmark Of A Non-Linear System
Goods Demand Shows The Classic Hallmark Of A Non-Linear System
Goods Demand Shows The Classic Hallmark Of A Non-Linear System
The connection between the phase-shifts in goods demand and the phase-shifts in core inflation is staring us in the face – because the three separate phase-shifts in inflation have each been associated with a preceding or contemporaneous phase-shift in goods demand, which themselves have been associated with the separate waves of the pandemic (Chart I-3). Chart I-3Phase-Shifts In Core Inflation Have Been Associated With Phase-Shifts In Goods Demand
Phase-Shifts In Core Inflation Have Been Associated With Phase-Shifts In Goods Demand
Phase-Shifts In Core Inflation Have Been Associated With Phase-Shifts In Goods Demand
Pulling all of this together, the pandemic introduced phase-shifts in our lives – lockdown or freedom. Which led to phase-shifts in our goods demand – above 8 percent or below 3.5 percent. Which led to phase-shifts in monthly core inflation – above 6 percent or below 4 percent. The key question is, what happens next? Bond Yields Are Close To A Peak As we learn to live with the pandemic, and assuming no imminent ‘super variant’ of the virus, our lives are phase-shifting back to a semblance of normality. Which means that our spending on goods is phase-shifting back to low growth. If anything, the recent overspend on goods implies an imminent corrective underspend. At the same time, it will be difficult to compensate a phase-shift down on goods spending with a phase-shift up on services spending. This is because the consumption of services is constrained by time and biology. There is a limit to how often you can eat out, go to the theatre, or even go on vacation. The upshot is that monthly core inflation prints are likely to phase-shift from ‘high phase’ to ‘low phase’ – even if the monthly headline inflation prints are kept up longer by the commodity price spikes that result from the Ukraine crisis. Monthly core inflation prints are likely to phase-shift from ‘high phase’ to ‘low phase’. Meanwhile central banks and markets focus on the 12-month core inflation rate – which, as an arithmetic identity, is the sum of the last twelve month-on-month inflation rates.2 To establish the 12-month core inflation rate, the crucial question is: how many of the last twelve month-on-month inflation prints will be high phase versus low phase? As just discussed, the new month-on-month core inflation prints are likely to phase-shift to low phase. At the same time, the historic high phase prints will disappear from the last twelve month window. Specifically, by June 2022, the three high phase prints of April, May, and June 2021 – 10 percent, 9 percent, and 10 percent respectively – will no longer be included in the 12-month core inflation rate, with the arithmetic impact of pulling it down sharply (Chart I-4). Chart I-4The High Phase Monthly Inflation Prints Of April, May, And June 2021 Will Disappear From The 12-Month Core US Inflation Rate, Thereby Pulling It Down.
The High Phase Monthly Inflation Prints Of April, May, And June 2021 Will Disappear From The 12-Month Core US Inflation Rate, Thereby Pulling It Down.
The High Phase Monthly Inflation Prints Of April, May, And June 2021 Will Disappear From The 12-Month Core US Inflation Rate, Thereby Pulling It Down.
Clearly, the bond market anticipates some of this ‘base effect’ on 12-month inflation. This explains why turning points in the bond yield have led by 2-3 months the turning points in the 12-month core inflation rate (Chart I-5). With the 12-month core inflation rate likely to peak by June at the latest, this suggests that – absent some new shock – the long bond yield is likely to peak at some point in April/May. Reinforcing our cyclical overweight position in T-bonds. Chart I-5The Bond Yield Turns About 2-3 Months Before Core Inflation
The Bond Yield Turns About 2-3 Months Before Core Inflation
The Bond Yield Turns About 2-3 Months Before Core Inflation
This also carries important implications for equity investors. Rising bond yields favour short-duration equity sectors such as resources and financials versus long-duration equity sectors such as healthcare and biotech. And vice-versa. Indeed, the recent performance of resources versus healthcare and financials versus healthcare is indistinguishable from the bond yield (Chart I-6 and Chart I-7). Chart I-6The Performance of Resources Versus Healthcare Is Indistinguishable From The Bond Yield
The Performance of Resources Versus Healthcare Is Indistinguishable From The Bond Yield
The Performance of Resources Versus Healthcare Is Indistinguishable From The Bond Yield
Chart I-7The Performance of Financials Versus Healthcare Is Indistinguishable From The Bond Yield
The Performance of Financials Versus Healthcare Is Indistinguishable From The Bond Yield
The Performance of Financials Versus Healthcare Is Indistinguishable From The Bond Yield
With bond yields likely to peak soon, the leadership of the equity market will once more flip from short-duration sectors to long-duration sectors. Go overweight healthcare and biotech versus resources and financials. Fractal Trading Watchlist Reinforcing the fundamental analysis in the previous section, the 130-day outperformance of resources versus healthcare and biotech has reached the point of fractal fragility that has marked previous trend exhaustions, suggesting that the recent outperformance of resources is nearing an end. Also new on our watchlist is a commodity pair, cotton versus platinum, whose strong outperformance is vulnerable to reversal. And US homebuilders (XHB), whose recent underperformance is at a potential turning point. There are two new trade recommendations. First, the massive outperformance of world non-life insurance versus homebuilders is at the point of fractal fragility that has consistently marked previous turning points (Chart I-8). Hence, go short non-life insurance versus homebuilders, setting a profit target and symmetrical stop-loss at 14 percent. Second, the strong underperformance of the Japanese yen is also at the point of fractal fragility that has marked several previous turning points (Chart I-9). Accordingly, go long JPY/CHF, setting a profit target and symmetrical stop-loss at 4 percent. Please note that our full watchlist of 19 investments that are experiencing or approaching turning points is now available on our website: cpt.bcaresearch.com Chart I-8The Massive Outperformance Of Non-Life Insurance Is Vulnerable To Reversal
The Massive Outperformance Of Non-Life Insurance Is Vulnerable To Reversal
The Massive Outperformance Of Non-Life Insurance Is Vulnerable To Reversal
Chart I-9Go Long JPY/CHF
Go Long JPY/CHF
Go Long JPY/CHF
The Outperformance Of Resources Versus Healthcare Is Vulnerable To Reversal
The Outperformance Of Resources Versus Healthcare Is Vulnerable To Reversal
The Outperformance Of Resources Versus Healthcare Is Vulnerable To Reversal
The Outperformance Of Resources Versus Biotech Is Vulnerable To Reversal
The Outperformance Of Resources Versus Biotech Is Vulnerable To Reversal
The Outperformance Of Resources Versus Biotech Is Vulnerable To Reversal
Cotton’s Outperformance Is Vulnerable To Reversal
Cotton's Outperformance Is Vulnerable To Reversal
Cotton's Outperformance Is Vulnerable To Reversal
US Homebuilders’ Underperformance Is At A Potential Turning Point
US Homebuilders' Underperformance Is At A Potential Turning Point
US Homebuilders' Underperformance Is At A Potential Turning Point
Dhaval Joshi Chief Strategist dhaval@bcaresearch.com Footnotes 1 Annualized month-on-month inflation rate. 2 Strictly speaking, the 12-month inflation rate is the geometric product of the last 12 month-on-month inflation rates. Chart I-1The Strong Trend In The 18-Month-Out US Interest Rate Future Is Fragile
The Strong Trend In The 18-Month-Out US Interest Rate Future Is Fragile
The Strong Trend In The 18-Month-Out US Interest Rate Future Is Fragile
Chart I-2The Strong Trend In The 3 Year T-Bond Is Fragile
The Strong Trend In The 3 Year T-Bond Is Fragile
The Strong Trend In The 3 Year T-Bond Is Fragile
Chart I-3AUD/KRW Is Vulnerable To Reversal
AUD/KRW Is Vulnerable To Reversal
AUD/KRW Is Vulnerable To Reversal
Chart I-4Canada Versus Japan Is Vulnerable To Reversal
Canada Versus Japan Is Vulnerable To Reversal
Canada Versus Japan Is Vulnerable To Reversal
Chart I-5Canada's TSX-60's Outperformance Might Be Over
Canada's TSX-60's Outperformance Might Be Over
Canada's TSX-60's Outperformance Might Be Over
Chart I-6US Healthcare Providers Vs. Software Approaching A Reversal
US Healthcare Providers Vs. Software Approaching A Reversal
US Healthcare Providers Vs. Software Approaching A Reversal
Chart I-7The Euro's Underperformance Could Be Approaching a Resistance Level
The Euro's Underperformance Could Be Approaching a Resistance Level
The Euro's Underperformance Could Be Approaching a Resistance Level
Chart I-8A Potential Switching Point From Tobacco Into Cannabis
A Potential Switching Point From Tobacco Into Cannabis
A Potential Switching Point From Tobacco Into Cannabis
Chart I-9Bitcoin's 65-Day Fractal Support Is Holding For Now
Bitcoin's 65-Day Fractal Support Is Holding For Now
Bitcoin's 65-Day Fractal Support Is Holding For Now
Chart I-10Biotech Approaching A Major Buy
Biotech Approaching A Major Buy
Biotech Approaching A Major Buy
Chart I-11CAD/SEK Reversal Has Started
CAD/SEK Reversal Has Started
CAD/SEK Reversal Has Started
Chart I-12Financials Versus Industrials Is Reversing
Financials Versus Industrials Is Reversing
Financials Versus Industrials Is Reversing
Chart I-13Norway's Outperformance Could End
Norway's Outperformance Could End
Norway's Outperformance Could End
Chart I-14Greece's Brief Outperformance Has Ended
Greece's Brief Outperformance Has Ended
Greece's Brief Outperformance Has Ended
Chart I-15BRL/NZD At A Resistance Point
BRL/NZD At A Resistance Point
BRL/NZD At A Resistance Point
Chart I-16The Outperformance Of Resources Versus Healthcare Is Vulnerable To Reversal
The Outperformance Of Resources Versus Healthcare Is Vulnerable To Reversal
The Outperformance Of Resources Versus Healthcare Is Vulnerable To Reversal
Chart I-17The Outperformance Of Resources Versus Biotech Is Vulnerable To Reversal
The Outperformance Of Resources Versus Biotech Is Vulnerable To Reversal
The Outperformance Of Resources Versus Biotech Is Vulnerable To Reversal
Chart I-18Cotton's Outperformance Is Vulnerable To Reversal
Cotton's Outperformance Is Vulnerable To Reversal
Cotton's Outperformance Is Vulnerable To Reversal
Chart I-19US Homebuilders' Underperformance Is At A Potential Turning Point
US Homebuilders' Underperformance Is At A Potential Turning Point
US Homebuilders' Underperformance Is At A Potential Turning Point
Fractal Trading System Fractal Trades
Fat-Tailed Inflation Signals A Peak In Bond Yields
Fat-Tailed Inflation Signals A Peak In Bond Yields
Fat-Tailed Inflation Signals A Peak In Bond Yields
Fat-Tailed Inflation Signals A Peak In Bond Yields
6-Month Recommendations Structural Recommendations Closed Fractal Trades Indicators To Watch - Bond Yields Chart II-1Indicators To Watch - Bond Yields - Euro Area
Indicators To Watch - Bond Yields - Euro Area
Indicators To Watch - Bond Yields - Euro Area
Chart II-2Indicators To Watch - Bond Yields - Europe Ex Euro Area
Indicators To Watch - Bond Yields - Europe Ex Euro Area
Indicators To Watch - Bond Yields - Europe Ex Euro Area
Chart II-3Indicators To Watch - Bond Yields - Asia
Indicators To Watch - Bond Yields - Asia
Indicators To Watch - Bond Yields - Asia
Chart II-4Indicators To Watch - Bond Yields - Other Developed
Indicators To Watch - Bond Yields - Other Developed
Indicators To Watch - Bond Yields - Other Developed
Indicators To Watch - Interest Rate Expectations Chart II-5Indicators To Watch - Interest Rate Expectations
Indicators To Watch - Interest Rate Expectations
Indicators To Watch - Interest Rate Expectations
Chart II-6Indicators To Watch - Interest Rate Expectations
Indicators To Watch - Interest Rate Expectations
Indicators To Watch - Interest Rate Expectations
Chart II-7Indicators To Watch - Interest Rate Expectations
Indicators To Watch - Interest Rate Expectations
Indicators To Watch - Interest Rate Expectations
Chart II-8Indicators To Watch - Interest Rate Expectations
Indicators To Watch - Interest Rate Expectations
Indicators To Watch - Interest Rate Expectations
Executive Summary Long Small Cap Energy Versus Large Cap
Investment Takeaways
Investment Takeaways
President Biden has not received a boost in opinion polls from the Ukraine war. If he has not by now then it is increasingly unlikely that he will do so. Yet Biden performs worse in polls for his handling of economic policy than foreign policy, despite falling unemployment and rising real wages. The economy should help stabilize his approval rating but not in time to prevent Democrats from losing the Senate as well as the House this fall. Biden’s decision to tap the strategic petroleum reserve exemplifies our 2022 trend of executive action. However, the oil outlook still depends on Biden’s Iran talks and OPEC’s reaction. Recommendation Inception Level Inception Date Return Long Small Vs. Large Cap Energy 0.56 26-Jan-22 14.9% Bottom Line: The return of gridlock is bad for stocks in 2022 but good in 2023. Feature Investors need answers to three questions about US policy at the moment: 1. Will President Biden’s reaction to the Ukraine war exacerbate the hit to the global and US economy? 2. Will Biden’s domestic agenda revive? If so, how will it impact corporate earnings expectations? 3. Will Biden’s foreign and domestic policies cause any changes to the midterm election outlook and hence US policy in 2023-24? In recent reports we have answered these questions as follows. Related Report US Political StrategySecond Quarter Outlook: Gridlock Looms First, Biden will continue to pursue a defensive or reactive foreign policy, meaning that he will not force Europe or other allies to adopt Russia sanctions beyond their near-term economic and political capabilities. If Europe wants to boycott Russian energy then that is fine but it is Europe’s decision. In fact, Europe is pursuing gradual rather than immediate diversification. Russia needs the funds. So Europe is unlikely to experience a sharp energy cutoff that plunges its economy into recession. Nevertheless, the risk is substantial enough that we remain long DXY and defensive US sectors on a tactical time frame. Second, Biden’s congressional agenda is getting back on track, with the war providing Democrats with a basis for redesigning and rebranding their budget reconciliation bill. Therefore we did not downgrade our 65% subjective odds that Congress will pass a bill. The bill will be close to deficit neutral and focused especially on energy policy. The Senate version of the bill is not yet available but we will examine the likeliest policy options in a forthcoming special report with our US Equity Strategy. Third – our focus for this report – current political changes do not substantially alter the midterm election odds, which suggest Republicans will retake Congress. Gridlock will return – and is the norm in US policy. In an inflationary context gridlock may well be positive for equities in 2023 since it will curb fiscal spending. However, uncertainty is negative for equities this year. We remain tactically defensive. We recommend renewable energy, cyber stocks, defense stocks, and infrastructure stocks as cyclical plays. Biden’s Approval Stabilizing At Low Level Foreign policy shocks are likely to hurt the ruling party – especially if the nature of the shock exacts a toll on the voter’s pocketbook. We showed evidence to this effect just before Russia re-invaded Ukraine. We concluded that Biden would experience a bounce in opinion polls as the nation rallied around him in the face of the Russian menace but the likely rise in gasoline prices would end up hurting the Democratic Party in the midterm elections. Yet 40 days after Russia’s attack Biden’s general job approval is still at the lowest of his presidency, in the 41-42% range, while his disapproval is still high, in the 52-53% range. So far the war has not given him an appreciable boost, outside of his own party (where the boost has still been small). The results are even worse when it comes to his handling of the economy. Here his approval is 39% and disapproval 54%. In foreign policy, Biden’s approval stands at 40% and disapproval at 52% (Chart 1). Presidential approval has a big influence on the midterm election – as does perception of the two parties. Republicans have taken the lead in the generic congressional ballot, at 43.7% support versus 42.2% for Democrats. The war has blunted the Republican rally but nothing more. The economy is the likeliest source of good news for Biden and the Democrats over the coming six months but even here there is not a basis for optimism among Democrats, as we will see in the next section. Chart 1No ‘War Bounce’ For Biden
War Not Helping Biden So Far
War Not Helping Biden So Far
Jobs And Wages Not Boosting Biden Either Our Political Capital Index shows that the Biden administration now has weak or moderate political capital in every category except economic conditions and financial markets (Appendix). Yet economic conditions are still mixed. While they will likely improve before November, they do not look to improve enough to change the election outlook: Both Republicans and Democrats are viewing the economy more negatively. Republican economic sentiment declined by 16% in March, while Democrat economic sentiment declined by 6%. The partisan gap widened, which means Republicans will remain motivated to vote (Chart 2). Manufacturing activity is slowing down (though not shrinking). The reading slipped lower than its level in November 2020, when Biden took office. This drop is the first sign of the negative effect of inflation and geopolitical risk on the economy. New manufacturing orders declined while inventories increased. The new-orders-to-inventories ratio, which should be a leading indicator of economic activity, fell by 15.7% compared to its February reading. It is now the weakest since May 2020 (Chart 3). Chart 2Economic Sentiment Declines For Both Parties
Economic Sentiment Declines For Both Parties
Economic Sentiment Declines For Both Parties
The budget deficit is “normalizing” and weighing on demand. The fiscal thrust – or change in the budget deficit – turned negative as the stimulus of 2020 waned. The intensity of the drag is now lessening, both on the federal and state level, but it would require a massive new crisis for the US to outdo the stimulus of 2020, so the drag will persist for the foreseeable future (Chart 4). Any last-minute reconciliation bill from congressional Democrats would reduce the drag further, but not generate positive thrust, and not in time to affect the election. To pass the bill, Democrats need to reduce the deficit impact in the face of inflation and paper-thin congressional majorities. Chart 3First Sign Of Inflation, Geopolitics Hitting Manufacturing
First Sign Of Inflation, Geopolitics Hitting Manufacturing
First Sign Of Inflation, Geopolitics Hitting Manufacturing
Chart 4US Fiscal Drag In Wake Of 2020 Stimulus
US Fiscal Drag In Wake Of 2020 Stimulus
US Fiscal Drag In Wake Of 2020 Stimulus
Most worrisome for President Biden, his approval rating has suffered despite a tight labor market and real wage growth. The headline unemployment rate declined to 3.6% in March, down 3.1 percentage points since November 2020. The ISM manufacturing employment index stands at the highest point since March of 2021, and 17% higher than in November 2020 (Chart 5). Inflation is apparently eating away the benefits of low unemployment. Real wages grew by 3.3% on an annual basis in February, up from 2.5% in January. This wage growth is higher than that of November 2020, at 2.2%. Biden’s approval rating is probably in the process of stabilizing, if we assume that unemployment stays low and real wages keep growing. But it is stabilizing at a low level and not perking up as a result of the Russian menace. The likeliest culprit for Biden’s troubles is inflation. Fortunately for the Democrats inflation is likely to fall in the coming months. However, voters are likely to respond to year-on-year rather than month-on-month inflation. And voters make up their minds early in midterm election years. Plus, if inflation does not subside, or if Biden is perceived as making a foreign policy mistake, then his approval rating will not stabilize. Bottom Line: Biden’s approval rating is not perking up despite a foreign threat. His approval on economic policy is even worse than on foreign policy, despite low unemployment and real wage growth higher than when he took office. A drop in inflation would improve his fortunes but taken together the evidence suggests that the war has not helped, and may have hurt, the Democrats’ chances this fall. Chart 5Will Jobs And Real Wages Stabilize Presidential Approval?
Will Jobs And Real Wages Stabilize Presidential Approval?
Will Jobs And Real Wages Stabilize Presidential Approval?
Biden Taps Strategic Oil Reserve But Implications Depend On Iran One of our key views for 2022 (reiterated in our Q2 outlook) is the Biden administration’s transition from congressional to executive action. Biden’s decision to tap the strategic petroleum reserve (SPR) on March 31 exemplifies this trend. Gasoline prices have spiked to $4.20 per gallon, which is more than double the level in November 2020 (Chart 6). Biden’s SPR order aims to mitigate the rise in prices. Biden ordered the release of 1 million barrels per day of crude oil over the next 180 days (six months). This would constitute the largest release since the SPR came into being in 1975 (Chart 7).1 Chart 6Prices At The Pump Trigger Red Alert In White House
Prices At The Pump Trigger Red Alert In White House
Prices At The Pump Trigger Red Alert In White House
Chart 7Biden Taps Strategic Petroleum Reserve
Biden Taps Strategic Petroleum Reserve
Biden Taps Strategic Petroleum Reserve
The Strategic Petroleum Reserve (SPR) originated in the wake of the Arab oil embargo to protect the US from supply shocks. Faced with “severe petroleum supply interruptions” the president can authorize a maximum drawdown of 396 million barrels over 90 days, which begin reaching the market roughly 13 days after the decision. The current inventory is 570 million barrels of sweet and sour crude, which could last 92 days of crude imports and 72 days of crude and petroleum product imports (Chart 8). Unlike during the 1970s, today the US is the world’s largest oil and refined products producer. It is a net exporter as well. However, it is still vulnerable to external shocks. It imports 6.3 million barrels per day and has already cut off 283 thousand barrels per day of imports from Russia (Chart 9). Global price shocks still affect the US prices at the pump, as Chart 6 above shows in the relationship between domestic gasoline prices and Brent crude. Chart 8SPR Can Be Tapped For Six-To-Nine Months Easily
SPR Can Be Tapped For Six-To-Nine Months Easily
SPR Can Be Tapped For Six-To-Nine Months Easily
Chart 9US Energy Independent But Still Vulnerable To Shocks
US Energy Independent But Still Vulnerable To Shocks
US Energy Independent But Still Vulnerable To Shocks
The Ukraine crisis is just the sort of geopolitical crisis that the SPR was invented to address – but the magnitude of Biden’s action is larger than normal. The SPR was tapped for 21 million barrels in 1990-91, during the Iraqi invasion of Kuwait, and for 30 million barrels in 2011, when Libyan production fell to zero amid the revolution. However, because of US net exporter status, Biden has much more room for maneuver. The SPR would be tapped for 180 million barrels if Biden’s current plan is fully implemented. The SPR can be released at a rate of 4.4 million barrels per day for about 90 days, though after that the drawdown rate begins to decline for technical reasons (e.g. contaminants). Biden’s 180 days would end in early October, a month before the midterm election. If the SPR has at least 282 million barrels left (90 days of US net crude imports in 2021), the president can continue to release oil from it. The minimum storage level is 282 million barrels of crude. Thus at the end of Biden’s current order, he would have 390 million barrels left and would still be able to release 1 million barrels per day for 108 days. There are various interpretations of Biden’s decision to tap the SPR today: Currently the Russians and Europeans are in a standoff over energy flows. Russia is demanding payment in rubles and Europe is rejecting Russia’s demands while threatening to ban Russian coal imports. Since crude oil is generally interchangeable, an EU-Russia breakdown in crude trade would not prevent Russian barrels from reaching global markets eventually (Chart 10). In short Biden did not tap the SPR in anticipation of a breakdown. Biden could have tapped the SPR because of difficulties convincing the core OPEC states to increase production. Saudi Arabia, the UAE, and Kuwait are rapidly increasing production already, though their 90-day spare capacity enables them to bring out as much as 3.5 million additional barrels per day. But on March 31 they ruled out any massive near-term adjustments. Their relations with the US under the Biden administration have been strained, namely as Biden is still trying to rejoin the 2015 Iranian nuclear deal. If the US and Iran rejoin the 2015 deal, the US would lift sanctions and Iran could quickly bring about 1.3 million barrels per day back to global markets. Biden’s SPR release is roughly equal to this amount, which means it could be insurance for a failure to do a deal (Chart 11). Chart 10Russian Oil Exports To Europe And World
War Not Helping Biden So Far
War Not Helping Biden So Far
An Iran deal on top of the SPR release would add 2.3 million barrels per day in positive supply surprises, while reducing the short-term risk of a military conflict in the Persian Gulf. This would have a significant short-term negative impact on oil prices this year. Chart 11Biden Struggles For Help From OPEC
Biden Struggles For Help From OPEC
Biden Struggles For Help From OPEC
What is clear is that our Geopolitical Strategy’s base case of a failure of US-Iran talks would imply a significantly higher risk of oil disruptions in the Middle East over the short and long run. In that case the OPEC states would need to change their position and increase production or else a new supply shock would be added on top of the Russian shock. Biden’s SPR release would make up for production bottled up in Iran but regional supply disruptions would intensify and Iran would threaten the Strait of Hormuz. Biden’s executive action to tap the SPR removes one option from the table. The ultimate impact of this move depends on whether Biden also uses executive action to do a deal with Iran. We cannot rule it out, because Biden has the authority to lift sanctions unilaterally, but we would not bet on it. Bottom Line: Market fundamentals suggest that Brent prices will fall from their current $105 per barrel toward their likely average of $93 per barrel this year and in 2023. Quant Model Points To Republican Senate Last week we highlighted that our Senate election model flipped from predicting the status quo to predicting a Republican victory, in line with our subjective view of the situation. The latest model findings, using data from the state coincident economic indicators released on April 5, suggests that Republicans have a 51.6% chance of gaining control of the Senate (Chart 12). Democrats only need to lose a single seat to slip from 50 to 49 seats and thus yield the majority. The model suggests they will lose two seats, in Arizona and Georgia. The result is a Republican majority of 52-48 seats. Chart 12Senate Election Model Flips To Republicans
War Not Helping Biden So Far
War Not Helping Biden So Far
Our presidential election model still shows Democrats holding onto the White House in 2024 with 308 electoral college votes but their chances are declining. Specifically Democrats’ odds of retaining the White House have fallen from 54.9% to 54.7% now that the March data is taken into account (Chart 13). North Carolina is still considered a toss-up state, with a 45% probability that Democrats win it, but that means that a single percentage point drop puts it firmly in the Republican camp, along with Arizona and Georgia. Democrats’ odds are falling in Florida, Pennsylvania, and Nevada especially, although they are improving in Wisconsin and Minnesota. Chart 13Presidential Election Model Still Slightly Favors Democrats
War Not Helping Biden So Far
War Not Helping Biden So Far
Florida presents an interesting difference between the two models: the Senate model gives Florida to the Republicans, while the presidential model gives it to the Democrats. This requires some explanation: The incumbent advantage plays a role. Biden did not win Florida in 2020 but that does not stop the model from ascribing Democrats a good chance of winning Florida given that they are the incumbent party. Incumbency would be punished if Democrats held the White House for eight years due to the variable that accounts for the public sentiment that it is “time for change.” The Senate model works differently. The model only helps the party that controls a state Senate seat by means of the partisan leaning of the state in recent elections. This is helpful for Republicans in the model’s 2022 prediction. Meanwhile the model only punishes an incumbent party if it has held control of the US Senate for three or more terms, which is not the case today. Our sample periods across the two election models are the same (1984-2020), but in this period, Democrats only held Senate seats for three out of nine changes. There have been nine different senators from Florida since 1989, three of which have been Democrats. The last Democratic senator was Bill Nelson but he was beaten by Republican Rick Scott in 2018. The other Senate seat has been held by a Republican since around 2004, most recently Marco Rubio, who is up for re-election in 2022. So the model will “lean” more Republican based on total outcomes and how recently recurring they were. Finally, a caveat: we should be careful about explicitly comparing the two election models. Although they are both Probit models, the variables are not all the same. Some are shared but their interaction with one another and the election outcome (dependent variable) should not be assumed to be exactly the same. There can be little doubt in the model’s outlook for the Florida Senate race. Senator Marco Rubio is a young incumbent, has strong name recognition, and is up for re-election in a favorable year for Republicans. As of February he was leading his top Democratic opponent Val Demings by 12 percentage points in opinion polls. Confirming the state’s Republican leaning, Governor Ron DeSantis was leading his Democratic opponent Charlie Crist by 21 percentage points in February polls, with over 50% favoring DeSantis. (Other than former President Trump, DeSantis is currently the favored Republican nominee for 2024.) Moreover the presidential model is catching up to the Senate model, with the odds of a Democratic win in Florida dropping from 59% to 55% over the past month alone. If the odds fall beneath 50% then the model naturally awards all of Florida’s 29 electoral votes to the Republicans. This would leave Democrats hanging by a thread at 279 votes. What is clear is that the 2024 election is a long way off. Democrats benefit from an incumbent advantage as a political party, aside from whether President Biden runs again. Yet the quantitative model suggests that the US will experience another hotly contested presidential election. Bottom Line: Republicans are now tipped to take the Senate in our quantitative model as well as our subjective judgment. Meanwhile Democrats are still favored to win the 2024 election but only slightly, and their odds are falling. These views support the market consensus but in general US investors will remain risk averse ahead of the midterm election. Investment Takeaways Stay tactically long the US dollar and defensive stocks like in the health care sector. Russia is threatening to cut off energy exports to Europe, which is considering a ban on Russian coal. Until this dispute is resolved, risk appetite will suffer, the euro will be limited, and the dollar will stay strong. Stay long renewable energy, cyber security stocks, infrastructure stocks, defense stocks, oil and gas distribution, and small cap energy stocks (Chart 14). Chart 14Investment Takeaways
Investment Takeaways
Investment Takeaways
Matt Gertken Senior Vice President Chief US Political Strategist mattg@bcaresearch.com Jesse Anak Kuri Associate Editor jesse.kuri@bcaresearch.com Guy Russell Senior Analyst guyr@bcaresearch.com Footnotes 1 See White House, “FACT SHEET: President Biden’s Plan to Respond to Putin’s Price Hike at the Pump,” March 31, 2022, whitehouse.gov; Department of Energy, “Strategic Petroleum Reserve: Providing Energy Security For America,” March 28, 2022, energy.gov; and Heather L. Greenley, “The Strategic Petroleum Reserve: Background, Authorities, and Considerations,” Congressional Research Service, R46355, May 13, 2020, crsreports.congress.gov. Appendix Strategic View Open Tactical Positions (0-6 Months) Open Cyclical Recommendations (6-18 Months) Table A2Political Risk Matrix
War Not Helping Biden So Far
War Not Helping Biden So Far
Table A3US Political Capital Index
War Not Helping Biden So Far
War Not Helping Biden So Far
Chart A1Presidential Election Model
War Not Helping Biden So Far
War Not Helping Biden So Far
Chart A2Senate Election Model
War Not Helping Biden So Far
War Not Helping Biden So Far
Table A4APolitical Capital: White House And Congress
War Not Helping Biden So Far
War Not Helping Biden So Far
Table A4BPolitical Capital: Household And Business Sentiment
War Not Helping Biden So Far
War Not Helping Biden So Far
Table A4CPolitical Capital: The Economy And Markets
War Not Helping Biden So Far
War Not Helping Biden So Far
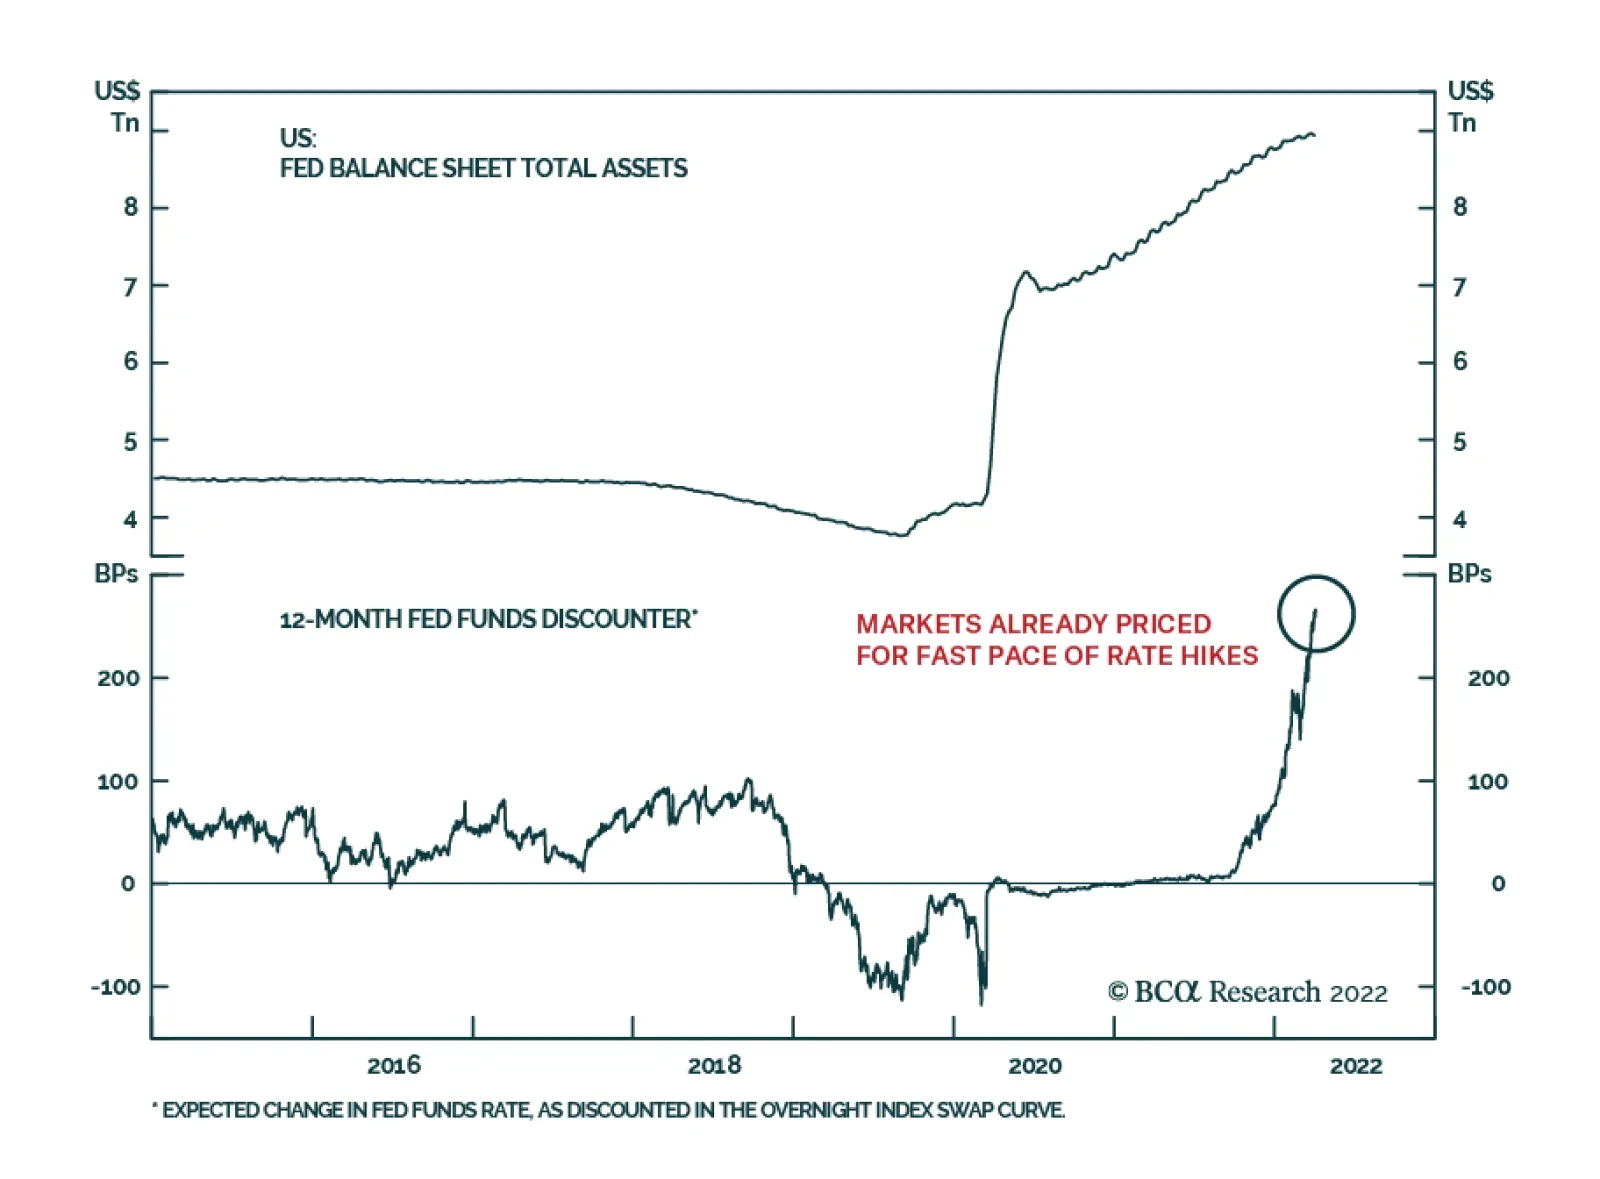
The week-long period of relative stability in US bond markets ended abruptly on Tuesday. The proximate cause of Tuesday’s sharp selloff is Fed Governor Lael Brainard statement that “the Committee will continue tightening monetary policy methodically through a…
Today we upgrade the S&P Metals & Mining industry from underweight to neutral: This industry is one of the few beneficiaries of the war in Ukraine, as the military action and global sanctions take offline copious amounts of metals produced by Russia and Ukraine. It also enjoys increased demand resulting from a shift toward green energy and offers inflation protection. The West’s official sanctions affect Russian exports of certain commodities but there is also a reluctance on the part of private companies to buy or ship Russian exports. In addition, Putin has announced his decision to suspend some commodity exports at least until 2023. Assuming that in the near term a considerable share of Russia’s commodity exports will be blocked from global markets, the largest impact will be on oil, palladium, copper, nickel, fertilizer, and grains (Table 1). Russia’s standoff with the West is still in the early innings and further disruption of the international supply chains is to be expected. The last round of sanctions against Russia is a case in point. Table 1Russia’s Global Share In Various Commodities
Adding Commodity Exposure
Adding Commodity Exposure
In addition, the West’s shift toward green energy further exacerbates metal shortages as clean technologies require astronomical amounts of metals. It will take years and billions of dollars in investments for the other metals producers to fill the void left by Russia and Ukraine. As a result, a supply squeeze is a likely outcome. Rampant inflation is another tailwind for the mining names, which are quintessential real assets, and offer substantial inflation protection. All of these structural trends will enhance the profitability of the miners and metals producers and will translate into gains for the S&P 500 Metals & Mining index. Overall, we are structurally bullish on the sector and will be looking to upgrade the Mining and Metals industry to an overweight once a compelling entry point presents itself. Bottom Line: Upgrade the S&P Metals & Mining index to neutral. Look for a compelling entry point to increase exposure to an overweight.
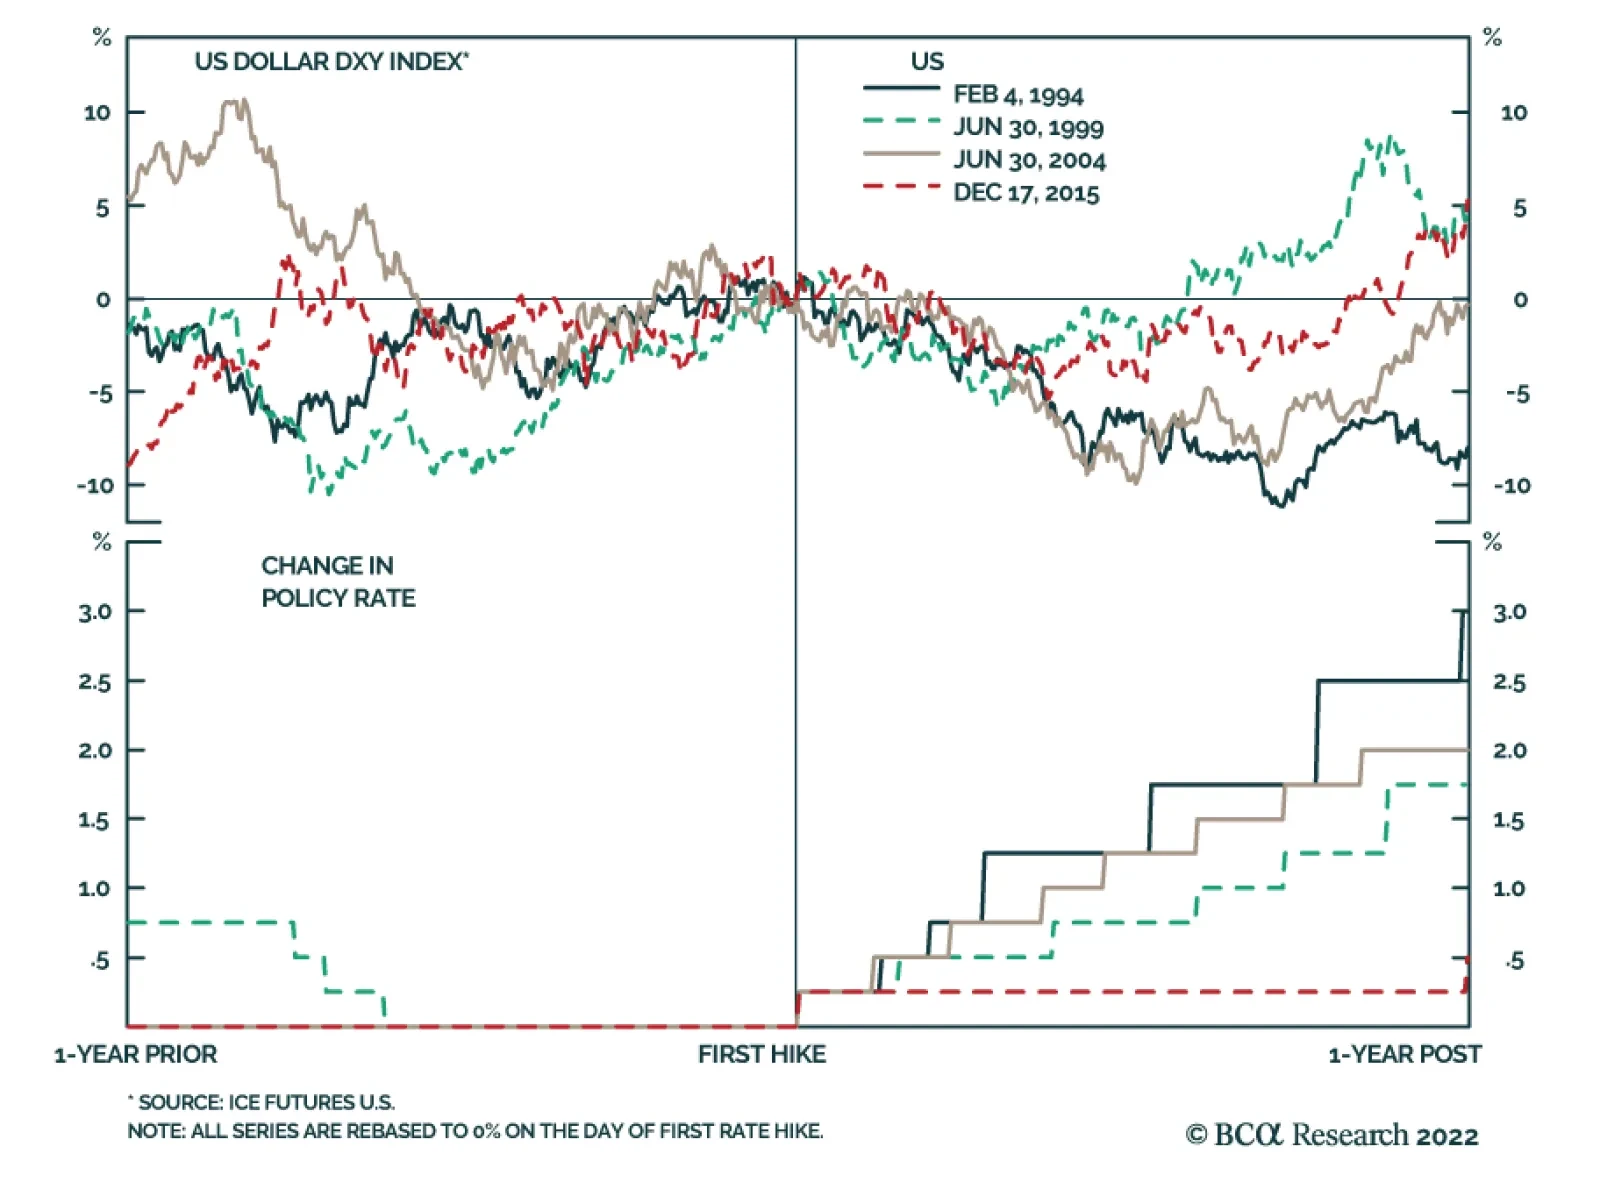
Our Foreign Exchange strategists recently looked at the dollar’s performance during Fed rate hike cycles. They found that the dollar has tended to decline 3-to-6 months after the Fed starts hiking interest rates. This has been true since the mid-1990s. The…
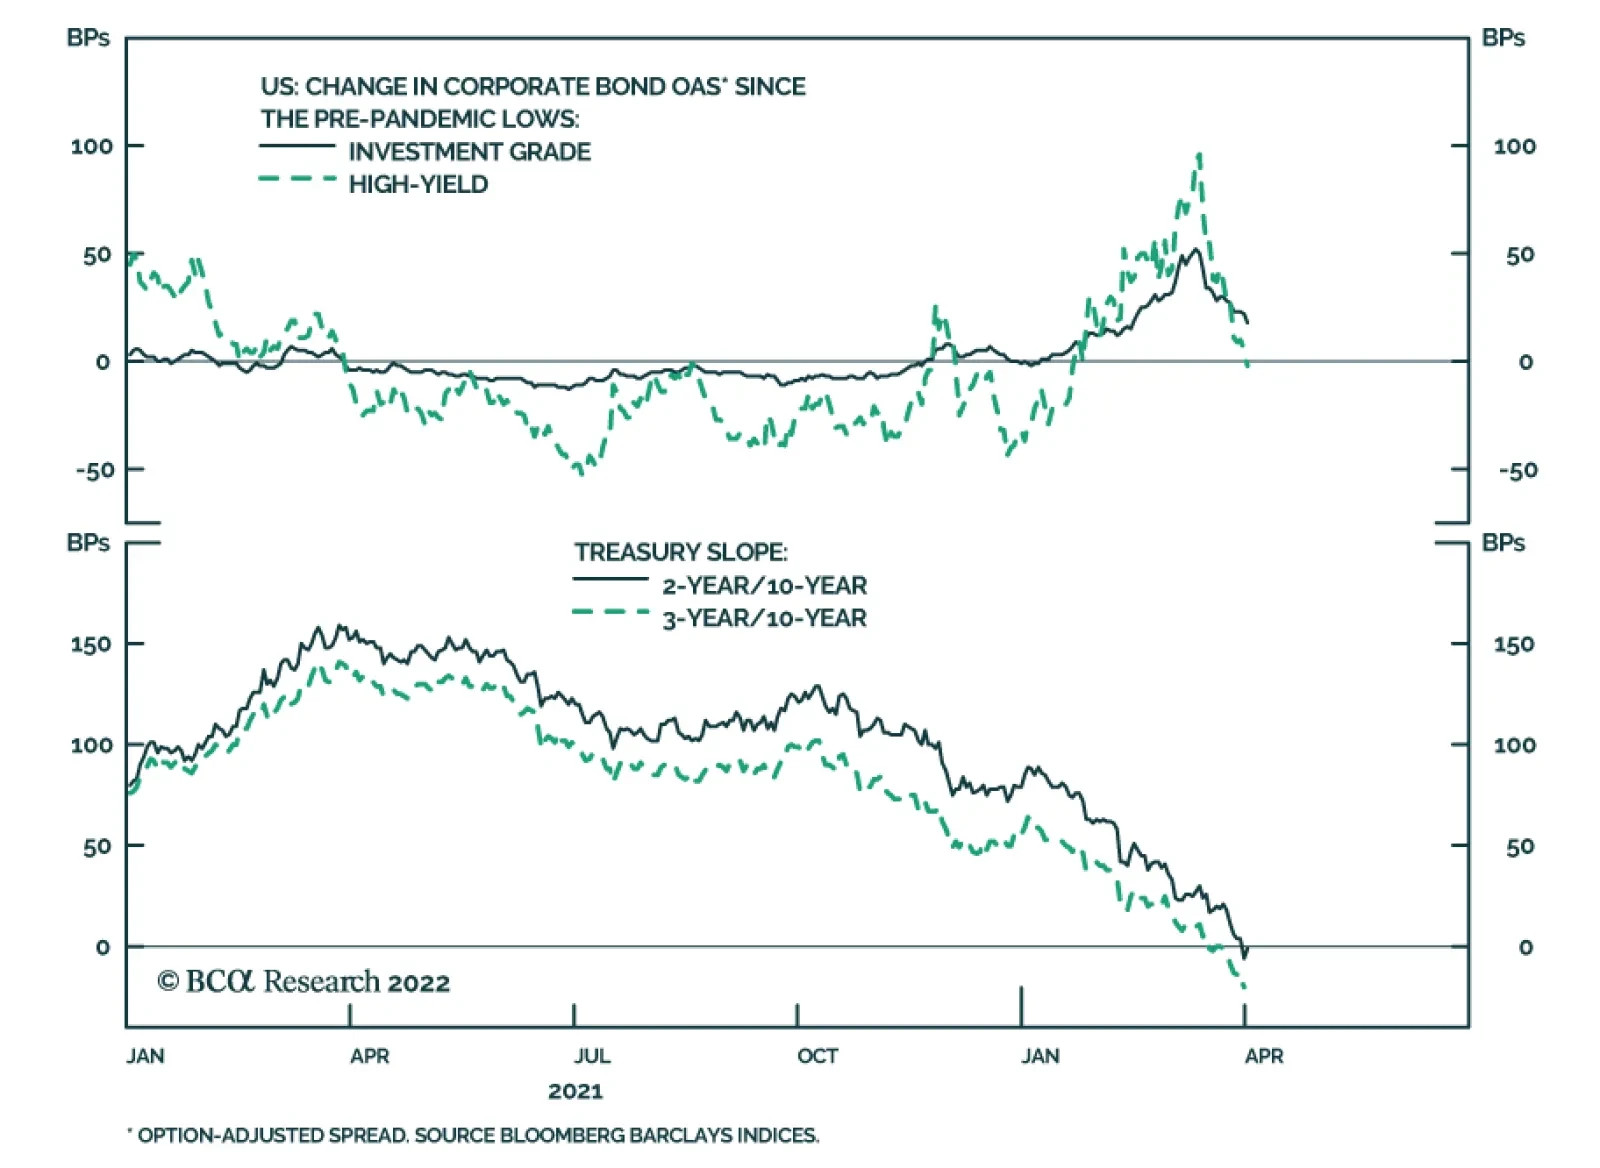
According to BCA Research’s US Bond Strategy service, current spread levels offer a good opportunity to reduce corporate bond exposure. Corporate spreads have rallied to within striking distance of their pre-COVID lows at the same time as the yield curve…