United States

Highlights Chart 1Reduce Credit Exposure
Reduce Credit Exposure
Reduce Credit Exposure
Corporate bond spreads staged a nice rally during the past month. The average index spread for investment grade corporates is only 22 bps above its pre-COVID low and 33 bps above last year’s trough. The average High-Yield index spread is 5 bps above its pre-COVID low and 49 bps above last year’s trough (Chart 1). This rally occurred even as inflation data continued to surprise to the upside and employment data confirmed that the US labor market is extremely tight. With the economic data justifying the Fed’s hawkish pivot, the Treasury curve has flattened dramatically, and both the 2-year/10-year and 3-year/10-year slopes are now inverted (Chart 1, bottom panel). An inverted yield curve is a reliable late-cycle indicator, and we think current spread levels offer a good opportunity to reduce corporate bond exposure. This week, we downgrade investment grade corporates from neutral (3 out of 5) to underweight (2 out of 5) and high-yield corporates from overweight (4 out of 5) to neutral (3 out of 5), placing the proceeds into Treasuries. We also downgrade our recommended allocations EM Sovereigns (see page 8) and TIPS (see page 11), upgrade our recommended allocation to CMBS (see page 13) and adjust our recommended yield curve positioning (see page 10). Feature Table 1Recommended Portfolio Specification
The Beginning Of The End
The Beginning Of The End
Table 2Fixed Income Sector Performance
The Beginning Of The End
The Beginning Of The End
Investment Grade: Underweight Chart 2Investment Grade Market Overview
Investment Grade Market Overview
Investment Grade Market Overview
Investment grade corporate bonds outperformed the duration-equivalent Treasury index by 86 basis points in March, bringing year-to-date excess returns up to -154 bps. Our quality-adjusted 12-month breakeven spread shifted down to its 21st percentile since 1995 (Chart 2). As noted on the first page of this report, corporate spreads have rallied to within striking distance of their pre-COVID lows at the same time as the yield curve has become inverted beyond the 2-year maturity. We showed in last week’s report that an inversion of the 2-year/10-year Treasury slope is not necessarily a harbinger of imminent recession, but it does typically coincide with very low (and often negative) excess corporate bond returns.1 The combination of reasonably tight spreads and an inverted yield curve causes us to recommend downgrading investment grade corporate bond allocations from neutral (3 out of 5) to underweight (2 out of 5). It’s important to note that corporate balance sheets remain healthy (bottom panel) and we see no indication that a recession or default cycle will unfold during the next 6-12 months. That said, we must acknowledge that an inverted yield curve signals that the economic recovery is entering its late stages. Economic growth will be slower going forward and corporate spreads are unlikely to tighten much, especially from current depressed levels. Against this backdrop it makes sense to be more cautious on credit, sacrificing small positive excess returns in the near-term to ensure that we aren’t invested when the next downturn hits. Table 3ACorporate Sector Relative Valuation And Recommended Allocation*
The Beginning Of The End
The Beginning Of The End
Table 3BCorporate Sector Risk Vs. Reward*
The Beginning Of The End
The Beginning Of The End
High-Yield: Neutral Chart 3High-Yield Market Overview
High-Yield Market Overview
High-Yield Market Overview
High-Yield outperformed the duration-equivalent Treasury index by 119 basis points in March, bringing year-to-date excess returns up to -96 bps. The 12-month spread-implied default rate – the default rate that is priced into the junk index assuming a 40% recovery rate on defaulted debt and an excess spread of 100 bps – shifted down to 3.7% (Chart 3). An inverted yield curve sends the same negative signal for high-yield excess returns as it does for investment grade. However, high-yield valuation is currently more attractive. The option-adjusted spread differential between Ba-rated bonds and Baa-rated bonds remains elevated at 86 bps, 41 bps above its pre-COVID low (panel 3). It is also likely that economic growth will remain sufficiently strong for defaults to come in below the spread-implied threshold of 3.7% during the next 12 months (bottom panel). The greater attractiveness of high-yield valuations relative to investment grade causes us to maintain a higher allocation to the sector, even as we downgrade our portfolio’s overall credit risk exposure. We therefore recommend a neutral (3 out of 5) allocation to high-yield corporates. MBS: Underweight Chart 4MBS Market Overview
MBS Market Overview
MBS Market Overview
Mortgage-Backed Securities underperformed the duration-equivalent Treasury index by 14 basis points in March, dragging year-to-date excess returns down to -74 bps. The zero-volatility spread for conventional 30-year agency MBS tightened 3 bps on the month as a 4 bps tightening of the option-adjusted spread (OAS) was partially offset by a 1 bp increase in the compensation for prepayment risk (option cost) (Chart 4). We wrote in a recent report that MBS’ poor performance in 2021 was attributable to an option cost that was too low relative to the pace of mortgage refinancings, noting that the MBA Refinance Index was slow to fall in 2021 despite the back-up in yields.2 This valuation picture is starting to change. The option cost is now up to 40 bps, its highest level since 2016, and refi activity is slowing as the Fed lifts rates. At 28 bps, the index OAS remains unattractive. However, the elevated option cost raises the possibility that the OAS may be over-estimating the pace of mortgage refinancings for the first time in a while. If these trends continue, it may soon make sense to increase exposure to agency MBS. Emerging Market Bonds (USD): Underweight Chart 5Emerging Markets Overview
Emerging Markets Overview
Emerging Markets Overview
Emerging Market bonds underperformed the duration-equivalent Treasury index by 23 basis points in March, dragging year-to-date excess returns down to -505 bps. EM Sovereigns outperformed the Treasury benchmark by 40 bps on the month, bringing year-to-date excess returns up to -609 bps. The EM Corporate & Quasi-Sovereign Index underperformed by 62 bps, dragging year-to-date excess returns down to -439 bps. The EM Sovereign Index underperformed the duration-equivalent US corporate bond index by 7 bps in March. This comes on the heels of a sharp underperformance in February that was driven by Russian bonds which have since been removed from the index. Russian bonds have also been purged from the EM Corporate & Quasi-Sovereign Index, and this index underperformed duration-matched US corporates by 11 bps in March (Chart 5). The yield differential between EM sovereigns and duration-matched US corporates remains negative. As such, we downgrade our recommended allocation to EM sovereigns from underweight (2 out of 5) to maximum underweight (1 out of 5). In sharp contrast, the EM Corporate & Quasi-Sovereign Index continuous to offer a significant yield advantage (panel 4). We retain our neutral (3 out of 5) recommendation for EM Corporates & Quasi-Sovereigns. Municipal Bonds: Overweight Chart 6Municipal Market Overview
Municipal Market Overview
Municipal Market Overview
Municipal bonds outperformed the duration-equivalent Treasury index by 5 basis points in March, bringing year-to-date excess returns up to -122 bps (before adjusting for the tax advantage). While the war in Ukraine has introduced a great deal of uncertainty into the economic outlook, the municipal bond sector should be better placed than most to deal with the fallout. Trailing 4-quarter net state & local government savings are incredibly high (Chart 6) and 2021’s federal spending splurge will continue to support state & local government coffers for some time. On the valuation front, munis have cheapened up relative to both Treasuries and corporates during the past two months. The 10-year Aaa Muni / Treasury yield ratio is currently at 94%, up significantly from its 2021 trough of 55%. The yield ratios between 12-17 year munis and duration-matched corporate bonds are also up significantly off their lows (panel 2). We reiterate our overweight allocation to municipal bonds within US fixed income portfolios, and we continue to have a strong preference for long-maturity munis. The yield ratio between 17-year+ General Obligation Municipal bonds and duration-matched corporates is 93%. The same measure for 17-year+ Revenue bonds stands at 101%, meaning that Revenue bonds carry a before-tax yield advantage versus duration-matched corporates. Treasury Curve: Buy 5-Year Bullet Versus 2/10 Barbell Chart 7Treasury Yield Curve Overview
Treasury Yield Curve Overview
Treasury Yield Curve Overview
The Treasury curve’s bear-flattening trend continued through March. The 2-year/10-year Treasury slope flattened 35 bps on the month and the 5-year/30-year Treasury slope flattened 44 bps. These slopes are now both inverted, sitting at -6 bps and -12 bps respectively. In last week’s report we noted the unusually wide divergence between very flat slopes at the long end of the yield curve and very steep slopes at the front end.3 For example, the 5-year/10-year Treasury slope is -18 bps but the 3-month/5-year slope is 204 bps. This divergence is happening because the market has moved quickly to price-in a rapid near-term pace of rate hikes that will end in roughly one year. However, so far, the Fed has only delivered 25 bps of those hikes and this is holding down the very front-end of the curve. The oddly shaped curve presents us with an excellent trading opportunity. Specifically, we recommend buying the 5-year Treasury note versus a duration-matched barbell consisting of the 2-year and 10-year notes. This trade looks attractive on our model (Chart 7) and will profit if the rate hike cycle moves more slowly than what is currently priced in the market but lasts longer, as is our expectation. By entering our new 5-year bullet over 2-year/10-year barbell trade we also close our previous 2-year bullet over cash/10-year barbell trade at a loss. We continue to recommend a position long the 20-year bullet versus a duration-matched 10/30 barbell as an attractive carry trade. TIPS: Underweight Chart 8TIPS Market Overview
TIPS Market Overview
TIPS Market Overview
TIPS outperformed the duration-equivalent nominal Treasury index by 143 basis points in March, bringing year-to-date excess returns up to +271 bps. The 10-year TIPS breakeven inflation rate rose 22 bps on the month and the 5-year/5-year forward TIPS breakeven inflation rate rose 21 bps. Since last May we have been recommending that clients maintain a neutral allocation to TIPS versus nominal Treasuries at the long end of the curve and an underweight allocation to TIPS at the front end. This recommendation was premised on the view that the breakeven curve would steepen as falling inflation put downward pressure on short-maturity TIPS breakevens and long-dated breakevens remained at levels close to the Fed’s target. Recently, the 10-year TIPS breakeven inflation rate has shot up to levels well above the Fed’s 2.3%-2.5% target range (Chart 8) and our TIPS Breakeven Valuation Indictor has shifted into “expensive” territory (panel 2). Further, while inflation has remained high for longer than we expected, it still seems more likely than not that it will roll over between now and the end of the year as pandemic fears fade and consumers shift their spending patterns away from goods and toward services. As such, we think investors should take this opportunity to further reduce exposure to TIPS versus nominal Treasuries at both the short and long ends of the curve. That is, within our overall underweight allocation to TIPS we continue to recommend positioning in breakeven curve steepeners and in real yield curve flatteners. We also continue to recommend an outright short position in 2-year TIPS. ABS: Overweight Chart 9ABS Market Overview
ABS Market Overview
ABS Market Overview
Asset-Backed Securities underperformed the duration-equivalent Treasury index by 26 basis points in March, dragging year-to-date excess returns down to -31 bps. Aaa-rated ABS underperformed by 21 bps on the month, dragging year-to-date excess returns down to -27 bps. Non-Aaa ABS underperformed by 49 bps on the month, dragging year-to-date excess returns down to -51 bps. During the past two years, substantial federal government support for household incomes has caused US households to build up an extremely large buffer of excess savings. During this period, many households have used their windfalls to pay down consumer debt and credit card debt levels have fallen to well below pre-COVID levels (Chart 9). Though consumer credit growth has rebounded, debt levels are still low. This indicates that the collateral quality backing consumer ABS remains exceptionally strong. This also indicates that while surging gasoline prices will weigh on consumer activity in the coming months, household balance sheets are starting from such a good place that we don’t expect a meaningful increase in consumer credit delinquencies. Investors should remain overweight consumer ABS and should take advantage of the high quality of household balance sheets by moving down the quality spectrum, favoring non-Aaa rated securities over Aaa-rated ones. Non-Agency CMBS: Overweight Chart 10CMBS Market Overview
CMBS Market Overview
CMBS Market Overview
Non-Agency Commercial Mortgage-Backed Securities outperformed the duration-equivalent Treasury index by 20 basis points in March, bringing year-to-date excess returns up to -78 bps. Aaa Non-Agency CMBS outperformed Treasuries by 25 bps on the month, bringing year-to-date excess returns up to -67 bps. Non-Aaa Non-Agency CMBS underperformed by 5 bps on the month, dragging year-to-date excess returns down to -110 bps. CMBS spreads remain wide compared to other similarly risky spread products. Further, commercial real estate (CRE) lending standards have recently shifted into “net easing” territory and demand for CRE loans is strengthening (Chart 10). In light of today’s downgrade of corporate credit, non-agency CMBS look like an attractive alternative to add some spread to a portfolio. Increase exposure from neutral (3 out of 5) to overweight (4 out of 5). Agency CMBS: Overweight Agency CMBS underperformed the duration-equivalent Treasury index by 17 basis points in March, dragging year-to-date excess returns down to -39 bps. The average index option-adjusted spread widened 5 bps on the month. It currently sits at 48 bps, not that far from its average pre-COVID level (bottom panel). Agency CMBS spreads also continue to look attractive compared to other similarly risky spread products. Stay overweight. Appendix A: The Golden Rule Of Bond Investing We follow a two-step process to formulate recommendations for bond portfolio duration. First, we determine the change in the federal funds rate that is priced into the yield curve for the next 12 months. Second, we decide – based on our assessments of the economy and Fed policy – whether the change in the fed funds rate will exceed or fall short of what is priced into the curve. Most of the time, a correct answer to this question leads to the appropriate duration call. We call this framework the Golden Rule Of Bond Investing, and we demonstrated its effectiveness in the US Bond Strategy Special Report, “The Golden Rule Of Bond Investing”, dated July 24, 2018. Chart 11 illustrates the Golden Rule’s track record by showing that the Bloomberg Barclays Treasury Master Index tends to outperform cash when rate hikes fall short of 12-month expectations, and vice-versa. At present, the market is priced for 255 basis points of rate hikes during the next 12 months. Chart 11The Golden Rule's Track Record
The Golden Rule's Track Record
The Golden Rule's Track Record
We can also use our Golden Rule framework to make 12-month total return and excess return forecasts for the Bloomberg Barclays Treasury index under different scenarios for the fed funds rate. Excess returns are relative to the Bloomberg Barclays Cash index. To forecast total returns we first calculate the 12-month fed funds rate surprise in each scenario by comparing the assumed change in the fed funds rate to the current value of our 12-month discounter. This rate hike surprise is then mapped to an expected change in the Treasury index yield using a regression based on the historical relationship between those two variables. Finally, we apply the expected change in index yield to the current characteristics (yield, duration and convexity) of the Treasury index to estimate total returns on a 12-month horizon. The below tables present those results, along with excess returns for a front-loaded and a back-loaded rate hike scenario. Excess returns are calculated by subtracting assumed cash returns in each scenario from our total return projections.
The Beginning Of The End
The Beginning Of The End
Appendix B: Butterfly Strategy Valuations The following tables present the current read-outs from our butterfly spread models. We use these models to identify opportunities to take duration-neutral positions across the Treasury curve. The following two Special Reports explain the models in more detail: US Bond Strategy Special Report, “Bullets, Barbells And Butterflies”, dated July 25, 2017, available at usbs.bcaresearch.com US Bond Strategy Special Report, “More Bullets, Barbells And Butterflies”, dated May 15, 2018, available at usbs.bcaresearch.com Table 4 shows the raw residuals from each model. A positive value indicates that the bullet is cheap relative to the duration-matched barbell. A negative value indicates that the barbell is cheap relative to the bullet. Table 4Butterfly Strategy Valuation: Raw Residuals In Basis Points (As Of March 31, 2022)
The Beginning Of The End
The Beginning Of The End
Table 5 scales the raw residuals in Table 4 by their historical means and standard deviations. This facilitates comparison between the different butterfly spreads. Table 5Butterfly Strategy Valuation: Standardized Residuals (As Of March 31, 2022)
The Beginning Of The End
The Beginning Of The End
Table 6 flips the models on their heads. It shows the change in the slope between the two barbell maturities that must be realized during the next six months to make returns between the bullet and barbell equal. For example, a reading of -55 bps in the 5 over 2/10 cell means that we would expect the 5-year to outperform the 2/10 if the 2/10 slope flattens by less than 55 bps during the next six months. Otherwise, we would expect the 2/10 barbell to outperform the 5-year bullet. Table 6Discounted Slope Change During Next 6 Months (BPs)
The Beginning Of The End
The Beginning Of The End
Appendix C: Excess Return Bond Map The Excess Return Bond Map is used to assess the relative risk/reward trade-off between different sectors of the US bond market. It is a purely computational exercise and does not impose any macroeconomic view. The Map’s vertical axis shows 12-month expected excess returns. These are proxied by each sector’s option-adjusted spread. Sectors plotting further toward the top of the Map have higher expected returns and vice-versa. Our novel risk measure called the “Risk Of Losing 100 bps” is shown on the Map’s horizontal axis. To calculate it, we first compute the spread widening required on a 12-month horizon for each sector to lose 100 bps or more relative to a duration-matched position in Treasury securities. Then, we divide that amount of spread widening by each sector’s historical spread volatility. The end result is the number of standard deviations of 12-month spread widening required for each sector to lose 100 bps or more versus a position in Treasuries. Lower risk sectors plot further to the right of the Map, and higher risk sectors plot further to the left. Chart 12Excess Return Bond Map (As Of March 31, 2022)
The Beginning Of The End
The Beginning Of The End
Ryan Swift US Bond Strategist rswift@bcaresearch.com Footnotes 1 Please see US Bond Strategy / US Investment Strategy / US Equity Strategy Special Report, “The Yield Curve As An Indicator”, dated March 29, 2022. 2 Please see US Bond Strategy Weekly Report, “The Omicron Impact”, dated November 30, 2021. 3 Please see US Bond Strategy / US Investment Strategy / US Equity Strategy Special Report, “The Yield Curve As An Indicator”, dated March 29, 2022. Recommended Portfolio Specification
The Beginning Of The End
The Beginning Of The End
Other Recommendations
The Beginning Of The End
The Beginning Of The End
Treasury Index Returns Spread Product Returns
Executive Summary Our recommended model bond portfolio outperformed its custom index by a robust +48bps in Q1/2022 – an impressive performance given the significant uncertainties stemming from the Ukraine war, surging commodity prices and hawkish central banks. This outperformance came entirely from the rates side of the portfolio (+52bps) as global government bond yields surged, driven by a large underweight to US Treasuries. The credit side of the portfolio was largely unchanged versus the benchmark (-4bps). Looking ahead, we see global bond yields as being more rangebound over the next six months. A lot of rate hikes in 2022 are already discounted (most notably in the US) and global inflation is likely to decelerate in Q2 & Q3. As the global monetary tightening cycle evolves, positioning more defensively in global credit, rather than duration management, will provide the better opportunity to generate alpha in bond portfolios. GFIS Model Bond Portfolio Recommended Positioning For The Next Six Months
GFIS Model Bond Portfolio Q1/2022 Review & Outlook: Trading The Consolidation Phase
GFIS Model Bond Portfolio Q1/2022 Review & Outlook: Trading The Consolidation Phase
Bottom Line: In our model bond portfolio, we are downgrading US investment grade corporates to underweight, and reducing high-yield exposure in the US and Europe to neutral. We are also reducing inflation-linked bond allocations in the US and euro area to underweight versus nominals. Feature The first three months were horrific for global bond markets. The Bloomberg Global Aggregate index delivered a total return of -6.2%, the second worst quarter since 1990. No sector, from government bonds to corporate debt to emerging market spread product, was immune to the pressures from soaring energy prices, war-driven uncertainty and hawkish central bankers belated responding to the worst bout of global inflation since the 1970s. Related Report Global Fixed Income StrategyOur Model Bond Portfolio Strategy To Begin 2022: Choosing Our Battles Wisely That toxic cocktail for bond returns may lose some potency in the coming months if a de-escalation of the Ukraine tensions can be reached. However, the bigger drivers of bond market volatility – high global inflation and the monetary tightening necessary to combat it – are more likely to linger for longer than expected. Government bond yields are unlikely to fall much in this environment. Increasingly, global credit spreads, especially for corporate debt in the US, will face intensifying widening pressure as central banks rapidly dial back pandemic-era monetary accommodation, led by the US Federal Reserve. With that in mind, we present our quarterly review of the BCA Research Global Fixed Income Strategy (GFIS) model bond portfolio for the first quarter of 2022. We also present our recommended positioning for the portfolio for the next six months, as well as portfolio return expectations for our base case and alternative investment scenarios. As a reminder to existing readers (and to new clients), the model portfolio is a part of our service that complements the usual macro analysis of global fixed income markets. The portfolio is how we communicate our opinion on the relative attractiveness between government bond and spread product sectors. We do this by applying actual percentage weightings to each of our recommendations within a fully invested hypothetical bond portfolio. Q1/2022 Model Bond Portfolio Performance: Regional Allocation Drives Outperformance Chart 1Q1/2022 Performance: Big Gains From Rising Bond Yields
Q1/2022 Performance: Big Gains From Rising Bond Yields
Q1/2022 Performance: Big Gains From Rising Bond Yields
The total return for the GFIS model portfolio (hedged into US dollars) in the third quarter was -4.6%, outperforming the custom benchmark index by +48bps (Chart 1).1 In terms of the specific breakdown between the government bond and spread product allocations in our model portfolio, the former generated +52bps of outperformance versus our custom benchmark index while the latter underperformed by -4bps. In an extremely negative quarter for fixed income both in terms of the breadth and depth of losses, our regional allocation choices helped us continue generating outperformance after we transitioned to a neutral overall portfolio duration stance in mid-February. Throughout the quarter, we maintained a significant underweight on US Treasuries in the portfolio, even after we tactically upgraded our duration tilt. We expected US government debt to still underperform that of other developed markets, even in an environment where the rise in global bond yields was due for a breather. Our rationale worked – admittedly helped by the inflationary shock of the Russian invasion of Ukraine - with the US Treasury part of our portfolio generating a whopping +63bps of outperformance (Table 1). Table 1GFIS Model Bond Portfolio Q1/2022 Overall Return Attribution
GFIS Model Bond Portfolio Q1/2022 Review & Outlook: Trading The Consolidation Phase
GFIS Model Bond Portfolio Q1/2022 Review & Outlook: Trading The Consolidation Phase
Meanwhile, our biggest government bond overweights were in Europe, a market we expected to perform defensively in a portfolio context. We were obviously caught offside on this call as energy prices and inflation expectations in Europe surged in response to the Ukraine conflict. In total, our portfolio lost -30bps in active return terms in euro area government bonds, with the losses spread evenly between the core and periphery. We did staunch the bleeding somewhat by reducing our allocation to the periphery in the last two weeks of the quarter and using the proceeds to fund an increased allocation to European investment grade corporates. The European corporate index spread has tightened -23bps since that switch. Turning to the credit side of the portfolio, the most successful position was our underweight tilt on emerging market (EM) USD-denominated corporates (+10bps) and sovereigns (+9bps) during a catastrophic quarter for EM risky assets driven by the conflict as well as weakness in the Chinese economy. We sustained losses from our overweight on US CMBS (-11bps) which was broadly offset by gains from our underweight on US MBS (+10bps). Lastly, while we were hurt by the sell-off in euro area high-yield (-13bps), where we were overweight to start 2022, we did scale back some of that exposure towards the end of the quarter when markets started to discount the risk of a “worst case” scenario of direct NATO intervention in Ukraine. The bar charts showing the total and relative returns for each individual government bond market and spread product sector in our model portfolio are presented in Charts 2 & 3. Chart 2GFIS Model Bond Portfolio Q1/2022 Government Bond Performance Attribution
GFIS Model Bond Portfolio Q1/2022 Review & Outlook: Trading The Consolidation Phase
GFIS Model Bond Portfolio Q1/2022 Review & Outlook: Trading The Consolidation Phase
Chart 3GFIS Model Bond Portfolio Q1/2022 Spread Product Performance Attribution By Sector
GFIS Model Bond Portfolio Q1/2022 Review & Outlook: Trading The Consolidation Phase
GFIS Model Bond Portfolio Q1/2022 Review & Outlook: Trading The Consolidation Phase
Biggest Outperformers: Underweight US Treasuries with a maturity greater than 10 years (+23bps) Underweight UK Gilts with a maturity greater than 10 years (+14bps) Underweight US treasuries with a maturity between 3 and 5 years (+12bps) Biggest Underperformers: Overweight euro area high-yield corporates (-13bps) Overweight US CMBS (-11bps) Overweight Spanish Bonos (-5bps) Chart 4 presents the ranked benchmark index returns of the individual countries and spread product sectors in the GFIS model bond portfolio for Q1/2022. Returns are hedged into US dollars (we do not take active currency risk in this portfolio) and adjusted to reflect duration differences between each country/sector and the overall custom benchmark index for the model portfolio. We have also color coded the bars in each chart to reflect our recommended investment stance for each market during Q1 (red for underweight, dark green for overweight, gray for neutral). Chart 4Ranking The Winners & Losers From The GFIS Model Bond Portfolio Universe In Q1/2022
GFIS Model Bond Portfolio Q1/2022 Review & Outlook: Trading The Consolidation Phase
GFIS Model Bond Portfolio Q1/2022 Review & Outlook: Trading The Consolidation Phase
Ideally, we would look to see more green bars on the left side of the chart where market returns are highest, and more red bars on the right side of the chart were returns are lowest. That pattern largely held true in Q1/2022, especially at the tail ends of the chart. During a quarter where all the major asset classes in our portfolio lost money on a hedged and duration-matched basis, we outperformed by selectively underweighting the worst performers. Notably, we were underweight UK Gilts (-1280bps) and EM Sovereigns (-1103bps) on the extreme right side of the chart. We were also underweight US Treasuries (-531bps) which, despite being in the middle of Chart 4, contributed hugely to our portfolio outperformance due to their large market cap weighting in the benchmark index. Broadly, this means that, except for Europe and Australia, our highest conviction calls worked in our favor during the quarter. Bottom Line: Our model bond portfolio outperformed its benchmark index in the third quarter of the year by +48bps – a positive result coming largely from underweight positions in US Treasuries, UK Gilts, and EM credit. Changes To Our Model Bond Portfolio Allocations The uncertainty stemming from the Russia/Ukraine conflict led us to temporarily neutralize many of the recommended exposures in the model bond portfolio. We not only moved to neutral on overall portfolio duration, we also neutralized individual country yield curve tilts and inflation-linked bond allocations. While the situation remains fluid, the worst-case scenarios of the conflict expanding beyond the borders of Ukraine appear to have been avoided. This leads us to reconsider where to once again take active risks on the rates side of the portfolio. Chart 5Our Duration Indicator Calling For Slowing Global Yield Momentum
Our Duration Indicator Calling For Slowing Global Yield Momentum
Our Duration Indicator Calling For Slowing Global Yield Momentum
Duration On overall portfolio duration, we are maintaining a neutral (“at benchmark”) stance in the portfolio. Our Global Duration Indicator is currently signaling that the strong upward momentum of global bond yields should fade over the next few months (Chart 5). Slowing global growth expectations – a trend that was already in place prior to the Ukraine conflict - are the major reason why our Duration Indicator has turned lower. The war-fueled surge in energy prices has helped push global bond yields higher through rising inflation breakevens, which also prompted central banks – most notably the Fed and the Bank of England (BoE)- to signal a need for a faster pace of interest rate hikes in 2022 despite softening growth momentum. Looking ahead, that strong link between oil prices and bond yields will not be broken until there is some sort of de-escalation of the Ukraine conflict, which does not appear imminent. This supports a near-term neutral overall duration stance. Yield Curve Allocations In terms of yield curve exposure, we see some opportunities to adjust allocations (Chart 6). US curves have inverted and UK curves are flirting with inversion as markets are pricing in more Fed/BoE tightening, while curves in Germany and France have bear-steepened with longer-term inflation expectations going up faster than shorter-term interest rate expectations. In the US and UK, the yield curve flattening also reflects the “front loading” of Fed/BoE rate hike expectations. Overnight index swap (OIS) curves are pricing in 190bps of rate hikes in the US, and 134bps in the UK, by the end of 2022. This is followed quickly by rate cuts discounted in H2/2023 and 2024 in both countries. We see it as more likely that both central banks will deliver fewer hikes than discounted in 2022 and but will push rates to higher levels than priced by the end of 2024. That leads us to add a mild steepening bias into our US and UK government bond allocations in the model bond portfolio. We offset that by inserting a flattening bias in the German and French yield curve allocations to keep the overall portfolio duration at 7.5 years, matching that of the custom benchmark index (Chart 7). Chart 6Curve Flattening In The US & UK Is Overdone
Curve Flattening In The US & UK Is Overdone
Curve Flattening In The US & UK Is Overdone
Chart 7Overall Portfolio Duration: Stay Neutral
Overall Portfolio Duration: Stay Neutral
Overall Portfolio Duration: Stay Neutral
Chart 8No Change To Our Country Allocations To Begin Q2/22
No Change To Our Country Allocations To Begin Q2/22
No Change To Our Country Allocations To Begin Q2/22
Country Allocations Turning to our country allocations, we see no need to make major changes right now (Chart 8). We still prefer to maintain an underweight stance on countries that are more likely to see multiple central bank rate hikes in 2022 (the US, UK, Canada) versus those that are less likely (Germany, France, Japan, Australia). We are also staying neutral on Italian and Spanish government bonds with the ECB set to taper the pace of its asset purchases in Q2. Less ECB buying raises the risk that higher yields will be required to entice private sector buyers to buy Italian and Spanish debt with a smaller central bank backstop. Inflation-Linked Bonds Our Comprehensive Breakeven Inflation (CBI) indicators assess the potential for a significant move in 10-year breakeven inflation rates, based on deviations from variables that typically correlate with breakevens like oil prices or survey-based measures of inflation expectations. At the moment, none of the CBIs for the eight countries in our model bond portfolio are below zero (Chart 9), which would be a signal that breakevens are too low and can move higher. Chart 9Inflation-Linked Bond Exposure: Reduce Europe & The US, Increase Canada
GFIS Model Bond Portfolio Q1/2022 Review & Outlook: Trading The Consolidation Phase
GFIS Model Bond Portfolio Q1/2022 Review & Outlook: Trading The Consolidation Phase
Canada has the lowest CBI, and last week, we added a tactical trade to go long 10-year Canadian inflation breakevens. We will add that position to our model bond portfolio this week, moving the Canadian “linkers” allocation to overweight versus nominal Canadian government bonds (within an overall underweight allocation to Canada in the model bond portfolio). On the other side of our CBI rankings are countries where the CBIs are well above zero and breakevens are more stretched: Germany, Italy, France and the US. We are currently neutral inflation-linked bonds in those four countries, but strictly as a hedge against the war-fueled risks of further increases in oil prices. Now, however, 10-year breakevens have widened to levels that already factor in more expensive oil, even with oil prices struggling to break out to new highs. As a result, we are downgrading the allocation to linkers in Germany, Italy, France and the US to underweight within the model bond portfolio (Chart 10). Corporate Bonds The most meaningful changes we are making to our model bond portfolio, and in our strategic investment recommendations, are to our corporate bond allocations: We are downgrading US investment grade corporate bond exposure from neutral to underweight (2 out of 5) We are downgrading US high-yield corporate bond exposure from overweight to neutral (3 out of 5) We are also downgrading euro area high-yield exposure from overweight to neutral (3 out of 5) Credit spreads across the developed market and EM space have fully unwound the surge seen after Russia invaded Ukraine on February 24 (Chart 11). We had turned more cautious on global spread product exposure in early March because of the war-fueled shock to energy prices and investor sentiment. We viewed this as a bigger issue for European and EM credit, with Europe heavily reliant on Russian energy supplies and EM market liquidity impacted by bans on trading of Russian assets. We therefore reduced exposures to European high-yield and EM hard currency debt in the model bond portfolio. Chart 10Our Inflation-Linked Bond Country Allocations
Our Inflation-Linked Bond Country Allocations
Our Inflation-Linked Bond Country Allocations
Now, while markets have become more sanguine about the prospects of a long war that can more directly draw in Western forces, a bigger threat to financial market stability has emerged – more aggressive tightening of global monetary policy led by the Fed. Chart 11Global Credit Spreads Have Returned To Pre-Invasion Levels
Global Credit Spreads Have Returned To Pre-Invasion Levels
Global Credit Spreads Have Returned To Pre-Invasion Levels
Chart 12Global Monetary Backdrop Turning More Negative For Credit
Global Monetary Backdrop Turning More Negative For Credit
Global Monetary Backdrop Turning More Negative For Credit
Already, the move away from quantitative easing by the Fed, ECB and BoE has led to a negative impulse for global credit returns (Chart 12). Excess returns for the Bloomberg Global Corporate and High-Yield indices are now essentially flat on a year-over-year basis, and the riskiest credit tiers of both indices are seeing the greater spread widening (bottom panel). Another indicator of tightening monetary policy, the flat US Treasury curve, is also signaling a poor environment for US credit market returns. Our colleagues at our sister service, BCA Research US Bond Strategy, have noted that when the 2-year/10-year US Treasury curve flattens below +25bps, the odds of US investment grade credit outperforming duration-matched Treasuries decline sharply. Dating back to 1973, the average excess return (over Treasuries) for the Bloomberg US investment grade index over the twelve months after the 2/10 curve flattens below +25bps is -0.56%. The 2/10 US Treasury curve is now inverted at -3bps, even with the Fed having only delivered a single +25bp rate hike so far in the current cycle. This is a highly unusual occurrence, as the Treasury curve typically inverts after the Fed has delivered multiple rate hikes in a tightening cycle. Bond investors are clearly “front-running” the Fed in discounting aggressive rate hikes in 2022 in response to US inflation near 8%. We think the Fed will deliver fewer hikes than markets are discounting this year, but will do more in 2023 and 2024. Yet the message from the now-inverted yield curve, and what it means for corporate bond performance, is too powerful to ignore. This underpins our decision to downgrade our recommended allocation to US investment grade to underweight. We do not, however, see a need to move the allocations for other corporate bond markets as aggressively. The credit spread widening seen so far in 2022 in the US and Europe – a trend that was already in place before the start of the Ukraine war – has restored more value to European corporate spreads compared to US equivalents. That can be seen when looking at our preferred measure of spread valuations, 12-month breakeven spreads.2 The historical percentile ranking of the 12-month breakeven spread is 63% for euro area investment grade and a much lower 23% for US investment grade (Chart 13). The absolute level of the euro area ranking justifies maintaining an overweight stance on euro area investment grade, both in absolute terms and relative to US investment grade. A smaller gap exists for high-yield, where the euro area 12-month breakeven spread percentile ranking is 50% versus 33% in the US. Those lower percentile rankings justify no higher than a neutral allocation to high-yield on either side of the Atlantic. On the surface, maintaining a higher allocation to US high-yield over US investment grade does appear counter-intuitive in an environment where the US Treasury curve is inverted and investors are growing increasingly worried that the Fed will need to engineer a major growth slowdown to cool inflation. However, that same high inflation helps to maintain a fast enough pace of nominal economic growth to limit the default risk for riskier borrowers. Moody’s estimates that the default rate for high-yield corporates will reach 3.1% in the US and 2.6% in Europe by year-end. Using those estimates, we can calculate a default-adjusted spread, or the current high-yield spread minus one-year-ahead expected default losses. That spread is currently 134bps in the US and 206bps in Europe, both well above the low end of the long-run range and closer to the long-run average (Chart 14). Those are levels that are consistent with a neutral allocation to high-yield in both regions, as current spreads offer a decent cushion in an environment of relatively low default risk. Chart 13More Attractive Spread Levels In Europe Vs. US
More Attractive Spread Levels In Europe Vs. US
More Attractive Spread Levels In Europe Vs. US
Chart 14Low Default Risk Helps Support High-Yield Valuations
Low Default Risk Helps Support High-Yield Valuations
Low Default Risk Helps Support High-Yield Valuations
Chart 15Persistent Headwinds To EM Credit Performance
Persistent Headwinds To EM Credit Performance
Persistent Headwinds To EM Credit Performance
Emerging Markets Finally, we continue to see more reasons to be cautious on EM USD-denominated credit, given the lack of support from typical fundamental drivers (Chart 15). Weak Chinese growth, slowing commodity price momentum (on a year-over-year basis), and a firm US dollar are all factors that weigh on EM economic growth and the ability to service hard-currency debt. We are maintaining an underweight allocation to EM USD-denominated sovereign and corporate debt in our model bond portfolio. Indications that China is ready to introduce more fiscal and monetary stimulus, and/or if the Fed’s messaging turned less hawkish – and less US dollar bullish – would be the signals necessary for us to consider an EM upgrade. Summing It All Up The full list of our recommended portfolio allocations after making all of the above changes can be seen in Table 2. The changes leave the portfolio with the following high-level characteristics: Table 2GFIS Model Bond Portfolio Recommended Positioning For The Next Six Months
GFIS Model Bond Portfolio Q1/2022 Review & Outlook: Trading The Consolidation Phase
GFIS Model Bond Portfolio Q1/2022 Review & Outlook: Trading The Consolidation Phase
Chart 16Overall Portfolio Allocation: Underweight Spread Product Vs Governments
GFIS Model Bond Portfolio Q1/2022 Review & Outlook: Trading The Consolidation Phase
GFIS Model Bond Portfolio Q1/2022 Review & Outlook: Trading The Consolidation Phase
the overall duration exposure remains at-benchmark (i.e. neutral) the portfolio has now flipped to an underweight stance on the exposure of spread product to government bonds, equal to four percentage points of the portfolio (Chart 16) the tracking error of the portfolio, or its expected volatility in excess of that of the benchmark, is 80bps – a level similar to that before the changes were made and still well below our self-imposed 100bps tracking error limit (Chart 17) the portfolio now has a yield below that of the custom benchmark index, equal to 2.51% (Chart 18). Chart 17Overall Portfolio Risk: Moderate
Overall Portfolio Risk: Moderate
Overall Portfolio Risk: Moderate
Chart 18Overall Portfolio Yield: Below-Benchmark
Overall Portfolio Yield: Below-Benchmark
Overall Portfolio Yield: Below-Benchmark
The changes leave the portfolio much more exposed to a widening of global credit spreads than a rise in government bond yields – a desired outcome with bond yields already discounting a lot of tightening but credit spreads still at historically tight levels. Bottom Line: As the global monetary tightening cycle evolves, positioning more defensively in global credit, rather than duration management, will provide the better opportunity to generate alpha in bond portfolios. We are expressing that by cutting the exposure to corporate bonds in our model bond portfolio. Portfolio Scenario Analysis For The Next Six Months After making all the specific changes to our model portfolio weightings, which can be seen in the tables on pages 23-25, we now turn to our regular quarterly scenario analysis to determine the return expectations for the portfolio for the next six months. On the credit side of the portfolio, we use risk-factor-based regression models to forecast future yield changes for global spread product sectors as a function of four major factors - the VIX, oil prices, the US dollar and the fed funds rate (Table 3A). For the government bond side of the portfolio, we avoid using regression models and instead use a yield-beta driven framework, taking forecasts for changes in US Treasury yields and translating those in changes in non-US bond yields by applying a historical yield beta (Table 3B). Table 3AFactor Regressions Used To Estimate Spread Product Yield Changes
GFIS Model Bond Portfolio Q1/2022 Review & Outlook: Trading The Consolidation Phase
GFIS Model Bond Portfolio Q1/2022 Review & Outlook: Trading The Consolidation Phase
Table 3BEstimated Government Bond Yield Betas To US Treasuries
GFIS Model Bond Portfolio Q1/2022 Review & Outlook: Trading The Consolidation Phase
GFIS Model Bond Portfolio Q1/2022 Review & Outlook: Trading The Consolidation Phase
For our scenario analysis over the next six months, we use a base case scenario plus two alternate “tail risk” scenarios. In the current environment, our scenarios center around developments in the Ukraine/Russia conflict and the impacts on uncertainty and commodity-fueled inflation. Base Case There is no further escalation of the Ukraine/Russia conflict, possibly resulting in a temporary ceasefire. Oil prices pull back on a lower war risk premium, helping lower inflation expectations. Global realized inflation peaks during Q2/2022, alongside some moderation of global growth in lagged response to high energy prices. Within that slower pace of global growth, the US outperforms Europe while Chinese growth remains weak because of COVID lockdowns (although that will eventually lead to more stimulus from Chinese policymakers). The Fed delivers 100bps of rate hikes by July, starting with a 50bp increase at the May meeting, before pausing at the September meeting in response to slowing US inflation and growth. There is a mild bear flattening of the US Treasury curve, but yields remain broadly unchanged over the full six month scenario period with the Fed not hiking by more than currently discounted. The Brent oil price retreats by -10%, the US dollar modestly appreciates by 2%, the VIX stays close to current levels at 20 and the fed funds rate reaches 1.5%. Escalation Scenario The is no reduction in Ukraine war tensions, with increased Russian aggression resulting in greater NATO military involvement. The risk premium in oil prices increases, delaying the expected peak in global inflation until the second half of 2022. Inflation expectations remain elevated. Global growth weakens more than in the base case scenario because of higher energy prices, but with US growth still outperforming Europe. China’s economy remains weighed down by COVID lockdowns and an inadequate fiscal/monetary/credit policy response. The Fed is forced to be more aggressive because of high inflation expectations, delivering 150bps of hikes by September. The US Treasury curve bear-flattens, but with Treasury yields rising across the curve through wider TIPS breakevens and greater-than-expected rate hikes keeping real yields stable. The Brent oil price rises +25%, the VIX index climbs to 30, the US dollar appreciates by +5% thanks to slowing global growth and a more aggressive move by the Fed to push the funds rate to 2%. De-Escalation Scenario There is a full and lasting ceasefire between Russia and Ukraine. The war risk premium in oil prices collapses, allowing global inflation to peak in Q2 and then decline rapidly. Global growth sentiment improves because of lower energy prices and diminished worries about a wider world war. European growth outperforms US growth (relative to expectations) as European natural gas prices decline. China responds faster than expected to the latest COVID wave with more aggressive policy stimulus. Lower inflation allows the Fed to be more patient on rate hikes, delivering only 75bps of hikes by July before pausing. The Treasury curve moderately bull-steepens, although the absolute decline in nominal Treasury yields is fairly small as lower TIPS breakevens are partially offset by higher real yields (as growth sentiment improves). The Brent oil price falls -20%, the VIX index drifts down to 18, and the US dollar depreciates by -3% as global growth improves and the Fed pushes the funds rate to a less-than-expected 1.25% by July. The excess return scenarios for the model bond portfolio, using the above inputs in our simple quantitative return forecast framework, are shown in Table 4A. The US Treasury yield assumptions are shown in Table 4B. For the more visually inclined, we present charts showing the model inputs and Treasury yield projections in Chart 19 and Chart 20, respectively. Table 4AGFIS Model Bond Portfolio Scenario Analysis For The Next Six Months
GFIS Model Bond Portfolio Q1/2022 Review & Outlook: Trading The Consolidation Phase
GFIS Model Bond Portfolio Q1/2022 Review & Outlook: Trading The Consolidation Phase
Table 4BUS Treasury Yield Assumptions For The 6-Month Forward Scenario Analysis
GFIS Model Bond Portfolio Q1/2022 Review & Outlook: Trading The Consolidation Phase
GFIS Model Bond Portfolio Q1/2022 Review & Outlook: Trading The Consolidation Phase
Chart 19Risk Factor Assumptions For The Scenario Analysis
Risk Factor Assumptions For The Scenario Analysis
Risk Factor Assumptions For The Scenario Analysis
Chart 20US Treasury Yield Assumptions For The Scenario Analysis
US Treasury Yield Assumptions For The Scenario Analysis
US Treasury Yield Assumptions For The Scenario Analysis
Given our neutral overall portfolio duration stance, and the mild changes in nominal bond yields implied by our forecasts, it should not be surprising that the rates side of the portfolio is expected to not contribute any excess return in Q2 and Q3. However, Fed rate hikes – which push up yields on spread product in the forecasting regressions – result in negative credit returns in all scenarios (especially in the cases where the VIX is expected to rise). Thus, the return on the credit side of the model portfolio, where we are now underweight credit risk, will be the main driver of performance, delivering a range of excess return outcomes between +29bps and +53bps. Bottom Line: The next six months will be about locking in the significant gains in our model bond portfolio performance from rising bond yields, and transitioning to outperforming via wider credit spreads in US investment grade and EM hard currency debt. Robert Robis, CFA Chief Fixed Income Strategist rrobis@bcaresearch.com Shakti Sharma Senior Analyst ShaktiS@bcaresearch.com Footnotes 1 The GFIS model bond portfolio custom benchmark index is the Bloomberg Barclays Global Aggregate Index, but with allocations to global high-yield corporate debt replacing very high-quality spread product (i.e. AA-rated). We believe this to be more indicative of the typical internal benchmark used by global multi-sector fixed income managers. 2 12-month breakeven spreads compare the option-adjusted spread (OAS) of a credit market or sector to its duration, using Bloomberg bond index data. The breakeven spread is the amount of spread widening that must occur over a one-year horizon to make the total return of a credit instrument equal to that of duration-matched risk-free government debt. GFIS Model Bond Portfolio Recommended Positioning Active Duration Contribution: GFIS Recommended Portfolio Vs. Custom Performance Benchmark
GFIS Model Bond Portfolio Q1/2022 Review & Outlook: Trading The Consolidation Phase
GFIS Model Bond Portfolio Q1/2022 Review & Outlook: Trading The Consolidation Phase
The GFIS Recommended Portfolio Vs. The Custom Benchmark Index Global Fixed Income - Strategic Recommendations* Cyclical Recommendations (6-18 Months)
GFIS Model Bond Portfolio Q1/2022 Review & Outlook: Trading The Consolidation Phase
GFIS Model Bond Portfolio Q1/2022 Review & Outlook: Trading The Consolidation Phase
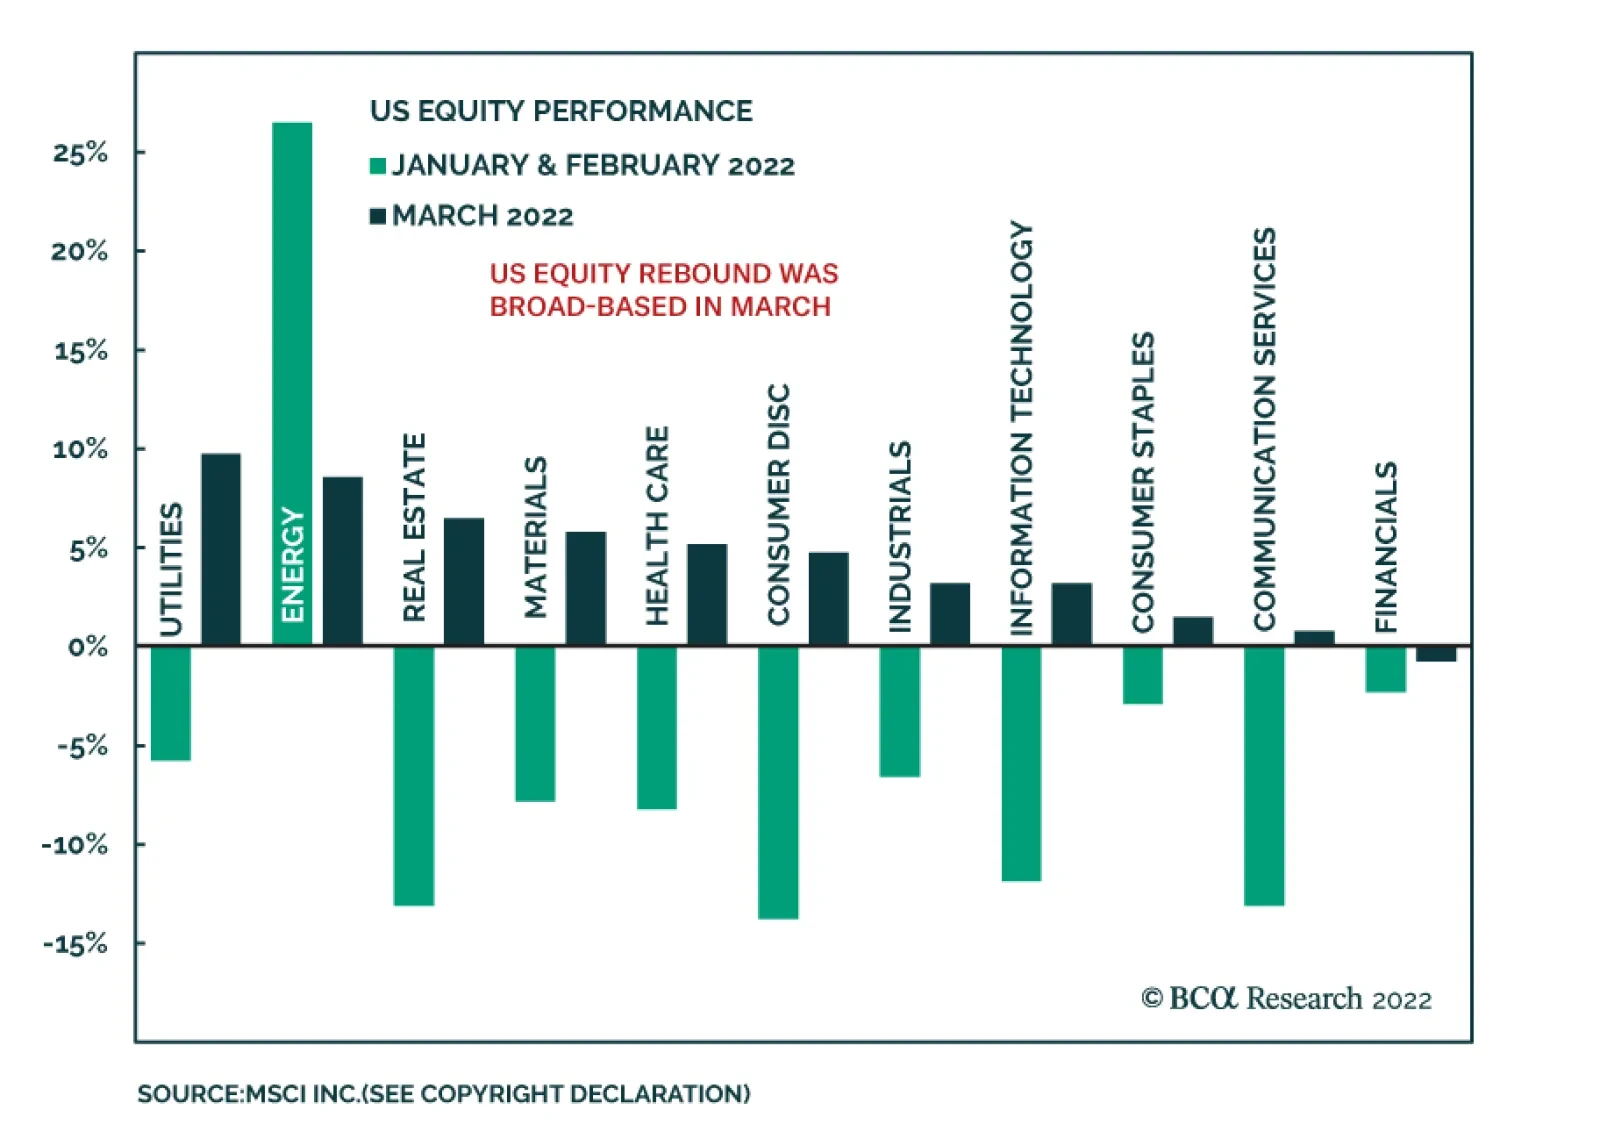
In our March In Review, we highlighted that US equities were the only major global bourse to post positive returns in March. Notably, the improvement was broad-based with nearly all US equity sectors ending the month in the green. Utilities led US stocks…
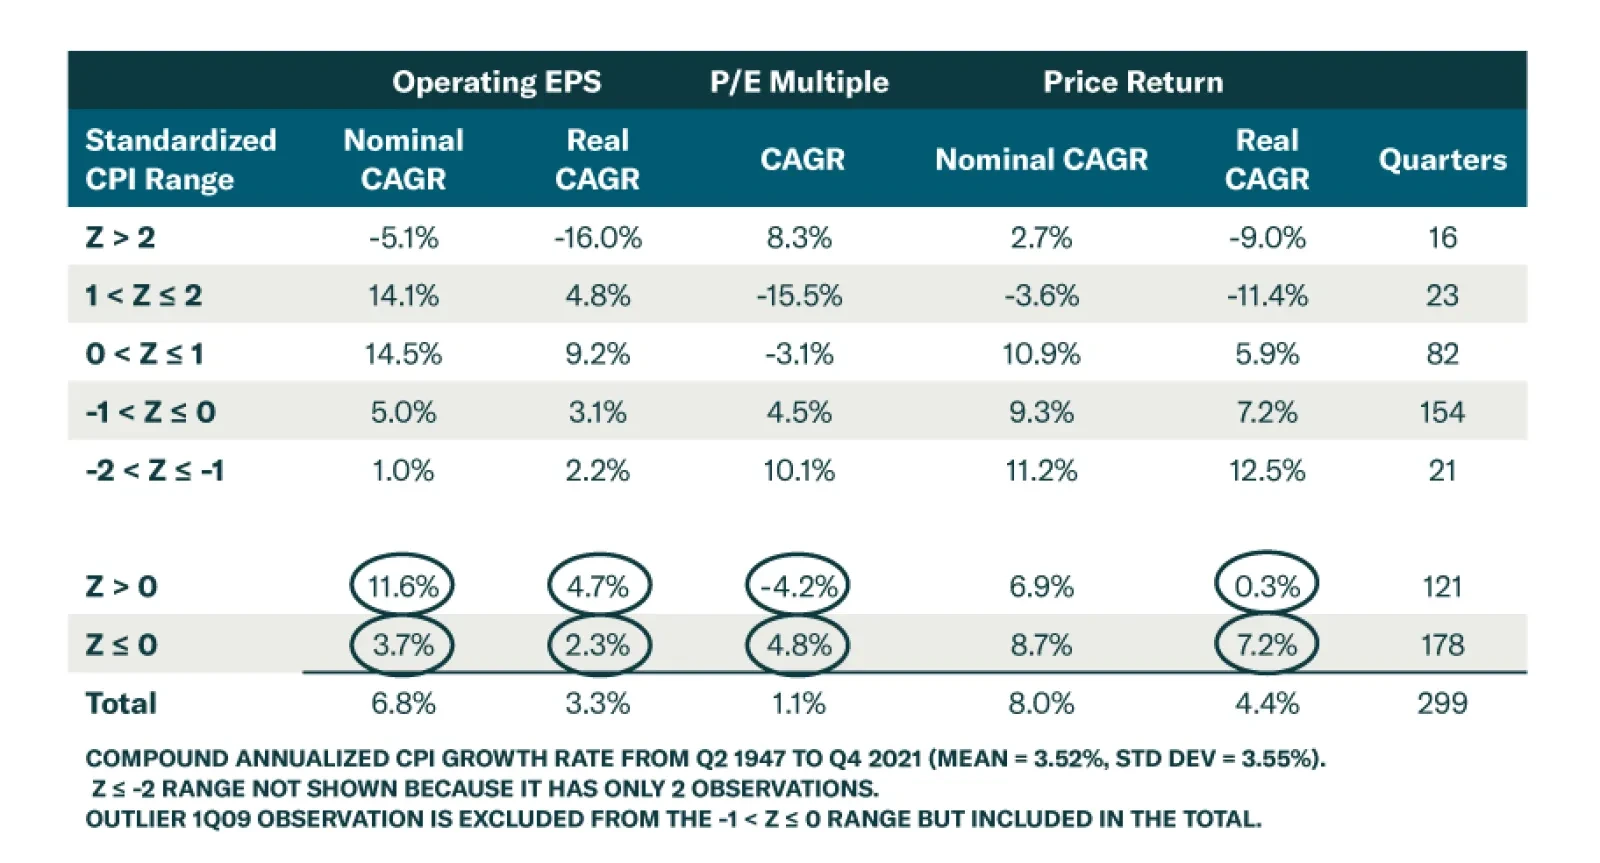
BCA Research’s US Investment Strategy service reviewed the performance of S&P 500 operating earnings, earnings multiples and returns in five inflation regimes to see how equities have responded to inflation over the last 75 years. In the extreme…
Executive Summary Tighter Financial Conditions May Affect Growth
Tighter Financial Conditions May Affect Growth
Tighter Financial Conditions May Affect Growth
Inflation Outlook: Inflation is becoming entrenched, spreading beyond a few pandemic-related items to “sticky price” categories. A wage-price spiral and unmoored inflation expectations translate into upside risk to the 2.5% consensus core PCE forecast. Consumer Spending: Americans are being forced to allocate a larger proportion of income towards food and gas, shifting consumption away from discretionary spending. As such, consumer spending alone may not be able to keep the economy afloat. On a 50bps hike: The rate hike increments are less important than the message the Fed is sending out to the market: Talking up 50 bp rate rises, the Fed is signaling that is it laser-focused on inflation, which is reassuring. Tightening and the economy: Aggressive monetary tightening will lead to slower economic growth, but this is not yet reflected in consensus economic growth forecasts. Recession Coming? Economic growth is slowing but off high levels, and recession is not imminent. Our recession indicator does not flash danger. However, we are watching out for a growth disappointment. Bottom Line: In a commentary to our bi-monthly sector chart pack report, we provide answers to the most frequently asked questions on the state of the US economy. Feature Performance Markets never cease to surprise. In March, US equities staged an unexpected rally despite the backdrop of a hawkish Fed, raging inflation, surging energy prices, and a war in the heart of Europe. The reversal was broad-based, not leaving a single sector in the red (Chart I-1). The S&P 500 has regained 9% since the market bottom on March 8, 2022 and is only 5.5% off its all-time high. The NASDAQ has rebounded 13%. Is this rally sustainable? In a report a couple of weeks ago, we aimed to answer this question. We recommended patience, although many ingredients, such as attractive valuations and oversold technical conditions, were already in place. Our reasons for patience were that: Economic growth expectations are still elevated and bottom-up earnings growth forecasts need to come down, to reflect slowing growth, a tighter monetary regime, and higher commodities and energy prices. Our view is unchanged. This week was a busy one: A media interview with The Deep Dive, and two virtual conferences in Australia, one run by Insider Network and the other by Equity Forum. In today’s cover report for our sector chartpack, we answer questions we received from the media and conference audience, that we believe will be of interest to clients. Chart I-1Powerful Rebound
INFLATION EXPECTATIONS
INFLATION EXPECTATIONS
Questions And Answers The Consumer Price Index (CPI) increased by 7.9% and the PCE price index, the Fed’s preferred measure of inflation, came in at 6.4% in February – readings not seen since 1982. What is your outlook on inflation? Inflation will come down, assisted by the arithmetic of the base effect. However, it is unlikely to revert to levels that the Fed and the US consumer will consider acceptable. Moreover, inflation could surprise further to the upside. The concern is that inflation is becoming entrenched. It has spread beyond a few pandemic-related items to goods for which prices are usually sticky (Chart I-2). There are also clear signs that price increases are feeding through to wage increases. Real wage growth remains negative at -2%, while demand for labor is robust – there are 1.7 open jobs per job seeker, and companies are raising wages to retain talent (Chart I-3). Subsequently, they will raise prices to pass on cost increases to customers. These are fertile conditions for a wage-price spiral, with inflation becoming even more entrenched. Chart I-2Even Sticky Prices Are Now Rising
Even Sticky Prices Are Now Rising
Even Sticky Prices Are Now Rising
Chart I-3Rising Wages Are In Lockstep With Rising Prices
Rising Wages Are In Lockstep With Rising Prices
Rising Wages Are In Lockstep With Rising Prices
Further, inflation expectations have become unmoored: According to a University of Michigan survey, consumers expect prices to rise by 5.5% over the next year, and by more than 3% a year over five to 10 years (Chart I-4). Concerningly, the upward adjustment in inflation expectations is relentless. The war in Ukraine exacerbates many causes of inflation: Its indirect effects are shortages of raw materials, energy, and shipping disruptions (Chart I-5). Chart I-4Inflation Expectations Are Unmoored
Inflation Expectations Are Unmoored
Inflation Expectations Are Unmoored
Chart I-5Supply Chains Remain Disrupted
Supply Chains Remain Disrupted
Supply Chains Remain Disrupted
Consensus forecasts for US core PCE inflation see it coming down to 2.5% by next year. The risk is that it could exceed that. Bottom Line: Inflation will come down but may not normalize any time soon. What is the effect of food and energy inflation on consumer spending? Negative real wage growth bites into consumer purchasing power, sapping confidence (Chart I-6). It does not help that food and energy prices are up by 8% and 14% respectively year over year (Chart I-7). However, the rising price of necessities has the most pronounced effect on low earners: Food accounts for more than a quarter of the after-tax income of the lowest quintile of earners, falling to just over five percent of income for top earners (Chart I-8). As many Americans are forced to allocate a larger proportion of income towards food and gas, they have to shift consumption away from discretionary spending. Thus, a high price for gasoline does not necessarily suppress demand for gasoline but rather reduces demand for, say, fast-food meals. Chart I-6High Inflation Saps Consumer Confidence
High Inflation Saps Consumer Confidence
High Inflation Saps Consumer Confidence
Chart I-7Food And Energy Prices Have Surged
Food And Energy Prices Have Surged
Food And Energy Prices Have Surged
This change in a spending basket explains a slowdown in consumer spending: PCE increased only 0.2% month-on-month in February, which is underwhelming compared to the 0.7% expected. It also explains rising credit-card balances (Chart I-9). Chart 8Rising Cost Of Food Cuts Into Discretionary Spending...
Sector Chart Pack Commentary
Sector Chart Pack Commentary
Chart I-9Many Consumers Are Struggling
Many Consumers Are Struggling
Many Consumers Are Struggling
At the same time, we know that US consumers have $2.3 trillion in excess savings – which are clearly not uniformly distributed across income groups. This nice stash of cash provides a solid consumer spending cushion for the US economy, but it may not be up to the challenge of keeping the economy afloat single-handedly. Bottom Line: For now, the US consumer is in good shape but there are cracks in the foundation as lower-income Americans are clearly struggling with rising food and gas prices. Fed Chair Jerome Powell noted last week that the Fed could raise rates from the traditional 25 basis points per meeting to 50 basis points if necessary. Do you think 50 basis points will have much of an impact on inflation or on the real economy? The Fed has gotten way behind the curve. In retrospect, it should have raised rates last summer – and it now understands its error. Its first hike this cycle came only when the economy had already over-heated (Chart I-10). At long last, the Fed, despite its dual objective, is laser-focused on inflation. As with most central banks, signaling is presumably more important than action – remember the famous Mario Draghi’s “whatever it takes.” Talking up 50 bp rate rises, the Fed is signaling that “the inflation cop is back in town.” And while it will be hard for the Fed to put the inflation genie back in the bottle, it is reassuring that it will at least try. As for a potential 50-basis-point rate rise, for now it does not present an immediate threat to the real economy: Real rates remain negative and monetary conditions are fairly loose, while the neutral rate (that elusive r-star) is still quite a ways off from where the rates are now (Chart I-11). Bottom Line: The rate hike increments are less important than the message the Fed is sending out to the market. Chart I-10The Fed Is Behind The Curve
Sector Chart Pack Commentary
Sector Chart Pack Commentary
Chart I-11The Market Expects The Fed To Move Aggressively To Combat Inflation
The Market Expects The Fed To Move Aggressively To Combat Inflation
The Market Expects The Fed To Move Aggressively To Combat Inflation
What will be the effect of monetary tightening on economic growth? Related Report US Equity StrategyHave US Equities Hit Rock Bottom? While early on, rate hikes can be shrugged off by a strong economy, over time, tighter financial conditions necessary to combat inflation, augur badly for growth. While financial conditions are still loose, they have already tightened on the back of higher long-term rates, widening credit spreads, and a strengthening dollar. The Goldman Sachs Financial Conditions Index points to the ISM Manufacturing Index falling below 50 later this year (Chart I-12). However, as we have pointed out in our “Have We Hit Rock Bottom Yet?” report, GDP growth forecasts do not reflect tighter monetary conditions and higher commodity prices (Chart I-13). The Atlanta Fed Nowcast points to only 0.9% annualized growth in Q1, yet consensus expectations have barely budged. Bottom Line: Aggressive monetary tightening will lead to slower economic growth. Chart I-12Tighter Financial Conditions May Affect Growth
Tighter Financial Conditions May Affect Growth
Tighter Financial Conditions May Affect Growth
Chart I-13The GDP Forecasts Have Not Been Revised Down To Reflect New Challenges
The GDP Forecasts Have Not Been Revised Down To Reflect New Challenges
The GDP Forecasts Have Not Been Revised Down To Reflect New Challenges
Investors are increasingly worried that the US is heading for a recession. What are your views? As my colleague, US Investment Strategist Doug Peta has put it: “Fed Chair Powell is attempting to steer the US economy between the Scylla of a recession and the Charybdis of entrenched high inflation.” Indeed, the Fed has a narrow margin of error for achieving a “soft landing.” The war in Ukraine makes the Fed’s objective even more challenging. Alan Blinder, a former Fed economist and current Princeton University professor who has a forthcoming book on monetary and fiscal policy history over the past 60 years, says the Fed has just once in the last 11 tightening periods nailed a “perfect soft landing” – in the early 1990s. But twice more, in the mid-1960s and early 1980s, the central bank raised interest rates without sparking an official recession—and such “soft-ish” landings, he said in a recent presentation, are not all that rare.1 This is a track record we find disturbing. However, we share Powell’s view that “the probability of a recession within the next year is not particularly elevated… all signs are that this is a strong economy and, indeed, one that will be able to flourish… in the face of less accommodative monetary policy.” We concur. A recession is unlikely in the next 12 months or so. The US economy is in the midst of a classic slowdown stage of the business cycle: Growth is still strong albeit slowing, inflation is elevated, liquidity is (still) abundant, capacity utilization is high, and the unemployment rate is low (Table 1). The American consumer is unhappy but has not tightened purse strings much yet. Importantly, growth is slowing off high levels so this stage can take a long time (Chart I-14). Table I-1Stages Of The Business Cycle
Sector Chart Pack Commentary
Sector Chart Pack Commentary
Doug Peta’s simple recession indicator, built from components that have reliably provided an advance warning, reinforces this conclusion. The 3-month/10-year segment of the yield curve is not yet close to inverting (Chart I-15). Chart I-14The Business Cycle Indicator Signals Slowdown
The Business Cycle Indicator Signals Slowdown
The Business Cycle Indicator Signals Slowdown
Chart I-1510-Year Treasury Yield Less 3-Months Treasury Bills Segment Is Not Inverted
10-Year Treasury Yield Less 3-Months Treasury Bills Segment Is Not Inverted
10-Year Treasury Yield Less 3-Months Treasury Bills Segment Is Not Inverted
The year-over-year change in the Conference Board’s Leading Economic Index is way above the zero line that has signaled past recessions (Chart I-16). The ISM Manufacturing PMI is well above 50. The Fed funds rate is nowhere near its equilibrium/neutral level, which we judge to be north of 3%, and it is highly unlikely to get there by the end of the year (Chart I-17). Chart I-16The LEI YoY% Is Way Above Zero
The LEI YoY% Is Way Above Zero
The LEI YoY% Is Way Above Zero
Chart I-17The Fed Funds Rate Is Far From Neutral
The Fed Funds Rate Is Far From Neutral
The Fed Funds Rate Is Far From Neutral
Excluding the pandemic, recessions over the last 50-plus years have occurred only when all three components sound the alarm; not one is flashing red now and not one is likely to do so during 2022. Bottom Line: We are watching out not for a recession, but for a growth disappointment. Irene Tunkel Chief Strategist, US Equity Strategy irene.tunkel@bcaresearch.com S&P 500 Chart II-1Macroeconomic Backdrop
Macroeconomic Backdrop
Macroeconomic Backdrop
Chart II-2Profitability
Profitability
Profitability
Chart II-3Valuations And Technicals
Valuations And Technicals
Valuations And Technicals
Chart II-4Uses Of Cash
Uses Of Cash
Uses Of Cash
Communication Services Chart II-5Macroeconomic Backdrop
Macroeconomic Backdrop
Macroeconomic Backdrop
Chart II-6Profitability
Profitability
Profitability
Chart II-7Valuations And Technicals
Valuations And Technicals
Valuations And Technicals
Chart II-8Uses Of Cash
Uses Of Cash
Uses Of Cash
Consumer Discretionary Chart II-9Macroeconomic Backdrop
Macroeconomic Backdrop
Macroeconomic Backdrop
Chart II-10Profitability
Profitability
Profitability
Chart II-11Valuations And Technicals
Valuations And Technicals
Valuations And Technicals
Chart II-12Uses Of Cash
Uses Of Cash
Uses Of Cash
Consumer Staples Chart II-13Macroeconomic Backdrop
Macroeconomic Backdrop
Macroeconomic Backdrop
Chart II-14Profitability
Profitability
Profitability
Chart II-15Valuations And Technicals
Valuations And Technicals
Valuations And Technicals
Chart II-16Uses Of Cash
Uses Of Cash
Uses Of Cash
Energy Chart II-17Macroeconomic Backdrop
Macroeconomic Backdrop
Macroeconomic Backdrop
Chart II-18Profitability
Profitability
Profitability
Chart II-19Valuations And Technicals
Valuations And Technicals
Valuations And Technicals
Chart II-20Uses Of Cash
Uses Of Cash
Uses Of Cash
Financials Chart II-21Macroeconomic Backdrop
Macroeconomic Backdrop
Macroeconomic Backdrop
Chart II-22Profitability
Profitability
Profitability
Chart II-23Valuations And Technicals
Valuations And Technicals
Valuations And Technicals
Chart II-24Uses Of Cash
Uses Of Cash
Uses Of Cash
Health Care Chart II-25Sector vs Industry Groups
Sector vs Industry Groups
Sector vs Industry Groups
Chart II-26Profitability
Profitability
Profitability
Chart II-27Valuations And Technicals
Valuations And Technicals
Valuations And Technicals
Chart II-28Uses Of Cash
Uses Of Cash
Uses Of Cash
Industrials Chart II-29Macroeconomic Backdrop
Macroeconomic Backdrop
Macroeconomic Backdrop
Chart II-30Profitability
Profitability
Profitability
Chart II-31Valuations And Technicals
Valuations And Technicals
Valuations And Technicals
Chart II-32Uses Of Cash
Uses Of Cash
Uses Of Cash
Information Technology Chart II-33Macroeconomic Backdrop
Macroeconomic Backdrop
Macroeconomic Backdrop
Chart II-34Profitability
Profitability
Profitability
Chart II-35Valuations And Technicals
Valuations And Technicals
Valuations And Technicals
Chart II-36Uses Of Cash
Uses Of Cash
Uses Of Cash
Materials Chart II-37Macroeconomic Backdrop
Macroeconomic Backdrop
Macroeconomic Backdrop
Chart II-38Profitability
Profitability
Profitability
Chart II-39Valuations And Technicals
Valuations And Technicals
Valuations And Technicals
Chart II-40Uses Of Cash
Uses Of Cash
Uses Of Cash
Real Estate Chart II-41Macroeconomic Backdrop
Macroeconomic Backdrop
Macroeconomic Backdrop
Chart II-42Profitability
Profitability
Profitability
Chart II-43Valuations And Technicals
Valuations And Technicals
Valuations And Technicals
Chart II-44Uses Of Cash
Uses Of Cash
Uses Of Cash
Utilities Chart II-45Macroeconomic Backdrop
Macroeconomic Backdrop
Macroeconomic Backdrop
Chart II-46Profitability
Profitability
Profitability
Chart II-47Valuations And Technicals
Valuations And Technicals
Valuations And Technicals
Chart II-48Uses Of Cash
Uses Of Cash
Uses Of Cash
Table II-1Performance
Sector Chart Pack Commentary
Sector Chart Pack Commentary
Table II-2Valuations And Forward Earnings Growth
Sector Chart Pack Commentary
Sector Chart Pack Commentary
Footnotes 1 "Recession Risks Are Rising. Can the Fed Stick a Soft Landing?" Barron's (barrons.com) Recommended Allocation Recommended Allocation: Addendum
Sector Chart Pack Commentary
Sector Chart Pack Commentary
Executive Summary US inflation is running at its highest level in over four decades. Although we expect it will soon peak, it appears certain to remain above the Fed’s 2% target level for an extended period. The war in Ukraine and COVID’s assault on China could give rise to a new round of supply disruptions that keep inflation at very high levels even after the initial wave of bottlenecks is cleared. Long-term price stability may best position an economy to achieve its potential, but real S&P 500 earnings have grown twice as fast when CPI inflation is above its mean than they have when it is below its mean. Historically, inflation has only begun to squeeze nominal earnings growth at two-standard-deviation extremes. Meaningful equity de-rating has been a feature when inflation exceeds its mean, however, and investors will have to be alert for any signs that TINA might be losing its grip on financial markets. We do not think that low-to-no-yield Treasuries or cash yet offer an appealing alternative, but animal spirits are always subject to change. Bumping Up Against Tactical Limits
Bumping Up Against Tactical Limits
Bumping Up Against Tactical Limits
Bottom Line: The question of how to navigate an inflationary environment is likely to be with investors across 2022 and beyond. We continue to recommend overweighting equities over our cyclical 6-12-month timeframe, but risks are heightened and we will change course if conditions dictate. Feature With consumer prices rising at a clip not seen in over 40 years, inflation is a hot-button topic for anyone with even a passing interest in the US economy. The relentless series of upside inflation surprises have investors preoccupied with finding havens. To help get a handle on where to invest against varying inflation backdrops, we divided inflation into five regimes since the consumer price index (CPI) was launched in 1947: extreme inflation (an annualized quarter-over-quarter rate more than two standard deviations above its mean), high inflation (more than one but less than or equal to two standard deviations above the mean), moderate inflation (up to one standard deviation above the mean), moderately low inflation (one standard deviation below the mean up to the mean) and deflation (two standard deviations below the mean up to one standard deviation below the mean). Related Report US Investment StrategyThe Last Line Of Inflation Defense (Is Holding Fast) We reviewed the performance of S&P 500 operating earnings, earnings multiples and returns in each CPI regime to see how equities have responded to inflation over the last 75 years. We then reviewed the available total return data for Treasuries, investment-grade corporate bonds and high-yield corporate bonds and analyzed them alongside equity total returns. The empirical record enhances our confidence in earnings growth, but the S&P 500 currently trades at nearly 20 times forward four-quarter earnings, and it is especially vulnerable to de-rating, given that contracting valuations have been the driver of underperformance when inflation exceeds its mean. We find it hard to contemplate overweighting fixed income over the next year when nominal yields are so far below the rate of inflation. It may require a modest leap of faith to believe that equity multiples can maintain their cruising altitude, but the odds are very long that a 10-year Treasury note yielding 2.4% will protect its owner’s purchasing power when prices might rise by 3.5% to 4.5% over the next year. The positive real returns that Treasuries have delivered in high-inflation environments since 1984 were achieved over a lengthy stretch in which inflation compensation at the date of purchase repeatedly topped actual inflation to maturity. Today it appears as if ex-ante inflation compensation is likely to prove woefully inadequate and we are skeptical that bonds can live up to their historical return patterns. 75 Years Of Inflation Data Chart 1 shows 299 quarters of annualized inflation data in standard deviation increments since the CPI was constructed in 1947. The shape of the distribution bears out the notion that prices are sticky to the downside; the population mean is well above the median as the high-inflation right tail is longer and fatter than the deflationary left tail. Across the CPI’s entire history, inflation has averaged 3.52% on an annualized quarter-over-quarter basis with a standard deviation (“sigma”) of 3.55%. Based on those parameters, we define extremely high inflation as CPI increases above 10.62% (17 instances), high inflation as 7.08% to 10.62% (22 instances), moderately high inflation as 3.53% to 7.07% (82 instances), moderately low inflation as -0.02% to 3.52% (155 instances), disinflation as -3.57% to -0.03% (21 instances) and deflation as less than -3.57% (2 instances). Chart 1The Complete Annualized CPI Distribution
Inflation And Investing
Inflation And Investing
Inflation And Equities We examined movements in operating earnings, trailing multiples and closing prices for the S&P 500 in each of the six inflation regimes, though we discarded the outlier deflation bucket for insufficient data. In the extreme (greater-than-two-sigma) inflation scenario, S&P 500 earnings initially surged amidst the early postwar period’s pent-up demand explosion before going backwards in the Korean War inflation, the sharp 1973-75 recession and the Volcker double dip (Chart 2, dark solid line). An expanding P/E multiple (dashed line) helped to mitigate the blow from shrinking earnings, but equity investors endured sharp real declines (bottom panel, light solid line). Chart 2Extreme Inflation Squashes Earnings
Extreme Inflation Squashes Earnings
Extreme Inflation Squashes Earnings
The one-to-two-sigma high-inflation scenario is a mirror image of the extreme inflation scenario. Nominal earnings growth surged (Chart 3, top panel) and managed to hold up well in real terms (Chart 3, bottom panel), but the index’s multiple de-rated at a vicious 15.5% annualized rate, sticking investors with double-digit real losses. 70% of this regime played out from 1973 to 1982 and it also spanned some of 1990-91 and great recessions. The last two data points occurred in 2021, when flat multiples allowed equities to benefit from robust earnings growth, but previously melting multiples illustrate the peril for equities if monetary tightening induces a hard landing. Chart 3High Inflation: Surging Nominal Earnings, Fierce De-Rating
High Inflation: Surging Nominal Earnings, Fierce De-Rating
High Inflation: Surging Nominal Earnings, Fierce De-Rating
The zero-to-one-sigma moderate-inflation scenario has fostered such robust earnings growth that even a steady de-rating headwind cannot hold back equity returns (Chart 4). Despite spanning the entire 1973-74 recession and the early stages of the global financial crisis, the moderate-inflation regime has been solidly conducive to growth. Chart 4Moderate Inflation Is Great For Growth
Moderate Inflation Is Great For Growth
Moderate Inflation Is Great For Growth
Just over half of the quarters have met our minus-one-to-zero-sigma moderately low inflation standard. They have featured subpar nominal earnings growth, but a benign inflation backdrop has helped them close the gap with mean real growth and a re-rating tailwind has pushed real annualized S&P 500 price returns above 7% (Chart 5). Most of the post-crisis period has unfolded against a moderately low inflation backdrop, which has been good for equity investors even as concerns about tepid growth lingered. Chart 5Moderately Low Inflation Is The Enduring Equity Sweet Spot
Moderately Low Inflation Is The Enduring Equity Sweet Spot
Moderately Low Inflation Is The Enduring Equity Sweet Spot
The minus-two-to-minus-one-sigma deflationary backdrop in which the price level contracts has featured even weaker aggregate growth, but a 10% annualized re-rating boost has allowed equities to deliver double-digit returns (Chart 6). One would expect growth to wither when the price level is deflating but ex-1Q20, when the pandemic halted activity in its tracks, growth in this phase has topped growth in every other phase. That counterintuitive result illustrates that inflation is a lagging indicator that exerts a heavy influence on monetary policy, which impacts the economy with a lag, while markets are forward looking. The ends of the inflation distribution are likely to mark inflection points where momentum reverses. Chart 6Once Prices Deflate, The Danger Has Already Passed
Once Prices Deflate, The Danger Has Already Passed
Once Prices Deflate, The Danger Has Already Passed
Our survey of equity performance across inflation regimes has shown that inflation is much better for earnings growth than disinflation/deflation until it reaches extreme levels. Nominal earnings have grown three times as fast and real earnings have grown twice as fast when inflation is above its 3.52% mean than when it’s below it (Table 1). The fundamental tailwind that comes with perky inflation is almost entirely offset by multiple contraction, however, just as the growth drag from low inflation is offset by multiple expansion. We don’t think investors should be unduly worried that inflation will squash growth this year, but they do need to be alert to anything that might presage de-rating. Table 1Inflation And Earnings, Multiples, And Returns
Inflation And Investing
Inflation And Investing
Inflation And Bonds To fill out the asset allocation picture, we also reviewed the performance of the Bloomberg US Treasury, US Corporate and US High Yield Total Return Indices. Table 2 tracks annual nominal and real total returns for all three indices, along with the S&P 500, since the second half of 1983, when the high-yield index was launched. The distribution of CPI changes from 1983 forward is more concentrated about the mean than the entire population distribution beginning in 1947 and nearly 80% of observations fall within one standard deviation of the mean, so the tail distributions have comparatively few observations. Table 2Inflation, Treasuries And Spread Product
Inflation And Investing
Inflation And Investing
Nonetheless, the extant tail observations suggest that high yield’s positive carry failed to generate positive excess returns over Treasuries in high-inflation environments while spread widening and increased defaults caused them to lag Treasuries amidst extreme deflation. Investment grade also lagged Treasuries in the tails, albeit by a smaller margin than high yield. High yield comfortably outperformed within the core minus-one-to-plus-one-sigma range, when equities also shined. The bottom line is that Treasuries have provided welcome ballast to multi-asset portfolios in both high-inflation and deflationary episodes over the last 40 years. They were even bigger winners from late 1972, when the Treasury and corporate indexes began, through late 1983, sporting annualized real returns that beat those of high-grade corporates and the S&P 500 by five and eight percentage points, respectively, when inflation exceeded its mean. We question the applicability of the empirical record in the current environment, however, as ex-ante inflation compensation routinely outstripped ex-post inflation over the four-plus decades that it was compiled. Even as the 10-year yield has recently flirted with 2.5%, we expect that the inflation compensation embedded in long-duration bonds will prove inadequate to preserve bondholders’ purchasing power over the bonds’ remaining life. Portfolio Construction The findings from our inflation review do not spur us to make any changes to the ETF portfolio. We continue to believe that the near-term foundations of the US economy are strong and will support above-trend growth over our six- to twelve-month investment timeframe. US growth is at risk from the war in Ukraine and the ongoing COVID-19 revival and aggressive Fed tightening could stifle the effects of past fiscal and monetary stimulus measures that have not yet been felt. We are actively monitoring global geopolitical and public health developments, along with the Fed, though we think it will be difficult for Chair Powell and company to surprise hawkishly over the rest of this year. We believe the moves we made four weeks ago, when we temporarily closed out our equity overweight, reduced our cyclicals-over-defensives positioning, dialed back our value and small-cap overweights, initiated direct exposure to the metals and mining space via the XME ETF and trimmed our Treasury underweight, will protect the portfolio adequately against ongoing inflationary surges and sporadic growth headwinds. The direct homebuilder exposure we took on via the ITB ETF at that time has weighed on performance, but we are sticking with it as we believe the widespread pessimism about the industry’s prospects has gotten way overdone. The labor market remains robust, as the March employment report and the February JOLTS release reiterated last week, less pecunious households are flush with excess pandemic savings and the wealthy are reveling in an unprecedented surge in household net worth. The global situation merits tactical caution, and it looks as if the S&P 500 has hit the top of its near-term range (Chart 7, top panel) while the VIX may have reached a near-term bottom (Chart 7, bottom panel), but our sanguine cyclical view remains intact. Chart 7Equities May Have Reached Another Short-Term Turning Point
Equities May Have Reached Another Short-Term Turning Point
Equities May Have Reached Another Short-Term Turning Point
ETF Portfolio Review - March The cyclical ETF portfolio returned 1.26% in March (Appendix Table), outperforming its benchmark by a modest 8 basis points (“bps”). Our bond underweight was auspicious as yields rose across all maturities last month. Overweighting the riskier segments of the fixed-income market – junk bonds and preferred stocks via the VRP ETF – generated 14 bps of relative performance. However, our equity positioning chipped away at those gains. We underweighted Utilities, March’s top performing sector, and overweighted value, which lagged. Our large Energy overweight mitigated those drags, leaving us with positive net alpha. Since inception two months ago, the portfolio’s value-added stands at 18 bps. Doug Peta, CFA Chief US Investment Strategist dougp@bcaresearch.com Jennifer Lacombe Associate Editor JenniferL@bcaresearch.com Cyclical ETF Portfolio
Inflation And Investing
Inflation And Investing
Executive Summary Equities Are Still Attractive Versus Bonds
Equities Are Still Attractive Versus Bonds
Equities Are Still Attractive Versus Bonds
Macroeconomic Outlook: Global growth will reaccelerate in the second half of this year provided a ceasefire in Ukraine is reached. Inflation will temporarily come down as the dislocations caused by the war and the pandemic subside, before moving up again in late 2023. Equities: Maintain a modest overweight in stocks over a 12-month horizon, favoring non-US equities, small caps, and value stocks. Look to turn more defensive in the second half of 2023 in advance of another wave of inflation. Fixed income: The neutral rate of interest in the US is around 3.5%-to-4%, which is substantially higher than the consensus view. Bond yields will move sideways this year but will rise over the long haul. Overweight Germany, France, Japan, and Australia while underweighting the US and the UK in a global bond portfolio. Credit: Corporate debt will outperform high-quality government bonds over the next 12 months. Favor HY over IG and Europe over the US. Spreads will widen again in late 2023. Currencies: As a countercyclical currency, the US dollar will weaken later this year, with EUR/USD rising to 1.18. We are upgrading our view on the yen from bearish to neutral due to improved valuations. The CNY will strengthen as the Chinese authorities take steps to boost domestic demand. Commodities: Oil prices will dip in the second half of 2022 as the geopolitical premium in crude declines and more OPEC supply comes to market. However, oil and other commodity prices will start moving higher by mid-2023. Bottom Line: The cyclical bull market in stocks that began in 2009 is running long in the tooth, but the combination of faster global growth later this year and a temporary lull in inflation should pave the way for one final hurrah for equities. Dear Client, Instead of our regular report this week, we are sending you our Quarterly Strategy Outlook, where we explore the major trends that are set to drive financial markets in the rest of 2022 and beyond. Next week, please join me for a webcast on Monday, April 11 at 9:00 AM EDT (2:00 PM BST, 3:00 PM CEST, 9:00 PM HKT) where I will discuss the outlook. Best regards, Peter Berezin, Chief Global Strategist P.S. You can now follow me on LinkedIn and Twitter. I. Overview We continue to recommend overweighting global equities over a 12-month horizon. However, we see downside risks to stocks both in the near term (next 3 months) and long term (2-to-5 years). In the near term, stocks will weaken anew if Russia’s stated intentions to scale back operations in Ukraine turn out to be a ruse. There is also a risk that China will need to temporarily shutter large parts of its economy to combat the spread of the highly contagious BA.2 Omicron variant. While stocks could suffer a period of indigestion in response to monetary tightening by the Fed and a number of other central banks, we doubt that rates will rise enough over the next 12 months to undermine the global economy. This reflects our view that the neutral rate of interest in the US and most other countries is higher than widely believed. If the neutral rate ends up being between 3.5% and 4% in the US, as we expect, the odds are low that the Fed will induce a recession by raising rates to 2.75%, as the latest dot plot implies (Chart 1). Chart 1The Market Sees The Fed Raising Rates To Around 3% And Then Backing Off
2022 Second Quarter Strategy Outlook – The New Neutral
2022 Second Quarter Strategy Outlook – The New Neutral
The downside of a higher neutral rate is that eventually, investors will need to value stocks using a higher real discount rate. How fast markets mark up their estimate of neutral depends on the trajectory of inflation. We were warning about inflation before it was cool to warn about inflation (see, for example, our January 2021 report, Stagflation in a Few Months?; or our February 2021 report, 1970s-Style Inflation: Yes, It Could Happen Again). Our view has been that inflation will follow a “two steps up, one step down” pattern. We are currently near the top of those two steps: US inflation will temporarily decline in the second half of this year, as goods inflation drops but service inflation is slow to rise. The decline in inflation will provide some breathing room for the Fed, allowing it to raise rates by no more than what markets are already discounting over the next 12 months. Unfortunately, the respite in inflation will not last long. By the end of 2023, inflation will start to pick up again, forcing the Fed to resume hiking rates in 2024. This second round of Fed tightening is not priced by the markets, and so when it happens, it could be quite disruptive for stocks and other risk assets. Investors should overweight equities on a 12-month horizon but look to turn more defensive in the second half of 2023. II. The Global Economy War and Pestilence Are Near-Term Risks BCA’s geopolitical team, led by Matt Gertken, was ringing the alarm bell about Ukraine well before Russia’s invasion. Recent indications from Russia that it will scale back operations in Ukraine could pave the way for a ceasefire; or they could turn out to be a ruse, giving Russia time to restock supply lines and fortify its army in advance of a new summertime campaign against Kyiv. It is too early to tell, but either way, our geopolitical team expects more fighting in the near term. The West is not keen to give Putin an easy off-ramp, and even if it were, it is doubtful he would take it. The only way that Putin can salvage his legacy among his fan base in Russia is to decisively win the war in order to ensure Ukraine’s military neutrality. For his part, Zelensky cannot simply agree to Russia’s pre-war demands that Ukraine demilitarize and swear off joining NATO unless Russian forces first withdraw. To give in to such demands without any concrete security guarantees would raise the question of why Ukraine fought the war to begin with. The Impact of the Ukraine War on the Global Economy The direct effect of the war on the global economy is likely to be small. Together, Russia and Ukraine account for 3.5% of global GDP in PPP terms and 1.9% in dollar terms. Exports to Russia and Ukraine amount to only 0.2% of G7 GDP (Chart 2). Most corporations have little direct exposure to Russia, although there are a few notable exceptions (Chart 3). Chart 2Little Direct Trade Exposure To Russia And Ukraine
2022 Second Quarter Strategy Outlook – The New Neutral
2022 Second Quarter Strategy Outlook – The New Neutral
In contrast to the direct effects, the indirect effects have the potential to be sizable. Russia is the world’s second largest oil producer, accounting for 12% of annual global output (Chart 4). It is the world’s top exporter of natural gas. About half of European natural gas imports come from Russia. Russia is also a significant producer of nickel, copper, aluminum, steel, and palladium. Chart 3Only A Handful Of Firms Have Significant Sales Exposure To Russia
2022 Second Quarter Strategy Outlook – The New Neutral
2022 Second Quarter Strategy Outlook – The New Neutral
Chart 4Russia is The World's Second Largest Oil Producer
Russia is The World's Second Largest Oil Producer
Russia is The World's Second Largest Oil Producer
Russia and Ukraine are major agricultural producers. Together, they account for a quarter of global wheat exports, with much of it going to the Middle East and North Africa (Chart 5). They are also significant producers of potatoes, corn, sugar beets, and seed oils. In addition, Russia produces two-thirds of all ammonium nitrate, the main source of nitrogen-based fertilizers. Largely as a result of higher commodity prices and other supply disruptions, the OECD estimates that the war could shave about 1% off of global growth this year, with Europe taking the brunt of the hit (Chart 6). At present, the futures curves for most commodities are highly backwardated (Chart 7). While one cannot look to the futures as unbiased predictors of where spot prices are heading, it is fair to say that commodity markets are discounting some easing in prices over the next two years. If that does not occur, global growth could weaken more than the OECD expects. Chart 5Developing Economies Buy The Bulk Of Russian And Ukrainian Wheat
2022 Second Quarter Strategy Outlook – The New Neutral
2022 Second Quarter Strategy Outlook – The New Neutral
Chart 6The War In Ukraine Could Shave One Percentage Point Off Of Global Growth
2022 Second Quarter Strategy Outlook – The New Neutral
2022 Second Quarter Strategy Outlook – The New Neutral
Chart 7Futures Curves For Most Commodities Are Backwardated
2022 Second Quarter Strategy Outlook – The New Neutral
2022 Second Quarter Strategy Outlook – The New Neutral
Another Covid Wave Two years after “two weeks to flatten the curve,” the world continues to underappreciate the power of exponential growth. Suppose that it takes five days for someone with Covid to infect someone else. If everyone with Covid infects an average of six people, the cumulative number of Covid cases would rise from 1,000 to 10 million in around four weeks. Suppose you could cut the number of new infections in half to three per person. In that case, it would take about six weeks for 10 million people to be infected. In other words, mitigation measures that cut the infection rate by half would only extend how long it takes for 10 million people to be infected by two weeks. That’s not a lot. The point is that any infection rate above one will generate an explosive rise in cases. In the pre-Omicron days, keeping the infection rate below one was difficult, but not impossible for countries with the means and motivation to do so. As the virus has become more contagious, however, keeping it at bay has grown more difficult. The latest strain of Omicron, BA.2, appears to be 40% more contagious than the original Omicron strain, which itself was about 4-times more contagious than Delta. BA.2 is quickly spreading around the world. The number of cases has spiked across much of Europe, parts of Asia, and has begun to rise in North America (Chart 8). In China, the authorities have locked down Shanghai, home to 25 million people. Chart 8Covid Cases Are On The Rise Again
2022 Second Quarter Strategy Outlook – The New Neutral
2022 Second Quarter Strategy Outlook – The New Neutral
The success that China has had in suppressing the virus has left its population with little natural immunity; and given the questionable efficacy of its vaccines, with little artificial immunity as well. Moreover, as is the case in Hong Kong, a large share of mainland China’s elderly population remains completely unvaccinated. Chart 9New Covid Drugs Are Set To Hit The Market
2022 Second Quarter Strategy Outlook – The New Neutral
2022 Second Quarter Strategy Outlook – The New Neutral
This presents the Chinese authorities with a difficult dilemma: Impose severe lockdowns over much of the population, or let the virus run rampant. As the logic of exponential change described above suggests, there is not much of a middle ground. Our guess is that the Chinese government will choose the former option. China has already signed a deal to commercialize Pfizer’s Paxlovid. The drug is highly effective at preventing hospitalization if taken within five days from the onset of symptoms. Fortunately, Paxlovid production is starting to ramp up (Chart 9). China will probably wait until it has sufficient supply of the drug before relaxing its zero-Covid policy. While beneficial to growth later this year, this strategy could have a negative near-term impact on activity, as the authorities continue to play whack-a-mole with Covid. Chart 10Inflation Is Running High, Especially In The US
Inflation Is Running High, Especially In The US
Inflation Is Running High, Especially In The US
Central Banks in a Bind Standard economic theory says that central banks should adjust interest rates in response to permanent shocks, while ignoring transitory ones. This is especially true if the shock in question emanates from the supply side of the economy. After all, higher rates cool aggregate demand; they do not raise aggregate supply. The lone exception to this rule is when a supply shock threatens to dislodge long-term inflation expectations. If long-term inflation expectations become unanchored, what began as a transitory shock could morph into a semi-permanent one. The problem for central banks is that the dislocations caused by the Ukraine war are coming at a time when inflation is already running high. Headline CPI inflation reached 7.9% in the US in February, while core CPI inflation clocked in at 6.4%. Trimmed-mean inflation has increased in most economies (Chart 10). Fortunately, while short-term inflation expectations have moved up, long-term expectations have been more stable. Expected US inflation 5-to-10 years out in the University of Michigan survey stood at 3.0% in March, down a notch from 3.1% in January, and broadly in line with the average reading between 2010 and 2015 (Chart 11). Survey-based measures of long-term inflation expectations are even more subdued in the euro area and Japan (Chart 12). Market-based inflation expectations have risen, although this partly reflects higher oil prices. Even then, the widely-watched 5-year, 5-year forward TIPS inflation breakeven rate remains near the bottom of the Fed’s comfort range of 2.3%-to-2.5% (Chart 13).1 Chart 11Long-Term Inflation Expectations Remain Contained In The US...
Long-Term Inflation Expectations Remain Contained In The US...
Long-Term Inflation Expectations Remain Contained In The US...
Chart 12... And In The Euro Area And Japan
... And In The Euro Area And Japan
... And In The Euro Area And Japan
Chart 13The Market's Long-Term Inflation Expectations Are Near The Bottom Of The Fed's Comfort Zone
The Market's Long-Term Inflation Expectations Are Near The Bottom Of The Fed's Comfort Zone
The Market's Long-Term Inflation Expectations Are Near The Bottom Of The Fed's Comfort Zone
Goods versus Services Inflation Most of the increase in consumer prices has been concentrated in goods rather than services (Chart 14). This is rather unusual in that goods prices usually fall over time; but in the context of the pandemic, it is entirely understandable. Chart 14Goods Prices Have Been A Major Driver Of Overall Inflation
2022 Second Quarter Strategy Outlook – The New Neutral
2022 Second Quarter Strategy Outlook – The New Neutral
The pandemic caused spending to shift from services to goods (Chart 15). This occurred at the same time as the supply of goods was being adversely affected by various pandemic-disruptions, most notably the semiconductor shortage that is still curtailing automobile production. Chart 15AGoods Inflation Should Fade As Consumption Shifts Back Towards Services (I)
Goods Inflation Should Fade Goods Inflation Should Fade As Consumption Shifts Back Towards Services (I)
Goods Inflation Should Fade Goods Inflation Should Fade As Consumption Shifts Back Towards Services (I)
Chart 15BGoods Inflation Should Fade As Consumption Shifts Back Towards Services (II)
Goods Inflation Should Fade Goods Inflation Should Fade As Consumption Shifts Back Towards Services (II)
Goods Inflation Should Fade Goods Inflation Should Fade As Consumption Shifts Back Towards Services (II)
Looking out, the composition of consumer spending will shift back towards services. Supply chain bottlenecks should also abate, especially if the situation in Ukraine stabilizes. It is worth noting that the number of ships on anchor off the coast of Los Angeles and Long Beach has already fallen by half (Chart 16). The supplier delivery components of both the manufacturing and nonmanufacturing ISM indices have also come off their highs (Chart 17). Even used car prices appear to have finally peaked (Chart 18). Chart 16Shipping Delays Are Abating
Shipping Delays Are Abating
Shipping Delays Are Abating
Chart 17Delivery Times Are Slowly Coming Down
Delivery Times Are Slowly Coming Down
Delivery Times Are Slowly Coming Down
Chart 18Used Car Prices May Have Finally Peaked
Used Car Prices May Have Finally Peaked
Used Car Prices May Have Finally Peaked
On the Lookout for a Wage-Price Spiral Could rising services inflation offset any decline in goods inflation this year? It is possible, but for that to happen, wage growth would have to accelerate further. For now, much of the acceleration in US wage growth has occurred at the bottom end of the income distribution (Chart 19). It is easy to see why. Chart 20 shows that low-paid workers have not returned to the labor market to the same degree as higher-paid workers. However, now that extended unemployment benefits have lapsed and savings deposits are being drawn down, the incentive to resume work will strengthen. Chart 19Wage Growth Has Picked Up, But Mostly At The Bottom End Of The Income Distribution
Wage Growth Has Picked Up, But Mostly At The Bottom End Of The Income Distribution
Wage Growth Has Picked Up, But Mostly At The Bottom End Of The Income Distribution
Chart 20More Low-Wage Employees Should Return To Work
More Low-Wage Employees Should Return To Work
More Low-Wage Employees Should Return To Work
Chart 21More Workers Will Return To Their Jobs Once The Pandemic Ends
More Workers Will Return To Their Jobs Once The Pandemic Ends
More Workers Will Return To Their Jobs Once The Pandemic Ends
The end of the pandemic should allow more workers to remain at their jobs. In January, during the height of the Omicron wave, 8.75 million US workers (5% of the total workforce) were absent from work due to the virus (Chart 21). How High Will Interest Rates Eventually Rise? If goods inflation comes down swiftly later this year, and services inflation is slow to rise, then overall inflation will decline. This should allow the Fed to pause tightening in early 2023. Whether the Fed will remain on hold beyond then depends on where the neutral rate of interest resides. Chart 22The Yield Curve Inverted in Mid-2019 But Growth Accelerated
The Yield Curve Inverted in Mid-2019 But Growth Accelerated
The Yield Curve Inverted in Mid-2019 But Growth Accelerated
The neutral rate, or equilibrium rate as it is sometimes called, is the interest rate consistent with full employment and stable inflation. If the Fed pauses hiking before interest rates have reached neutral, the economy will eventually overheat, forcing the Fed to resume hiking. In contrast, if the Fed inadvertently raises rates above neutral, unemployment will start rising, requiring the Fed to cut rates. Markets are clearly worried about the latter scenario. The 2/10 yield curve inverted earlier this week. With the term premium much lower than in the past, an inversion in the yield curve is not the powerful harbinger of recession that it once was. After all, the 2/10 curve inverted in August 2019 and the economy actually strengthened over the subsequent six months before the pandemic came along (Chart 22). Nevertheless, an inverted yield curve is consistent with markets expectations that the Fed will raise rates above neutral. That is always a dangerous undertaking. Raising rates above neutral would likely push up the unemployment rate. There has never been a case in the post-war era where the 3-month moving average of the unemployment rate has risen by more than 30 basis points without a recession occurring (Chart 23). Chart 23When Unemployment Starts Rising, It Usually Keeps Rising
When Unemployment Starts Rising, It Usually Keeps Rising
When Unemployment Starts Rising, It Usually Keeps Rising
As discussed in the Feature Section below, the neutral rate of interest is probably between 3.5% and 4% in the US. This is good news in the short term because it lowers the odds that the Fed will raise rates above neutral during the next 12 months. It is bad news in the long run because it means that the Fed will find itself even more behind the curve than it is now, making a recession almost inevitable. The Feature Section builds on our report from two weeks ago. Readers familiar with that report should feel free to skip ahead to the next section. III. Feature: A Higher Neutral Rate Conceptually, the neutral rate is the interest rate that equates the amount of investment a country wants to undertake at full employment with the amount of savings that it has at its disposal.2 Anything that reduces savings or increases investment would raise the neutral rate (Chart 24). Chart 24The Savings-Investment Balance Determines The Neutral Rate Of Interest
2022 Second Quarter Strategy Outlook – The New Neutral
2022 Second Quarter Strategy Outlook – The New Neutral
A number of factors are likely to lower desired savings in the US over the next few years: Households will spend down their accumulated pandemic savings. US households are sitting on $2.3 trillion (10% of GDP) in excess savings, the result of both decreased spending on services during the pandemic and the receipt of generous government transfer payments (Chart 25). Household wealth has soared since the start of the pandemic (Chart 26). Conservatively assuming that households spend three cents of every additional dollar in wealth, the resulting wealth effect could boost consumption by 4% of GDP. Chart 25Plenty Of Pent-Up Demand
Plenty Of Pent-Up Demand
Plenty Of Pent-Up Demand
Chart 26Net Worth Has Soared Since The Pandemic
Net Worth Has Soared Since The Pandemic
Net Worth Has Soared Since The Pandemic
The household deleveraging cycle has ended (Chart 27). Household balance sheets are in good shape. After falling during the initial stages of the pandemic, consumer credit has begun to rebound. For the first time since the housing boom, mortgage equity withdrawals are rising. Banks are easing lending standards on consumer loans across the board. Chart 27US Household Deleveraging Pressures Have Abated
US Household Deleveraging Pressures Have Abated
US Household Deleveraging Pressures Have Abated
Chart 28Baby Boomers Have Amassed A Lot Of Wealth
2022 Second Quarter Strategy Outlook – The New Neutral
2022 Second Quarter Strategy Outlook – The New Neutral
Baby boomers are retiring. They hold over half of US household wealth, considerably more than younger generations (Chart 28). As baby boomers transition from being savers to dissavers, national savings will decline. Government budget deficits will stay elevated. Fiscal deficits subtract from national savings. While the US budget deficit will come down over the next few years, the IMF estimates that the structural budget deficit will still average 4.9% of GDP between 2022 and 2026 compared to 2.0% of GDP between 2014 and 2019 (Chart 29).Chart 29Fiscal Policy: Tighter But Not Tight
2022 Second Quarter Strategy Outlook – The New Neutral
2022 Second Quarter Strategy Outlook – The New Neutral
On the investment front: The deceleration in trend GDP growth, which depressed investment spending, has largely run its course.3 According to the Congressional Budget Office, real potential GDP growth fell from over 3% in the early 1980s to about 1.9% today. The CBO expects potential growth to edge down only slightly to 1.7% over the next few decades (Chart 30). After moving broadly sideways for two decades, core capital goods orders – a leading indicator for capital spending – have broken out to the upside (Chart 31). Capex intention surveys remain upbeat (Chart 32). The average age of the nonresidential capital stock currently stands at 16.3 years, the highest since 1965 (Chart 33). Chart 30Much Of The Deceleration In Potential Growth Has Already Happened
Much Of The Deceleration In Potential Growth Has Already Happened
Much Of The Deceleration In Potential Growth Has Already Happened
Chart 31Positive Signs For Capex (I)
Positive Signs For Capex (I)
Positive Signs For Capex (I)
Chart 32Positive Signs For Capex (II)
Positive Signs For Capex (II)
Positive Signs For Capex (II)
Chart 33An Aging Capital Stock
An Aging Capital Stock
An Aging Capital Stock
Similar to nonresidential investment, the US has been underinvesting in residential real estate (Chart 34). The average age of the housing stock has risen to a 71-year high of 31 years. The homeowner vacancy rate has plunged to the lowest level on record. The number of newly finished homes for sale is half of what it was prior to the pandemic. Chart 34US Housing Is In Short Supply
US Housing Is In Short Supply
US Housing Is In Short Supply
The New ESG: Energy Security and Guns The war in Ukraine will put further upward pressure on the neutral rate, especially outside of the United States. After staging a plodding recovery following the euro debt crisis, European capital spending received a sizable boost from the launch of the NextGenerationEU Recovery Fund (Chart 35). As Mathieu Savary points out in his latest must-read report on Europe, capital spending will rise further in the years ahead as European governments accelerate efforts to make their economies less reliant on Russian energy. Germany has already announced plans to construct three new LNG terminals. The push to build out Europe’s energy infrastructure is coming at a time when businesses are looking to ramp up capital spending. As in the US, Europe’s capital stock has aged rapidly over the past decade (Chart 36). Chart 35European Capex Should Recover
European Capex Should Recover
European Capex Should Recover
Chart 36European Machines Need More Than Just An Oil Change
European Machines Need More Than Just An Oil Change
European Machines Need More Than Just An Oil Change
Chart 37The War In Ukraine Calls For More Spending Across Europe
The War In Ukraine Calls For More Spending Across Europe
The War In Ukraine Calls For More Spending Across Europe
Meanwhile, European governments are trying to ease the burden from rising energy costs. For example, France has introduced a rebate on fuel. It is part of a EUR 20 billion package aimed at cutting heating and electricity bills. European military spending will rise. Military spending currently amounts to 1.5% of GDP, well below NATO’s threshold of 2% (Chart 37). Germany has announced that it will spend EUR 100 billion more on defense. European governments will also need to boost spending to accommodate Ukrainian refugees. The UN estimates that four million refugees have left Ukraine, with the vast majority settling in the EU. A Smaller Chinese Current Account Surplus? The difference between what a country saves and invests equals its current account balance. Historically, China has been a major exporter of savings, which has helped depress interest rates abroad. While China’s current account surplus has declined as a share of its own GDP, it has remained very large as a share of global ex-China GDP, reflecting China’s growing weight in the global economy (Chart 38). Many analysts assume that China will double down on efforts to boost exports in order to offset the drag from falling property investment. However, there is a major geopolitical snag with that thesis: A country that runs a current account surplus must, by definition, accumulate assets from the rest of the world. As the freezing of Russia’s foreign exchange reserves demonstrates, that is a risky proposition for a country such as China. Rather than increasing its current account surplus, China may seek to bolster its economy by raising domestic demand. This could be achieved by either boosting domestic infrastructure spending or raising household consumption. Notably, China’s credit impulse appears to have bottomed and is set to increase in the second half of the year. This is good news not just for Chinese growth but growth abroad (Chart 39). Chart 38Will China Be A Source Of Excess Savings?
Will China Be A Source Of Excess Savings?
Will China Be A Source Of Excess Savings?
Chart 39China's Credit Impulse Appears To Have Bottomed
China's Credit Impulse Appears To Have Bottomed
China's Credit Impulse Appears To Have Bottomed
The IMF’s latest projections foresee China’s current account surplus falling by more than half between 2021 and 2026 as a share of global ex-China GDP. If this were to happen, the neutral rate in China and elsewhere would rise. IV. Financial Markets A. Portfolio Strategy Chart 40The Markets Wobbled And Then Recovered After The Beginning Of The Last Four Fed Rate Cycles
The Markets Wobbled And Then Recovered After The Beginning Of The Last Four Fed Rate Cycles
The Markets Wobbled And Then Recovered After The Beginning Of The Last Four Fed Rate Cycles
As noted in the overview, if the neutral rate turns out to be higher than currently perceived, the Fed is unlikely to induce a recession by raising rates over the next 12 months. That is good news for equities. A look back at the past four Fed tightening cycles shows that stocks often wobble when the Fed starts hiking rates, but then usually rise as long as rates do not move into restrictive territory (Chart 40). Unfortunately, a higher neutral rate also means that investors will eventually need to value stocks using a higher discount rate. It also means that any decline in inflation this year will not last. The US economy will probably start to overheat again in the second half of 2023. This will set the stage for a second, and more painful, tightening cycle in 2024. Admittedly, there is a lot of uncertainty over our “two steps up, one step down” forecast for inflation. It is certainly possible that the “one step down” phase does not last long and that the resurgence in inflation we are expecting in the second half of next year occurs earlier. It is also possible that investors will react negatively to rising rates, even if the economy is ultimately able to withstand them. As such, only a modest overweight to equities is justified over the next 12 months, with risks tilted to the downside in the near term. More conservative asset allocators should consider moving to a neutral stance on equities already, as my colleague Garry Evans advised clients to do in his latest Global Asset Allocation Quarterly Portfolio Outlook. B. Fixed Income Stay Underweight Duration Over a 2-to-5 Year Horizon Our recommendation to maintain below-benchmark duration in fixed-income portfolios panned out since the publication of our Annual Outlook in December, with the US 10-year Treasury yield rising from 1.43% to 2.38%. We continue to expect bond yields in the US to rise over the long haul. Conceptually, the yield on a government bond equals the expected path of policy rates over the duration of the bond plus a term premium. The term premium is the difference between the return investors can expect from buying a long-term bond that pays a fixed interest rate, and the return from rolling over a short-term bill. The term premium has been negative in recent years. Investors have been willing to sacrifice return to own long-term bonds because bond prices usually rise when the odds of a recession go up. The fact that monthly stock returns and changes in bond yields have been positively correlated since 2001 underscores the benefits that investors have received from owning long-term bonds as a hedge against unfavorable economic news (Chart 41). However, now that inflation has emerged as an increasingly important macroeconomic risk, the correlation between stock returns and changes in bond yields could turn negative again. Unlike weak economic growth, which is bad for only stocks, high inflation is bad for both bonds and stocks. Chart 41Correlation Between Stock Returns And Bond Yields Could Turn Negative
Correlation Between Stock Returns And Bond Yields Could Turn Negative
Correlation Between Stock Returns And Bond Yields Could Turn Negative
If bond yields start to rise whenever stock prices fall, the incentive to own long-term bonds will decline. This will cause the term premium to increase. Assuming the term premium rises to about 0.5%, and a neutral rate of 3.5%-to-4%, the long-term fair value for the 10-year US Treasury yield is 4%-to-4.5%. This is well above the 5-year/5-year forward yield of 2.20%. Move from Underweight to Neutral Duration Over a 12-Month Horizon Below benchmark duration positions usually do well when the Fed hikes rates by more than expected over the subsequent 12 months (Chart 42). Chart 42The Golden Rule Of Bond Investing
The Golden Rule Of Bond Investing
The Golden Rule Of Bond Investing
Given our view that US inflation will temporarily decline later this year, the Fed will probably not need to raise rates over the next 12 months by more than the 249 basis points that markets are already discounting. Thus, while a below-benchmark duration position is advisable over a 2-to-5-year time frame, it could struggle over a horizon of less than 12 months. Our end-2022 target range for the US 10-year Treasury yield is 2.25%-to-2.5%. Chart 43Bond Sentiment And Positioning Are Bearish
Bond Sentiment And Positioning Are Bearish
Bond Sentiment And Positioning Are Bearish
Supporting our decision to move to a neutral benchmark duration stance over a 12-month horizon is that investor positioning and sentiment are both bond bearish (Chart 43). From a contrarian point of view, this is supportive of bonds. Global Bond Allocation BCA’s global fixed-income strategists recommend overweighting German, French, Australian, and Japanese government bonds, while underweighting those of the US and the UK. They are neutral on Italy and Spain given that the ECB is set to slow the pace of bond buying. The neutral rate of interest has risen in the euro area, partly on the back of more expansionary fiscal policy across the region. In absolute terms, however, the neutral rate in the euro area is still quite low, and possibly negative. Unlike in the US, where inflation has risen to uncomfortably high levels, much of Europe would benefit from higher inflation expectations, as this would depress real rates across the region, giving growth a boost. This implies that the ECB is unlikely to raise rates much over the next two years. As with the euro area, Japan would benefit from lower real rates. The Bank of Japan’s yield curve control policy has been put to the test in recent weeks. To its credit, the BoJ has stuck to its guns, buying bonds in unlimited quantities to prevent yields from rising. We expect the BoJ to stay the course. Unlike in the euro area and Japan, inflation expectations are quite elevated in the UK and wage growth is rising quickly there. This justifies an underweight stance on UK gilts. Although job vacancies in Australia have climbed to record levels, wage growth is still not strong enough from the RBA’s point of view to justify rapid rate hikes. As a result, BCA’s global fixed-income strategists remain overweight Australian bonds. Finally, our fixed-income strategists are underweight Canadian bonds but are contemplating upgrading them given that markets have already priced in 238 basis points in tightening over the next 12 months. Unlike in the US, high levels of consumer debt will also limit the Bank of Canada’s ability to raise rates. Modest Upside in High-Yield Corporate Bonds Credit spreads have narrowed in recent days but remain above where they were prior to Russia’s invasion of Ukraine. Since the start of the year, US investment-grade bonds have underperformed duration-matched Treasurys by 154 basis points, while high-yield bonds have underperformed by 96 basis points (Chart 44). The outperformance of high-yield relative to investment-grade debt can be explained by the fact that the former has more exposure to the energy sector, which has benefited from rising oil prices. Looking out, falling inflation and a rebound in global growth later this year should provide a modestly supportive backdrop for corporate credit. High-yield spreads are still pricing in a default rate of 3.8% over the next 12 months (Chart 45). This is well above the trailing 12-month default rate of 1.3%. Our fixed-income strategists continue to prefer US high-yield over US investment-grade. Chart 44Spreads Have Narrowed Over The Past Two Weeks But Remain Above Pre-War Levels
Spreads Have Narrowed Over The Past Two Weeks But Remain Above Pre-War Levels
Spreads Have Narrowed Over The Past Two Weeks But Remain Above Pre-War Levels
Chart 45Spread-Implied Default Rate Is Too High
2022 Second Quarter Strategy Outlook – The New Neutral
2022 Second Quarter Strategy Outlook – The New Neutral
European credit is attractively priced and should benefit from any stabilization in the situation in Ukraine. Our fixed-income strategists prefer both European high-yield and investment-grade bonds over their US counterparts. As with equities, the bull market in corporate credit will end in late 2023 as the Fed is forced to resume raising rates in 2024 in the face of an overheated economy. C. Currencies Chart 46Widening Interest Rate Differentials Have Supported The Dollar
Widening Interest Rate Differentials Have Supported The Dollar
Widening Interest Rate Differentials Have Supported The Dollar
The US Dollar Will Weaken Starting in the Second Half of 2022 Since bottoming last May, the US dollar has been trending higher. While the dollar could strengthen further in the near term if the war in Ukraine escalates, the fundamental backdrop supporting the greenback is starting to fray. If US inflation comes down later this year, the Fed is unlikely to raise rates by more than what markets are already discounting over the next 12 months. Thus, widening rate differentials will no longer support the dollar (Chart 46). The dollar is a countercyclical currency: It usually weakens when global growth is strengthening and strengthens when global growth is weakening (Chart 47). The dollar tends to be particularly vulnerable when growth expectations are rising more outside the US than in the US (Chart 48). Chart 47The Dollar Is A Countercyclical Currency
The Dollar Is A Countercyclical Currency
The Dollar Is A Countercyclical Currency
Chart 48Better Growth Prospects Abroad Will Weigh On The US Dollar
Better Growth Prospects Abroad Will Weigh On The US Dollar
Better Growth Prospects Abroad Will Weigh On The US Dollar
Global growth should rebound in the second half of the year once the pandemic finally ends and the situation in Ukraine stabilizes. Growth is especially likely to recover in Europe. This will support the euro, a dovish ECB notwithstanding. Chester Ntonifor, BCA’s Foreign Exchange Strategist, expects EUR/USD to end the year at 1.18. The Dollar is Overvalued The dollar’s ascent has left it overvalued by more than 20% on a Purchasing Power Parity (PPP) basis (Chart 49). The PPP exchange rate equalizes the price of a representative basket of goods and services between the US and other economies. PPP deviations from fair value have done a reasonably good job of predicting dollar movements over the long run (Chart 50). Chart 49USD Remains Overvalued
2022 Second Quarter Strategy Outlook – The New Neutral
2022 Second Quarter Strategy Outlook – The New Neutral
Chart 50Valuations Matter For FX Long-Term Returns
Valuations Matter For FX Long-Term Returns
Valuations Matter For FX Long-Term Returns
Reflecting the dollar’s overvaluation, the US trade deficit has widened sharply (Chart 51). Excluding energy exports, the US trade deficit as a share of GDP is now the largest on record. Equity inflows have helped finance America’s burgeoning current account deficit (Chart 52). However, these inflows have ebbed significantly as foreign investors have lost their infatuation with US tech stocks. Chart 51The US Trade Deficit Has Widened
The US Trade Deficit Has Widened
The US Trade Deficit Has Widened
Chart 52Net Inflows Into US Equities Have Dried Up
Net Inflows Into US Equities Have Dried Up
Net Inflows Into US Equities Have Dried Up
Dollar positioning remains stretched on the long side (Chart 53). That is not necessarily an obstacle in the short run, given that the dollar tends to be a momentum currency, but it does suggest that the greenback could weaken over a 12-month horizon as more dollar bulls jump ship. The Yen: Cheaper but Few Catalysts for a Bounce The trade-weighted yen has depreciated by 6.4% since the start of the year. The yen is 31% undervalued relative to the dollar on a PPP basis (Chart 54). In a nod to these improved valuations, we are upgrading our 12-month and long-term view on the yen from bearish to neutral. Chart 53Still A Lot of Dollar Bulls
Still A Lot of Dollar Bulls
Still A Lot of Dollar Bulls
Chart 54The Yen Has Gotten Cheaper
The Yen Has Gotten Cheaper
The Yen Has Gotten Cheaper
While the yen is unlikely to weaken much from current levels, it is unlikely to strengthen. As noted above, the Bank of Japan has no incentive to abandon its yield curve control strategy. Yes, the recent rapid decline in the yen is a shock to the economy, but it is a “good” shock in the sense that it could finally jolt inflation expectations towards the BoJ’s target of 2%. If inflation expectations rise, real rates would fall, which would be bearish for the currency. Favor the RMB and other EM Currencies The Chinese RMB has been resilient so far this year, rising slightly against the dollar, even as the greenback has rallied against most other currencies. Real rates are much higher in China than in the US, and this has supported the RMB (Chart 55). Chart 55Higher Real Rates In China Have Supported The RMB
Higher Real Rates In China Have Supported The RMB
Higher Real Rates In China Have Supported The RMB
Chart 56The RMB Is Undervalued Based On PPP
The RMB Is Undervalued Based On PPP
The RMB Is Undervalued Based On PPP
Despite the RMB’s strength, it is still undervalued by 10.5% relative to its PPP exchange rate (Chart 56). While productivity growth has slowed in China, it remains higher than in most other countries. The real exchange rates of countries that benefit from fast productivity growth typically appreciates over time. China holds about half of its foreign exchange reserves in US dollars, a number that has not changed much since 2012 (Chart 57). We expect China to diversify away from dollars over the coming years. Moreover, as discussed earlier in the report, the incentive for China to run large current account surpluses may fade, which will result in slower reserve accumulation. Both factors could curb the demand for dollars in international markets. Chart 57Half Of Chinese FX Reserves Are Held In USD Assets
2022 Second Quarter Strategy Outlook – The New Neutral
2022 Second Quarter Strategy Outlook – The New Neutral
A resilient RMB will provide a tailwind for other EM currencies. Many EM central banks began to raise rates well before their developed market counterparts. In Brazil, for example, the policy rate has risen to 11.75% from 2% last April. With inflation in EMs likely to come down later this year as pandemic and war-related dislocations subside, real policy rates will rise, giving EM currencies a boost. D. Commodities Longer-Term Bullish Thesis on Commodities Remains Intact BCA’s commodity team, led by Bob Ryan, expects crude prices to fall in the second half of the year, before moving higher again in 2023. Their forecast is for Brent to dip to $88/bbl by end-2022, which is below the current futures price of $97/bbl. Chart 58Dearth Of Oil Capex Will Put A Floor Under Oil Prices
2022 Second Quarter Strategy Outlook – The New Neutral
2022 Second Quarter Strategy Outlook – The New Neutral
The risk to their end-2022 forecast is tilted to the upside. The relationship between the Saudis and the US has become increasingly strained. This could hamper efforts to bring more oil to market. Hopes that Iranian crude will reach global markets could also be dashed if, as BCA’s geopolitical strategists expect, the US-Iran nuclear deal falls through. A cut-off of Russian oil could also cause prices to rise. While Urals crude is being sold at a heavy discount of $30/bbl to Brent (compared to a discount of around $2/bbl prior to the invasion), it is still leaving the country. In fact, Russian oil production actually rose in March over February. An escalation of the war would make it more difficult for Russia to divert enough oil to China, India, and other countries in order to evade Western sanctions. Looking beyond this year, Bob and his team see upside to oil prices. They expect Brent to finish 2023 at $96/bbl, above the futures price of $89/bbl. Years of underinvestment in crude oil production have led to tight supply conditions (Chart 58). Proven global oil reserves increased by only 6% between 2010 and 2020, having risen by 26% over the preceding decade. Stay Positive on Metals As with oil, there has been little investment in mining capacity in recent years. While a weaker property market in China will weigh on metals prices, this will be partly offset by increased infrastructure spending. The shift towards green energy will also boost metals prices. The typical electric vehicle requires about four times as much copper as a typical gasoline-powered vehicle. Huge amounts of copper will also be necessary to expand electrical grids. Favor Gold Over Cryptos After breaking above $2,000/oz, the price of gold has retreated to $1,926/oz. In the near term, gold prices will be swayed by geopolitical developments. Longer term, real rates will dictate the direction of gold prices. Chart 59 shows that there is a very strong correlation between the price of gold and TIPS yields. If we are correct that the neutral rate of interest is 3.5%-to-4% in the US, real bond yields will eventually need to rise from current levels. Gold prices are quite expensive by historic standards, which represents a long-term risk (Chart 60). Chart 59Strong Correlation Between Real Rates And Gold
Strong Correlation Between Real Rates And Gold
Strong Correlation Between Real Rates And Gold
Chart 60Gold Is Quite Pricey From A Historical Perspective
Gold Is Quite Pricey From A Historical Perspective
Gold Is Quite Pricey From A Historical Perspective
That said, we expect the bulk of the increase in real bond yields to occur only after mid-2023. As mentioned earlier, the Fed will probably not have to deliver more tightening that what markets are already discounting over the next 12 months. Thus, gold prices are unlikely to fall much in the near term. In any case, we continue to regard gold as a safer play than cryptocurrencies. As we discussed in Who Pays for Cryptos?, the long-term outlook for cryptocurrencies remains daunting. Many of the most hyped blockchain applications, from DeFi to NFTs, will turn out to be duds. Concerns that cryptocurrencies are harming the environment, contributing to crime, and enriching a small group of early investors at the expense of everyone else will lead to increased regulatory scrutiny. Our long-term target for Bitcoin is $5,000. E. Equities Equities Are Still Attractively Priced Relative to Bonds Corporate earnings are highly correlated with the state of the business cycle (Chart 61). A recovery in global growth later this year will bolster revenue, while easing supply-chain pressures should help contain costs in the face of rising wages. It is worth noting that despite all the shocks to the global economy, EPS estimates in the US and abroad have actually risen this year (Chart 62). Chart 61The Business Cycle Drives Earnings
The Business Cycle Drives Earnings
The Business Cycle Drives Earnings
Chart 62Global EPS Estimates Have Held Up Reasonably Well
2022 Second Quarter Strategy Outlook – The New Neutral
2022 Second Quarter Strategy Outlook – The New Neutral
Chart 63Equities Are Still Attractive Versus Bonds
Equities Are Still Attractive Versus Bonds
Equities Are Still Attractive Versus Bonds
As Doug Peta, BCA’s Chief US Strategist has pointed out, the bar for positive earnings surprises for Q1 is quite low: According to Refinitiv/IBES, S&P 500 earnings are expected to fall by 4.5% in Q1 over Q4 levels. Global equities currently trade at 18-times forward earnings. Relative to real bond yields, stocks continue to look reasonably cheap (Chart 63). Even in the US, where valuations are more stretched, the earnings yield on stocks exceeds the real bond yield by 570 basis points. At the peak of the market in 2000, the gap between earnings yields and real bond yields was close to zero. Favor Non-US Markets, Small Caps, and Value Valuations are especially attractive outside the US. Non-US equities trade at 13.7-times forward earnings. Emerging markets trade at a forward P/E of only 12.1. Correspondingly, the gap between earnings yields and real bond yields is about 200 basis points higher outside the US. In general, non-US markets fare best in a setting of accelerating growth and a weakening dollar – precisely the sort of environment we expect to prevail in the second half of the year (Chart 64). US small caps also perform best when growth is strengthening and the dollar is weakening (Chart 65). In contrast to the period between 2003 and 2020, small caps now trade at a discount to their large cap brethren. The S&P 600 currently trades at 14.4-times forward earnings compared to 19.7-times for the S&P 500, despite the fact that small cap earnings are projected to grow more quickly both over the next 12-months and over the long haul (Chart 66). Chart 64A Weaker Dollar And Stronger Global Economy Are Tailwinds For Non-US Stocks
A Weaker Dollar And Stronger Global Economy Are Tailwinds For Non-US Stocks
A Weaker Dollar And Stronger Global Economy Are Tailwinds For Non-US Stocks
Chart 65US Small Caps Usually Fare Well When The Economy Is Strengthening And The Dollar Is Weakening
US Small Caps Usually Fare Well When The Economy Is Strengthening And The Dollar Is Weakening
US Small Caps Usually Fare Well When The Economy Is Strengthening And The Dollar Is Weakening
Globally, growth stocks have outperformed value stocks by 60% since 2017. However, only one-tenth of that outperformance has come from faster earnings growth (Chart 67). This has left value trading nearly two standard deviations cheap relative to growth. Chart 66Small Caps Look Attractive Relative To Large Caps
Small Caps Look Attractive Relative To Large Caps
Small Caps Look Attractive Relative To Large Caps
Chart 67Value Remains Cheap
Value Remains Cheap
Value Remains Cheap
Chart 68Higher Yields Tend To Flatter Bank Stocks And Usually Weigh On Tech
Higher Yields Tend To Flatter Bank Stocks And Usually Weigh On Tech
Higher Yields Tend To Flatter Bank Stocks And Usually Weigh On Tech
Tech stocks are overrepresented in growth indices, while banks are overrepresented in value indices. US banks have held up relatively well since the start of the year but have not gained as much as one would have expected based on the significant increase in bond yields (Chart 68). With the deleveraging cycle in the US coming to an end, US banks sport both attractive valuations and the potential for better-than-expected earnings growth. European banks should also recover as the situation in Ukraine stabilizes. They trade at only 7.9-times forward earnings and 0.6-times book. On the flipside, structurally higher bond yields will weigh on tech shares. Moreover, as we discussed in our recent report entitled The Disruptor Delusion, a cooling in pandemic-related tech spending, increasing market saturation, and concerns about Big Tech’s excessive power will all hurt tech returns. Peter Berezin Chief Global Strategist peterb@bcaresearch.com Footnotes 1 The Federal Reserve targets an average inflation rate of 2% for the personal consumption expenditures (PCE) index. The TIPS breakeven is based on the CPI index. Due to compositional differences between the two indices, CPI inflation has historically averaged 30-to-50 basis points higher than PCE inflation. This is why the Fed effectively targets a CPI inflation rate of about 2.3%-to-2.5%. 2 These savings can either by generated domestically or imported from abroad via a current account deficit. 3 Theoretically, there is a close relationship between trend growth and the equilibrium investment-to-GDP ratio. For example, if real trend growth is 3% and the capital stock-to-GDP ratio is 200%, a country would need to invest 6% of GDP net of depreciation to maintain the existing capital stock-to-GDP ratio. In contrast, if trend growth were to fall to 2%, the country would only need to invest 4% of GDP. Global Investment Strategy View Matrix
2022 Second Quarter Strategy Outlook – The New Neutral
2022 Second Quarter Strategy Outlook – The New Neutral
Special Trade Recommendations Current MacroQuant Model Scores
2022 Second Quarter Strategy Outlook – The New Neutral
2022 Second Quarter Strategy Outlook – The New Neutral
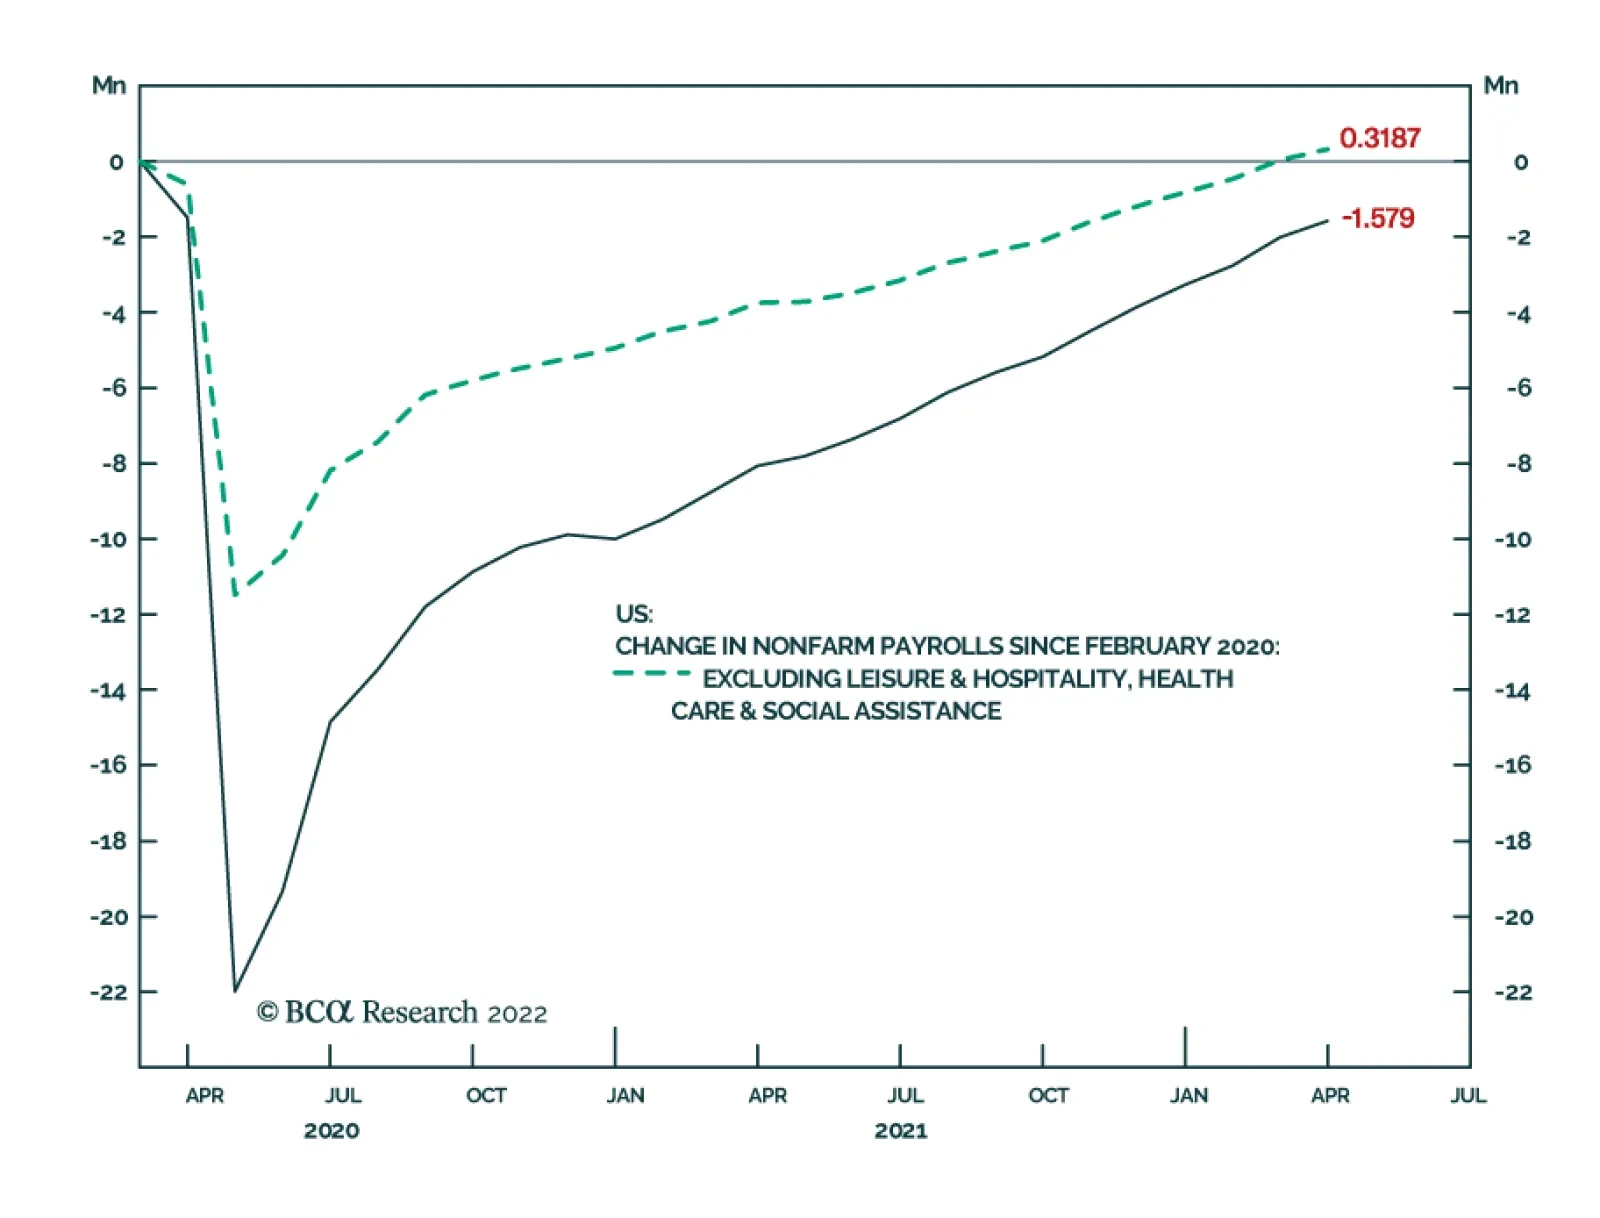
The US employment report reveals that the labor market recovery is progressing well. Nonfarm payrolls increased by a robust 431 thousand in March. Although this is slightly below expectations of a 490 thousand increase, January and February payrolls were…
Executive Summary The Dollar And The Yield Curve
The Dollar And The Yield Curve
The Dollar And The Yield Curve
The dollar has tended to decline 3-to-6 months after the Fed starts hiking interest rates. This has been true since the mid-1990s. Beyond that timeframe, the path of the dollar has depended on what other central banks are doing, and/or which stage of the business cycle we are in. The flattening yield curve in the US is coinciding with a strong dollar (Feature chart), but the historical evidence is that this relationship is very fickle. While the dollar tends to rise during recessions, the average business cycle over the last 40 years has also lasted 90 months, making a recession in the next year possible, but not probable. The dollar has usually followed a long boom/bust cycle of 10 years. If the Fed stays behind the inflation curve, we could be entering a period of weakness akin to the pre-Volcker years in the 70s. The greenback has also tended to be seasonally strong in H1 and weaker in H2. The yen has generally been the best-performing currency shortly after a Fed rate hike. Go short USD/JPY if it touches 124. RECOMMENDATION INCEPTION LEVEL inception date RETURN Short USD/JPY 124 2022-04-01 - Bottom Line: Our bias remains that the DXY index does not have much upside above 100. Our 12-month target remains 90. Feature Chart I-1Dollar Action Before Curve Inversions Is Mixed
Dollar Action Before Curve Inversions Is Mixed
Dollar Action Before Curve Inversions Is Mixed
Rudi Dornbusch was one of the pioneers behind the theory that currency markets tend to overreact. His observation was as simple as it was brilliant. Currency markets are fluid, while prices tend to be sticky. Therefore, a monetary response to an inflation overshoot will initially cause a knee-jerk reaction in the currency before it settles back towards equilibrium. While we have oversimplified Dornbusch’s overshooting model, it is hard to ignore the fact that today’s currency and bond markets could potentially be overreacting. The 10-year/2-year US Treasury spread briefly turned negative this week, as the short end catapulted higher. Historically, that has been a precursor to an impending recession. This is important because the dollar has usually done well during recessions, even though its performance ahead of doomsday has been mixed over a 40-year period (Chart I-1). Given this backdrop, this report attempts to answer a few questions. How has the dollar performed over prior Federal Reserve tightening cycles? What drives the relationship between the dollar and the yield curve? Are the Fed rate hikes currently priced in the short end of the curve credible? Which currencies have historically excelled or suffered once the Fed begins to tighten policy? And finally, what is the roadmap investors should use to gauge the path of the dollar going forward? The Dollar And The Yield Curve Chart I-2A Rising Dollar Has Tracked A Flattening Curve
A Rising Dollar Has Tracked A Flattening Curve
A Rising Dollar Has Tracked A Flattening Curve
The relationship between the dollar and the yield curve has been tight over the last three years. A flattening curve throughout most of 2018 signaled US policy was getting too restrictive relative to underlying economic conditions. The dollar was also rising (Chart I-2). The Federal Reserve eventually responded by cutting rates, which allowed the curve to steepen again, eventually putting a top in the greenback. Our Chief US Bond Strategist, Ryan Swift, has characterized this cycle as the dollar/bond feedback loop (Chart I-3). Chart I-3The Dollar/Bond Feedback Loop
Lessons From Fed Interest Rate Hikes
Lessons From Fed Interest Rate Hikes
In retrospect, this feedback loop works through two channels. First, almost 90% of global transactions are conducted in US dollars, which means the cost of doing business (paying for imports, reconciling accounts payables, servicing debt, and so on) rises for foreigners as the dollar appreciates. This puts a break on economic activity abroad. Second, as a counter-cyclical currency, the dollar tends to attract capital when growth in the rest of the world is slowing, reinforcing this loop. Eventually, a strong dollar and rising domestic bond yields put a break on US economic activity, which causes the Fed to back off. Investors with a high-conviction view that we are close to a recession should be buying the dollar on weakness. In our view, many central banks are becoming too hawkish at the exact moment global growth is set to slow. That said, not unlike the Dornbusch analogy at the start of this text, currency markets have overreacted. Specifically: Over the last 40 years, the average business cycle has lasted 90 months. An inverted yield curve does not corroborate this fact, considering the recession in 2020. It is well known that there are previous episodes of the yield curve inverting, without an impending recession. This time around, rate hike expectations have been heavily priced at the front end of the curve, while being underpriced at the long end. The inference is that the market thinks the Fed is about to make a policy mistake. With policy rates in the US still at 25-50 bps, those near-term rate expectations will turn out to be wrong if US economic growth does indeed slow, forcing the Fed to pivot. The term premium in the US (and globally) is very low, and could rise as quantitative easing is wound down, and yield-curve control is relaxed in bond markets such as Japan. That could help lift longer-term bond yields. Global yield curves have tended to move in unison, with the UK curve historically being the first to invert ahead of a recession. That has not yet happened. Elsewhere, Japanese, and German yield curves are steep (Chart I-4). Chart I-4Global Yield Curves Tend To Move In Unison
Global Yield Curves Tend To Move In Unison
Global Yield Curves Tend To Move In Unison
Historically, the relationship between the yield curve and the dollar has not been consistent (Chart I-5). In the early 80s, the dollar initially rose with a steepening yield curve. In retrospect, rising real rates at the long end of the Treasury curve drove the initial dollar rally. The backdrop was Federal Reserve Chairman Paul Volcker’s resolve to crack down on inflation. Thereafter, rising trade imbalances on the back of a strong dollar eventually led to the Plaza Accord in 1985, which weakened the dollar despite a curve that remained steep. In the 1990s, the dollar rose along with a flattening curve and a productivity boom in the US. In both the latter half of the 2000s and 2010s, the curve flattened, but the performances of the dollar in each case were opposites - weakness in the 2000s, but strength over the last decade. Chart I-5No Consistent Relationship Between The Dollar And The Yield Curve
No Consistent Relationship Between The Dollar And The Yield Curve
No Consistent Relationship Between The Dollar And The Yield Curve
The bottom line is that the dollar tends to do well during recessions, which historically has happened after the yield curve inverts. Prior to that, the performance of the dollar is mixed. Dollar Performance Over Prior Tightening Cycles Chart I-6The Dollar Falls After The First Fed Rate Hike
The Dollar Falls After The First Fed Rate Hike
The Dollar Falls After The First Fed Rate Hike
The dollar has tended to decline 3-to-6 months after the Fed starts hiking interest rates. This has been true since the mid-1990s (Chart I-6). The average decline after six months has been 5.3%. This will pin the DXY at around 95 or so by late summer. As the Appendix shows, while this relationship has been consistent for the dollar, it has been inconclusive for the hiking cycles of other central banks. The exceptions are the CAD, GBP, and SEK which tend to rally three months after their respective central banks raise rates. The AUD initially stalls but performs well one year after the Reserve Bank of Australia lifts interest rates. There is a rationale as to why the dollar performs well ahead of interest rate increases by the Fed, and falters shortly after. Historically, the Fed has usually been the first to start the process of hiking interest rates globally. It has also been the central bank that has lifted rates by the most (Chart I-7). This history of credibility has nudged forward markets to grow accustomed to anticipating the Federal Reserve to be ahead of the curve. As of now, US policy rates stand at 0.25% but the two-year yield is at 2.4%. This divergence could be viewed as vote of credibility akin to during the Volcker years (Chart I-8). Chart I-7The Fed Has Usually Led The Hiking Cycle
The Fed Has Usually Led The Hiking Cycle
The Fed Has Usually Led The Hiking Cycle
Chart I-8The 2-Year/3-Month Treasury Spread Is Very Wide
The 2-year/3-month Treasury Spread Is Very Wide
The 2-year/3-month Treasury Spread Is Very Wide
Beyond a 3-to-6-month timeframe, the path of the dollar has depended on what other central banks are doing (Table I-1). The BoE, BoC, Norges Bank, and RBNZ all raised rates before the Fed. The Riksbank and RBA ended QE ahead of the Fed. The BoJ’s balance sheet has been flat-to-shrinking since 2021. The US dollar has tended to do well when US interest rates are in the top decile amongst the G10 countries (Chart I-9). While that was true before the Covid-19 crisis, it is no longer the case today. This suggests the onus is on the Fed to meet market expectations and keep the dollar strong. Table I-1The Performance Of Currencies Is Mixed When Their Resident Central Bank Hikes Rates
Lessons From Fed Interest Rate Hikes
Lessons From Fed Interest Rate Hikes
Chart I-9The Fed Is Lagging Other G10 Central Banks
The Fed Is Lagging Other G10 Central Banks
The Fed Is Lagging Other G10 Central Banks
Interestingly, the yen has generally done very well around Fed rate hikes (Chart I-10), followed by commodity currencies (Table I-2). It also happens to be incredibly cheap today (Chart I-11). Our bias is that should inflation pick up faster in Japan, the yen will rally ahead of any anticipated changes to monetary policy. Chart I-10G10 Currencies Around The First Fed ##br##Rate Hike
G10 Currencies Around The First Fed Rate Hike
G10 Currencies Around The First Fed Rate Hike
Table 2Most Currencies Appreciate Shortly After The First Fed Rate Hike
Lessons From Fed Interest Rate Hikes
Lessons From Fed Interest Rate Hikes
Chart I-11The Yen Is Very Cheap
The Yen Is Very Cheap
The Yen Is Very Cheap
Are Fed Rate Hikes Sustainable? There is a case to be made that the Federal Reserve could indeed hike interest rates faster than other economies. The 3-month rate-of-change in the dollar has closely followed the mini-growth oscillations between the US and other G10 economies (Chart I-12). US growth is now relatively strong (as measured by relative PMIs or relative economic surprise indices). Barring a global recession, the Fed has more scope to raise interest rates. Related Report Foreign Exchange StrategyThe Yen In 2022 On the flip side, financial conditions in the US are tightening quickly as mortgage rates rise, and the dollar soars. This is happening at a time when growth is weak in China and the PBoC is on an easing path. Chinese long bond yields (a proxy for Chinese growth) tend to rise when the PBoC stimulates growth. (Chart I-13). When the number of Covid-19 cases in China rolls over, there will be a case for growth to firmly bottom. Chart I-12Economic Growth Is Relatively Strong In The US
Economic Growth Is Relatively Strong In The US
Economic Growth Is Relatively Strong In The US
Chart I-13The Chinese Economy Is Soft
The Chinese Economy Is Soft
The Chinese Economy Is Soft
This is important since most Asian economies are very dependent on China to close their output gaps and reach escape velocity in economic growth. Take the example of Japan. Tourist arrivals (mainly from Asia) generally represent 25% of the overall Japanese population but today, that number remains near zero. As a result, consumption outlays in Japan are well below the pre-pandemic trend (Chart I-14). As growth recovers, the Japanese economy should be one of the best candidates for generating non-inflationary growth. This is a bullish backdrop for the currency. Chart I-14Japanese Consumption Is Well Below Trend
Japanese Consumption Is Well Below Trend
Japanese Consumption Is Well Below Trend
Finally, real interest rates in the US remain very low. Empirically, currencies react more to the path of relative real rates (Chart I-15). Chart I-15US Real Rates Are Very Low
US Real Rates Are Very Low
US Real Rates Are Very Low
Seasonality: Friend Or Foe? Coincidentally, the dollar also usually weakens in the second half of the year (Chart I-16). This dovetails with our bias that the dollar also underperforms after the first Fed interest rate hike. This has been especially true over the last decade (Chart I-17). Chart I-16The Dollar Is Seasonally Weak In H2
Lessons From Fed Interest Rate Hikes
Lessons From Fed Interest Rate Hikes
Chart I-17The Dollar Is Seasonally Weak In H2
The Dollar Is Seasonally Weak In H2
The Dollar Is Seasonally Weak In H2
The dollar has already priced in that the Fed will lead the interest rate hiking cycle. However, as we have been highlighting in recent reports, rising inflation is a global problem and not one that is exclusive to the US. The hawks in the ECB are very uncomfortable with this week’s HICP (harmonized index of consumer prices) release of 9.8% in Spain, 7.3% in Germany, and 7% in Italy. As a comparison, headline inflation in the US is 7.9%. A weak euro will only fan the inflationary flame in the eurozone. The Japanese economy could be next in unleashing inflationary surprises, especially on the back of a very cheap yen (Chart I-11). This will raise the probability that the Bank of Japan eases yield curve control. In short, the potential for upside surprises in interest rates is highest outside the US. Concluding Thoughts The academic evidence suggests that short-term interest rates matter more for currencies, especially when policy is close to the zero bound. The BIS report on the topic concludes that short maturity bonds have had the strongest FX impact.1 Moreover, near the effective lower bound, the foreign-exchange impact is greater as the adjustment burden falls onto the exchange rate. As FX becomes the axle of adjustment at lower interest rates, a strong dollar and weaker euro and yen are likely to grease the wheels of an economic rebound in these latter economies. For now, economic momentum in the US is stronger, which indicates that the Fed will initially deliver the bulk of rate hikes priced in the OIS curve this year. Beyond then, if growth picks up faster outside the US, especially in the euro area and Japan, then the USD could enter a consolidation phase. Finally, the yen has tended to be the best-performing currency after a Fed rate hike. Go short USD/JPY if it touches 124. Appendix: Currency Performance Around Interest Rate Hikes United States
Lessons From Fed Interest Rate Hikes
Lessons From Fed Interest Rate Hikes
United States
Lessons From Fed Interest Rate Hikes
Lessons From Fed Interest Rate Hikes
Euro Area
Lessons From Fed Interest Rate Hikes
Lessons From Fed Interest Rate Hikes
Japan
Lessons From Fed Interest Rate Hikes
Lessons From Fed Interest Rate Hikes
United Kingdom
Lessons From Fed Interest Rate Hikes
Lessons From Fed Interest Rate Hikes
Canada
Lessons From Fed Interest Rate Hikes
Lessons From Fed Interest Rate Hikes
Australia
Lessons From Fed Interest Rate Hikes
Lessons From Fed Interest Rate Hikes
New Zealand
Lessons From Fed Interest Rate Hikes
Lessons From Fed Interest Rate Hikes
Switzerland
Lessons From Fed Interest Rate Hikes
Lessons From Fed Interest Rate Hikes
Norway
Lessons From Fed Interest Rate Hikes
Lessons From Fed Interest Rate Hikes
Sweden
Lessons From Fed Interest Rate Hikes
Lessons From Fed Interest Rate Hikes
Chester Ntonifor Foreign Exchange Strategist chestern@bcaresearch.com Footnotes 1 Ferrari, Massimo, Kearns, Jonathan and Schrimpf, Andreas, “Monetary policy’s rising FX impact in the era of ultra-low rates,” Bank of International Settlements, April 2017. Trades & Forecasts Strategic View Tactical Holdings (0-6 months) Limit Orders Forecast Summary
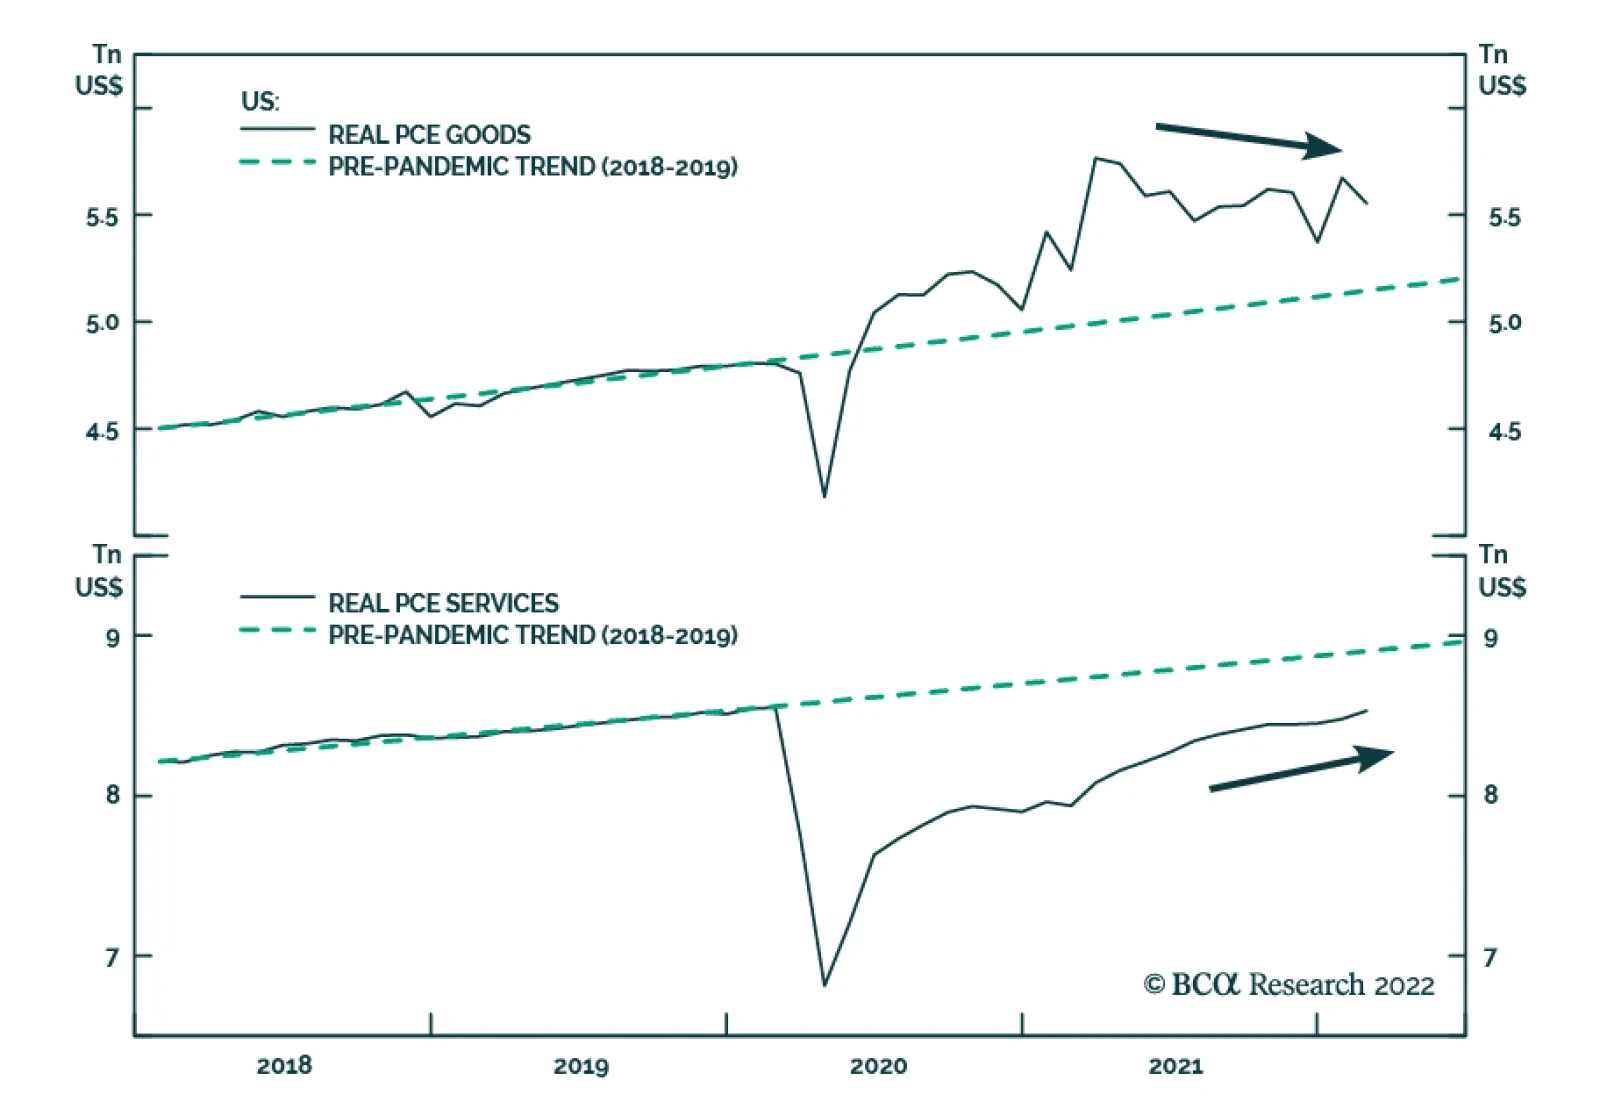
US personal spending fell below expectations in February. The rate of growth of nominal personal spending slowed sharply from 2.7% m/m to 0.2% m/m, below the anticipated 0.5% m/m. In real terms, personal spending declined by 0.4% m/m following January’s 2.1%…