United States

Executive Summary Expansion In European Defense
Expanding Military Spending
Expanding Military Spending
European yields have significant upside on a structural basis. European government spending will remain generous, which will boost domestic demand; meanwhile, lower global excess savings will lift the neutral rate of interest and structurally higher inflation will boost term premia. A short-term pullback in yields is nonetheless likely; however, it will not short-circuit the trend toward higher yields on a long-term basis. CYCLICAL INCEPTION DATE RETURN SINCE INCEPTION (%) COMMENT EQUITIES Favor European Aerospace & Defense Over European Benchmark 3/28/2022 Favor European Aerospace & Defense Over Other Industrials 3/28/2022 Bottom Line: Investors should maintain a below-benchmark duration in their European fixed-income portfolios. Higher yields driven by robust domestic demand and strong capex also boost the appeal of industrial, materials, and financials sectors. Aerospace and defense stocks are particularly appealing. The economic impact of the war in Ukraine continues to drive the day-to-day fluctuations of the market; however, investors cannot ignore the long-term trends in the economy and markets. The direction of bond yields over the coming years is paramount among those questions. Does the recent rise in yields only reflect the current inflationary shock caused by both supply-chain impairments and commodity inflation—that is, is it finite? Or does that rise mirror structural forces and therefore have much further to run? We lean toward yields having more upside over the coming years, propelled higher by structural forces. As a result, we continue to recommend investors structurally overweight sectors that benefit from a rising yield environment, such as financials and industrials, while also favoring value over growth stocks. The defense sector is particularly attractive. Three Structural Forces Behind Higher Yields The current supply-chain disruptions and inflation crises have played a critical role in lifting European yields. However, a broader set of factors underpins our bearish bond view—namely, the lack of fiscal discipline accentuated by the consequences of the Ukrainian war, the likely move higher in the neutral rate of interest generated by lower savings, and the long-term uptrend in inflation. Profligate Governments Chart 1
The Lasting Bond Bear Market
The Lasting Bond Bear Market
Larger government deficits will contribute to higher European yields. Europe is not as fiscally conservative as it was before the COVID-19 crisis. Establishment politicians must fend off pressures caused by voters attracted to populist parties willing to spend more. Consequently, IMF estimates published prior to the Ukrainian war already tabulated that, for the next five years, Europe’s average structurally-adjusted budget deficit would be 2.4% of GDP wider than it was last decade (Chart 1). Chart 2Expanding Military Spending
Expanding Military Spending
Expanding Military Spending
The Ukrainian crisis is also prompting a fiscal response that will last many years. Europe does not want to stand still in the face of the Russian threat. Today, Western Europe’s military spending amounts to 1.5% of GDP, or €170 billion. This is below NATO’s threshold of 2% of GDP. Rebuilding military capacity will take large investments. Thus, European nations are likely to move toward that target and even go beyond. Conservatively, if we assume that military spending hits 2% of GDP by the end of the decade, it will rise above €300 billion (Chart 2). Weaning Europe off Russian energy will also prevent a significant fiscal retrenchment. This effort will take two dimensions. The first initiative will be to build infrastructures to receive more LNG from the rest of the world to limit Russian intake. Constructing regasification and storage facilities as well as re-directing pipeline networks be costly and require additional CAPEX over the coming years. The second initiative will be to double-up on green initiatives to decrease the need for fossil fuel. The NGEU funds are already tackling this strategic goal. Nonetheless, the more than €100 billion reserved for renewable energy and energy preservation initiatives was only designed to kick-start hitting the EU’s CO2 emission target for 2050. Accelerating this process not only helps cutting the dependence on Russian energy, but it is also popular with voters. The path of least resistance is to invest in that sphere and to increase such investment beyond the current sums from the NGEU program. The last fiscal push is likely to be more temporary. The UN estimates that four million refugees have left Ukraine, with the vast majority settling in the EU. Accommodating that many individuals will be costly and will add to government spending across the region. Even if mostly transitory, this spending will have an important impact on activity. Larger fiscal deficits push yields higher for two reasons. Greater sovereign issuance that does not reflect a negative shock to the private sector will need to offer higher rates of returns to attract investors. Moreover, greater government spending will boost aggregate demand, which increases money demand. As a result, the price of money will be higher than otherwise, which means that interest rates will rise—as will yields. Decreasing Global Excess Savings Decreasing global excess savings will put upward pressure on the global neutral rate of interest, a phenomenon Peter Berezin recently discussed in BCA’s Global Investment Strategy service. This process will be visible in Europe as well. The US will play an important role in the process of lifting global neutral rates because the dollar remains the foundation of the global financial system. Compared to last decade, the main drag on US savings is that household deleveraging is over. As households decreased their debt load following the global financial crisis, a large absorber of global savings vanished, putting downward pressure on the price of those savings. Today, US households enjoy strong net worth equal to 620% of GDP and have resumed accumulating debt (Chart 3). Consequently, the downward trend in US total private nonfinancial debt loads has ended. The US capex cycle is likely to experience a boost as well. As Peter highlighted, the US capital stock is ageing (Chart 4). Moreover, the past five years have witnessed three events that underscore the fragility of global supply-chains: a disruptive Sino-US trade war, a pandemic, and now a military conflict. This realization is causing firms to move from a “just-in-time” approach to managing supply-chains to a “just-in-case” one. The process of building redundancies and localized supply chains will add to capex for many years, pushing up ex-ante investments relative to savings, and thus, interest rates. Chart 3US Households Are Done Deleveraging
US Households Are Done Deleveraging
US Households Are Done Deleveraging
Chart 4An Ageing US Capital Stock
An Ageing US Capital Stock
An Ageing US Capital Stock
China’s current account surplus is also likely to decline. For the past two decades, China has been one of the largest providers of savings to the global economy. This is a result of an annual current account surplus that first averaged $150 billion per year from 2000 to 2010 and then $180 billion from 2010 to 2020, and now stands at $316 billion. Looking ahead, China wants to use fiscal policy more aggressively to support demand, which often boosts imports without increasing exports. Also, more domestically-oriented supply chains around the world will limit the growth of Chinese exports. This combination will compress Chinese excess savings, which will place upward pressure on the global neutral rate of interest. Europe is not immune to declining savings. Over the past ten years, the Euro Area current account surplus has averaged €253 billion. Germany’s current account surplus stood at 7.4% of GDP before the pandemic. Those excess savings depressed global rates in general and European ones especially (Chart 5). As in the US, Europe’s capital stock is ageing and needs some upgrade (Chart 6). Moreover, greater government spending boosts aggregate demand. Because investment is a form of derived demand, stronger overall spending promotes capex to a greater extent. Thus, Europe’s public infrastructure push will lift private capex and curtail regional excess savings beyond the original drag from wider fiscal deficits. Additionally, the European population is getting older and will have to tap into their excess savings as they retire. This process will further diminish Europe’s current account surplus, that is, its excess savings. Chart 5Excess Savings Cap Relative Yields
Excess Savings Cap Relative Yields
Excess Savings Cap Relative Yields
Chart 6An Ageing European Capital Stock Too
An Ageing European Capital Stock Too
An Ageing European Capital Stock Too
Structurally Higher Inflation BCA believes that the current inflation surge is temporary and mostly reflects a mismatch between demand and supply. However, we also anticipate that, once this inflation climax dissipates, inflation will settle at a level higher than that prior to COVID-19 and will trend higher for the remainder of this decade. Labor markets will tighten going forward because policy rates remain well below neutral interest rates. Output gaps will close because of robust government spending and capex. This will keep wage growth elevated in the US and reanimate moribund salary gains in the Eurozone (Chart 7). This process, especially when combined with less efficient global supply chains and lower excess savings (which may also be thought of as deficient demand), will maintain inflation at a higher level than in the past two decades. Higher inflation will lift yields for two main reasons. First, investors will require both greater long-term inflation compensation and higher policy rates than in the past. Second, higher inflation often generates greater economic volatility and policy uncertainty, which means that today’s minimal term premia will increase over time (Chart 8). Together, these forces will create a lasting upward drift in yields. Chart 7European Wages Will Eventually Revive
European Wages Will Eventually Revive
European Wages Will Eventually Revive
Chart 8Term Premia Won't Stay This Low
Term Premia Won't Stay This Low
Term Premia Won't Stay This Low
Bottom Line: European yields will sport a structural uptrend for the remainder of the decade. Three forces support this assertion. First, European government spending will remain generous, supported by infrastructure and military spending. Second, global excess savings will recede as US consumer deleveraging ends, global capex rises, and the Chinese current account surplus narrows. Europe will mimic this process in response to an ageing population, greater government spending, and capex. Finally, inflation is on a structural uptrend, which will warrant higher term premia across the world. Not A Riskless View There are two main risks to this view, one in the near-term and one more structural. The near-term risk is the most pertinent for investors right now. Global yields may have embarked on a structural upward path, but a temporary pullback is becoming likely. As Chart 9 highlights, the expected twelve-month change in the US policy rate is at the upper limit of its range of the past three decades. Historically, when the discounter attains such a lofty level, a retrenchment in Treasury yields ensues, since investors have already discounted a significant degree of tightening. The same is true in Europe, where the ECB discounter is also consistent with a temporary pullback in German 10-year yields (Chart 10). Chart 9Discounters Point To A Treasury Rally...
Discounters Point To A Treasury Rally...
Discounters Point To A Treasury Rally...
Chart 10... And A Bund Rally
... And A Bund Rally
... And A Bund Rally
Chart 11A Mixed Message
A Mixed Message
A Mixed Message
Investor positioning confirms the increasing tactical odds of a yield correction. The BCA Composite Technical Indicator for bonds is massively oversold, which often anticipates a bond rally (Chart 11). This echoes the signals from the JP Morgan surveys that highlight the very low portfolio duration of the bank’s clients. However, the BCA Bond Valuation Index suggests that bonds remain expensive. Together, these divergent messages point toward a temporary bond rally, not a permanent one. The longer-term risk is regularly highlighted by Dhaval Joshi in BCA’s Counterpoint service. Dhaval often shows that the stock of global real estate assets has hit $300 trillion or 330% of global GDP. Real estate is a highly levered asset class and global cap rates have collapsed with global bond yields. With little valuation cushion, real estate prices could become very vulnerable to higher yields. Nevertheless, real estate is also a real asset that produces an inflation hedge. Moreover, rental income follows global household income, and stronger aggregate demand will likely lift median household income especially in an environment in which globalization has reached its apex and populism remains a constant threat. Bottom Line: Global investor positioning has become stretched; therefore, a near-term pullback in yield is very likely, especially as central bank expectations have become aggressive. Nonetheless, a bond rally is unlikely to be durable in an environment in which bonds are expensive and in which growth and inflation will remain more robust than they were last decade. A greater long-term risk stems from expensive global real estate markets. However, real estate is sensitive to global economic activity and inflation, which should allow this asset class ultimately to weather higher yields. Investment Conclusions An environment in which yields rise will inflict additional damage on global bond portfolios. This is especially true in inflation-adjusted terms, since real yields stand at a paltry -0.76% in the US and -2.5% in Germany. Hence, we continue to recommend investors maintain a structural below-benchmark duration bias in their portfolios. Nonetheless, investors with enough flexibility in their investment mandate should take advantage of the expected near-term pullback in yields. Those without this flexibility should use the pullback as an opportunity to shorten their portfolio duration. Higher yields will also prevent strong multiple expansion from taking place; hence, the broad stock market will also offer paltry long-term real returns. Another implication of rising yields, especially if they reflect stronger growth and rising neutral interest rates, is to underweight growth stocks relative to value stocks (Chart 12). Growth stocks are expensive and very vulnerable to the pull on discount rates that follows rising risk-free rates. Meanwhile, stronger economic activity driven by infrastructure spending and capex will help the bottom line of industrial and material firms. Financials will also benefit. Higher yields help this sector and robust capex also boosts loan growth, which will generate a significant tailwind for banking revenues. Hence, rising yields will boost the attractiveness of banks, especially after they have become significantly cheaper because of the Ukrainian war (Chart 13). Chart 12Favor Value Over Growth
Favor Value Over Growth
Favor Value Over Growth
Chart 13Bank Remain Attractive
Bank Remain Attractive
Bank Remain Attractive
Related Report European Investment StrategyFallout From Ukraine Finally, four weeks ago, we highlighted that defense stocks were particularly appealing in today’s context. The re-armament of Europe in response to secular tensions with Russia is an obvious tailwind for this sector. However, it is not the only one. A long-term theme of BCA’s Geopolitical Strategy service is the expanding multipolarity of the world. The end of an era dominated by a single hegemon (the US) causes a rise in geopolitical instability and tensions. The resulting increase in conflict will invite a pickup in global military spending. Chart 14Defense Will Outshine The Rest
Defense Will Outshine The Rest
Defense Will Outshine The Rest
European defense and aerospace stocks are expensive, with a forward P/E ratio approaching the top-end of their range relative to the broad market and other industrials. However, their relative earnings are also depressed following the collapse in airplane sales caused by the pandemic. Our bet on the sector is that its earnings will outperform the broad market as well as other industrials because of the global trend toward military buildup. As relative earnings recover their pandemic-induced swoon, so will relative equity prices (Chart 14). Bottom Line: Higher yields warrant a structural below-benchmark duration in European fixed-income portfolios, even if a near-term yield pullback is likely. As a corollary, value stocks will outperform growth stocks while industrials, materials, and financials will also beat a broad market whose long-term real returns will be poor. Within the industrial complex, aerospace and defense equities are particularly appealing because a global military buildup will boost their earnings prospects durably. Mathieu Savary, Chief European Strategist Mathieu@bcaresearch.com Tactical Recommendations Cyclical Recommendations Structural Recommendations Closed Trades
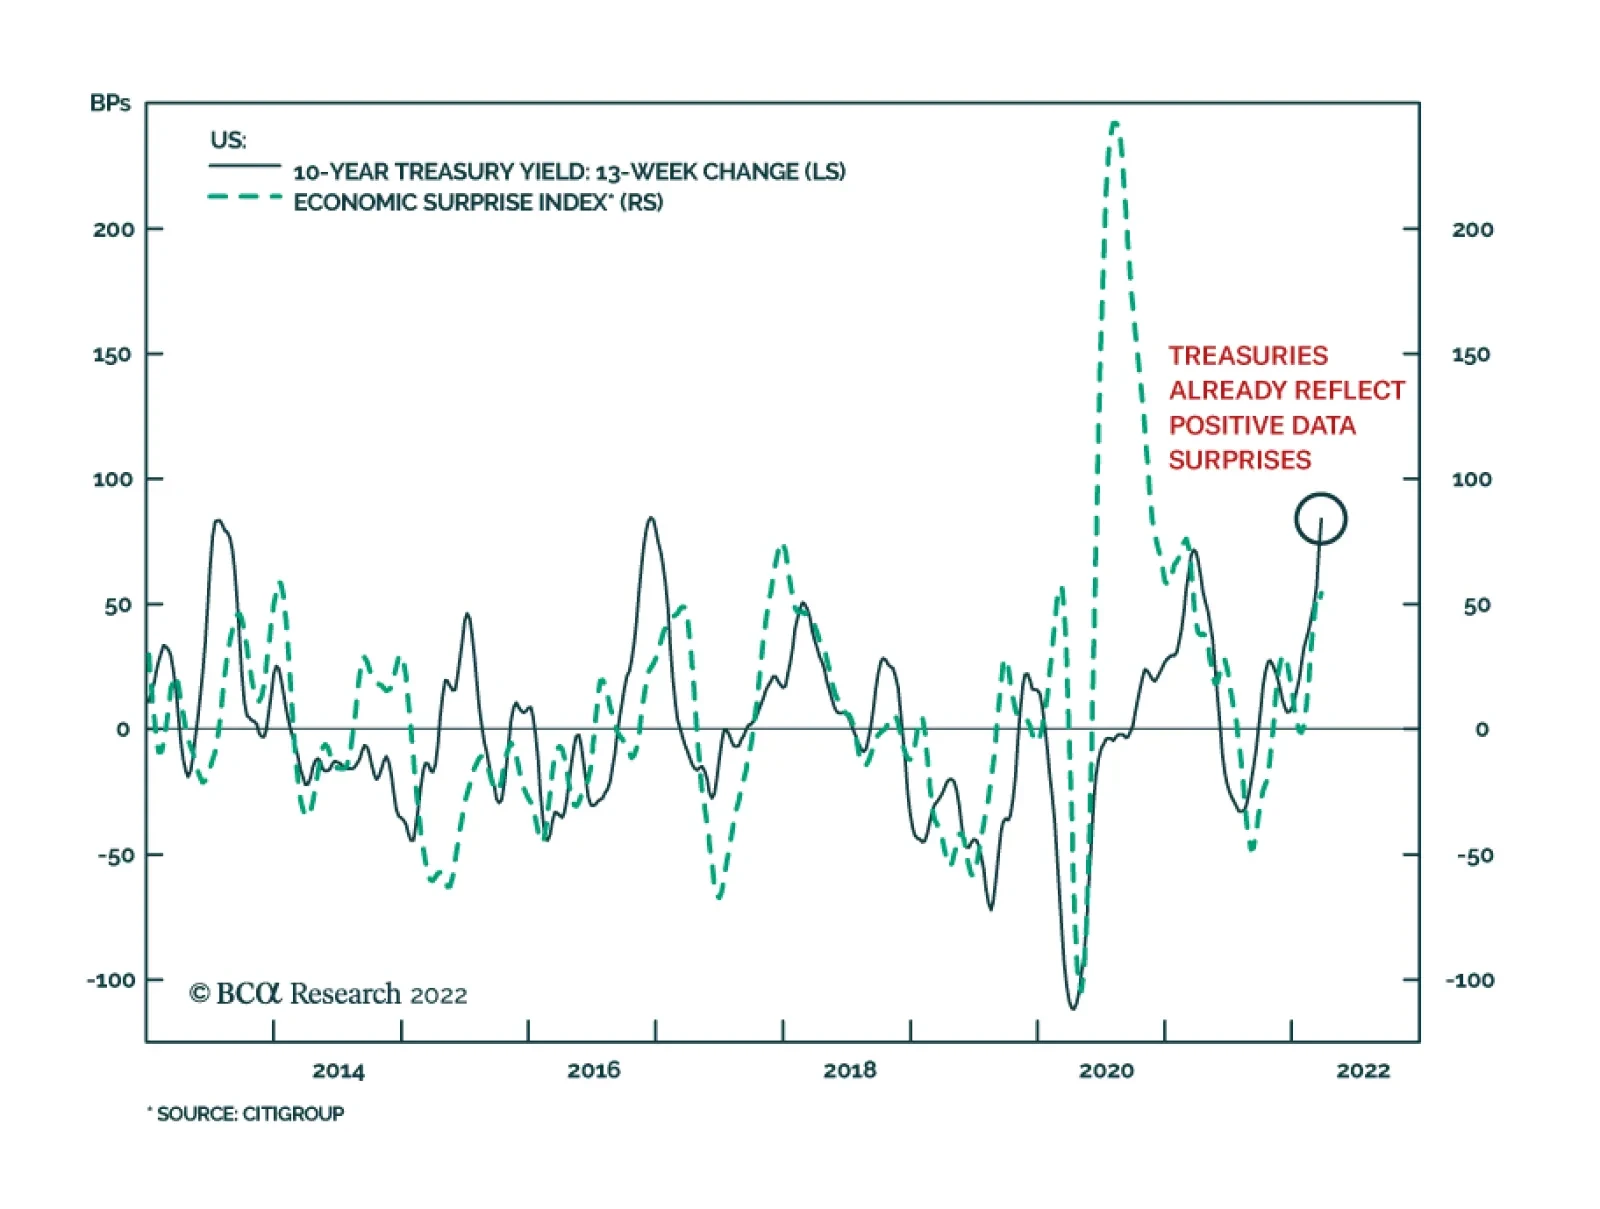
Despite the potential drag on economic growth from soaring commodity prices, US economic data has generally been strong recently. Flash PMIs for March, regional Fed surveys, and jobless claims for March all generated positive surprises and indicate that US…
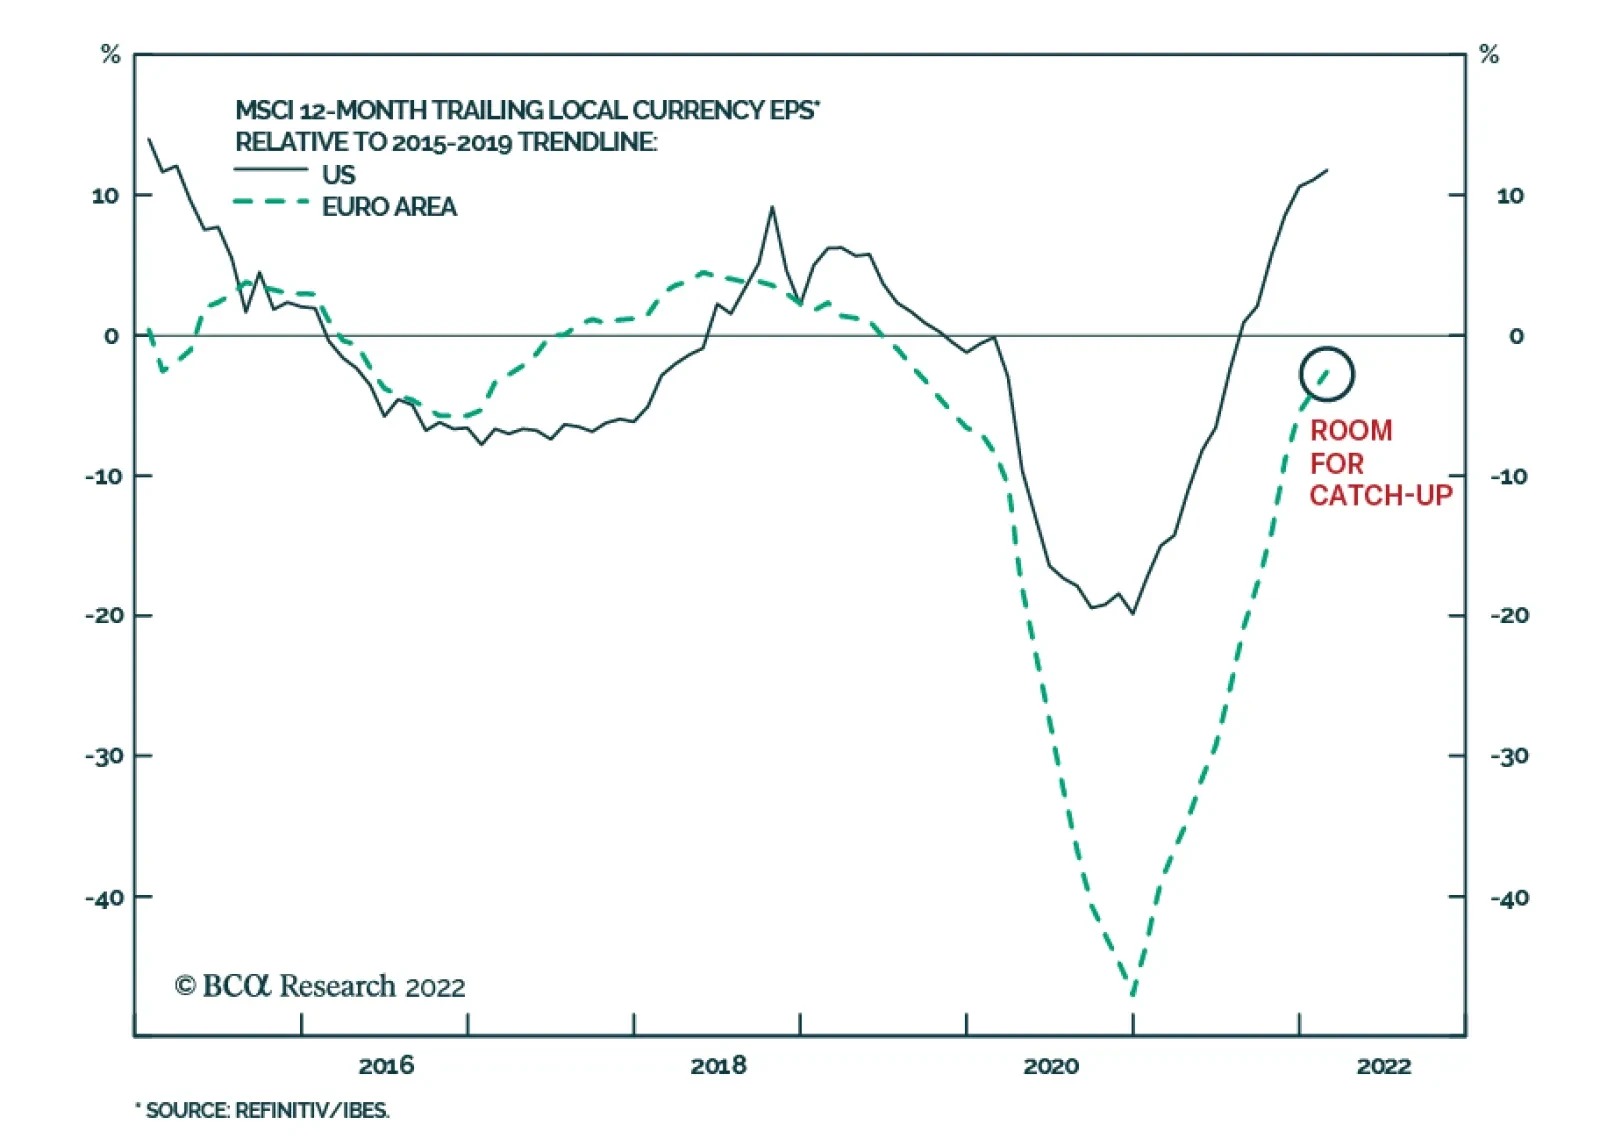
The economic expansion is in a more advanced stage in the US than it is in the Eurozone. US GDP recovered to its Q4 2019 pre-Covid level in the second quarter of 2021, and by the fourth quarter it was 3.2% above where it was prior to the pandemic. The Euro…
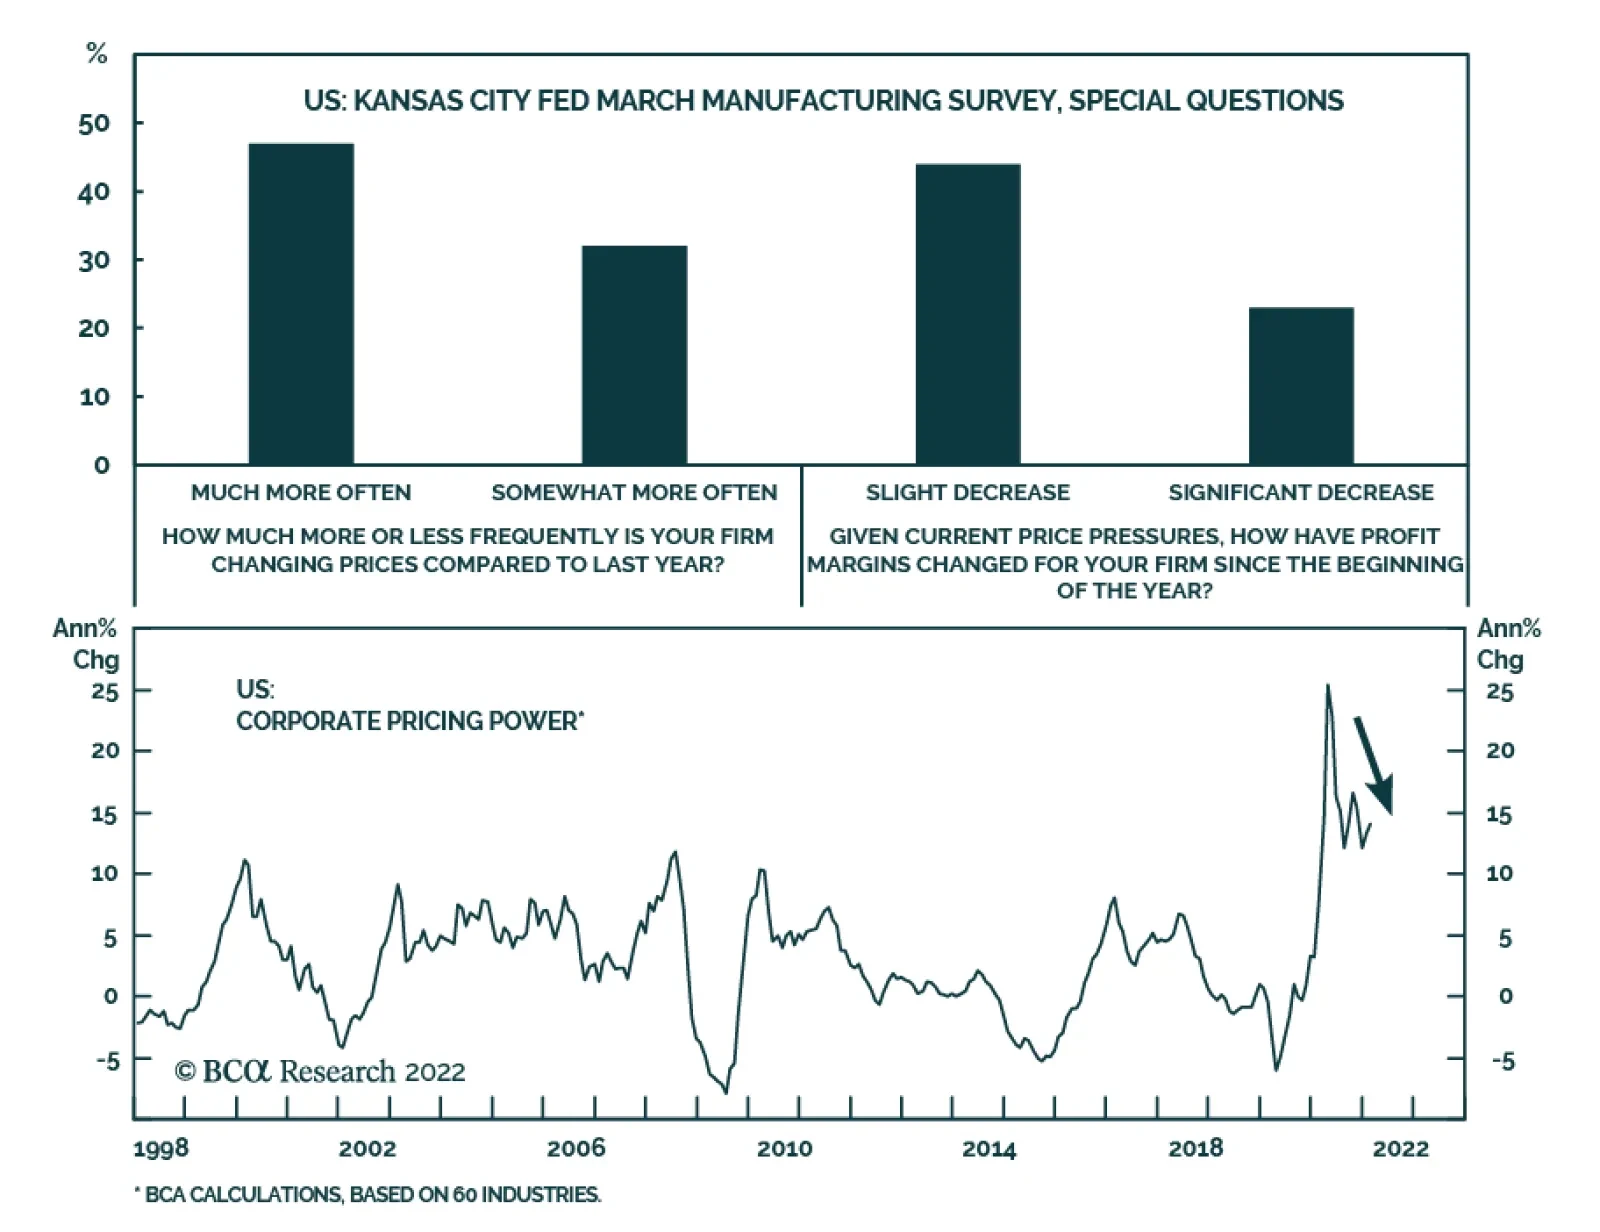
Earlier this week we highlighted that both the Richmond Fed and Philly Fed surveys jumped in March, which suggests that manufacturing activity firmed this month. On Thursday, the Kansas City Fed’s Manufacturing survey also surprised to the upside with the…
Due to travel commitments, there will be no Counterpoint report next week. Instead, we will send you a timely update and analysis of the Ukraine Crisis written by my colleague Matt Gertken, BCA Chief Geopolitical Strategist. Executive Summary The tight connection between the oil price and inflation expectations is intuitive, appealing… and wrong. The inflation market is tiny, and its principle function is not to predict inflation per se, but to serve as a hedging investment in an inflation scare, such as that which follows an oil price spike. Hence, we should treat inflation expectations and the real bond yield that is derived from them with extreme care – especially after an oil price spike, which will give the illusion that the real bond yield is lower than it really is. In the near term, the Ukraine crisis has added to already elevated fears about inflation, which will pressure both bonds and stocks. However, looking beyond the next few months, the Ukraine crisis triggered supply shock will cause demand destruction, while central banks also choke demand, and the recent massive displacement of demand into goods, and its associated inflationary impulse, reverses. The 12-month asset allocation conclusion is to overweight stocks and bonds, and to underweight TIPS and commodities. Fractal trading watchlist: The sell-off in some T-bonds is approaching capitulation. The Tight Relationship Between The Oil Price And Inflation Expectations Is Intuitive, Appealing... And Wrong
The Tight Relationship Between The Oil Price And Inflation Expectations Is Intuitive,Appealing... And Wrong
The Tight Relationship Between The Oil Price And Inflation Expectations Is Intuitive,Appealing... And Wrong
Bottom Line: In the near term, an inflationary impulse will dominate, but on a 12-month horizon, a disinflationary impulse will dominate. Feature In his seminal work Thinking Fast And Slow, Nobel Laureate psychologist Daniel Kahneman presented the bat-and-ball puzzle. A bat and ball cost $1.10. The bat costs one dollar more than the ball. How much does the ball cost? “A number came to your mind. The number, of course, is 10: 10 cents. The distinctive mark of this easy puzzle is that it evokes an answer that is intuitive, appealing, and wrong. Do the math, and you will see. If the ball costs 10 cents, then the total cost will be $1.20 (10 cents for the ball and $1.10 for the bat), not $1.10. The correct answer is 5 cents. It is safe to assume that the intuitive answer also came to the mind of those who ended up with the correct number – they somehow managed to resist the intuition.” Kahneman’s crucial finding is that many people are prone to place too much faith in an intuitive answer, an intuitive answer that they could have rejected with a small investment of effort. The Connection Between The Oil Price and Inflation Expectations Is Intuitive, Appealing… And Wrong Today, the financial markets are presenting their very own bat-and-ball puzzle. The surging price of crude oil is driving up the market expectation for inflation over the next ten years (Chart I-1). This tight relationship is intuitive and appealing, because we associate a high oil price with a high inflation rate. But the intuitive and appealing relationship is wrong, and it requires just a small investment of effort to prove the fallacy. Chart I-1The Tight Relationship Between The Oil Price And Inflation Expectations Is Intuitive, Appealing... And Wrong
The Tight Relationship Between The Oil Price And Inflation Expectations Is Intuitive, Appealing... And Wrong
The Tight Relationship Between The Oil Price And Inflation Expectations Is Intuitive, Appealing... And Wrong
Inflation over the next ten years equals the price in ten years’ time divided by the current price. So, to the extent that there is any relationship between the current price and expected inflation, dividing by a higher price today means a lower prospective inflation rate. Empirically, the last fifty years of evidence confirms this very clear inverse relationship (Chart I-2). Chart I-2A High Oil Price Means Lower Subsequent Inflation
A High Oil Price Means Lower Subsequent Inflation
A High Oil Price Means Lower Subsequent Inflation
This raises an obvious question: while many people accept the intuitive (wrong) relationship between the oil price and expected inflation, how can the market make such a glaring error? The answer is that the inflation market is relatively tiny, and that its principle function is not to predict inflation per se, but to serve as a hedging investment in an inflation scare. Compared to the $25 trillion T-bond market, the Treasury Inflation Protected Securities (TIPS) market is worth just $1.5 trillion, slightly more than the market capitalisation of Tesla. Just as we do not expect Tesla to represent the view of the entire stock market, we should not expect TIPS to represent the view of the entire bond market. A high oil price means lower subsequent inflation. A recent paper by The Oxford Institute For Energy Studies explains: “the tight relationship between the oil price and inflation expectations defies not only the thesis of economics, but the norms of statistics as well, with a correlation that has reached 90 percent over the last ten years and a corresponding r-squared of 82 percent (Chart I-3 and Chart I-4). The root cause of this phenomenon should probably be searched for in the behaviour of another large group of market participants, the systematic portfolio allocators, and factor investors.”1 Chart I-3Inflation Expectations Are Just A Mathematical Function Of The Oil Price...
Inflation Expectations Are Just A Mathematical Function Of The Oil Price...
Inflation Expectations Are Just A Mathematical Function Of The Oil Price...
Chart I-4...Therefore 'The Real Bond Yield' Is Just A Mathematical Function Of The Oil Price
...Therefore 'The Real Bond Yield' Is Just A Mathematical Function Of The Oil Price
...Therefore 'The Real Bond Yield' Is Just A Mathematical Function Of The Oil Price
So, here’s the explanation for the intuitive, appealing, but wrong connection between the oil price and inflation expectations. In the inflation scare that a surging oil price unleashes, the two main asset-classes – bonds and equities – are vulnerable to sharp losses, leaving TIPS as one of the very few assets that can provide a genuine hedge against inflation. But given that bonds and equities dwarf the $1.5 trillion TIPS (and other inflation) markets, the inflation hedger quickly becomes the dominant force in this tiny market. This large volume of hedging demand chasing limited supply drives down the real yields on TIPS to artificial lows, both in absolute terms and relative to T-bond yields. And as the difference between nominal and real yields defines the ‘market’s expected inflation’, it explains the surge in expected inflation. Be Careful How You Use ‘The Real Bond Yield’ It is an unfortunate reality that we often close the stable door after the horse has bolted, meaning that we react after, rather than before, the event. In financial market terms, this means that we demand inflation protection after, rather than before, it happens, and end up overpaying for it. A high oil price unleashes a massive hedging demand for the tiny TIPS market, driving down the real TIPS yield versus the nominal T-bond yield. To repeat, a high oil price unleashes a massive hedging demand for the tiny TIPS market, driving down the real TIPS yield versus the nominal T-bond yield. The upshot is that the performance of TIPS versus T-bonds is nothing more than a play on the oil price (Chart I-5). Chart I-5The Performance Of TIPS Versus T-Bonds Is Just A Play On The Oil Price
The Performance Of TIPS Versus T-Bonds Is Just A Play On The Oil Price
The Performance Of TIPS Versus T-Bonds Is Just A Play On The Oil Price
A bigger message is that we should interpret the oft-quoted ‘real bond yield’ with extreme care. The real bond yield is nothing more than the nominal bond yield less a mathematical function of the oil price. So, when the oil price is high, it will give the illusion that the real bond yield is low. The danger is that if we value equities against the real bond yield when the oil price is high – such as through 2011-14 or now – equities will appear cheaper than they really are (Chart I-6). Chart I-6When The Oil Price Is High, 'The Real Bond Yield' Will Appear Lower Than It Really Is
When The Oil Price Is High, 'The Real Bond Yield' Will Appear Lower Than It Really Is
When The Oil Price Is High, 'The Real Bond Yield' Will Appear Lower Than It Really Is
In The Case Against A ‘Super Bubble’ (And The Case For) we explained the much better way to value equities is versus the product of the nominal bond price and current profits. This valuation approach perfectly explains the US stock market’s evolution both over the long term (Chart I-7) and the short term. Specifically, over the past year, the dominant driver of the US stock market has been the 30-year T-bond price (Chart I-8). Chart I-7The US Stock Market = Profits Times The 30-Year T-Bond Price (Long-Term Chart)
The US Stock Market = Profits Times The 30-Year T-Bond Price (Long-Term Chart)
The US Stock Market = Profits Times The 30-Year T-Bond Price (Long-Term Chart)
Chart I-8The US Stock Market = Profits Times The 30-Year T-Bond Price (Short-Term Chart)
The US Stock Market = Profits Times The 30-Year T-Bond Price (Short-Term Chart)
The US Stock Market = Profits Times The 30-Year T-Bond Price (Short-Term Chart)
12-Month Asset Allocation Conclusion The current inflation scare comes not from an aggregate demand shock, but from a massive displacement of demand (into goods) followed by the more recent supply shock for energy and food triggered by the Ukraine crisis. In response, central banks are trying to douse the inflation in the only way they can – by choking aggregate demand. Hence, there is a dangerous mismatch between the malady and the remedy. In the near term, the Ukraine crisis has added to already elevated fears about inflation – and this will pressure both bonds and stocks. However, looking beyond the next few months, the near-term inflationary impulse will unleash a disinflationary response from three sources. First, a supply shock means higher prices without stronger demand, which causes an inevitable demand destruction that then pulls down prices. Second, central banks are explicitly trying to pull down prices – or at least price inflation – by choking demand. And third, the massive displacement of demand into goods, and its associated inflationary impulse, is reversing. On a 12-month horizon, the disinflationary impulse will outweigh the inflationary impulse. Therefore, on a 12-month horizon, the disinflationary impulse will outweigh the inflationary impulse. The asset allocation conclusion is to overweight stocks and bonds, and to underweight TIPS and commodities. Is The Bond Sell-Off Close To Capitulation? Finally, several clients have asked if the recent sell-off in bonds is close to capitulation, based on the fragility of its fractal structures. The answer is yes, but only for the shorter maturity T-bonds. Specifically, the 5-year T-bond has reached the point of fragility on its composite 130-day/260-day fractal structure that marked the bottom of the sell-off in 2018, as well as the top of the rally in 2020 (Chart I-9). Chart I-9The Sell-Off In Shorter-Dated T-Bonds Is Close To Capitulation
The Sell-Off In Shorter-Dated T-Bonds Is Close To Capitulation
The Sell-Off In Shorter-Dated T-Bonds Is Close To Capitulation
Accordingly, this week’s trade recommendation is to buy the 5-year T-bond, setting the profit target and symmetrical stop-loss at 4 percent, and with a maximum holding period of 1 year. Please note that our full fractal trading watchlist is now available on our website: cpt.bcaresearch.com Dhaval Joshi Chief Strategist dhaval@bcaresearch.com Footnotes 1 https://www.oxfordenergy.org/wpcms/wp-content/uploads/2021/08/Is-the-Oil-Price-Inflation-Relationship-Transitory.pdf Chart 1The Strong Trend In The 18-Month-Out US Interest Rate Future Is Fragile
The Strong Trend In The 18-Month-Out US Interest Rate Future Is Fragile
The Strong Trend In The 18-Month-Out US Interest Rate Future Is Fragile
Chart 2The Strong Trend In The 3 Year T-Bond Is Fragile
The Strong Trend In The 3 Year T-Bond Is Fragile
The Strong Trend In The 3 Year T-Bond Is Fragile
Chart 3AUD/KRW Is Vulnerable To Reversal
AUD/KRW Is Vulnerable To Reversal
AUD/KRW Is Vulnerable To Reversal
Chart 4Canada Versus Japan Is Vulnerable To Reversal
Canada Versus Japan Is Vulnerable To Reversal
Canada Versus Japan Is Vulnerable To Reversal
Chart 5Canada's TSX-60's Outperformance Might Be Over
Canada's TSX-60's Outperformance Might Be Over
Canada's TSX-60's Outperformance Might Be Over
Chart 6US Healthcare Vs. Software Approaching A Reversal
US Healthcare Vs. Software Approaching A Reversal
US Healthcare Vs. Software Approaching A Reversal
Chart 7The Euro’s Underperformance Could Be Approaching a Resistance Level
The Euro's Underperformance Could Be Approaching a Resistance Level
The Euro's Underperformance Could Be Approaching a Resistance Level
Chart 8A Potential Switching Point From Tobacco Into Cannabis
A Potential Switching Point From Tobacco Into Cannabis
A Potential Switching Point From Tobacco Into Cannabis
Chart 9Bitcoin's 65-Day Fractal Support Is Holding For Now
Bitcoin's 65-Day Fractal Support Is Holding For Now
Bitcoin's 65-Day Fractal Support Is Holding For Now
Chart 10Biotech Approaching A Major Buy
Biotech Approaching A Major Buy
Biotech Approaching A Major Buy
Chart 11CAD/SEK Reversal Has Started
CAD/SEK Reversal Has Started
CAD/SEK Reversal Has Started
Chart 12Financials Versus Industrials Is Reversing
Financials Versus Industrials Is Reversing
Financials Versus Industrials Is Reversing
Chart 13Norway's Outperformance Could End
Norway's Outperformance Could End
Norway's Outperformance Could End
Chart 14Greece's Brief Outperformance Has Ended
Greece's Brief Outperformance Has Ended
Greece's Brief Outperformance Has Ended
Chart 15BRL/NZD At A Resistance Point
BRL/NZD At A Resistance Point
BRL/NZD At A Resistance Point
Fractal Trading System Fractal Trades
Solved: The Mystery Of The Oil Price And Inflation Expectations
Solved: The Mystery Of The Oil Price And Inflation Expectations
Solved: The Mystery Of The Oil Price And Inflation Expectations
Solved: The Mystery Of The Oil Price And Inflation Expectations
6-Month Recommendations Structural Recommendations Closed Fractal Trades Indicators To Watch - Bond Yields Chart II-1Indicators To Watch - Bond Yields - Euro Area
Indicators To Watch - Bond Yields - Euro Area
Indicators To Watch - Bond Yields - Euro Area
Chart II-2Indicators To Watch - Bond Yields - Europe Ex Euro Area
Indicators To Watch - Bond Yields - Europe Ex Euro Area
Indicators To Watch - Bond Yields - Europe Ex Euro Area
Chart II-3Indicators To Watch - Bond Yields - Asia
Indicators To Watch - Bond Yields - Asia
Indicators To Watch - Bond Yields - Asia
Chart II-4Indicators To Watch - Bond Yields - Other Developed
Indicators To Watch - Bond Yields - Other Developed
Indicators To Watch - Bond Yields - Other Developed
Indicators To Watch - Interest Rate Expectations Chart II-5Indicators To Watch - Interest Rate Expectations
Indicators To Watch - Interest Rate Expectations
Indicators To Watch - Interest Rate Expectations
Chart II-6Indicators To Watch - Interest Rate Expectations
Indicators To Watch - Interest Rate Expectations
Indicators To Watch - Interest Rate Expectations
Chart II-7Indicators To Watch - Interest Rate Expectations
Indicators To Watch - Interest Rate Expectations
Indicators To Watch - Interest Rate Expectations
Chart II-8Indicators To Watch - Interest Rate Expectations
Indicators To Watch - Interest Rate Expectations
Indicators To Watch - Interest Rate Expectations
Executive Summary Biden’s Low Approval On Foreign Policy
Biden's Foreign Policy And The Midterms
Biden's Foreign Policy And The Midterms
The energy shock stemming from President Biden’s foreign policy challenges could get worse, especially if US-Iran talks fail. The energy and inflation shocks condemn the Democrats to a dismal midterm election showing, even if Biden handles the Ukraine crisis reasonably well and his approval rating stabilizes. Biden’s foreign policy is still somewhat defensive, focusing on refurbishing US alliances, and as such should not force the EU to boycott Russian energy outright. Biden’s foreign policy doctrine will likely be set in stone with his imminent decision on whether to rejoin the 2015 nuclear deal with Iran. We doubt it will happen but if it does the market impact will be fleeting due to lack of implementation. Biden’s foreign policy toward China will likely grow more aggressive over time. Recommendation (Cyclical) Inception Level Initiation Date Return Long ISE Cyber-Security Index 647.53 Dec 8, 2021 -4.6% Bottom Line: President Biden foreign policy challenges are creating persistent downside risks for equity markets. Feature External risk is one of our key views for US politics in 2022. This risk includes but is not limited to the war in Ukraine. The Biden administration’s urgent foreign policy challenges are creating persistent downside risks for the global economy and financial markets in the short run – embodied in rising energy costs (Chart 1). Related Report US Political Strategy2022 Key Views: Gridlock Begins Before The Midterms Chart 1Oil Prices And Prices At The Pump
Oil Prices And Prices At The Pump
Oil Prices And Prices At The Pump
Ukraine Can Still Hurt US Stocks The Ukraine war is not on the verge of resolution – more bad news is likely to hit US equity markets. The Russian military is bombarding the port city of Mauripol, which will fall in the coming days or weeks (Map 1). Given that Mauripol is refusing to surrender, it is highly unlikely that the central government in Kiev will surrender anytime soon. Map 1Russian Invasion Of Ukraine 2022
Biden's Foreign Policy And The Midterms
Biden's Foreign Policy And The Midterms
The military situation is approaching stalemate and yet ceasefire talks are not promising. The Ukrainians do not accept Russian control of Donbas and Crimea and will need to hold a referendum on the terms of any peace agreement. Lack of progress will drive the Russians to escalate the conflict, whether by means of bombardment, troop reinforcements, or bringing the Belarussian military into the fight. The United States and its allies are increasing defense support for Ukraine while warning that Russia could use chemical, biological, or even tactical nuclear weapons. In our sister Geopolitical Strategy service we argue that the war to get worse before it gets better, with Russia determined to replace the government in Kiev. US investors should expect continued equity market volatility. US and global growth expectations are yet to be fully downgraded as a result of the global energy shortage – the Fed now expects GDP growth of 2.8% while the Atlanta Fed shows GDP clocking in at 1.3%, well below consensus expectations (Chart 2). Corporate earnings will suffer downgrades as a result of higher energy costs. The Federal Reserve just started hiking interest rates and it is not discouraged by foreign affairs. Real rates will rise. Chairman Jerome Powell sounded a hawkish tone by saying that he is willing to hike by 50 basis points at a time if required. The threat of a wage-price spiral is real. The 2-year/10-year Treasury slope is on the verge of inverting. The Fed’s new interest rate projections suggest that the interest rate will rise above the neutral rate in 2023-24. Chart 2Growth Will Take A Hit
chart 2
Growth Will Take A Hit
Growth Will Take A Hit
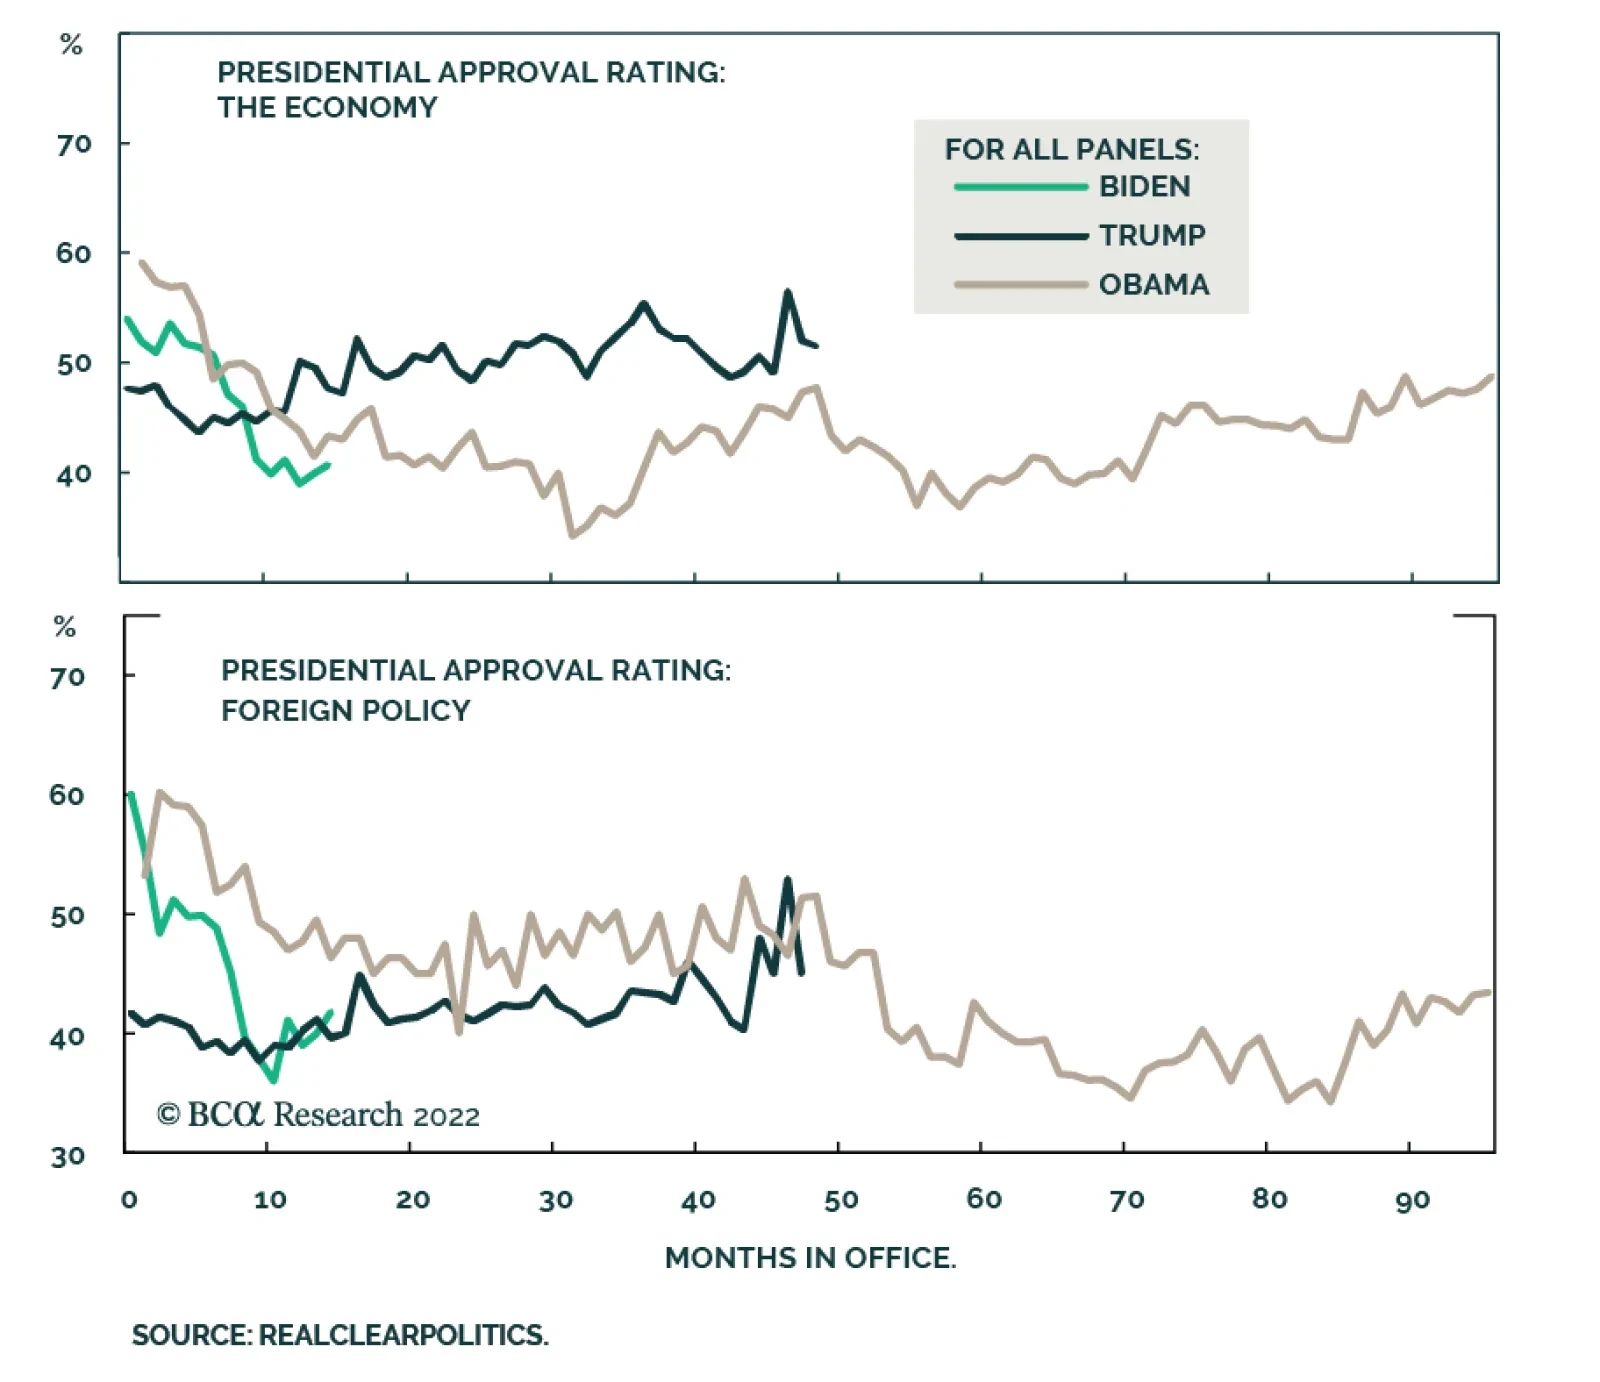
Ukraine’s Impact On The Midterm Elections A negative foreign policy and macroeconomic background will compound the Democratic Party’s woes in the midterm elections. Biden’s approval rating is languishing at Donald Trump levels, yet without Trump’s high marks on the economy (Chart 3). Biden will not be able to turn the economy around because even if inflation starts to abate, voters will react to the one-year and two-year increase in inflation rather than any month-on-month improvement. Republicans have pulled ahead of Democrats in generic congressional ballot opinion polling (Chart 4). Even if Biden’s ratings stabilize ahead of the midterms (even if he handles Ukraine well), Democrats face a shellacking. The market is rightly priced for Republicans to take over all of Congress, though the GOP’s odds of taking the Senate are lower than consensus holds (Chart 5). A Republican victory is not negative for US corporate earnings but uncertainty over the general direction of US policy will continue to weigh on the equity market this year. Chart 3Biden’s Approval Ratings
Biden's Foreign Policy And The Midterms
Biden's Foreign Policy And The Midterms
Chart 4Republicans Take The Lead
Biden's Foreign Policy And The Midterms
Biden's Foreign Policy And The Midterms
Biden’s foreign policy can and will get a lot more aggressive if the Democratic Party views its election odds as so dismal that foreign tensions come to be seen as a source of badly needed popular support. That is not yet the case but developments with Russia and Iran could force the administration to adopt a more offensive foreign policy, which would be negative for financial markets. Hence investors will have to worry about rising policy uncertainty over the 2022-24 political cycle. Chart 5Midterm Election Odds
Biden's Foreign Policy And The Midterms
Biden's Foreign Policy And The Midterms
Biden’s Policy Toward Russia And Europe It is too soon to say precisely what is the “Biden Doctrine” of foreign policy. The withdrawal from Afghanistan and the war in Ukraine were thrust upon Biden. What will define his foreign policy is how he handles Russia, Iran, and China going forward. By the end of the year, Biden will have forged his foreign policy doctrine, for better or worse. Biden began with a defensive foreign policy. His administration’s primary intention is to refurbish US alliances in Europe and Asia to counter Russia and China. Consider: In 2021, Biden condoned Germany’s deepening economic and energy integration with Russia (i.e. the Nord Stream II pipeline). Russia’s invasion forced Germany to change its mind and join the US and other democracies in imposing harsh sanctions on Russia. Even so, the US is calibrating its actions to what the European allies can stomach. Biden is attempting to negotiate new trade deals with allies, by contrast with President Trump’s tendency to slap tariffs on allies as well as rivals.1 Biden is likely to try to revive the Transatlantic Trade and Investment Partnership (TTIP) with Europe, he is scheduled to restart talks with the UK about a post-Brexit trade deal, and he will probably attempt to rejoin the Trans-Pacific Partnership (CPTPP) in future. Now that Russia has invaded Ukraine, Biden’s foreign policy is becoming more aggressive, albeit still within certain limitations: The US is not willing to send troops to defend Ukraine or impose a no-fly zone, which would trigger direct conflict with Russia. But the US is continuing to provide Ukraine with lethal weapons, which helped precipitate the war. Congress recently voted to increase Ukraine aid by $13.6 billion, including $6.5 billion in defense support, including drones, Stinger anti-aircraft missiles, and Javelin anti-tank missiles. These are supposed to start arriving in Ukraine in a few days. The US is reportedly looking into providing Ukraine with Soviet-era SA-8 air defense, though not the S-300s missile defense.2 The US is bulking up its military presence across Europe to deter Russia from broadening its attacks beyond Ukraine. Biden has declared a red line in that he will defend “every inch” of NATO territory. This means that a single Russian attack that spills over into Poland or another NATO country will precipitate a new and bigger crisis (and financial market selloff). The risk going forward is that American policy could grow increasingly aggressive to the point that tensions with Russia escalate. Unlike Russia and Europe, the US does not have vital national interests at stake in Ukraine. American national security is not directly threatened by the war there. Hence the US can afford to take actions that its European allies would prefer not to take. As long as Biden prioritizes solidarity with the Europeans, geopolitical risks may be manageable for the markets. But if Biden attempts to lead an even bolder charge against Russia (or China), then risks will become unmanageable. So far Biden is allowing Europe to impose sanctions at its own pace and intensity. The Europeans must tread more carefully than the US, lest sanctions cause a broad energy cutoff that plunges their economy into recession along with Russia’s. This would destabilize the whole Eurasian continent and increase the chances of strategic miscalculation and a broader military conflict. Europe has opted for a medium-term strategy of energy diversification while avoiding the US’s outright boycott of Russian energy. The EU depends on Russia for 26% of its oil and 16% of its natural gas imports (Chart 6). The dependency is higher for certain countries. Germany, Italy, Hungary, and others oppose an outright boycott – and a single EU member can veto any new sanctions. Theoretically the Europeans could ban oil while still accepting natural gas. Natural gas trade routes are fixed due to physical pipelines, whereas oil is more easily rerouted, leaving Russia with alternatives if Europe stops importing oil. But Russia exports 63% of its oil to developed markets and 65% of its natural gas, with the bulk of that going to the European Union at 48% and 15% respectively (Chart 7). Russia’s economy would suffer from an oil ban and it would assume that a natural gas ban would soon follow, which could unhinge expectations that war tensions can be contained. Chart 6EU Mulls Boycott Of Russian Oil
Biden's Foreign Policy And The Midterms
Biden's Foreign Policy And The Midterms
Chart 7Russian Regime Depends On O&G
Biden's Foreign Policy And The Midterms
Biden's Foreign Policy And The Midterms
Given the damaged state of the Russian economy and high costs of war, Moscow will probably keep accepting energy revenues as long as Europe is buying. But if it believes Europe will cut off the flow, then it has an incentive to act first. This is a risk, not our base case. Still, as Russia targets the capital Kiev with intense shelling and civilian casualties increase, US pressure for an expansion of sanctions will increase. This is the risk that investors need to monitor. If the US brings the EU around to adopting sanctions on Russian energy then equity markets will plunge anew. And since Europe is diversifying over time anyway, Russia will have to escalate the war now to try to achieve its aims before its source of funds dries up. Biden’s Policy Toward China Biden’s foreign policy also started out defensively with regard to China. Biden intended to stabilize relations, i.e. engage in some areas like climate policy and avoid expanding President Trump’s trade war. Both the Democratic Party and the Communist Party face important political events in 2022 and their inclination is to prevent global instability from interfering. But the Ukraine war has made this goal harder. As with Europe the immediate question is whether Biden will try to force China to cooperate on Russia sanctions. But in China’s case Biden is more likely to use punitive measures – at least eventually. After a two-hour bilateral phone call on March 18, Biden “described the implications and consequences if China provides material support to Russia as it conducts brutal attacks against Ukrainian cities and civilians.”3 Biden’s threat of sanctions is a negative for Chinese exporters and banks (Chart 8). Chinese stock markets were already suffering from China’s historic confluence of internal and external political and economic risks. The Ukraine war has increased the fear of western investors that investing in China will result in stranded capital when strategic tensions rise explode, as with Russia. Chart 8Biden Threatens China With Sanctions
Biden Threatens China With Sanctions
Biden Threatens China With Sanctions
Economically, China is much more dependent on the West than Russia. While Germany and Russia take a comparable share of Chinese exports, at 3.4%and 2.0% respectively, the EU takes up more than three times as many Chinese exports as the Commonwealth of Independent States, at 15.4% versus 3.2% (Chart 9A Chart 9B). China was never eager to commit to an exclusive economic relationship with Russia at the expense of its western markets. Strategically, however, China cannot afford to reject Russia. Chart 9AEU Wary Of Targeting China
EU Wary Of Targeting China
EU Wary Of Targeting China
Chart 9BEU Wary Of Targeting China
EU Wary Of Targeting China
EU Wary Of Targeting China
Russia has now severed ties with the West and has no choice but to offer favorable deals to China on the whole range of relations. China’s greatest strategic threat is US sea power; Russia offers a strategically vital overland source of natural resources. Russia also offers intelligence and security assistance in critical regions like Central Asia and the Middle East that China needs to access. Like Russia, China fears US containment policy and views US defense relations with its immediate neighbors as a fundamental national security threat. President Biden reassured China that US policy toward the Taiwan Strait has not changed but also said that the US opposes any unilateral attempt to change the status quo. The implication is that China will segregate its EU and Russia networks of trade and finance to minimize the impact of any US secondary sanctions. China will offer Russia some assistance while making diplomatic gestures to maintain economic relations with Europe. The Europeans will lobby the Americans not to expand sanctions on China. The Biden administration will be reluctant to increase sanctions on China immediately, since it wants to maintain global stability in general, control the pace of rising global tensions, and maintain maneuverability for immediate problems with Russia and Iran. Biden’s priority is to rebuild US alliances and Europe will be averse to expanding the sanction regime to China. Therefore any sanctions on China will come only slowly and with ample warning to global investors. But sanctions are possible over the course of the year. If the Biden administration concludes that it has utterly lost domestic support, that the midterm elections are a foregone conclusion, then it can afford to get tougher in the international arena in hopes that it can improve its standing with voters. Biden’s Policy Toward Iran While Afghanistan and Ukraine were thrust upon Biden, the major foreign policy challenge in which he retains the initiative is whether to rejoin the 2015 nuclear deal with Iran. Thus it may be policy toward Iran and the Middle East that defines the Biden doctrine. The Ukraine war has not stopped the Biden administration from seeking to rejoin the 2015 Joint Comprehensive Plan of Action, which was a strategic US-Iran détente that sought to freeze Iran’s nuclear program in exchange for its economic development. The original nuclear deal occurred with Russia’s blessing after the US and EU overlooked Russia’s invasion of Crimea. Now negotiations toward rejoining that deal are reaching the critical hour. The US has supposedly offered Russia guarantees to retain Russian support. The reason for Biden to rejoin the 2015 deal is to open Iran’s oil and natural gas reserves to the global and European economy and thus mitigate the global energy shock ahead of the midterm elections. Iran could return one million barrels per day to global markets. There is also a strategic logic for normalizing relations with Iran: to maintain a balance of power in the Middle East, reduce US military commitment there, provide Europe with greater security, and free up resources to counter Russia and China. Whether the deal will fulfill these ends is debatable but the Biden administration apparently believes it will. Biden is capable of rejoining the deal because the critical concessions do not require congressional approval. Through executive action alone, Biden could meet Iran’s demands: sanctions relief, delisting the Iranian Revolutionary Guard Corps as a terrorist organization, and ensuring that Russo-Iranian trade (especially nuclear cooperation) is not exempted from the new Russia sanctions. There will be domestic political blowback for each of these concessions but not as much as there will be if gasoline prices continue to rise due to greater global instability stemming from the Middle East. The Iranians are also capable of rejoining the deal. Supreme Leader Ali Khamenei, in his Persian New Year speech, gave a green light for President Ebrahim Raisi’s administration to pursue policies that would remove US sanctions. Khamanei implied that Iran should let the West lift sanctions while continuing to fortify its economy to future US sanctions.4 While the US and Iran are clearly capable of a stop-gap deal, it will not be a durable agreement – and hence any benefits for global energy supply will be called into question. The reason is that the underlying strategic logic is suffering: Biden will appear incoherent if he alienates Saudi Arabia and the UAE while appealing to them to increase oil production – and they are more capable than Iran on this front (Chart 10). Biden will appear incoherent if he agrees to secure Russo-Iranian trade at the same time as he seeks to cut Russia off from all other trade. Biden may not achieve a reduction in regional tensions through an Iran deal, since Israel insists that it is not bound to the nuclear deal. If Iran does not comply with the nuclear freeze, Israel will ramp up military threats. The Iranians cannot trust American guarantees that the next president, in 2025, will not tear up the nuclear deal and re-impose sanctions on Iran. The Iranians need Russian and Chinese assistance so they cannot afford to embark on a special new relationship with the West. Ultimately the Iranians are highly likely to pursue deliverable nuclear weapons for the sake of regime survival, as our Geopolitical Strategy has argued. Chart 10US-Iran Deal Will Not Be Durable
US-Iran Deal Will Not Be Durable
US-Iran Deal Will Not Be Durable
Thus Biden may choose a deal with Iran but we would not bet on it. Moreover any stop-gap deal will be undermined in practice, so that the investment repercussions will be ephemeral. If Biden fails to clinch his Iran deal as expected, then the world faces an even larger energy shock due to rising tensions in the Middle East. Investment Takeaways The Biden administration’s foreign policy challenges will compound its macroeconomic challenges and weigh on the Democratic Party in the midterm elections. The war in Ukraine will hurt Biden and the Democrats primarily because of the energy shock. The energy shock will get worse if Biden fails to agree to a stop-gap deal with Iran. But we expect either the US or Iran to back out for strategic reasons. With Republicans likely to reclaim Congress this fall, US political polarization will remain at historically high levels over the course of the 2022-24 election cycle. However, Russia’s belligerence underscores our view that rising geopolitical threats will cause the US to unify and reduce polarization over the long run. The war reinforces our US Political Strategy themes of “Peak Polarization” and “Limited Big Government,” as a new bipartisan consensus is forming around the view that the federal government should take a larger role in the economy to address national challenges both at home and abroad. One of our cyclical investment ideas stemming from these themes is to buy cyber-security stocks. President Biden warned US government and corporations on March 21 that Russia could stage cyber attacks against the United States and that private businesses must be prepared. Cyber stocks have suffered amid the general rout in tech stocks but they are starting to recover. Year to date, they are outperforming the S&P 500, and the tech sector, and look to be starting to outperform defensive sectors (Chart 11). Chart 11Biden Warns Of Cyber Attacks
Biden Warns Of Cyber Attacks
Biden Warns Of Cyber Attacks
Matt Gertken Senior Vice President Chief US Political Strategist mattg@bcaresearch.com Footnotes 1 See Yuka Hayashi, “U.S., U.K. Strike Trade Deal to End Tariffs on British Steel and American Whiskey”, Wall Street Journal, March 22, wsj.com 2 See Nancy Youssef and Michael Gordon, “U.S. Sending Soviet Air Defense Systems It Secretly Acquired to Ukraine”, Wall Street Journal, March 21, wsj.com. 3 White House, “Readout of President Joseph R. Biden Jr. Call with President Xi Jinping of the People’s Republic of China,” March 18, 2022, whitehouse.gov. 4 Ayatollah Ali Khamenei implied at his Persian New Year speech that a deal with the Americans could go forward. He emphasized the need to improve the economy and implied that some of the economic burdens will go away starting this year. He pointed to a way forward with US sanctions intact, while also saying that he did not discourage attempts to remove sanctions. “We should not tie the economy to sanctions... It is possible to make economic advances despite U.S. sanctions. It is possible to expand foreign trade, as we did, enter regional agreements and have achievements in oil and other areas … I never say to not go after sanctions relief, but I am asking you to govern the country in a way in which sanctions do not hurt us.” See “Iran's Khamenei Says Economy Should Not Be Tied to U.S. Sanctions,” Reuters, March 21, 2022, usnews.com. Strategic View Open Tactical Positions (0-6 Months) Open Cyclical Recommendations (6-18 Months) Table A2Political Risk Matrix
Biden's Foreign Policy And The Midterms
Biden's Foreign Policy And The Midterms
Table A3US Political Capital Index
Biden's Foreign Policy And The Midterms
Biden's Foreign Policy And The Midterms
Chart A1Presidential Election Model
Biden's Foreign Policy And The Midterms
Biden's Foreign Policy And The Midterms
Chart A2Senate Election Model
Biden's Foreign Policy And The Midterms
Biden's Foreign Policy And The Midterms
Table A4APolitical Capital: White House And Congress
Biden's Foreign Policy And The Midterms
Biden's Foreign Policy And The Midterms
Table A4BPolitical Capital: Household And Business Sentiment
Biden's Foreign Policy And The Midterms
Biden's Foreign Policy And The Midterms
Table A4CPolitical Capital: The Economy And Markets
Biden's Foreign Policy And The Midterms
Biden's Foreign Policy And The Midterms
BCA Research’s US Political Strategy service concludes that the energy and inflation shocks condemn the Democrats to a dismal midterm election showing. The Biden administration’s urgent foreign policy challenges are creating persistent downside risks for…
Today, we are downgrading the S&P restaurants index from overweight to neutral. Currently, the industry faces a trifecta of challenges: Rising input prices, a stronger dollar, and a shift in consumer spending away from discretionary goods and services towards necessities. Chart 1
Chart 1
Chart 1
Rising Input Costs: Soaring food prices and rising wages for the lowest-paid cohort of the US workers is pressuring US restaurants’ bottom line. Restaurants are trying to offset wage pressures by hiking prices with food away from home CPI climbing 2.2 standard deviations away from its five-year average (Chart 1). A mean reversion move is likely coming, meaning that going forward restaurants will have to absorb some of the cost increases, which will damage their bottom line. Stronger USD: The index is dominated by two multinational players, Starbucks (SBUX) and MacDonald’s (MCD), that command a 40% and 30% weight of the industry, respectively. When averaged together, those two companies derive over 45% of sales from abroad compared to 40% for the S&P 500. Stronger dollar dents companies’ profits by making American goods and services more expensive, and because of the accounting translation effect (Chart 2). Making things worse, US restaurants’ withdrawal from Russia to protest the invasion of Ukraine will have an adverse effect on their sales. McDonald’s announced that closing its extensive network of restaurants in Russia will cost it $50 million a day, or 9% of its revenue. Consumer spending is shifting towards necessities: High inflation in general, and rising prices of food and gasoline weigh on consumer spending, forcing many consumers to allocate a higher share of their spending towards necessities (Chart 3). As the US consumer tightens its belt, restaurants and other discretionary spending categories are likely to come under pressure. Chart 2
Chart 2
Chart 2
Chart 3
Chart 3
Chart 3
Bottom Line: We are downgrading the S&P restaurants index from overweight to neutral, booking a loss of 13.5%.
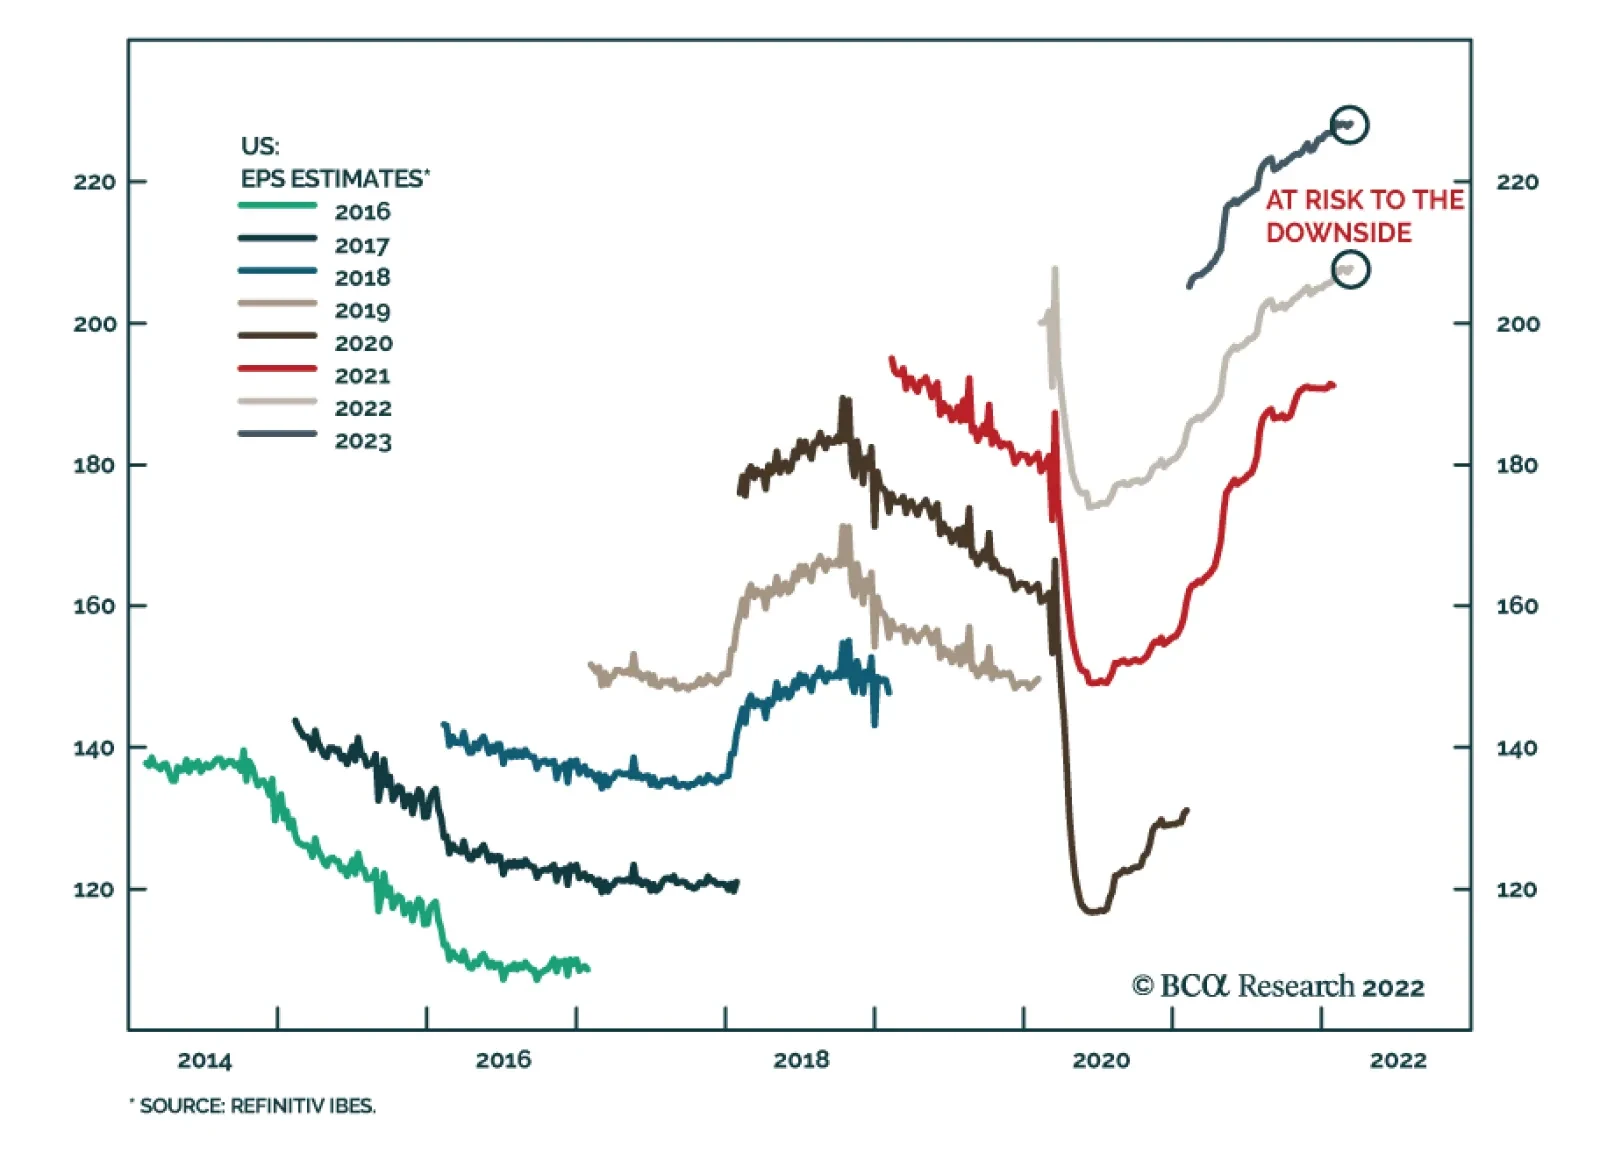
In a recent Insight, we highlighted that US equities remain vulnerable over a tactical horizon. Among the reasons for our US Equity strategists’ cautious near-term stance is that analysts have not yet revised down their earnings expectations. Instead, US…
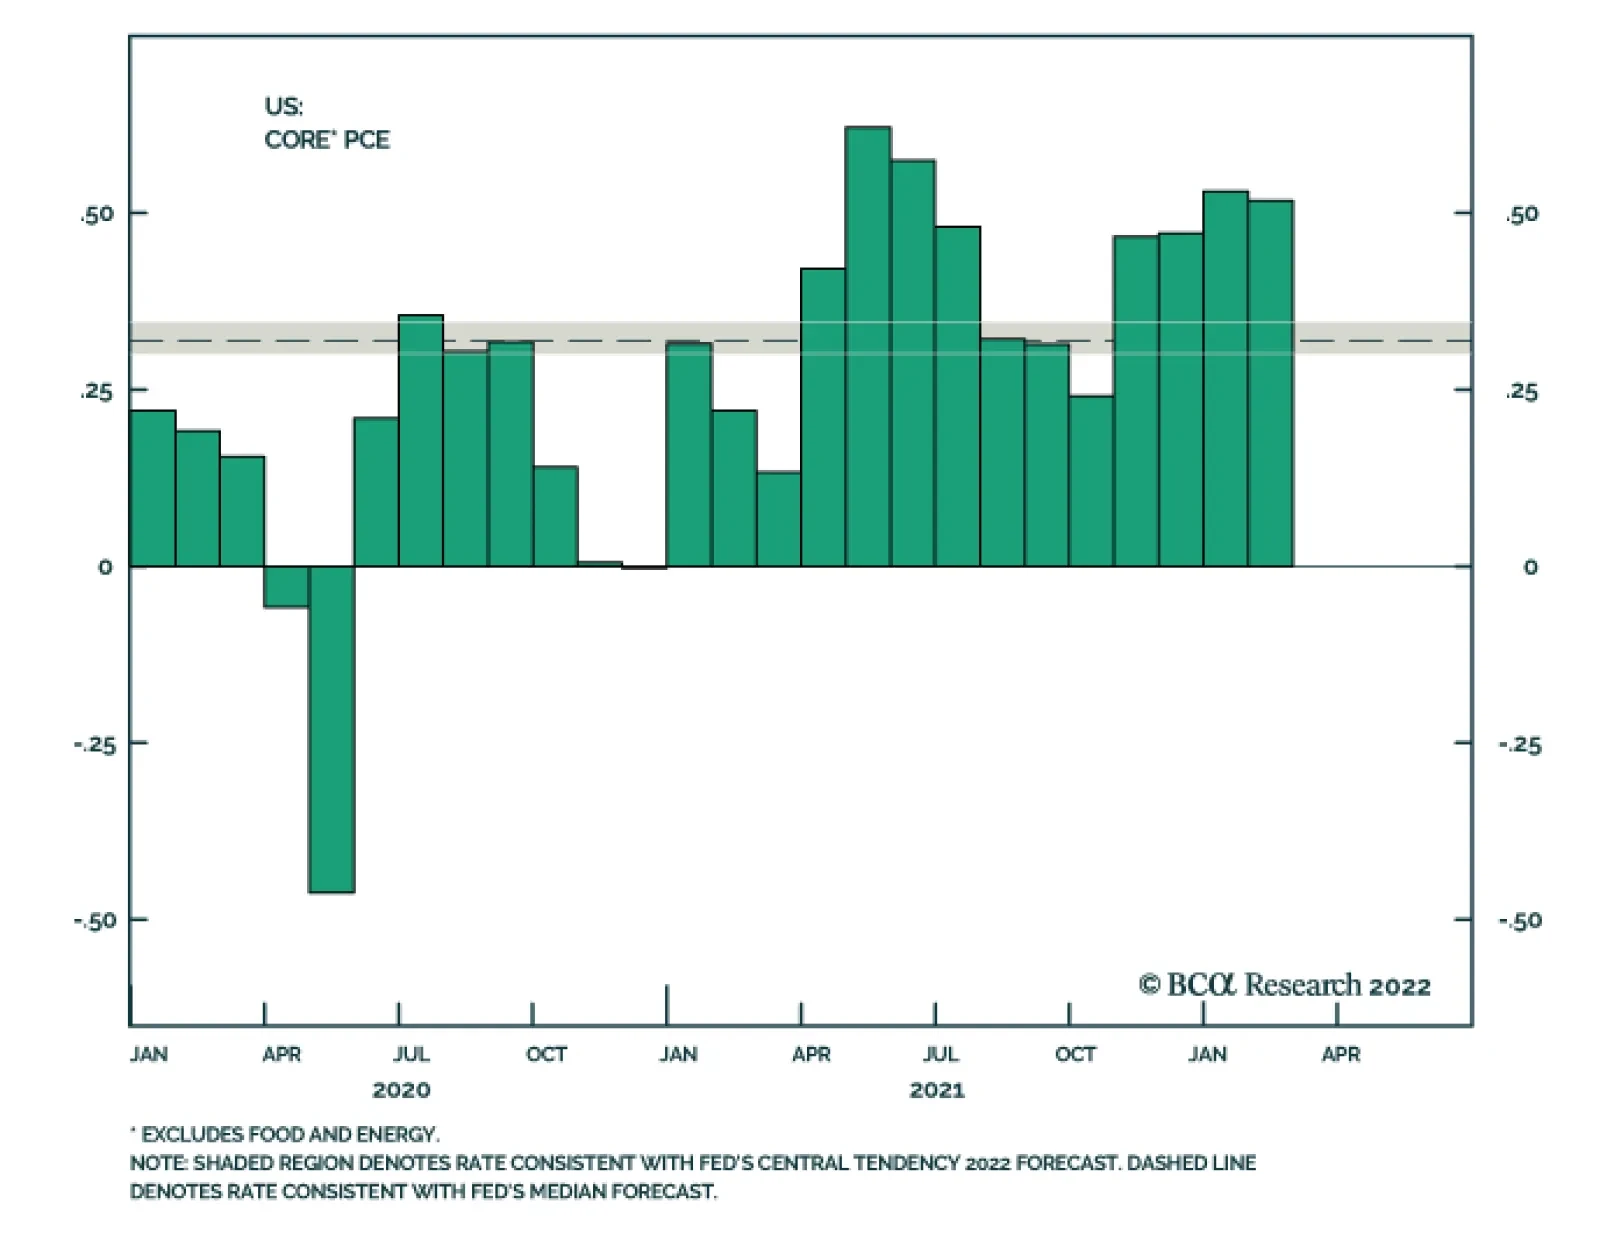
According to BCA Research’s US Bond Strategy service, the Fed will only deliver a 50 bps rate hike if inflation looks to be tracking above the committee’s 2022 forecast or if long-maturity inflation expectations become un-anchored to the upside. On the…