United States

Executive Summary The Market Has Priced An Aggressive Path For US Rate Hikes
The Market Has Priced An Aggressive Path For US Rate Hikes
The Market Has Priced An Aggressive Path For US Rate Hikes
The Federal Reserve has joined other G10 central banks in increasing interest rates this week. However, this has been well priced by both the dollar and short rates in the US (Feature Chart). The key call for currencies therefore is whether the Fed delivers more or less hikes than is currently priced by markets over the course of the next few months. More aggressive rate hikes will boost US bond yields, and send the dollar higher. But it will also undermine US equity multiples, given the tight correlation between the price-to-earnings ratio in the US and the real bond yield. More importantly, US equity market leadership has been an important driver of portfolio inflows into the dollar. Should the Fed deliver less hikes than the aggressive path currently priced by markets, currency investors will also be caught offside. This conundrum puts the DXY at risk. The caveat is that if the US economy is genuinely stronger than the rest of the world, and more insulated from the Russo-Ukrainian conflict, this will warrant higher real US interest rates. We went short NOK/SEK last week given our bias that oil prices had overshot. Tighten stops to protect profits. Bottom Line: Being long the dollar is a consensus trade. While in the near term, this could prove to be the right call, the dollar is also expensive and overbought, which is bearish from a contrarian perspective. Feature The 25 basis point interest rate hike by the Federal Reserve this week has probably been one of the most telegraphed macro events. Interest rate expectations in the US have risen sharply compared to last year (Chart 1). More importantly, as Chart 2 shows, two-year bond yields (a proxy for short rates) have climbed in the US relative to pretty much every other G10 country. Correspondingly, rising interest rate expectations in the US have led to substantial speculative flows into the US dollar. Chart 2The Market Expects The Fed To Hike Faster Than Other Central Banks This Year
The Market Expects The Fed To Hike Faster Than Other Central Banks This Year
The Market Expects The Fed To Hike Faster Than Other Central Banks This Year
Chart 1The Market Has Priced An Aggressive Path For US Rate Hikes
The Market Has Priced An Aggressive Path For US Rate Hikes
The Market Has Priced An Aggressive Path For US Rate Hikes
On the flipside, the outperformance of the US equity market is being threatened by rising interest rates. If rates rise substantially, that could derate US equity multiples, as portfolio inflows are curtailed. US profits also tend to underperform when rates rise. However, if US rates rise by less than what the market expects, net long speculative positioning in the dollar will surely reverse. Non-US Markets Benefit More When Bond Yields Rise Profits tend to drive the equity market over the short run, with valuation starting to matter over longer horizons. When it comes to the US, it is also true that profits tend to underperform the rest of the world as bond yields rise. Why it matters for the dollar is because a better profit picture in the US helps drive portfolio flows into US equities, buffeting the exchange rate (Chart 3). Related Report Global Investment StrategyA Two-Stage Fed Tightening Cycle Chart 4 shows that US profits lag the rest of the world when bond yields are in an uptrend. This is because of the composition of the US equity market. Specifically, the US equity market is underweight financials, energy, materials, and industrials, while overweight information technology, health care, and communication services. Rising inflation benefits commodity-linked sectors, the income statements of which are directly juiced by rising prices. Similarly, banks tend to do better as interest rates rise because net interest margins improve. In a nutshell, rising rates and inflation tend to be better for the profits of value stocks and cyclicals, sectors that are underrepresented in the US. Chart 3The Dollar And US Equities
The Dollar And US Equities
The Dollar And US Equities
Chart 4Bond Yields And US Profits
Bond Yields And US Profits
Bond Yields And US Profits
There is also a valuation angle to higher rates. Because the US market is more overweight sectors with cash flows that backwardated, higher rates will undermine the valuation premium currently commanded by these sectors. This is true both in absolute terms and relative to other markets (Chart 5A and 5B). Chart 5AThe S&P 500 P/E Ratio And Real ##br##Yields
The S&P 500 P/E Ratio And Real Yields
The S&P 500 P/E Ratio And Real Yields
Chart 5BThe Valuation Premium In The US Is Inversely Correlated To Bond Yields
The Valuation Premium In The US Is Inversely Correlated To Bond Yields
The Valuation Premium In The US Is Inversely Correlated To Bond Yields
The key point is that the US equity market is at risk relatively from higher global yields that could undermine relative profit growth and its valuation premium. The US trade deficit currently runs at $90 billion. In 2021, at least 45% of that was financed via foreign equity purchases. A reversal in these flows could undermine the dollar. The Dollar And Relative Interest Rates While portfolio flows into US equities have been reversing, bond inflows have improved (Chart 6). Over the long term, bond flows tend to be the key driver of the US dollar. As Chart 2 shows, most market participants expect the Fed to be among the most hawkish central banks in 2022 and beyond. In fact, December Eurodollar contracts are pricing the Fed to hike interest rates by 218 bps more than the ECB, and 235 bps more than the Bank of Japan (allowing for a small risk premium in this pricing) (Chart 7). Chart 7Investors Are Very Bullish On US Rate Expectations
Investors Are Very Bullish On US Rate Expectations
Investors Are Very Bullish On US Rate Expectations
Chart 6Investors Have Been Aggressively Purchasing US Treasurys
Investors Have Been Aggressively Purchasing US Treasurys
Investors Have Been Aggressively Purchasing US Treasurys
There are two key risks to a hawkish Fed view, relative to other central banks: First, the Fed is already behind the curve relative to its G10 counterparts. The BoE, RBNZ, BoC, and the Norges Bank have already increased rates. Even the rhetoric at the ECB is shifiting. Relative bond yields do not reflect this reality. Second, and related, rising inflation is a global phenomenon and not specific to the US. Almost every central bank is acknowledging that inflation is a key risk to their mandate, compared to the transitory narrative last year. Chart 8 plots headline inflation across G10 countries. On this basis, it becomes difficult to justify why two-year yields in the UK, for example, are much lower, compared to the US. Chart 8Rising Inflation Is Not A US-Centric Problem
Rising Inflation Is Not A US-Centric Problem
Rising Inflation Is Not A US-Centric Problem
If inflation does indeed prove to be sticky, other central banks will have to keep hiking interest rates along with the Fed. If inflation subsides, the Fed might not be as aggressive in tightening policy as the market expects. On a relative basis, this suggests there is a mispricing of how the market views Fed action, relative to other central banks. The key risk to this view is that the US economy can actually withstand much higher rates compared to the rest of the world. While this could be the case, higher rates in Norway and New Zealand are not yet hurting domestic conditions. In fact, it can be argued that weakness in their currencies has unwound a lot of the tightening in financial conditions from higher interest rates. A commodity boom also suggests that these currencies will benefit from rising terms of trade. Conclusion Bond markets have priced higher relative rates in the US, but the Fed could actually lag market expectations, especially relative to commodity-linked currencies (Chart 9). Chart 9Commodity Currencies Have Been Tracking Rate Expectations With A Lag
Commodity Currencies Have Been Tracking Rate Expectations With A Lag
Commodity Currencies Have Been Tracking Rate Expectations With A Lag
Specifically, higher rates than the market expects in the US will undermine US equity market leadership, reversing substantial portfolio inflows in recent years. This is already occurring at the margin. On the other hand, fewer rate hikes will severely unwind speculative inflows into the US dollar. Housekeeping We went short NOK/SEK on the expectation that oil prices had overshot, especially relative to forward markets (Chart 10). We are tightening the stop loss on this trade to 1.09. Finally, the Bank of England met this week and its transcript reinforced our stance that the BoE will be cornered as it attempts to raise rates amidst a slowing economy. Stay long EUR/GBP. Chart 10Stay Short NOK/SEK But Tighten Stops
Stay Short NOK/SEK But Tighten Stops
Stay Short NOK/SEK But Tighten Stops
Chester Ntonifor Foreign Exchange Strategist chestern@bcaresearch.com Trades & Forecasts Strategic View Tactical Holdings (0-6 months) Limit Orders Forecast Summary
Executive Summary Higher Prices Expected
Higher Prices Expected
Higher Prices Expected
Global oil supply will move lower for a few months, until shipping can be re-routed and re-priced in response to sanctions against Russian oil producers and refiners. In the wake of another outbreak of COVID-19 in China, oil demand will likely move marginally lower in the near term. Chinese fiscal stimulus to support demand and Chinese equity markets will be bullish for oil, natgas and metals. Work-arounds by China and India to circumvent Western sanctions likely will keep the hit to Russian oil production contained to March and April. However, longer term – 2024 and beyond – sanctions will put Russia's oil output on a downward trajectory. Saudi Arabia will launch an experiment this year to be paid in yuan for oil exports to China. As a risk-management strategy, KSA needs USD alternatives for storing wealth and retaining access to its foreign reserves, given the success of sanctions in restricting Russia's access to its foreign reserves following its invasion of Ukraine. Our Brent forecast is higher, averaging $93/bbl for this year and in 2023. Bottom Line: We recommend buying the dip in any oil-and-gas equity sell-off. We remain long the XOP ETF. We also remain long the S&P GSCI and COMT ETF – long commodity-index based vehicles that benefit from higher commodity prices and increasing backwardation in these markets, particularly oil. Feature Shipping delays in the wake of sanctions – official and self-imposed – against Russian oil and gas exports will stretch out global hydrocarbon supply chains in 1H22. This will have the effect of reducing actual supply, as these vessels are re-routed, and work-arounds are found to get oil to ports accepting Russian material.1 Related Report Commodity & Energy Strategy2022 Key Views: Past As Prelude For Commodities So far, China and India appear to be moving quickly to develop sanctions work-arounds. Both have long-term trading relationships with Russia, and, in the case of India, the capacity to revive a treaty covering rupee-invoicing of trade in commodities and arms. Estimates of the total hit to Russian oil production resulting from export sanctions imposed by the West following its invasion of Ukraine last month range as high as 5mm b/d in output losses, but we do not share that view.2 There is a strong desire for discounted oil in China and India, and to find alternatives to USD-denominated trade. This has been catalyzed by the sanctions on Russia's central bank and the shutdown of access to its foreign reserves. Payment-messaging systems competitive with the Brussels-based SWIFT network have been stood up already. These will be refined in the wake of the Ukraine war by states with a long-standing desire to diversify payment systems away from the world's reserve currency (i.e., the USD). Among these states, the Kingdom of Saudi Arabia (KSA) is reported to be exploring alternatives for diversifying away from USD-based payment systems, and foreign-reserves custodial relationships dependent on Western central-bank oversight – particularly the US Fed.3 In addition, as ties between China and GCC states have strengthened, the Kingdom might also be looking to diversify its defense partnerships, particularly given the open hostility between the Biden administration in the US and KSA's leadership. Monitoring Chinese state media coverage of this will provide a good indication of the extent of such cooperation. Assessing Highly Uncertain Supply In our base case, Russian output likely falls by ~ 1mm b/d over the March-April period because of shipping delays that force production to be throttled back at the margin due to storage constraints. In its magnitude, this is a similar assumption to the reference case considered by the Oxford Institute for Energy Studies (OIES) but is extended for two months (Table 1).4 We expect shipping delays and payment work-arounds to be sorted out in a couple of months, which, given the incentives of all involved, does not seem unreasonable. Table 1BCA Global Oil Supply - Demand Balances (MMb/d, Base Case Balances) To Dec23
Uncertainty Tightens Oil Supply
Uncertainty Tightens Oil Supply
In our base case modeling, supply changes by core-OPEC 2.0 in 2022 are required to meet physical deficits brought about by less-than-expected volumes returned to the market by the entire coalition from August 2021 to now. This amounts to ~ 1.2mm b/d by our reckoning. For all of 2022, we assume core-OPEC 2.0 will lift supply by 1.3mm b/d, with most of this being provided to markets beginning in May 2022. In 2023, supplies from KSA, UAE and Kuwait are assumed to increase by roughly 0.2mm b/d, led by KSA (Chart 1). This is higher relative to our previous estimates, given our expectation, this core group will have to lift output to compensate not only for reduced Russian output and supply-chain delays this year and next, but falling output within the producer coalition's other non-core states. Outside OPEC 2.0, stronger WTI futures prices in spot markets and along the entire forward curve drive our estimate of US shale output (L48 ex-GoM) to 9.89mm b/d in 2022 (0.86mm b/d above 2021 levels) and 10.58mm b/d in 2023 (0.69mm above our 2022 levels). Supply-chain disruptions and cost inflation showing up in US shale producers' operations likely will dampen output increases.5 For the US, we expect 2022 average US production of 12.1mm b/d, or 900k b/d higher than 2021 output, and 12.8mm b/d in 2023, which is 700k b/d higher than 2022 levels (Chart 2). Chart 1Still Expecting Core-OPEC 2.0 Production Increases
Uncertainty Tightens Oil Supply
Uncertainty Tightens Oil Supply
Chart 2US Oil Output Slightly Higher
US Oil Output Slightly Higher
US Oil Output Slightly Higher
Higher Brent prices will encourage short-term production increases from North Sea producers and others. However, it is not clear whether this will incentivize the years-long projects that will be needed to offset the lack of capex in the sector over the past decade or so. One of our high-conviction views resulting from the dearth of capex in oil and gas production is increasingly tighter markets by mid-decade – likely apparent by 2024 – which will require higher prices to reverse the lack of investment in new production. In line with our House view, we are not restoring the return of up to 1.3mm b/d of Iranian production to markets, given the guidance from this source proved unreliable earlier this month when it suspended talks with the US on its nuclear deal. We also are not assuming ceasefire talks between Ukraine and Russia will end to the Ukraine war, given the unreliability of the source (Russia) in these reports. Softer Demand Near Term Over the next few months, we expect the recent upsurge in COVID-19 cases in China to reduce Asian demand, but not tank it relative to our existing assumptions.6 Even though this was expected in our balances estimates, we are reducing our 2Q22 demand estimate by an additional 250k b/d, which is split evenly between DM and EM economies. This reflects the direct short-term hit to EM demand from China's lockdowns and a stronger USD, which raises the local-currency costs of oil, as well as the knock-on effects of additional supply-chain disruptions. Global consumption for 2022 is expected to be 4.4mm b/d higher on average vs 2021 levels, coming in at 101.54mm b/d, and 1.7mm b/d higher in 2023 vs. 2022 levels. We expect the Russian sanctions work-arounds being pursued by China and India – together accounting for a bit more than 20% of global oil demand – will be effective and will put overall EM demand back on trend in 2H22, assuming China's COVID-19 outbreak is brought under control (Chart 3). Chart 3COVID-19 Hits China Demand, But Does Not Tank EM Overall
COVID-19 Hits China Demand, But Does Not Tank EM Overall
COVID-19 Hits China Demand, But Does Not Tank EM Overall
While markets remain highly fluid – subject to sharp changes in perceptions of fundaments and their trajectories – these supply-demand estimates continue to point to relatively a balanced market this year and next (Chart 4). That said, the supply-demand fundamentals still leave inventories extremely tight, which means they will provide limited buffering against sudden shifts in supply, demand or both (Chart 5). This will, in our estimation, keep forward curves backwardated, which will support our long-term positions in long commodity-index exposure (i.e., the S&P GSCI and the COMT ETF). Chart 4Markets Remain Balanced...
Markets Remain Balanced...
Markets Remain Balanced...
Chart 5...And Inventories Remain Tight
...And Inventories Remain Tight
...And Inventories Remain Tight
Our base-case balances estimates translate into a 2022 Brent price forecast that averages $93/bbl, and a 2023 average estimate of $93/bbl, which are lower than our previous forecasts of $94/bbl and $98/bbl, respectively. For 1Q22, we now expect prices to average $98/bbl; 2Q22 to average $98.25/bbl; 3Q22 $88.45/bbl; and 4Q22 $87.30/bbl. Risks To Our View The supply side of our modeling remains exposed to exogenous political risks, chiefly: A failure on the part of core-OPEC 2.0 to increase production to offset lower-than-expected output outside the coalition's core; Lower-than-expected US oil output, given stronger-than-expected production discipline; and A return of up to 1.3mm b/d of Iranian barrels, which we no longer are assuming in our balances. We continue to believe core-OPEC 2.0 will increase production because it is in their interest not to allow inventory depletion to accelerate and for prices to move higher faster. The local-currency cost of oil in EM economies – the growth engine for oil demand – is high and going higher. In real terms – i.e., inflation-adjusted terms – it is even higher, as the real effective USD trade-weighted FX rate exceeds that of the nominal rate (Chart 6). This can be seen in the local-currency costs of oil in the world's largest consumers (Chart 7). We expect an announcement from core-OPEC 2.0 by the end of this month regarding a production increase. Chart 6High Real USD FX Rates Increase Local Oil Costs
Uncertainty Tightens Oil Supply
Uncertainty Tightens Oil Supply
Chart 7Local-Currency Oil Costs In Large Consuming States
Local-Currency Oil Costs In Large Consuming States
Local-Currency Oil Costs In Large Consuming States
Of course, KSA's diversification to USD alternatives as a risk-management strategy makes it less certain it will lead an output increase in exchange for an increased US commitment to its defense. Regarding US shale output, producers remain disciplined in their capital allocation. Even though we expect higher prices across the WTI forward curve will incentivize additional production, we could be over-estimating the extent of this increase in our modeling. Lastly, as noted above, Iran and Russia are indicating their trade concerns have been addressed by the US, which presumably will presumably will be followed by the return up to 1.3mm b/d of production to export markets. However, forward guidance from these producers has not been particularly reliable, and we could be wrong here as well. This would be a bearish fundamental on the supply side, which would pressure prices lower. Investment Implications Given the breakdown in talks between the US and Iran – presumably under pressure from Russia for guarantees the US would not sanction its trade with Iran – our Brent price forecast remains above $90/bbl (Chart 8). We expect the near-term price increase will dissipate as the sanctions work-arounds – particularly by China and India – re-route oil flows. Core OPEC 2.0 producers – KSA, the UAE and Kuwait – have sufficient surplus capacity to increase production to allow refiners to re-build inventories. This big question for markets now is will they bring it to market in the near term? KSA's interest in exploring yuan-linked oil trade with China adds an element of uncertainty to whether production will be increased. Perhaps that is a goal of this exercise: The US is being shown there are alternatives available to large oil exporters re terms of trade and providers of defense services. Chart 8Higher Prices Expected
Higher Prices Expected
Higher Prices Expected
There is sufficient spare capacity available at present to address the current physical deficits in global markets. Our analysis indicates markets are balanced but still tight, as can be seen in current and expected inventory levels. We remain long the XOP ETF and the S&P GSCI and COMT ETF. The latter ETFs provide long commodity-index based exposure that benefits from higher commodity prices and increasing backwardation in commodity markets generally, particularly oil. Robert P. Ryan Chief Commodity & Energy Strategist rryan@bcaresearch.com Ashwin Shyam Research Associate Commodity & Energy Strategy ashwin.shyam@bcaresearch.com Commodities Round-Up Precious Metals: Bullish Markets expected the Federal Reserve's rate hike of 25 basis points in the March and was not disappointed. Further rate hikes this year will occur against the backdrop of high geopolitical uncertainty and inflation, both of which are bullish for gold. The Russia-Ukraine crisis has added a new layer of complexity, and the Fed will need to proceed with caution to curb inflation but not over-tighten the economy. Footnotes 1 Please see All at sea: Russian-linked oil tanker seeks a port, published by straitstimes.com on March 10, 2022 for examples of shipping delays. 2 Please see Could Russia Look to China to Export More Oil and Natural Gas? published by naturalgasintell.com on March 9, and India says it’s in talks with Russia about increasing oil imports., published on March 15, for additional reporting. See also Besides China, Putin Has Another Potential De-dollarization Partner in Asia published by cfr.org, which discusses India-Russia trade agreements between 1953-92 with the signing of the 1953 Indo-Soviet Trade Agreement. 3 Please see Saudi considering China’s yuan for oil purchases published by al-monitor.com on March 16. 4 Please see the OIES Oil Monthly published on March 14. 5 Oil producers in a ‘dire situation’ and unable to ramp up output, says Oxy CEO published on March 8 by cnbc.com. 6 A resurgence of COVID-19 in China was not unexpected. It was one of our key views going into 2022. Please see 2022 Key Views: Past As Prelude For Commodities, which we published on December 16, 2021. In that report, we noted, "… China still is operating under a zero-tolerance COVID-19 policy, and has relied on less efficacious vaccines that appear to offer no protection against the omicron variant of the coronavirus. This also is a risk for EM economies that rely on these vaccines. However, the roll-out of mRNA vaccines globally via joint ventures will be gathering steam in 2H22, which is bullish for commodity demand." We continue to expect Chinese authorities to deploy mRNA vaccines or antivirals to combat this outbreak. Investment Views and Themes Strategic Recommendations Trades Closed in 2021
Image
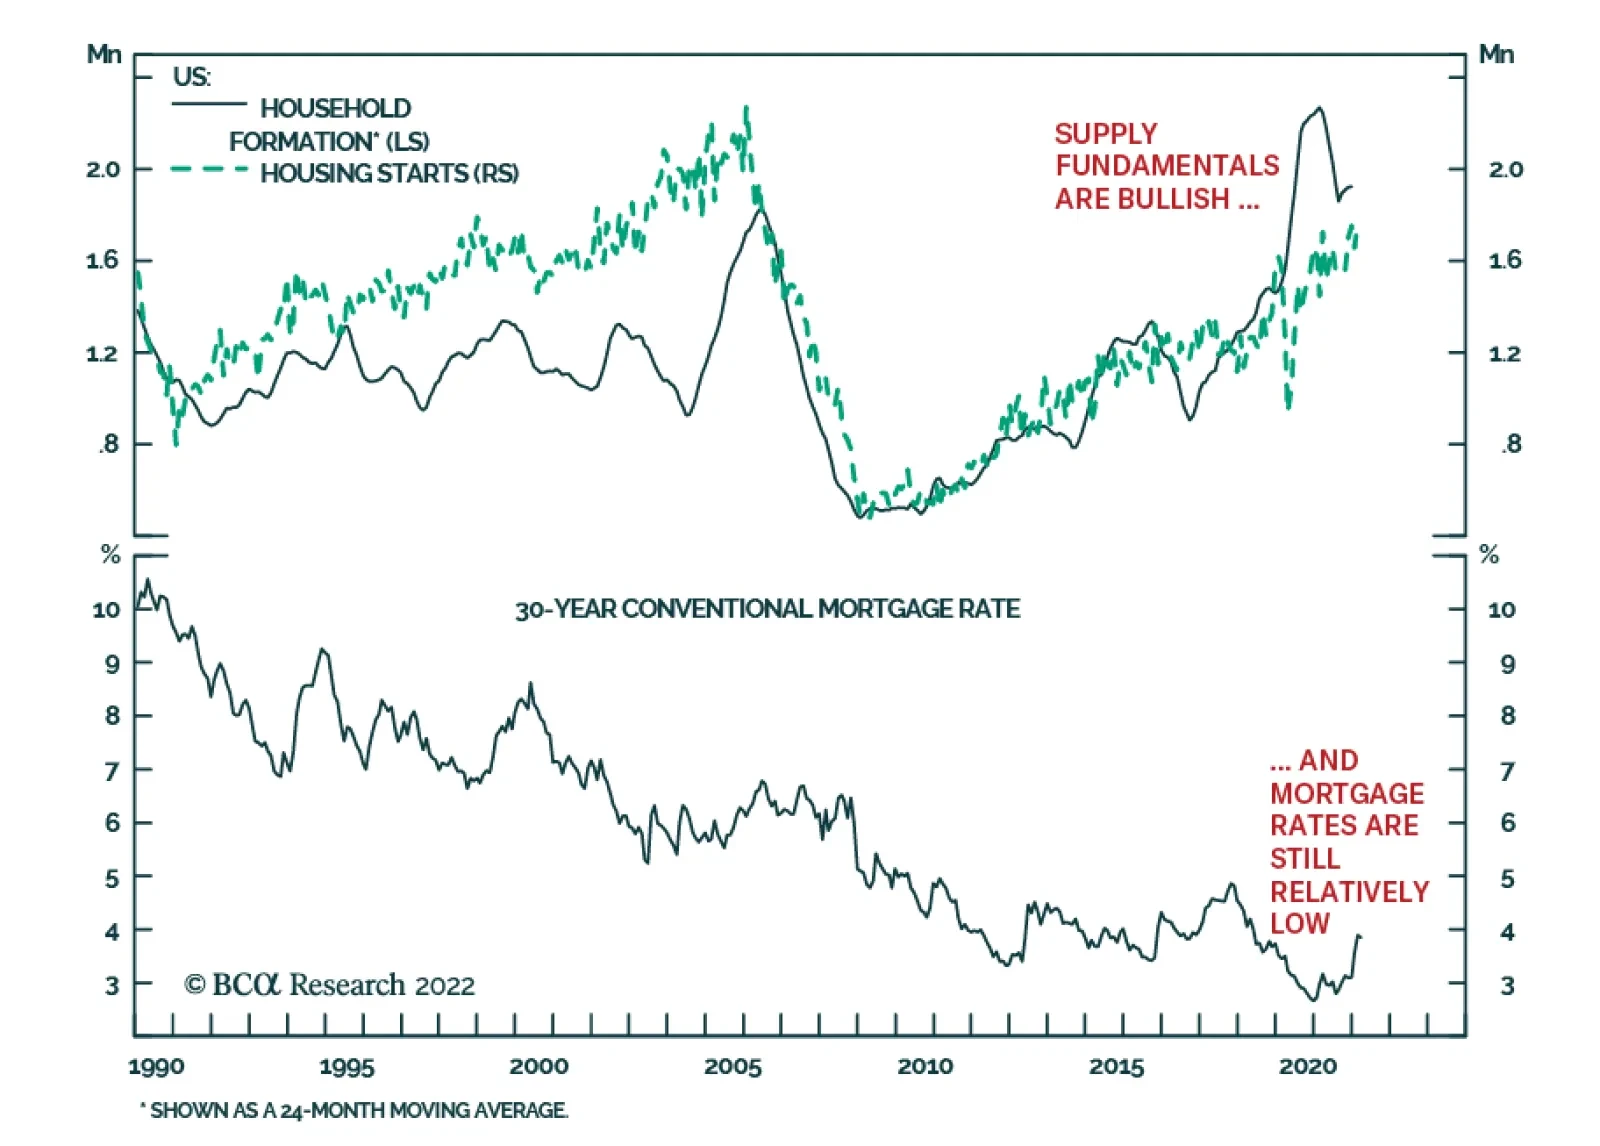
US housing data released on Thursday sent a positive signal about the sector’s ability to withstand higher interest rates. Housing starts rose by 6.8% m/m in February which beat expectations of a 3.8% m/m increase. At 1.769 thousand, housing starts are now…
Executive Summary For the Fed, maintaining its credibility with a long sequence of rate hikes that does not crash the economy, real estate market, and stock market is akin to the ‘Hail Mary’ move of (American) football. The likelihood that the Fed completes the straight sequence of eight rate hikes which the market is now pricing seems very low. Hence, today we are opening a new trade. Go long the September 2023 Eurodollar futures contract. Additionally, stay underweight Treasury Inflation Protected Securities (TIPS) versus T-bonds. And on a 12-month horizon, underweight the commodity complex, whose elevated prices are highly vulnerable to a near-certain upcoming demand destruction. Fractal trading watchlist: US interest rate futures, 3-year T-bond, Canada versus Japan, AUD/KRW, and EUR/CHF. Spending On Goods Looks Like An Earthquake On A Seismograph
Spending On Goods Looks Like An Earthquake On A Seismograph
Spending On Goods Looks Like An Earthquake On A Seismograph
Bottom Line: The likelihood that the Fed completes the straight sequence of eight rate hikes which the market is now pricing seems very low. Feature Amid the uncertainties of the Ukraine crisis, there is one certainty. The latest surge in energy and grain prices is a classic supply shock. Prices have spiked because vital supplies of Russian and Ukrainian energy and grains have been cut. This matters for central banks, because to the extent that they can bring down inflation, they can do so by depressing demand. They can do nothing to boost supply. In fact, depressing demand during a supply shock is a sure way to start a recession. But what about the inflation that came before the Ukraine crisis, wasn’t that due to excess demand? No, that inflation came not from a demand shock, but from a displacement of demand shock – as consumers displaced their firepower from services to goods on a massive scale. This matters because central banks are also ill placed to fix such a misallocation of demand. Chart I-1 looks like a seismograph after a huge earthquake, and in a sense that is exactly what it is. The chart shows the growth in spending on durable goods, which has just suffered an earthquake unlike any in history. Zooming in, we can see the clear causality between the surges in spending on durables and the surges in core inflation. The important corollary being that when the binge on durables ends – as it surely must – or worse, when durable spending goes into recession, inflation will plummet (Chart I-2). Chart I-1Spending On Goods Looks Like An Earthquake On A Seismograph
Spending On Goods Looks Like An Earthquake On A Seismograph
Spending On Goods Looks Like An Earthquake On A Seismograph
Chart I-2The Goods Binges Caused The Core Inflation Spikes
The Goods Binges Caused The Core Inflation Spikes
The Goods Binges Caused The Core Inflation Spikes
But, argue the detractors, what about the uncomfortably high price inflation in services? What about the uncomfortably high inflation expectations? Most worrying, what about the recent surge in wage inflation? Let’s address these questions. Underlying US Inflation Is Running At Around 3 Percent In the US, the dominant component of services inflation is housing rent, which comprises 40 percent of the core consumer price index. Housing rent combines actual rent for those that rent their home, with the near-identically behaving owners’ equivalent rent (OER) for those that own their home. Given the state of the jobs market, there is nothing unusual in the current level of rent inflation. Housing rent inflation closely tracks the tightness of the jobs market, because you need a job to pay the rent. With the unemployment rate today at the same low as it was in 2006, rent inflation is at the same high as it was in 2006: 4.3 percent. In other words, given the state of the jobs market, there is nothing unusual in the current level of rent inflation (Chart I-3). Chart I-3Given The Jobs Market, Rent Inflation Is Where It Should Be
Given The Jobs Market, Rent Inflation Is Where It Should Be
Given The Jobs Market, Rent Inflation Is Where It Should Be
Given its dominance in core inflation, rent inflation running at 4.3 percent would usually be associated with core inflation running at around 3 percent – modestly above the Fed’s target, rather than the current 6.5 percent (Chart I-4). Confirming that it is the outsized displacement of spending into goods, and its associated inflation, that is giving the Fed and other central banks a massive headache. Yet, to repeat, monetary policy is ill placed to fix such a misallocation of demand. Chart I-4Given Rent Inflation, Core Inflation Should Be 3 Percent
Given Rent Inflation, Core Inflation Should Be 3 Percent
Given Rent Inflation, Core Inflation Should Be 3 Percent
Still, what about the surging expectations for inflation? Many people believe that these are an independent and forward-looking assessment of how inflation will evolve. Yet nothing could be further from the truth. The bond market’s expected inflation is just the result of an algorithm that uses historic inflation. And at that, an extremely short period of historic inflation, just six months.1 The upshot is that when the backward-looking six month inflation rate is low, like it was in the depths of the global financial crisis in late 2008 or the pandemic recession in early 2020, the market assumes that the forward-looking ten year inflation rate will be low. And when the backward-looking six-month inflation rate is high, like early-2008 or now, the bond market assumes that the forward-looking ten year inflation rate will be high. In other words: Inflation expectations are nothing more than a reflection of the last six months’ inflation rate (Chart I-5). Chart I-5Inflation Expectations Are Just A Reflection Of The Last Six Months' Inflation Rate
Inflation Expectations Are Just A Reflection Of The Last Six Months' Inflation Rate
Inflation Expectations Are Just A Reflection Of The Last Six Months' Inflation Rate
Turning to wage inflation, with US average hourly earnings inflation running close to 6 percent, it would appear to be game, set, and match to ‘Team Inflation.’ Except that this is a flawed argument. To the extent that wages contribute to inflation, it must come from the inflation in unit labour costs, meaning the ratio of hourly compensation to labour productivity. After all, if you get paid 6 percent more but produce 6 percent more, then it is not inflationary (Chart I-6). Chart I-6If You Get Paid 6 Percent More But Produce 6 Percent More, Then It Is Not Inflationary
If You Get Paid 6 Percent More But Produce 6 Percent More, Then It Is Not Inflationary
If You Get Paid 6 Percent More But Produce 6 Percent More, Then It Is Not Inflationary
In this regard, US unit labour costs increased by 3.5 percent through 2021, and slowed to just a 0.9 percent (annualised) increase in the fourth quarter.2 Still, 3.5 percent, and slowing, is modestly above the Fed’s inflation target, and could justify a slight nudging up of the Fed funds rate. But it could not justify the straight sequence of eight rate hikes which the market is now pricing. The Fed Is Praying For A ‘Hail Mary’ Fortunately, the bond market understands all of this. How else could you say 7 percent inflation and 2 percent long bond yield in the same breath?! This is crucial, because it is the long bond yield that drives rate-sensitive parts of the economy, such as housing and construction. And it is the long bond yield that sets the level of all asset prices, including real estate and stocks. Although the Fed cannot admit it, the central bank also understands all of this and hopes that the bond market continues to ‘get it.’ Meaning that it hopes that the long end of the interest rate curve does not lift too far and crash the economy, real estate market, and stock market. So why is the Fed hiking the policy interest rate? The answer is that there will be a time in the future when it does need to lift the entire interest rate curve, and for that it will need its credibility intact. Not hiking now could potentially shred the credibility that is the lifeblood of any central bank. Still, to maintain its credibility without crashing the economy the Fed will have to make the ‘Hail Mary’ move of (American) football. For our non-American readers, the Hail Mary is a high-risk desperate move with little hope of completion. Go long the September 2023 Eurodollar futures contract. To sum up, the likelihood that the Fed completes the straight sequence of eight rate hikes which the market is now pricing seems very low. Hence, today we are opening a new trade. Go long the September 2023 Eurodollar futures contract (Chart I-7). Chart I-7The Likelihood That The Fed Completes A Straight Sequence Of Eight Rate Hikes Seems Low
The Likelihood That The Fed Completes A Straight Sequence Of Eight Rate Hikes Seems Low
The Likelihood That The Fed Completes A Straight Sequence Of Eight Rate Hikes Seems Low
Additionally, stay underweight Treasury Inflation Protected Securities (TIPS) versus T-bonds (Chart I-8). Chart I-8Underweight TIPS Versus T-Bonds
Underweight TIPS Versus T-Bonds
Underweight TIPS Versus T-Bonds
And on a 12-month horizon, underweight the commodity complex, whose elevated prices are highly vulnerable to a near-certain upcoming demand destruction. Fractal Trading Watchlist Confirming the fundamental analysis in the preceding sections, the strong trend in both the 18 month out US interest rate future and the equivalent 3 year T-bond has reached the point of fragility that has identified previous turning-points in 2018 and 2021 (Chart I-9 and Chart I-10). This week we are also adding to our watchlist the commodity plays Canada versus Japan and AUD/KRW, whose outperformances are vulnerable to reversal. From next week you will be able to see the full watchlist of investments that are vulnerable to reversal on our website. Stay tuned. Finally, the underperformance of EUR/CHF has reached the point of fragility on its 260-day fractal structure that has identified the previous major turning-points in 2018 and 2020 (Chart I-11). Accordingly, this week’s recommended trade is long EUR/CHF, setting a profit target and symmetrical stop-loss at 3.6 percent. Chart I-9The Strong Trend In The 18-Month-Out US Interest Rate Future Is Fragile
The Strong Trend In The 18-Month-Out US Interest Rate Future Is Fragile
The Strong Trend In The 18-Month-Out US Interest Rate Future Is Fragile
Chart I-10The Strong Trend In The 3 Year T-Bond Is Fragile
The Strong Trend In The 3 Year T-Bond Is Fragile
The Strong Trend In The 3 Year T-Bond Is Fragile
Chart I-11Go Long EUR/CHF
Go Long EUR/CHF
Go Long EUR/CHF
Canada Versus Japan Is Vulnerable To Reversal
Canada Versus Japan Is Vulnerable To Reversal
Canada Versus Japan Is Vulnerable To Reversal
AUD/KRW Is Vulnerable To Reversal
AUD/KRW Is Vulnerable To Reversal
AUD/KRW Is Vulnerable To Reversal
Dhaval Joshi Chief Strategist dhaval@bcaresearch.com Footnotes 1 The expected 10-year inflation rate = (deviation of 6-month annualized inflation from 1.6)*0.2 + 1.6. 2 Source: Bureau of Labor Statistics Fractal Trading System Fractal Trades
The Fed Needs A ‘Hail Mary’ To Maintain Credibility Without Crashing The Economy
The Fed Needs A ‘Hail Mary’ To Maintain Credibility Without Crashing The Economy
The Fed Needs A ‘Hail Mary’ To Maintain Credibility Without Crashing The Economy
The Fed Needs A ‘Hail Mary’ To Maintain Credibility Without Crashing The Economy
6-Month Recommendations Structural Recommendations Closed Fractal Trades Indicators To Watch - Bond Yields Chart II-1Indicators To Watch - Bond Yields - Euro Area
Indicators To Watch - Bond Yields - Euro Area
Indicators To Watch - Bond Yields - Euro Area
Chart II-2Indicators To Watch - Bond Yields - Europe Ex Euro Area
Indicators To Watch - Bond Yields - Europe Ex Euro Area
Indicators To Watch - Bond Yields - Europe Ex Euro Area
Chart II-3Indicators To Watch - Bond Yields - Asia
Indicators To Watch - Bond Yields - Asia
Indicators To Watch - Bond Yields - Asia
Chart II-4Indicators To Watch - Bond Yields - Other Developed
Indicators To Watch - Bond Yields - Other Developed
Indicators To Watch - Bond Yields - Other Developed
Indicators To Watch - Interest Rate Expectations Chart II-5Indicators To Watch - Interest Rate Expectations
Indicators To Watch - Interest Rate Expectations
Indicators To Watch - Interest Rate Expectations
Chart II-6Indicators To Watch - Interest Rate Expectations
Indicators To Watch - Interest Rate Expectations
Indicators To Watch - Interest Rate Expectations
Chart II-7Indicators To Watch - Interest Rate Expectations
Indicators To Watch - Interest Rate Expectations
Indicators To Watch - Interest Rate Expectations
Chart II-8Indicators To Watch - Interest Rate Expectations
Indicators To Watch - Interest Rate Expectations
Indicators To Watch - Interest Rate Expectations
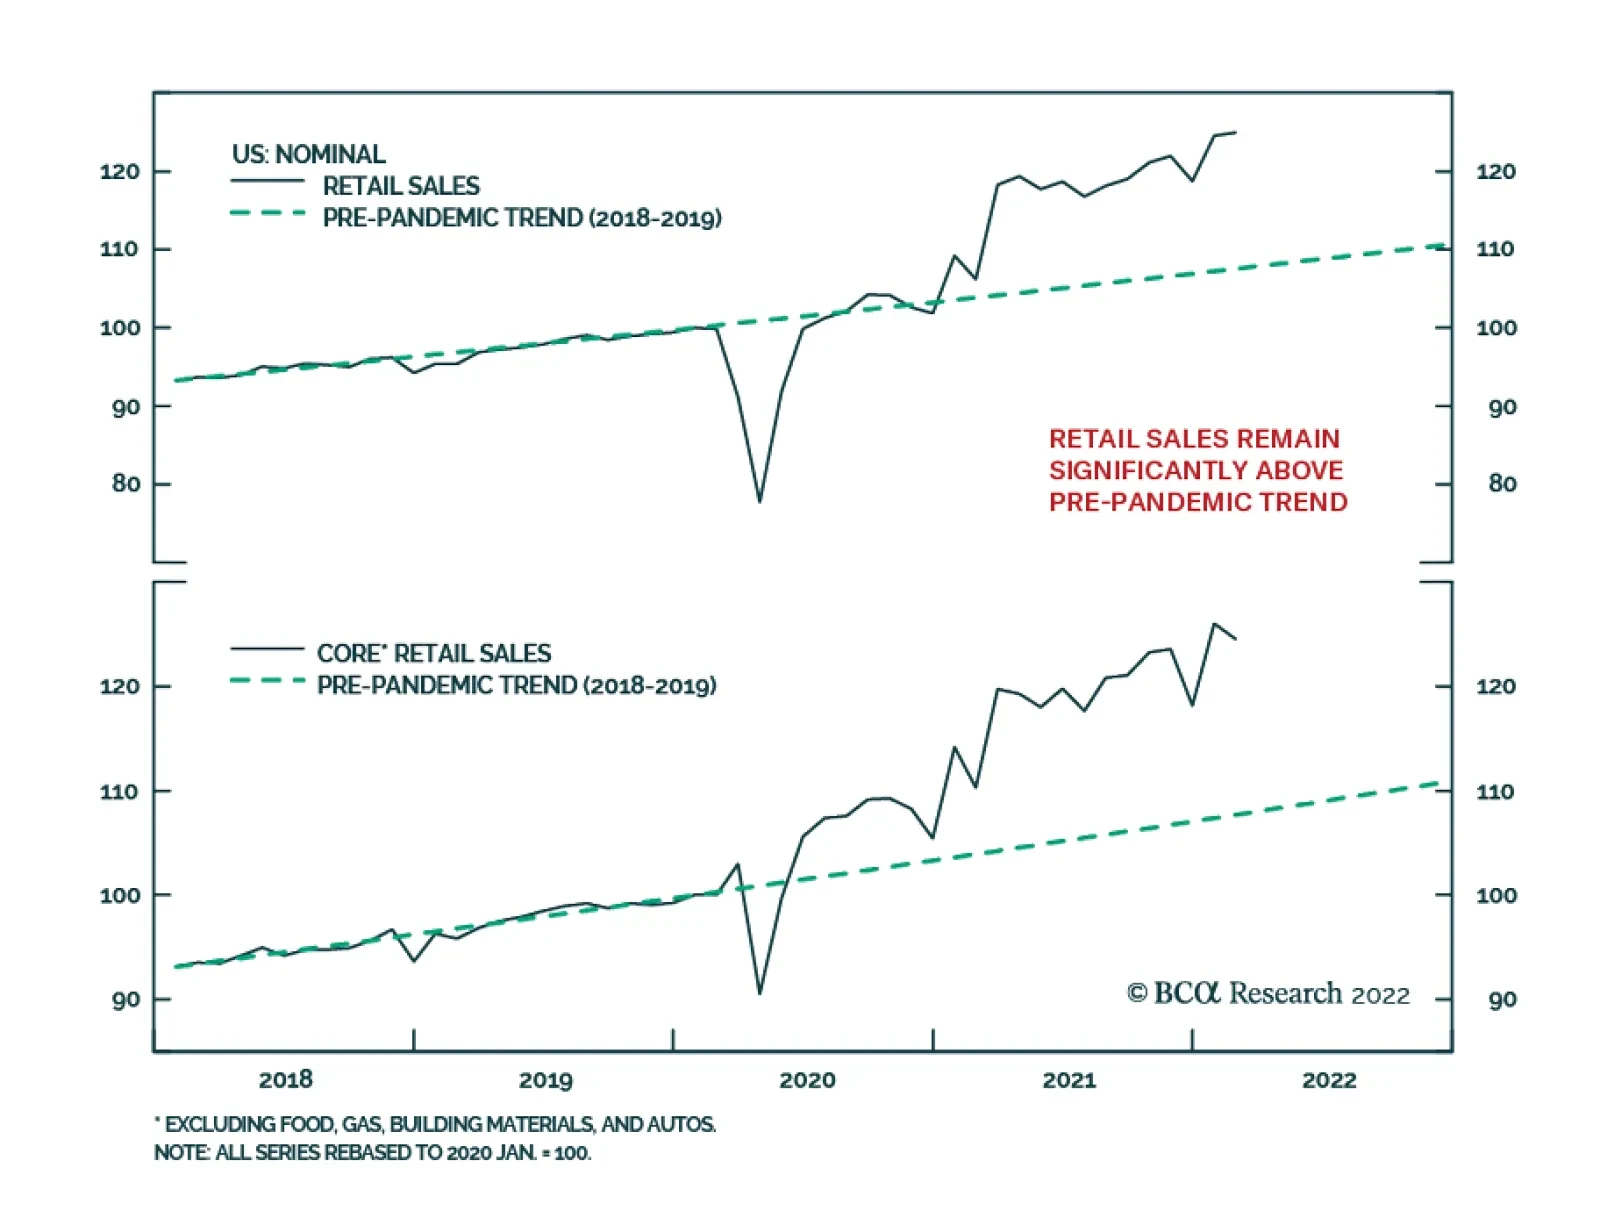
The US retail sales report for February was mixed. On the one hand, the 0.3% m/m increase in US retail sales in February was broadly in line with expectations of 0.4% m/m. Moreover, January growth rates for overall retail sales as well as other measures…
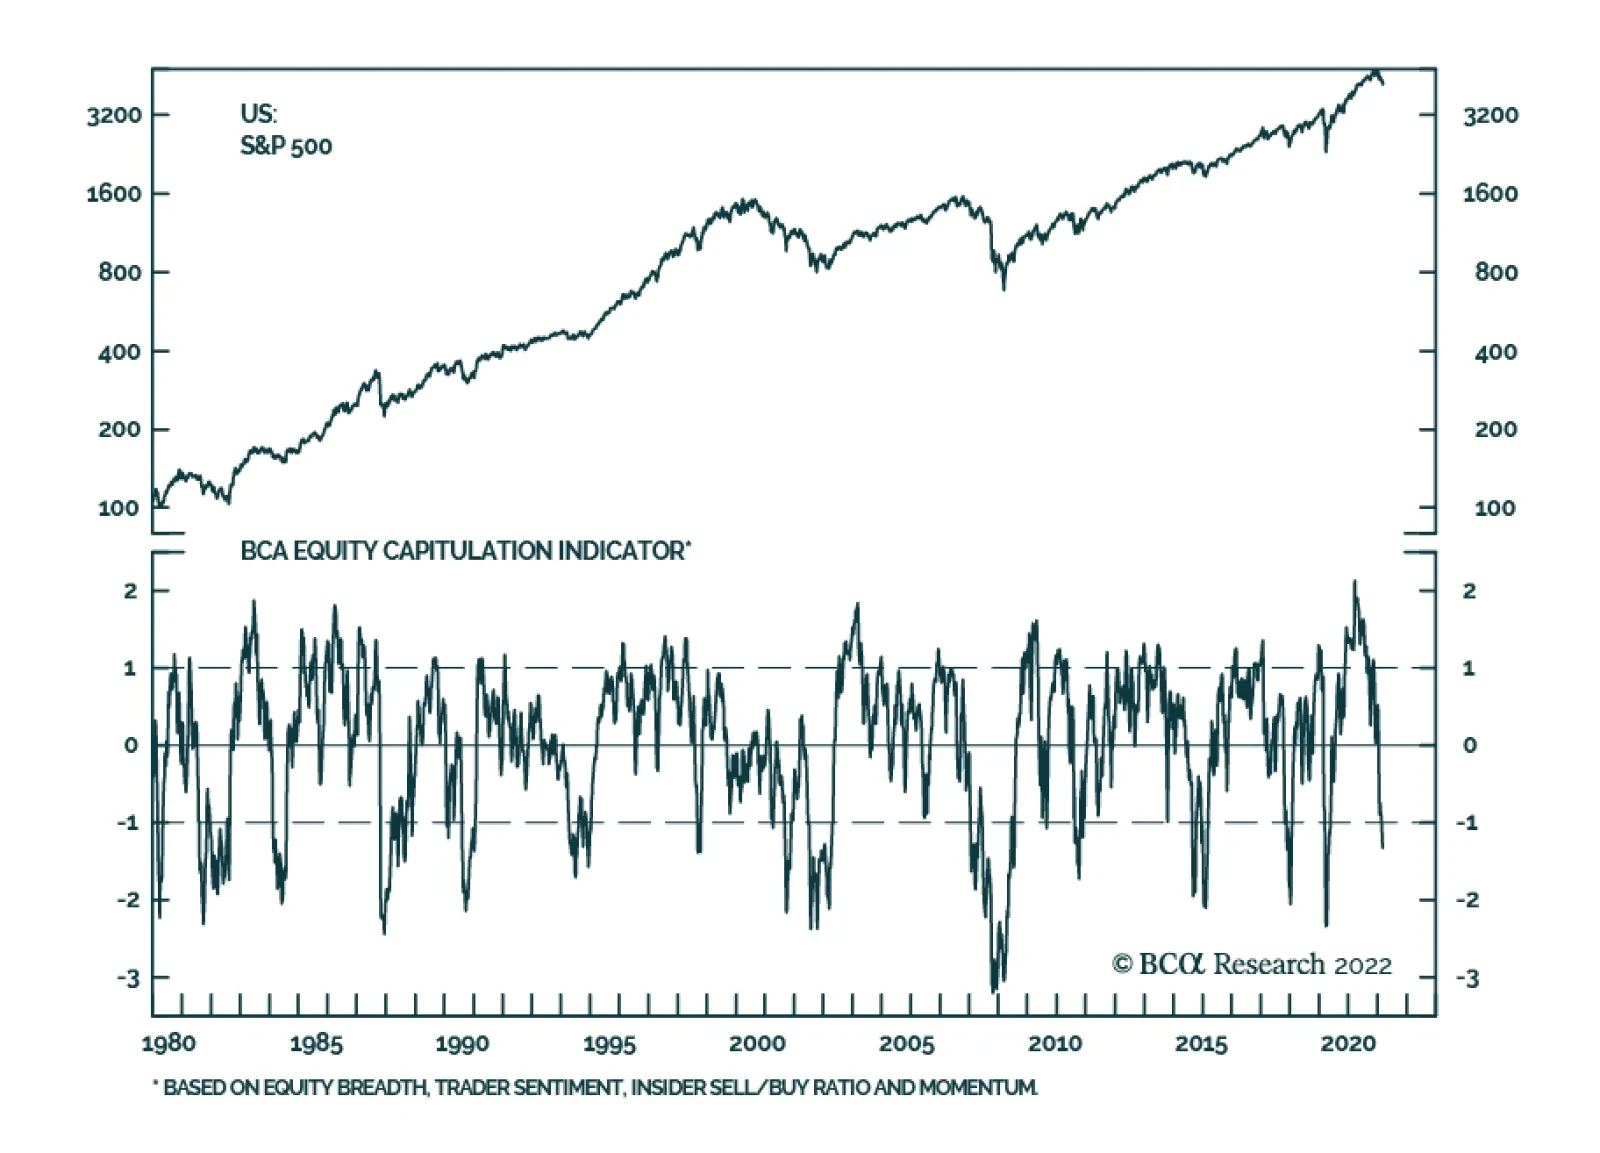
The US stock market has had a rough start to 2022. At its lowest point on March 8, the S&P 500 was down 12.5% year-to-date. It has since recovered slightly, and is up 4.5% since then. Meanwhile, the BCA Equity Capitulation Index – which is based on equity…
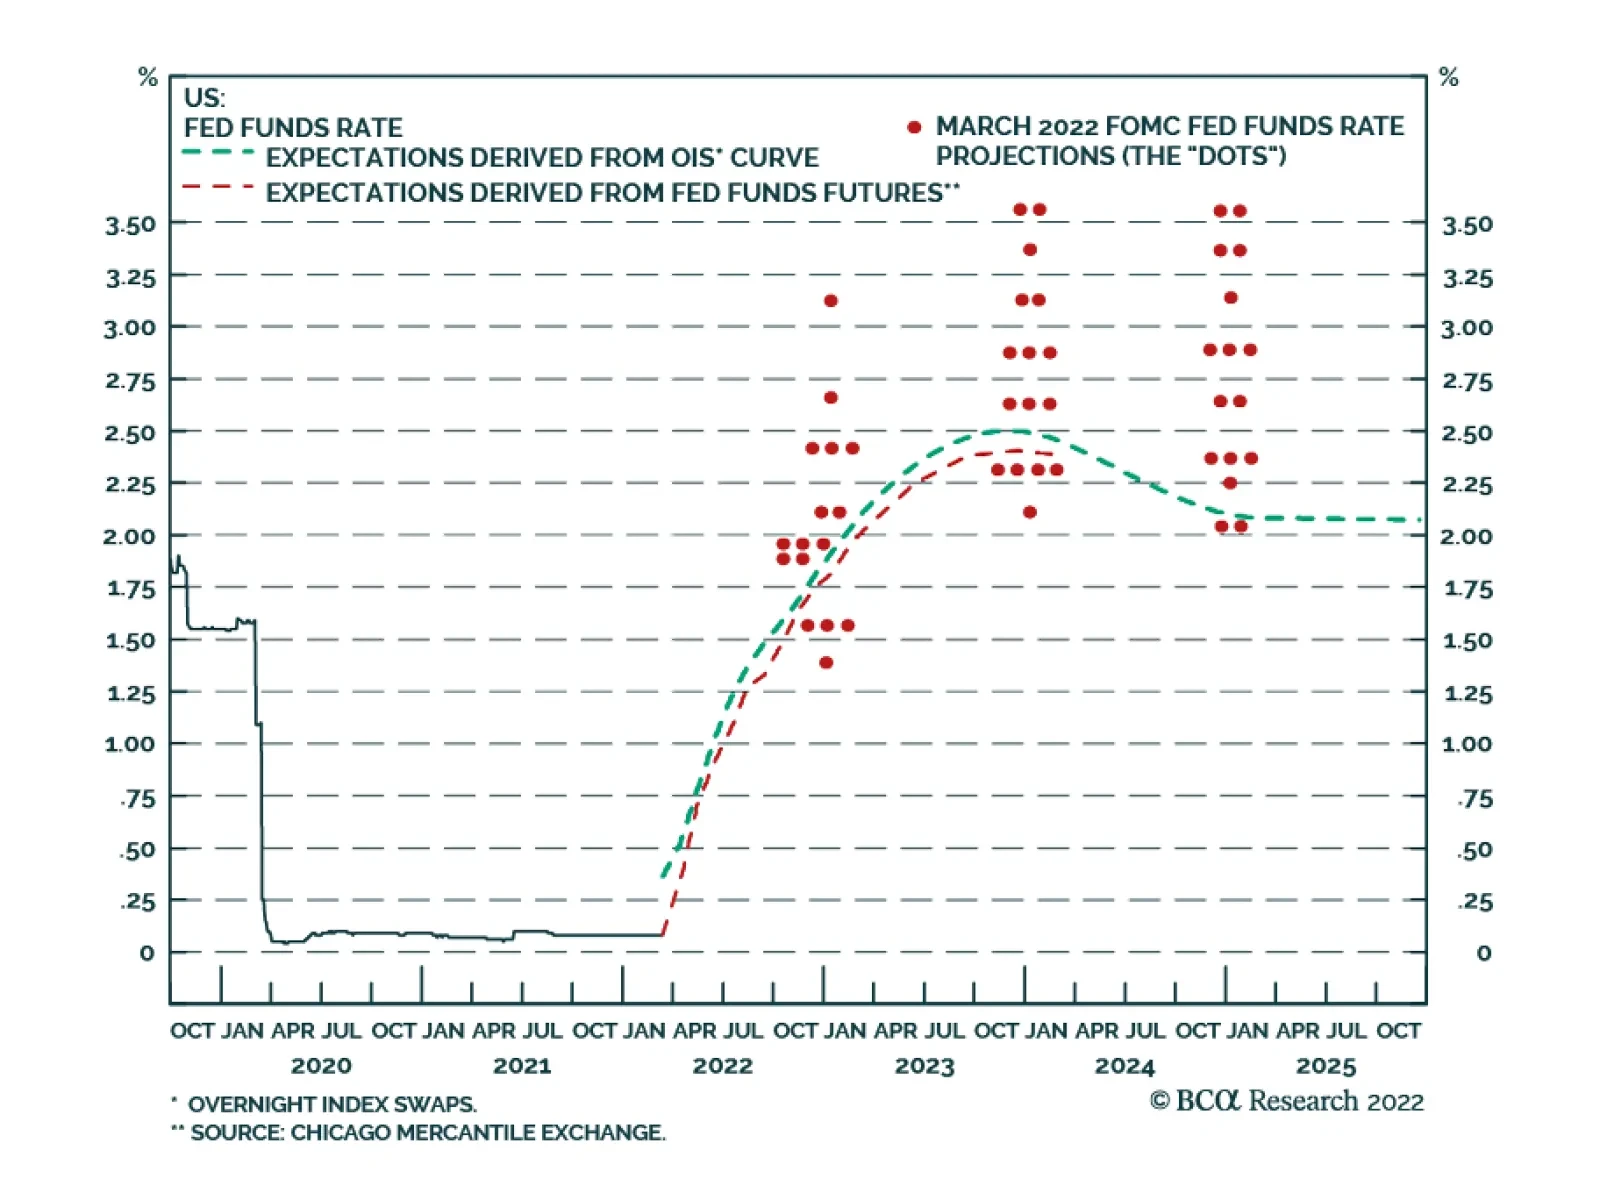
As expected, the Fed raised interest rates by 25bps on Wednesday. The sole dissenting vote came from St. Louis Fed President James Bullard who favored a 50bps hike. Fed Chair Jerome Powell reiterated that policymakers will be nimble and respond to incoming…
Executive Summary Global Oil Price Pushes Up Inflation Expectations
Global Oil Price Pushes Up Inflation Expectations
Global Oil Price Pushes Up Inflation Expectations
The US cut off of Russian energy exports has limited immediate impact because EU trade with Russia continues. Russia is unlikely to embargo the EU as it needs revenues to wage war. However, the EU will diversify away from Russia over time, which means that Russia will intensify its efforts to replace the government in Ukraine. The Biden administration began with an adversarial posture toward the energy sector, both US producers and Gulf Arab petro-states. Now it is adjusting its stance as prices surge. The OPEC states do not favor Biden but have an interest in calibrating production to avoid global recession and prolong their profit windfall. Even if the US restores the 2015 nuclear deal with Iran, which we doubt, investors should fade the oil price implications and stay focused on OPEC. Recommendation (Tactical) Inception Level Inception Date Return Long DXY (Dollar Index) 96.19 Feb 23, 2022 2.9% Bottom Line: Stagflation is the likeliest economic outcome of today’s global supply constraints. Feature Biden’s Oil Policy: Implications Will the Ukraine crisis lead to a US recession? The probability of a recession is 7.7% today, according to the bond market, but the oil price shock suggests that the probability will only increase from here. Stagflation, at least, is now highly likely. Short-term interest rates are rising faster than long-term rates, causing the 2-year/10-year Treasury slope to slide toward inversion, though it is not there yet. That would be a telltale sign of a looming recession (Chart 1). The 3-mo/10-year Treasury yield slope is nowhere near inverting and has a better record of predicting recessions than the 2-year/10-year. The Federal Reserve’s interest rate hikes are expected to cause the 10-year yield to rise and the yield curve to steepen. But exogenous shocks may push short rates even higher. When the oil price doubles, a recession often ensues. Out of the past seven recessions, five of them witnessed an oil spike beforehand. True, not every spike causes a recession. But the causality is clear. Today’s spike is large enough to be recessionary (Chart 2). The critical question is where will the price settle? If it settles above $90-$100 per barrel then it will erode global demand. Chart 1An End-Of-Cycle Crisis?
An End-Of-Cycle Crisis?
An End-Of-Cycle Crisis?
Chart 2Oil Price Often Doubles Before Recessions
Oil Price Often Doubles Before Recessions
Oil Price Often Doubles Before Recessions
Most likely the price will settle at around $85 per barrel by the end of 2022, and average $85 in 2023, according to our Commodity & Energy Strategy. High prices will discourage consumption and incentivize new production, leading to a price drop and new equilibrium. The OPEC cartel will increase production because they want to prolong the business cycle. Non-OPEC producers like US shale oil companies will also increase production. It is not likely that the US will significantly lift sanctions on Iran and Venezuela, though that would free up 1.3 million barrels per day and 700,000 barrels per day respectively. More on this below. Even so, this year’s energy spike will feed into a larger bout of inflation that is eroding real incomes. Headline consumer price inflation is running at 7.9% as of February, the highest in four decades. Core inflation is running at 6.4%. The Ukraine war did not prevent the European Central Bank from delivering a hawkish surprise in its fight against inflation on March 10, so it is even less likely to prevent the Fed from delivering a hawkish surprise on March 16. The Fed has a history of hiking rates even during geopolitical crises (as during the Arab oil embargo of 1973), which implies that the war in Ukraine will not prevent the Fed from hiking rates four times or more this year. There is a close relationship between the global oil price and the financial market’s long-term inflation expectations (Chart 3). When the costs of production and transportation go up, investors start to expect higher prices. Expectations are already rising because of the global pandemic, stimulus, supply constraints, wage pressure, and tardy policy normalization. Gasoline prices at the pump will shape consumer expectations (Chart 4). Chart 3Global Oil Price Pushes Up Inflation Expectations
Global Oil Price Pushes Up Inflation Expectations
Global Oil Price Pushes Up Inflation Expectations
Chart 4Geopolitics Compound Inflation
Geopolitics Compound Inflation
Geopolitics Compound Inflation
Yet high commodity prices are not coinciding with strong global growth and a weak dollar, as one might suspect. Global growth is falling and the dollar is strengthening. The energy shock from Russia will rattle importing countries like Europe, China, and India and thus enhance the dollar’s rise (Chart 5). Investor sentiment will suffer as the war in Ukraine reinforces the secular rise in geopolitical risk. Global policy uncertainty is also rising sharply, which will reinforce the dollar, weighing on global economic activity. Chart 5Dollar Strengthens on Weak Global Growth
Dollar Strengthens on Weak Global Growth
Dollar Strengthens on Weak Global Growth
Bottom Line: A stagflationary dynamic is taking shape. Moreover the risk of recession is underrated by the bond market’s measure of recession probability. Investors should maintain tactically bearish trades and cut losses on cyclically bullish trades that suffer from higher rates and persistent inflation. US Boycotts Russia And Begs OPEC The Biden administration’s decision to ban Russian oil exports – and to encourage private sector boycotts of the Russian energy trade – raises the potential for the Russian conflict to escalate beyond Ukraine’s borders. While a total boycott of Russian oil exports is unlikely, it would be one of the larger oil shocks in modern history (Chart 6). Unlike the Iranian attack on the Saudi oil refinery in 2019, the Russian shock would come amid an existing energy shortage. Chart 6Worst Case Oil Risk in Historical Context
Biden's Oil Shock
Biden's Oil Shock
There are two critical questions about US policy at this stage: Will the US foist its energy boycott on Europe, triggering a Russian retaliation? This could plunge Europe into recession and further upset the global economy. Will the US convince the OPEC cartel to increase oil production? A production boost would reduce prices and help to rebalance the economy, salvaging the business cycle. The next two sections discuss these options. US Boycotts Russia The first question is how Russia will respond to the US boycott and whether the Biden administration will try to force Europe to adopt the boycott. The US is comfortable boycotting Russian energy because oil and gas imports only account for 0.6% of GDP and those from Russia only 0.04%. Europe cannot make the same decision. While O&G imports are only 2.21% of GDP, and Russian O&G imports at 0.4%, these numbers will spike to near 2008 levels as a result of the price shock (Charts 7A & 7B). Major European countries, notably Germany, have already rejected the US boycott, and any EU direct sanctions require unanimity. The EU is instead outlining a plan to diversify away from Russia more gradually. This is a medium-term threat to Russia and hence a major concern for global stability but it is not an instant cutoff, which would cause an immediate recession in Europe. Chart 7AThe US Is Energy Independent...
Biden's Oil Shock
Biden's Oil Shock
Chart 7B...The EU Is Not
Biden's Oil Shock
Biden's Oil Shock
The EU’s plan would theoretically reduce its dependency on Russian energy by 66% by the end of the year. But that is easier said than done. Also, Europe cannot simply swap the US for Russia. American exports to the rest of the world could be redirected to Europe, but the switch requires an overhaul of supply chains. A total switch of US exports to Europe is impracticable in the short run and would leave other US allies dependent on Russian exports (Charts 8A & 8B). Chart 8AUS Will Not Replace Russian Energy Anytime Soon
Biden's Oil Shock
Biden's Oil Shock
Chart 8BUS Will Not Replace Russian Energy Anytime Soon
Biden's Oil Shock
Biden's Oil Shock
US shale producers are only starting to increase production. With WTI crude oil at $100, and Henry Hub natural gas spot price at $4.6 per million BTU, American production will speed up. But US companies are more focused on profitability and returns to shareholders than they were at the beginning of the shale boom, which has restrained oil production (Charts 9A & (9B). Chart 9AUS Production And Exports Increase After Pandemic Lull
US Production And Exports Increase After Pandemic Lull
US Production And Exports Increase After Pandemic Lull
Chart 9BUS Production And Exports Increase After Pandemic Lull
US Production And Exports Increase After Pandemic Lull
US Production And Exports Increase After Pandemic Lull
The Biden administration has not yet fully adopted the tactics necessary: promoting the domestic fossil fuel industry and coordinating it for purposes of national strategy. American oil executives complain that while the Biden administration courts foreign energy producers and contemplates arbitrarily lifting sanctions on Iran and Venezuela, it has not approached domestic producers about facilitating production.1 Meanwhile there is a risk that Russia will retaliate against western sanctions by cutting off natural gas to the EU, for instance via the Nord Stream I pipeline. This is a risk, rather than a base case, because Moscow would prefer to sell energy as long as Europe is buying – and even increase the amount it produces at today’s high prices. Russian energy exports to the EU account for 5% of Russian GDP and thus provide an important lifeline at a time when the country is suffering heavily under banking, technology, and trade sanctions (Chart 10). Russian natural resource exports on average provide 43% of government revenue, which is essential for Moscow to carry on its war effort (Chart 11). Chart 10Russia Will Not Punish EU For US Boycott
Biden's Oil Shock
Biden's Oil Shock
Chart 11Russia Needs EU Energy Imports
Biden's Oil Shock
Biden's Oil Shock
And yet Russians are now slapping an embargo on agricultural exports, constricting global food supply and pushing up food prices. The implication is that a reduction in energy exports to the EU is not out of the question, especially an incremental reduction aimed at increasing Russian diplomatic pressure on Europe. If the Russians cut off Europe, it will fall into a severe recession and the energy shock will risk a global recession. While US direct trade exposure to Europe is limited, at about 3.8% of GDP (Chart 12A), nevertheless the US would suffer from price pressures. The US is already seeing import prices rise toward 2008 levels (Chart 12B). Chart 12AUS Exposure To The EU Is Limited...
US Exposure To The EU Is Limited...
US Exposure To The EU Is Limited...
Chart 12B...But Its Import Prices Will Rise
...But Its Import Prices Will Rise
...But Its Import Prices Will Rise
Bottom Line: The US is boycotting Russian oil but not forcing the EU to join the boycott. Europe is pursuing gradual diversification but Russia is unlikely to cut off Europe’s supply. However, this dynamic is showing signs of faltering, which means investors are justified in taking further risk off the table. US Begs OPEC The Biden administration started off on the wrong foot with the Gulf Arab states by criticizing them for autocratic government and human rights abuses, threatening to withhold arms sales, and trying to restore the 2015 nuclear deal and détente with Iran. Now, with a global energy shock unfolding, Biden is going back to Saudi Arabia and the UAE and imploring them to increase oil production and ease the supply pressure. The Arab states are reportedly giving him the cold shoulder, ignoring his phone calls while answering Russian President Vladimir Putin’s calls.2 These states never have an interest in producing oil at any US president’s beck and call. The US and Iran have also reached a critical stage in nuclear negotiations. So it is only fitting that the Arab states play hard to get. While the UAE ambassador to the US suggested that his country supporting increasing production on March 9, the country’s energy minister said the opposite. However, the core OPEC states are even less likely to do Russia’s bidding. Moscow propped up the Syrian regime, arms and subsidizes Iran, and aspires to gain ever greater control over Middle East exports to Europe. The Gulf states also know that the Russians will produce as much energy as they can since they need the revenues to sustain their war (Chart 13). Chart 13Core OPEC Countries Have An Interest In Increasing Oil Supply
Core OPEC Countries Have An Interest In Increasing Oil Supply
Core OPEC Countries Have An Interest In Increasing Oil Supply
The Gulf states rely on the US military for national security, they fear that US-Iran détente will lead to US abandonment and Iranian regional ascendancy, and they seek to sustain their centrality to the global oil market. They want to prolong their export revenues in the context of a growing global economy for the sake of their own delicate internal stability and reforms. They do not aim to incentivize non-OPEC oil production and renewable energy transition with excessive prices, or to trigger a global recession (Chart 14). Hence the Saudi and UAE strategy will be to lower the oil price closer to their fiscal breakeven rate of $82.3 and $62.8 (oil price consistent with a balanced budget) and prolong the business cycle (Chart 15). Chart 14Core OPEC Does Not Want To Threaten Their Fiscal Future
Biden's Oil Shock
Biden's Oil Shock
Chart 15Current Oil Price Comfortably Supports Fiscal Spending In OPEC
Biden's Oil Shock
Biden's Oil Shock
The critical factor in the negotiation with the Biden administration will be Iran, their chief rival. Biden is trying to rejoin the 2015 nuclear deal, which would require removing sanctions in exchange for Iran’s halting its nuclear progress. A deal would bring 1.3 million barrels per day online, at least for the next two years or so. It could also prompt the Saudis or others to increase production to prevent Iran from stealing market share, as occurred in 2014 (Chart 16). Any deal would reduce the risk of military conflict in the short term and as such would remove some risk premium from oil prices. If Biden agrees to walk away from the Iran deal, then perhaps the Saudis and UAE will oblige him with a larger and quicker production boost. They know the Democratic Party is doomed in this year’s midterm elections anyway. Sanctions are not preventing the Iranians from exporting oil today and there is very little chance that they will truly abandon their quest for nuclear weapons (Chart 17). Chart 16Production Ramped Up Ahead Of The Iran Deal In 2015
Production Ramped Up Ahead Of The Iran Deal In 2015
Production Ramped Up Ahead Of The Iran Deal In 2015
Chart 17Production May Ramp Up Again As Iran Managed To Evade Sanction
Production May Ramp Up Again As Iran Managed To Evade Sanction
Production May Ramp Up Again As Iran Managed To Evade Sanction
Either way the core OPEC members need to adjust the oil supply to maintain market share and prolong the business cycle. Taking it all together, investors should expect oil prices to remain volatile and for oil supply risks to remain elevated, meaning that oil prices will likely resume their rise after the expected OPEC intervention. Biden is also tinkering with the idea of easing sanctions on Venezuela. This would take a long time and require regime change to come to fruition. Venezuela produces about 700,000 barrels per day at present, down from about 2 million bpd in 2017.Given the lack of capital, investment, and engineering expertise, the Venezuelans probably cannot increase production beyond 1 million bpd over the next year or so. Of that, maybe 600,000 barrels could be sent to export markets, according to our Commodity & Energy Strategist Bob Ryan. The US cannot remove all sanctions from Venezuela as it does not recognize the legitimacy of President Nicolas Maduro’s regime. The Department of Justice indicted Maduro in 2020. Accommodating Maduro will create even more bad blood between the Democrats and the Cuban-American voters in electorally critical Florida. US companies will be reluctant to get involved in oil production in Venezuela on such a flimsy basis, as they will fear future sanctions if Republicans win in 2024. So investment in Venezuela, and hence oil production, will remain limited even if Biden waives some sanctions. Bottom Line: Biden’s attempts to ease sanctions on Iran and Venezuela are unlikely to have a lasting impact on oil prices. But it is possible that he will convince the OPEC states to increase production, as their own interests support such a move. Investment Takeaways Comparing Russia’s 2022 invasion of Ukraine to the original invasion in 2014, the major trends are parallel: stocks are falling relative to bonds, cyclical sectors are underperforming defensives, and small caps are outperforming large caps (Chart 18A). Chart 18AMarket Response 2022 Versus 2014
Market Response 2022 Versus 2014
Market Response 2022 Versus 2014
Chart 18BMarket Response 2022 Versus 2014
Market Response 2022 Versus 2014
Market Response 2022 Versus 2014
If Russia imposes an energy embargo or OPEC refuses to increase production, then there will be an even larger global energy shock and a European recession that will weigh on global growth. The dollar will stay well bid in the near term. Value stocks are far outpacing growth stocks in the 2022 crisis, in keeping with high inflation and rising bond yields (Chart 18B). While we favor value over growth on a structural basis, we took the opposite stance as a tactical trade at the beginning of this year in expectation of falling bond yields, which has backfired. We are closing this trade for a loss of 7.7%. Matt Gertken Senior Vice President Chief US Political Strategist mattg@bcaresearch.com Footnotes 1 See Shannon Pettypiece, “White House, oil industry spar anew over drilling as gas prices surge”, NBC News, March 12, nbcnews.com. 2 See Holman Jenkins, “The Putin Endgame,” The Wall Street Journal, March 1, 2022, wsj.com Strategic View Open Tactical Positions (0-6 Months) Open Cyclical Recommendations (6-18 Months) Table A2Political Risk Matrix
Biden's Oil Shock
Biden's Oil Shock
Table A3US Political Capital Index
Biden's Oil Shock
Biden's Oil Shock
Chart A1Presidential Election Model
Biden's Oil Shock
Biden's Oil Shock
Chart A2Senate Election Model
Biden's Oil Shock
Biden's Oil Shock
Table A4APolitical Capital: White House And Congress
Biden's Oil Shock
Biden's Oil Shock
Table A4BPolitical Capital: Household And Business Sentiment
Biden's Oil Shock
Biden's Oil Shock
Table A4CPolitical Capital: The Economy And Markets
Biden's Oil Shock
Biden's Oil Shock
One of the key financial market ramifications of the war in Ukraine is its impact on energy markets. The price of Brent jumped from $95/bbl to an apex of $127/bbl less than two weeks into the conflict. Since this peak, Brent has fallen back down just below…
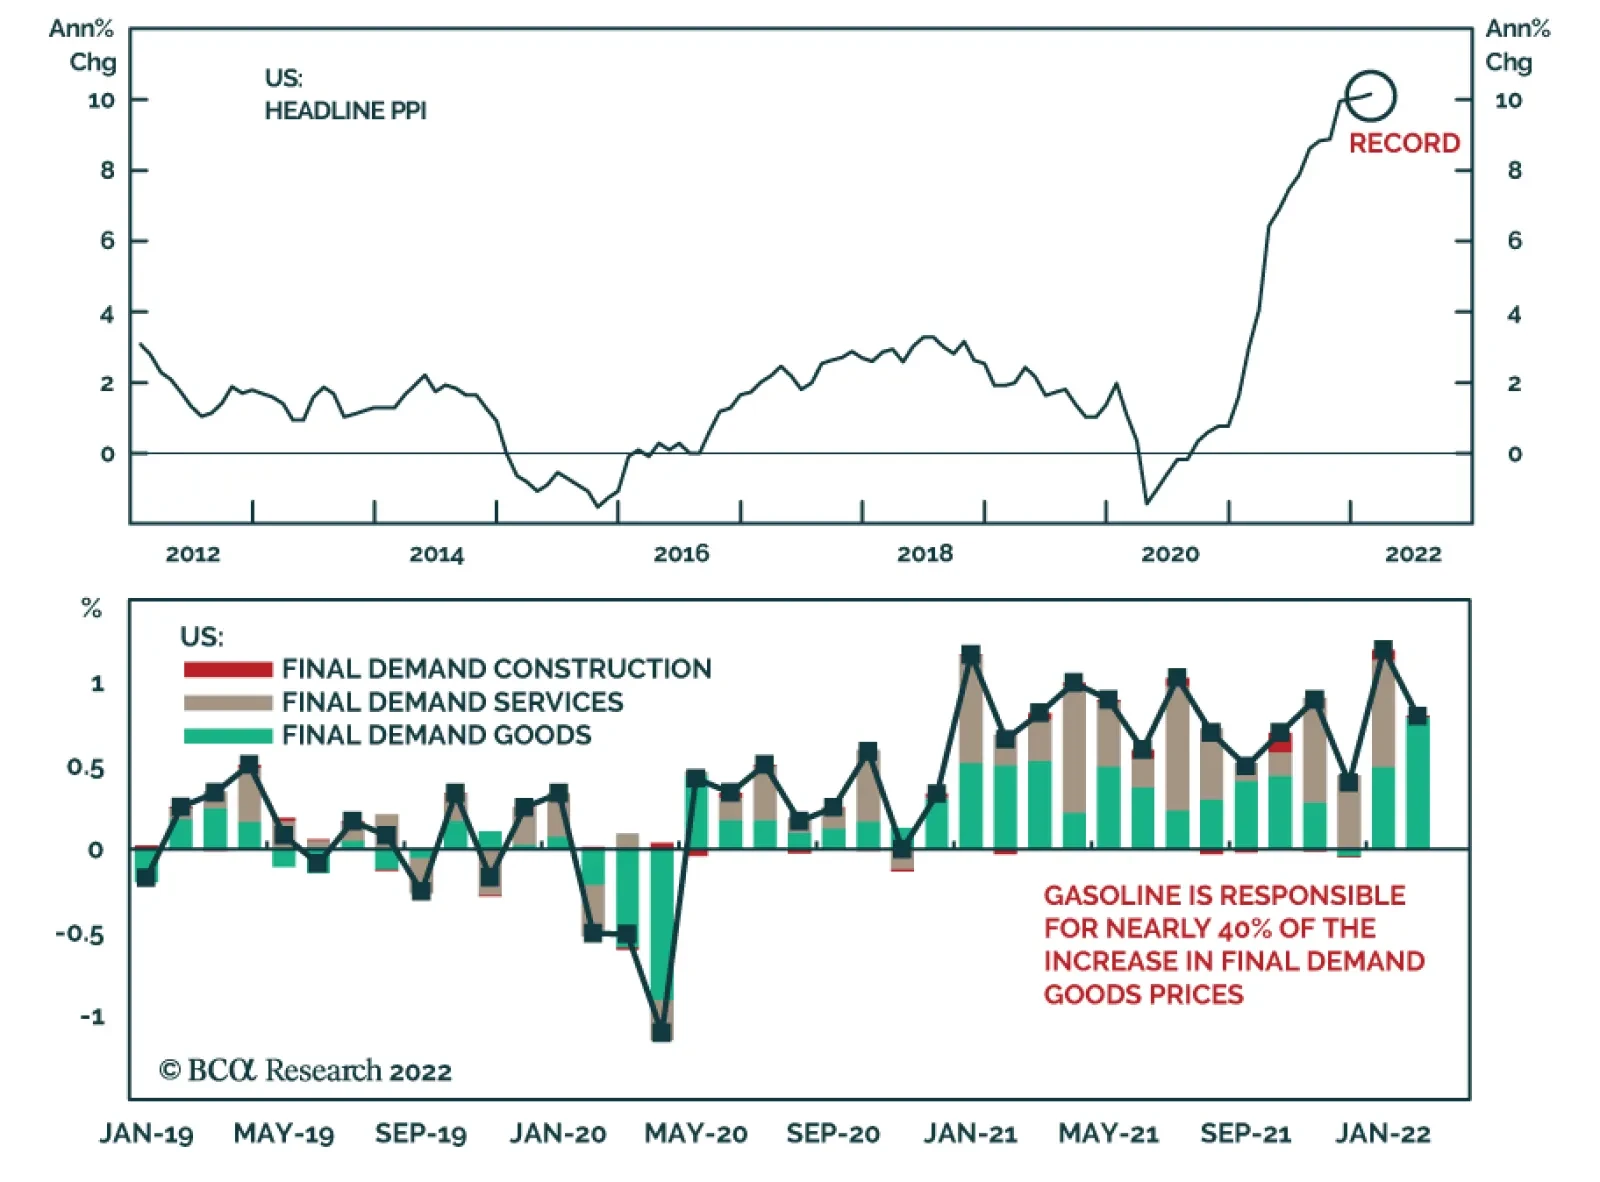
US producer prices surged by a record 10% y/y in February, unchanged from January and in line with consensus expectations. PPI ex-food and energy inched up by 0.1 percentage points to 8.4% y/y but fell below the expected 8.7% y/y rate. That said, the momentum…