United States

Executive Summary The Fed is in a tough spot. On the one hand, rising long-dated inflation expectations will incentivize it to tighten more quickly. On the other hand, the flat yield curve and poor risky asset performance point to a heightened risk of recession if it tightens too aggressively. The Fed will try to split the difference by lifting rates at a steady pace of 25 bps per meeting, starting this week. Though upside risks have increased, it remains likely that core inflation will peak within the next couple of months. This will allow the Fed to continue tightening at a steady pace, one that is already well discounted in the market. Monthly Core Inflation By Major Component
A Soft Landing Is Still Possible
A Soft Landing Is Still Possible
Bottom Line: Investors should keep portfolio duration close to benchmark and favor yield curve steepeners. Corporate bond spreads will continue to widen in the near-term, but a buying opportunity will soon emerge. A Tough Spot For The Fed A lot has happened since we shifted our portfolio duration recommendation from “below benchmark” to “at benchmark” on February 15. The Russian invasion of Ukraine sent bond yields sharply lower the following week but yields have since recovered and are now close to where they were when we upgraded our duration view (Chart 1). That said, the round-trip in nominal yields masks some significant moves in the real and inflation components. The 10-year TIPS breakeven inflation rate is currently 2.98%, up from 2.45% on February 15, and the 5-year/5-year forward TIPS breakeven inflation rate has moved up to 2.38% from 2.05% (Chart 2). In the past two weeks we’ve also seen a further flattening of the yield curve (Chart 2, panel 3) and widening of credit spreads (Chart 2, bottom panel). Chart 2A Stagflationary Shock
A Stagflationary Shock
A Stagflationary Shock
Chart 1Round-Trip
Round-Trip
Round-Trip
Taken together, recent market moves are consistent with a stagflationary shock. Long-dated inflation expectations are higher, but the yield curve is flatter and risk assets have sold off. This sort of environment is a complicated one for Fed policy. On the one hand, rising long-dated inflation expectations give the Fed a greater incentive to tighten quickly. On the other hand, rapidly tightening financial conditions increase the risk that the Fed may move too aggressively and push the economy into recession. So what’s the Fed to do? For now, it will try to split the difference. In practice, this means that the Fed will start tightening policy this week and proceed with a steady rate hike pace of 25 basis points per meeting. Once this process starts, we see two possible scenarios. The first possible scenario is that the Fed achieves its “soft landing”. A steady hike pace of 25 bps per meeting proves to be slow enough that financial conditions tighten only gradually, the yield curve retains its positive slope and inflation peaks within the next couple of months, halting the upward trend in long-dated inflation expectations. This benign scenario is still more likely than many people appreciate. For starters, the bond market is already priced for close to seven 25 basis point rate hikes this year, the equivalent of one 25 bps hike per meeting (Chart 3). This means a 50 bps hike at some point this year is required for the Fed to deliver a hawkish surprise to near-term expectations. In our view, a 50 bps hike is unlikely unless long-dated inflation expectations continue to move higher and become obviously “un-anchored”. If inflation peaks within the next couple of months, in line with our base case outlook, then so will long-dated expectations. Chart 3Rate Expectations
Rate Expectations
Rate Expectations
The second possible scenario is that we see no near-term relief on the inflation front. Global supply chains remain disrupted by the war in Ukraine and surging COVID cases in China, and commodity prices continue their upward march. This would initially lead to even higher long-dated inflation expectations and an even faster pace of expected Fed tightening. It could even lead to a 50 bps Fed rate hike at some point, though we think it’s more likely that it would lead to an inverted yield curve and a severe tightening of financial conditions (i.e. sell off in equities and credit markets) before the Fed even gets the chance to deliver a 50 bps hike. Investment Implications The “soft landing” scenario remains our base case view. The Fed will start tightening in line with current market expectations and core inflation will peak within the next couple of months, keeping long-dated inflation expectations in check. Related Report US Investment StrategyQ&A On Ukraine, Financial Markets And The Economy The correct investment strategy for this outcome is to keep portfolio duration close to benchmark and to favor a 2/10 yield curve steepener (buy the 2-year note versus a duration-matched barbell consisting of cash and the 10-year note). Not only is the front-end of the bond market fully priced for a steady hike pace of 25 bps per meeting, but the 5-year/5-year forward Treasury yield is close to median survey estimates of the long-run neutral fed funds rate. This suggests that the upside in long-dated bond yields is limited (Chart 4). As for the yield curve, assuming that the Fed’s well-discounted steady pace of tightening is unlikely to invert the curve, then it makes sense to grab the extremely attractive yield pick-up available in the 2-year note versus a duration-matched cash/10 barbell (Chart 5). Chart 4Close to Fair Value
Close to Fair Value
Close to Fair Value
Chart 5A Huge Yield Pick-Up In Steepeners
A Huge Yield Pick-Up In Steepeners
A Huge Yield Pick-Up In Steepeners
The investment implications of our second “un-anchored inflation expectations scenario” are more difficult to game out. However, we think the most likely outcome is that bond yields would rise initially, driven by inflation expectations, and then plunge once the yield curve inverts and it becomes clear that the Fed will be forced to tighten the economy into recession. This is not our base case scenario, but investors with a 6-12 month investment horizon who wish to position for this outcome should probably extend portfolio duration rather than shorten it. The 2022 Inflation Outlook A key pillar of the “soft landing” scenario described above is that core inflation peaks within the next couple of months and starts to head lower in H2 2022. Today, we’ll assess the likelihood of that occurring by looking at the three main components of core CPI inflation: goods, shelter, and services (excluding shelter). The first fact to consider is that month-over-month core CPI has printed between 0.5% and 0.6% in each of the past five months, almost matching the extreme inflation readings seen between April and June 2021 (Chart 6). If month-over-month core inflation continues to print at 0.5%, then year-over-year core CPI will drop between March and June before rising again to reach 6.3% by the end of the year (Chart 7). Conversely, if month-over-month core inflation declines to 0.3%, then year-over-year core inflation will fall steadily to 4.2% by the end of 2022. Chart 6Monthly Core Inflation By Major Component
A Soft Landing Is Still Possible
A Soft Landing Is Still Possible
Chart 7Annual Inflation
Annual Inflation
Annual Inflation
These two outcomes likely have different implications for policy and markets. The world where core inflation remains sticky above 6% probably coincides with expectations of rapid Fed tightening, a near-term inversion of the yield curve and rising expectations of recession. Conversely, the world where core inflation falls to 4.2% by the end of 2022 and appears to be on a downward trend probably coincides with well-contained inflation expectations and a steady pace of Fed tightening. We therefore want to know which of these outcomes is more likely. To do that we consider the outlooks for core inflation’s three main components. 1. Core Goods Chart 8Goods Inflation
Goods Inflation
Goods Inflation
Goods have been the main driver of elevated inflation during the past year, especially the new and used car segments (Chart 8). Prior to the pandemic, core goods inflation tended to fluctuate around 0%. Currently, the year-over-year rate is up around 12%. We view a significant decline in core goods inflation as highly likely this year. First off, used car prices – as measured by the Manheim Used Vehicle Index – have already moderated (Chart 8, panel 2), while other measures of supply bottleneck pressures like the ISM manufacturing supplier deliveries and prices paid indexes are rolling over, albeit from high levels (Chart 8, panel 3). Reduced demand should also ease some of the upward pressure on goods prices this year. Consumer spending on goods dramatically overshot its pre-COVID trend during the past two years (Chart 8, bottom panel) as spending on services was often not possible. With US COVID restrictions on the verge of being completely lifted, some spending is likely to shift away from goods and towards services in 2022. The recent news of a surging omicron COVID wave in China and renewed lockdown measures already in place in Shenzhen province may delay the re-normalization of supply chains. As of yet, we think it’s premature for this to alter our view. The omicron experience of other countries suggests that the wave will be quick and that restrictions will not be as severe as in past COVID waves. 2. Shelter Shelter is the largest component of core CPI and it is also the most tightly correlated with the economic cycle. That is, it tends to accelerate when economic growth is trending up and the unemployment rate is falling, and vice-versa. Shelter faces two-way risk in 2022. The upside risk comes from private measures of asking rents and home prices that have already surged. The Zillow Rent Index is up 15% during the past 12 months and the Zillow Home Price Index is up 20% (Chart 9A). Recent research has shown that these private measures tend to feed into core CPI with a lag of about one year.1 The downside risk to shelter inflation this year comes from the economic cycle itself. Chart 9B shows that there is a tight correlation between shelter inflation and the unemployment rate, and between shelter inflation and aggregate weekly payrolls (employment x hours x wages). The unemployment rate’s rapid 2021 decline will not persist this year. The labor market is nearing full employment and last year’s fiscal impulse has faded. Chart 9BShelter Inflation II
Shelter Inflation II
Shelter Inflation II
Chart 9AShelter Inflation I
Shelter Inflation I
Shelter Inflation I
Netting it all out, we think shelter inflation will continue to trend higher for the next few months but will eventually level-off near the end of this year as economic growth slows. 3. Core Services (excluding Shelter) Services inflation printed an extremely strong 0.55% month-over-month in February, though a large portion of that increase was driven by pandemic-related services like airfares and admission to events, increases that will moderate now that the omicron wave has passed. More fundamentally, wage growth is the key driver of services inflation, and it has been extremely strong. The Atlanta Fed’s Wage Growth Tracker is up to 4.3% year-over-year, its highest since 2002, and it is showing signs of broadening out to wage earners of all levels (Chart 10). Though we see wage growth remaining strong, its acceleration is also likely to moderate in the coming months. The Census Bureau’s most recent Household Pulse Survey showed that almost 8 million people were absent from work in February because they were either sick with COVID themselves or caring for someone with COVID symptoms (Chart 11). Near-term wage demands will moderate during the next few months as the pandemic ebbs and these people return to work. Chart 10Wage Growth Is Strong
Wage Growth Is Strong
Wage Growth Is Strong
Chart 11Covid Still Weighing On Labor Supply
Covid Still Weighing On Labor Supply
Covid Still Weighing On Labor Supply
We also must grapple with the possible deflationary fall-out from the recent energy and gasoline price shock. Real household incomes are declining (Chart 12A), and while consumers have ample room to either tap their savings or increase debt to support spending (Chart 12B, top panel), the recent plunge in consumer sentiment suggests that they may behave more cautiously (Chart 12B, bottom panel). Chart 12AReal Incomes Are Falling
Real Incomes Are Falling
Real Incomes Are Falling
Chart 12BConsumer Confidence Is Low
Consumer Confidence Is Low
Consumer Confidence Is Low
Putting It Together We could see core goods inflation falling all the way back to a monthly rate of 0% this year. This would be consistent with its pre-pandemic level, but also wouldn’t incorporate any outright price declines – which are also possible. If we additionally assume some further acceleration in Owner’s Equivalent Rent and Rent of Primary Residence, to 0.6% per month, and a slight pullback in services inflation to a still-strong 0.3% per month, then overall core CPI inflation would hit a monthly rate of 0.34%, consistent with annual core CPI inflation of 4.2%. We think this is a reasonable forecast though we see risks to the upside driven by another bout of supply chain pressures in manufactured goods. In general, we expect year-over-year core CPI inflation to reach a range of 4% to 5% by the end of this year. That would be consistent with the “soft landing” scenario described earlier in this report. Corporate Bonds: Waiting For A Buying Opportunity To Emerge Chart 13Corporate Bond Valuation
Corporate Bond Valuation
Corporate Bond Valuation
Finally, a quick update on our corporate bond allocation. Corporate bonds have sold off sharply versus Treasuries since February 15. The investment grade corporate bond index has underperformed a duration-equivalent position in Treasury securities by 217 bps while High-Yield has underperformed by a less dramatic 120 bps. With economic risks high and the Fed on the cusp of a tightening cycle, we think further spread widening is likely in the near-term. However, if the “soft landing” scenario described earlier in this report pans out, then we will soon see a buying opportunity in corporate bonds. The 12-month quality-adjusted breakeven spread for the investment grade corporate index has risen close to its historical median, from near all-time expensive levels only a few months ago (Chart 13). While a flat yield curve poses a risk to corporate bond returns, wide spreads may soon become too attractive to ignore. Table 1A shows average historical 12-month investment grade corporate bond excess returns given different starting points for the 3-year/10-year Treasury slope and the 12-month corporate breakeven spread. Table 1B shows 90% confidence intervals for those average returns and Table 1C shows the percentage of instances in which excess returns were above 0%. Table 1AAverage 12-Month Future Investment Grade Corporate ##br##Bond Excess Returns* (BPs)
A Soft Landing Is Still Possible
A Soft Landing Is Still Possible
Table 1B90 Percent Confidence Interval Of 12-Month Investment Grade Corporate Bond Excess Returns* (BPs)
A Soft Landing Is Still Possible
A Soft Landing Is Still Possible
Table 1CPercentage Of Episodes With Positive 12-Month Investment Grade Corporate Bond Excess Returns*
A Soft Landing Is Still Possible
A Soft Landing Is Still Possible
At present, the 3-year/10-year Treasury slope is +9 bps and the 12-month breakeven spread is 18 bps. Historically, this sort of environment is consistent with positive excess corporate bond returns 59% of the time, but with a negative average return overall. That said, if the yield curve retains its positive slope, then a further 18 bps of corporate index spread widening would push the 12-month breakeven spread above the 20 bps threshold. The historical record suggests that this would be an unambiguous buy signal. Bottom Line: We are sticking with our recommended 6-12 month corporate bond allocations for now. We are neutral (3 out of 5) on investment grade and overweight (4 out of 5) on high-yield. A yield curve inversion and heightened risk of recession would cause us to turn more cautious, but we think it’s more likely that widening spreads present us with an opportunity to upgrade our corporate bond allocations within the next few months. Stay tuned. Ryan Swift US Bond Strategist rswift@bcaresearch.com Footnotes 1 https://www.frbsf.org/economic-research/publications/economic-letter/2022/february/will-rising-rents-push-up-future-inflation/ Treasury Index Returns Spread Product Returns Recommended Portfolio Specification
A Soft Landing Is Still Possible
A Soft Landing Is Still Possible
Other Recommendations
A Soft Landing Is Still Possible
A Soft Landing Is Still Possible
Executive Summary Is Factor Investing Dead?
Is Factor Investing Dead?
Is Factor Investing Dead?
After decades of outperformance, in the past few years equity factors have started to underperform the broad indexes. But this may just be because US-centric factor research and US-dominated global factor indexes have masked an underlying divergence in the behavior of factor premiums in major countries/regions. In this report, we identify differences in smart beta strategies in the US, euro area (EMU), UK, Japan, Canada, Australia, and emerging markets (EM). Quality and Minimum Volatility factors are the most consistent across all markets. However, the magnitude of the factor premiums varies significantly among certain countries/regions. These variations can be attributed to a factor’s differing exposure to the same sector in specific countries, as well as the diverse performance of the same sector in specific countries. Value/Growth is an inferior framework to sector positioning. Quality remains a better factor than Growth. Bottom Line: Factor investing is still a viable investing approach, but investors should consider that factor premiums have diverged among major countries/regions. Factor strategies may be less profitable in the US, Japan, and Australia. We suggest that global investors implement smart beta strategies on an individual country basis to better capture the factor premium in each country/region. Feature Chart 1Diverging Factor Performance
DIVERGING FACTOR PERFORMANCE
DIVERGING FACTOR PERFORMANCE
Late last year, quant hedge fund AQR announced it would cut back resources because poor performance had induced significant investor outflows.1 Based on MSCI’s diversified multi-factor (DMF) index, which is a bottom-up 4-factor-index (value, momentum, quality and size) optimized using Barra equity models,2 the global DMF index underperformed the MSCI ACWI by 21% between March 2018 (when the relative performance peaked) and the end of January 2022, even though it had outperformed by 373% over the previous 20 years (Chart 1, top panel). Many clients have asked: Is factor investing dead? As shown in Chart 1, however, MSCI Global DMF’s recent poor relative performance was driven largely by a 23.6% underperformance from the developed markets (DM), especially the US (33% underperformance) and Japan (23.6% underperformance), while the DMF index in the emerging markets (EM) lagged its benchmark by only about 1% in the same period. We have advocated a simple approach to factor allocation to smooth out the cyclicality of individual factors by equally weighting five time-tested factors: Quality, Momentum, Minimum Volatility (Min Vol), Value and Equal Weight. Our equally-weighted-5-factor aggregate (EW5) index is less volatile than the more sophisticatedly optimized DMF; it therefore suffered less underperformance in the same period. However, even with this approach, the regional divergence is still notable, with the EW5 factor index in the developing markets underperforming its benchmark by 9%, while the EM EW5 factor index outperformed its benchmark by about 5.5% (Chart 1, panels 2 and 3). Interestingly, the EW5 index for Japan looks more like that for the US than it looks like the Japanese DMF (Chart 1, panels 4 and 5). This highlights the importance of factor allocation methodology. Table 1US Dominance In Global Markets
Is Factor Investing Dead?
Is Factor Investing Dead?
US equities dominate the global equity index by market capitalization. Momentum and Quality, the two best performing factors globally, have even higher weightings in US companies than the broad benchmark, as shown in Table 1. An academic paper published in 2019 based on studies of the US and 38 international stock markets indicates that the US is the only country with a statistically significant, economically meaningful and robust post-publication decline of long-short equity factor returns.3 This is because the US is the most researched market and large mispriced anomalies are arbitraged away quickly after they are identified in academic publications, which results in lower strategy returns. Most quant funds are US-focused, which may explain the ill fortunes of some quant funds. Smart beta strategies are long-only factor strategies, instead of long-short strategies. At the aggregate level, the MSCI factor indexes in developed markets and emerging markets performed much better than in the US, in line with the academic findings (Chart 1, panels 2, 3, and 4). Yet, the Japanese DMF index’s relative performance peaked in October 2012 and has been in a consistent down trend since that time (Chart 1, panel 5). Our research shows that Japan is not an anomaly. Factor divergence among countries exists not only at the aggregate level, but also at the individual factor level. Factor Performances Diverge Among Countries/Regions Factor returns in the US, UK, EMU, Japan, Canada, Australia, and EM, both in absolute and relative terms, have had notable divergences in the past 20 years, as shown in Table 2.4 Several observations from Table 2: Quality and Min Vol are two factors with positive premiums in all countries. In terms of magnitude, however, Min Vol premiums in the US, Japan and Australia are the closest to zero, while the EM scores the highest. Quality premium in Australia is also close to zero while the UK stands out. Momentum is the best performing factor in all countries/regions except in Japan where it has a slightly negative premium. The ineffectiveness of Momentum in Japan may be due to its cultural biases. Momentum tends to fare better in countries that promote individuality (unlike Japan) and where self-attribution and overconfidence are more pervasive. EM is the only market where our five preferred factors (Momentum, Quality, Min Vol, Value and Equal Weight) have had positive premiums, even though the Value premium is not statistically different from zero, while the Growth premium is negative. Despite the well-telegraphed underperformance of Value versus Growth in the US and global markets, this has not been the case in Japan, Canada, and the EM. Momentum, Quality, Min Vol and Value in the EM and Canada have much higher absolute returns than in the US. This aspect cannot be fully explained by the overall index performance difference between these countries and the US. Even though Momentum, Quality, Min Vol and Value in the UK and euro area have returned much less than their US counterparts, the magnitude of the underperformance of each factor is much smaller than what the overall index performance divergence would imply. Table 2Factor Performance Divergence*
Is Factor Investing Dead?
Is Factor Investing Dead?
The widely quoted explanation for the impressive factor performance in the EM, especially in the Chinese A-share market, is that emerging markets have higher trading costs such that it’s harder to arbitrage away the mispriced anomalies. It’s true that trading cost is higher in the EM than in the US, which explains why there are fewer EM-dedicated quant funds than US-focused quant funds. Trading cost alone, however, cannot fully explain the exceptionally large premiums in EM Momentum, Quality and Min Vol compared with the US. In fact, the market with the best factor relative performance since the end of 2001 has been the UK (Chart 2) where trading costs are comparable to the US. The EM is the second in terms of relative returns even though it is more volatile than the euro area. Canada has also performed better than the US, while Australia has been the least favorable market to harvest any factor premium. Japan behaves more like the US, yet with higher volatility. The risk-adjusted active return, defined as the average of the return difference (between EW5 and benchmark) divided by the volatility of the return difference, on an annualized basis using monthly returns, is illustrated in Chart 3. The chart shows both the full-period (from December 2001 to January 2022) risk-adjusted active return (RAAR) and four-year moving RAAR to demonstrate how factors have evolved in each market. Several observations can be made from Chart 3: In the past 20 years, factor premiums (aka active factor returns) in the US have gone through three stages: High premium, low positive premium and then sharply declining premium to negative territory. The last stage started about four years ago. The US factor premium is at its lowest level in the past 20 years and is also the lowest among the seven countries/regions (Chart 3, panel 5). This supports the argument that too many quant funds trade with each other in the US equity market, resulting in lower and lower factor returns. Japan shares a similar pattern with the US, but on a much smaller scale (Chart 3, panel 4). Canada and Australia are similar because their indexes are dominated by financials and commodities. The four-year RAAR trends oscillate in a similar fashion in both countries, but the Canadian cycle seems to lead the Australian cycle by about 2-1/2 years. Canada has a meaningfully positive average factor premium and its four-year RAAR is near a historical low. In contrast, Australia’s average premium is close to zero and its four-year RAAR is still above previous lows (Chart 3, panels 6 and 7). The EMU is the only market with a positive four-year moving RAAR, currently at the well-established lower bound (Chart 3, panel 2). The UK has the highest average premium. It is the only market in which the four-year RAAR has had large cyclical swings and only two brief periods in negative territory (Chart 3, panel 1). EM is the only market where the four-year RAAR has improved since the Covid-19 pandemic started in March 2020 (Chart 3, panel 3). Chart 2Factor Relative Return Performance*
FACTOR RELATIVE RETURN PERFORMANCE*
FACTOR RELATIVE RETURN PERFORMANCE*
Chart 3Risk-Adjusted Active Performance
RISK-ADJUSTED ACTIVE PERFORMANCE*
RISK-ADJUSTED ACTIVE PERFORMANCE*
Bottom Line: US-centric factor research and the US-dominated global factor indexes have masked different behaviors of factors in various countries/regions. Thus, it is important to analyze each market instead of drawing investment conclusions from US-based research. What Drives The Divergence In Quality Premium? The Quality factor has been consistently rewarded, but the magnitude of the Quality premium varies significantly among countries/regions, and non-US countries have low correlations with the US, as shown in Table 2 (on page 4) and Charts 4 and 5. Chart 4Quality Performance Divergence*
QUALITY PERFORMANCE DIVERGENCE*
QUALITY PERFORMANCE DIVERGENCE*
Chart 5Quality Premium* Country Correlation
Is Factor Investing Dead?
Is Factor Investing Dead?
MSCI Quality is defined by three accounting measures: Return on equity (ROE), debt-to-equity and five-year volatility of EPS YoY growth. Earnings may be affected by accounting standards. Countries have different accounting standards, which may explain part of the country divergence in Quality. Our research focuses on an important aspect of Quality, which is persistence, i.e., a Quality stock today will be a Quality stock in the future. The implication is that the Quality factor index has a low turnover and its sector composition does not change much over time. As such, we can take a snapshot and see the relationship between Quality and sector exposure. The sector weights of the broad benchmark in each market are shown in Table 3. Notably, the US and EM have the highest exposure to the Tech sector while both the UK and Australia have little. Although Australia and Canada are both regarded as commodity-driven markets, they have dissimilar exposures to non-Financials: Australia is concentrated in Materials and Healthcare, while Canada has a more even exposure in Energy, Industrial, Materials and Tech. Table 3Broad Market Sector Compositions
Is Factor Investing Dead?
Is Factor Investing Dead?
Given that Quality is measured on profitability, capital structure and earnings stability, does Quality show universal sector preference? The answer is both Yes and No. Yes, because Quality is universally underweight Financials, Energy and Utilities (Table 4). It is also overweight Tech and underweight Real Estate in all markets, except Australia. Tech has outperformed Financials, Utilities and Energy in general (except for Canada), therefore, these three sector tilts may explain the universal existence of Quality premium (Chart 6). Table 4Quality Index Sector Deviations
Is Factor Investing Dead?
Is Factor Investing Dead?
Chart 6What Drives Quality Premium?
WHAT DRIVES QUALITY PREMIUM?
WHAT DRIVES QUALITY PREMIUM?
However, the commonality ends here. Canadian Tech has underperformed Financials by a very large margin (Chart 6, panel 3), which would have caused a huge underperformance in Quality; Quality indexes in the UK and EMU have benchmark exposures to Tech. So what else have contributed to Quality’s outperformance in these three countries/regions? A look at their exposures to other sectors reveals the answers. In the UK, EMU and Canada, Quality indexes have also overweight tilts in Industrials, Consumer Discretionary and Consumer Staples (Table 4). These three sectors have all outperformed their respective benchmarks in the past 20 years, as shown in Table 5. The table also shows that Consumer Staples is the only sector that has outperformed in all markets, yet both US and Australian Quality indexes underweight this sector. Table 5Sector Performance*
Is Factor Investing Dead?
Is Factor Investing Dead?
In addition, in both the UK and Canada, Quality overweights Materials, which is a top outperforming sector in the UK, but an underperforming sector in Canada. Materials also outperforms in the EMU, yet EMU Quality underweights it. Despite the impressive overall outperformance since 2001, the Quality factor in DM has suffered in the past few years, especially since the Covid 19-induced selloff in March 2020. Quality relative performance in EM peaked long before DM but has stood out as the only significant outperformer since March 2020. This is because profitability in Quality has improved in EM but deteriorated in the US and other DM countries as shown in Charts 7 and 8. Chart 7Quality Premium Driver: ROE*
QUALITY PREMIUM DRIVER: ROE*
QUALITY PREMIUM DRIVER: ROE*
Chart 8Quality Premium Driver: EPS*
QUALITY PREMIUM DRIVER: EPS*
QUALITY PREMIUM DRIVER: EPS*
Chart 9Quality Premium Driver: Valuation*
QUALITY PREMIUM DRIVER-VALUATION*
QUALITY PREMIUM DRIVER-VALUATION*
Valuation-wise, Quality indexes in the UK and Canada are at their cheapest levels since 2013, while Japan has become more expensive. Meanwhile, Quality valuation in the US, EMU and Australia is in line with their respective historical average5 (Chart 9). Bottom Line: Quality premium is driven by profitability and has strong sector preferences. The divergence of Quality premium among countries indicates that the same sector in different countries does not necessarily share the same behavior relative to its own benchmark. Sector behaviors in each market have not been as consistent as globalization would have implied, even though “global sectors” have become a well-accepted concept. What Drives The Min Vol Premium Divergence? Beside Quality, Min Vol has consistently outperformed in all the countries/regions in the past 20 years, even though the premiums in the US and Japan are close to zero, as shown in Table 2 on page 4. Over time, however, Min Vol’s relative performance is very cyclical. At the global aggregate level, this cyclicality is determined by its defensive nature given its positive correlation with the relative equity return ratio of Defensives/Cyclicals and negative correlation with bond yields. It is no surprise that the strong recovery in global equities and the rise in bond yields have caused Min Vol to underperform the broad market since March 2020. What is surprising, however, is the magnitude of the underperformance, which cannot be explained by historical relationships (Chart 10). Chart 10What Drives Global Min Vol Premium?
WHAT DRIVES GLOBAL MIN VOL PREMIUM?
WHAT DRIVES GLOBAL MIN VOL PREMIUM?
Looking at the global aggregate only, however, can provide misguided information, because Global Min Vol is dominated by the US (56.81%) and Japan (9.88%), where Min Vol has performed the worst. In the most recent cycle since March 2020, the US is the only country where Min Vol has deviated sharply from the historical relationship with the relative performance of defensives/cyclicals and with bond yields, incurring the largest relative performance drawdown ever, erasing all the relative gains achieved in the previous two decades (Chart 11A). Japanese Min Vol also suffered large drawdown, but was in line with the defensives/cyclicals, albeit undershooting what implied by the bond yield (Chart 11B). The relative performance of Min Vol in the UK, Canada, EM, and Australia all behaved in line with what is implied by the historical relationships with bond yields and defensives/cyclicals, while Min Vol in EMU does not have a close correlation with defensives/cyclicals (Charts 11 C-G). Chart 11AUS Min Vol Premium
US MIN VOL PREMIUM
US MIN VOL PREMIUM
Chart 11BJapan Min Vol Premium
JAPAN MIN VOL PREMIUM
JAPAN MIN VOL PREMIUM
Chart 11CUK Min Vol Premium
UK MIN VOL PREMIUM
UK MIN VOL PREMIUM
Chart 11DEMU Min Vol Premium
EMU MIN VOL PREMIUM
EMU MIN VOL PREMIUM
Chart 11ECanada Min Vol Premium
CANADA MIN VOL PREMIUM
CANADA MIN VOL PREMIUM
Chart 11FAustralia Min Vol Premium
AUSTRALIA MIN VOL PREMIUM
AUSTRALIA MIN VOL PREMIUM
Chart 11GEM Min Vol Premium
EM MIN VOL PREMIUM
EM MIN VOL PREMIUM
Min Vol has become the worst performing factor since March 2020, led by the US, Japan, and EMU, while the UK has been almost flat, as shown in Table 6. This is in stark contrast to its historical track record (Table 2 on page 4) but can be explained by its defensive tilt in a strong equity market. Currently, Min Vol’s general defensive nature is reflected by its overweight in Consumer Staples and underweight in Consumer Discretionary, overweight in Communication Services and underweight in Energy in all markets. In interest-rate-sensitive sectors, Min Vol overweighs Utilities in all markets except Japan and underweights Financials in all markets, except EM (Table 7). Table 6Min Vol Was The Worst Performer Since The Covid-Induced Recovery*
Is Factor Investing Dead?
Is Factor Investing Dead?
Table 7Min Vol Index Sector Deviations
Is Factor Investing Dead?
Is Factor Investing Dead?
Communication Services in the UK and Australia bucked the trend, outperforming the broad market. UK Financial also opposed the trend but did not outperform. In addition, the UK is overweight in Real Estate, which did much better than the broad market (Table 8). Table 8Sector Performance Since March 2020
Is Factor Investing Dead?
Is Factor Investing Dead?
Chart 12Min Vol Premium Divergence: Valuation*
MIN VOL PREMIUM DIVERGENCE:VALUATION*
MIN VOL PREMIUM DIVERGENCE:VALUATION*
Min Vol in EM has an overweight in Financials, which also outperformed. In addition, EM Consumer Discretionary resisted the general trend, coming in under its benchmark by 17% annualized; an underweight in this sector contributed to EM’s Min Vol’s performance. Why has US Min Vol performed so badly? According to a GAA Special Report published in January 2020, extreme overvaluation of Min Vol relative to the broad market could induce poor subsequent performance in near future. US Min Vol reached peak valuation relative to the market in 2019, and the subsequent underperformance was accompanied by sharp multiple contraction. Currently, Min Vol’s relative valuation is in line with historical average in the US, implying the turnaround since November 2021 may have further staying power (Chart 12). Bottom Line: Global Min Vol’s defensive tilts explain its underperformance since March 2020. However, divergences in the magnitude of underperformance among countries is explained by different sector exposures and the varying performance of some sectors in different countries, in addition to relative valuation. Chart 13Value Vs. Growth: Is This Time Different?
VALUE VS. GROWTH: IS THIS TIME DIFFERENT?
VALUE VS. GROWTH: IS THIS TIME DIFFERENT?
Is It Time To Overweight Value Versus Growth? This is one of the most frequently asked questions over the past few years, especially after the turnaround in AQR last year hit the newswire. The impressive performance of AQR so far this year has prompted more heated debate on the sustainability of the “Revenge of Value” after Value's longest streak of underperformance).6 The recent rebound in the relative performance of Value versus Growth has been driven by extremely oversold conditions, very cheap valuation and faster EPS growth led by the rise in global bond yields. Even though sector exposures change over time for Value and Growth, sector exposures to Financials and Tech have been stable since 2010 at the global aggregate level (Chart 13). The large bets in Financial, Utilities and Tech are universal, as shown in Table 9. Other sector exposures in specific countries vary significantly. For example, the US Value/Growth split is basically between Tech, Communication Services and Consumer Discretionary versus the other eight sectors. These three sectors are dominated by a few mega-cap stocks. The other eight sectors are a mixed bag of cyclicals, defensives, and interest rate sensitives, which have different macro drivers. It does not make sense to overweight them together. It is important to note that Consumer Staples and Healthcare are overweight in Growth outside the US and EMU. Table 9Sector Tilts In Value And Growth
Is Factor Investing Dead?
Is Factor Investing Dead?
In addition, Growth has similar sector preferences as Quality (Table 4 and Table 9), which explains the high correlation between the two factor premiums (Chart 14A), However, Quality has been a much better factor than Growth outside the US and Australia. In the US, Quality and Growth are almost the same with a stable correlation, but Quality has been inferior to Growth in Australia (Chart 14B). Chart 14AClose Correlation* Between Quality And Growth
CLOSE CORRELATION* BETWEEN QUALITY AND GROWTH, BUT...
CLOSE CORRELATION* BETWEEN QUALITY AND GROWTH, BUT...
Chart 14BQuality Is Superior To Growth Outside US And Australia
QUALITY IS SUPERIOR TO GROWTH OUTSIDE US AND AUSTRALIA
QUALITY IS SUPERIOR TO GROWTH OUTSIDE US AND AUSTRALIA
Finally, Value and Growth behave very differently in various market-cap segments, as shown in Table 10. Despite the well-telegraphed underperformance of Value versus Growth by the media, Value has consistently outperformed Growth in Canada, EM and Japan. Furthermore, mid-cap Value has also outperformed mid-cap Growth universally.
Image
Bottom Line: Value is extremely cheap and the rebound from an extremely oversold condition has been supported by the relative earnings trend and a rise in interest rates. Yet the mixed bag of sector exposure makes the Value/Growth allocation inferior to sector allocation. Investors who want to focus on Growth are advised to look for Quality outside of the US and Australia. Conclusions Related Report Global Asset AllocationValue? Growth? It Really Depends! The US-centric factor research and media coverage have masked an underlying divergence of factor premiums in specific countries/regions. Factor premiums in the UK, EMU, Canada, and EM have been stronger than in the US, while Japan and Australia have been weaker. This divergence can be explained by different sector exposures of the same factor, along with varying behaviors of the same sector in specific countries/regions. While factor investing is not dead, it may be less profitable to utilize in the US, Japan, and Australia. We suggest that global investors implement smart beta strategies on an individual country basis to better capture the factor premium in each country. Even though Quality, Min Vol and Momentum have been outperformers in the past 20 years, all factors have embedded cyclicality. We do not advocate factor timing and reiterate our long-standing approach of equally weighting the five factors to smooth out the cyclicality of individual factors. Value/Growth is a popular style split; however, it is an inferior framework to sector positioning. In addition, Quality is a better factor than Growth, which is already included in our five-factor approach. Xiaoli Tang Associate Vice President xiaolit@bcaresearch.com Footnotes 1 Please see "Quant Hedge Fund Icon AQR Cuts Back as Investors Exit," Chief Investment Officer, dated November 15, 2021. 2 Please see "MSCI Diversified Multiple-Factorindexes Methodology," MSCI.com, dated May 2018. 3 Please see "Anomalies across the globe: Once public, no longer existent?" Journal of Financial Economics, Volume 135, Issue 1, January 2020, Pages 213-230. 4 Historical data for all MSCI factor indexes in major markets is available for this period 5 Since Jan 2013 based on MSCI data availability. 6 Jessica Hamlin, "AQR Posts Record Performance in January," Institutional Investor, dated February 9, 2022.
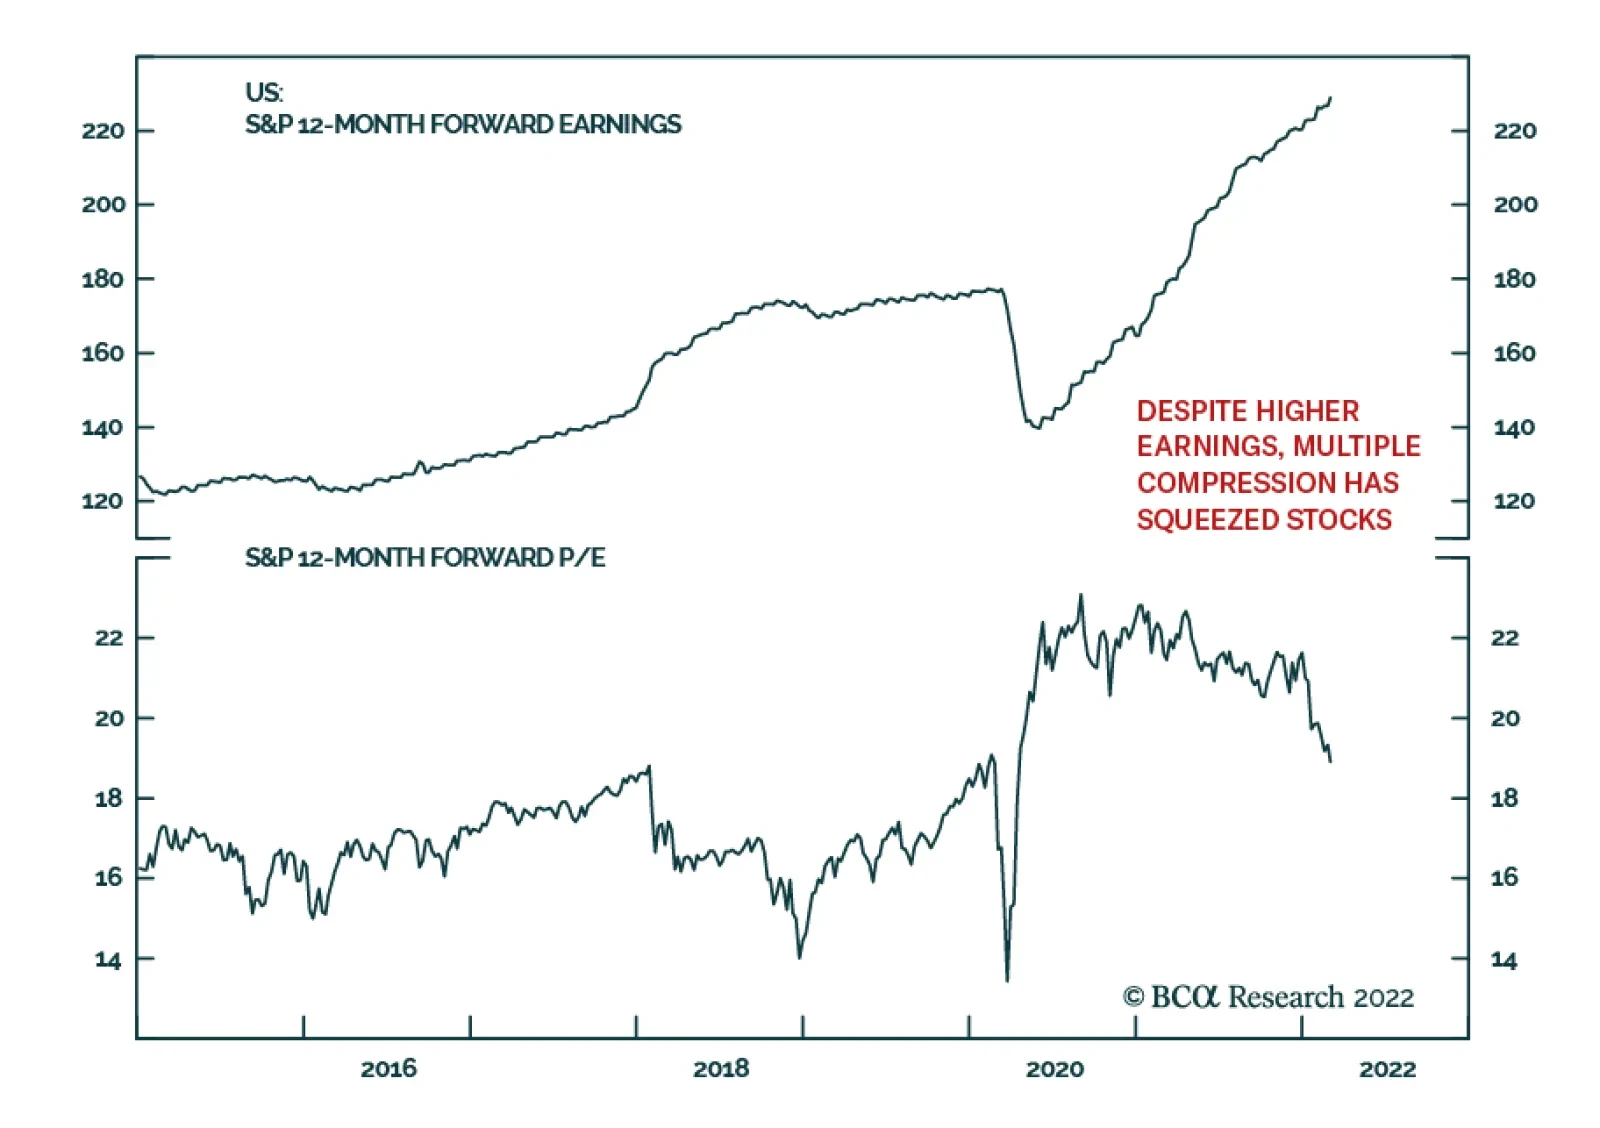
Our colleagues at BCA Research’s US Investment Strategy service do not think equities have bottomed, but they expect that they will generate a positive real return between now and the rest of the year. The S&P 500 can live up to less-than-demanding…
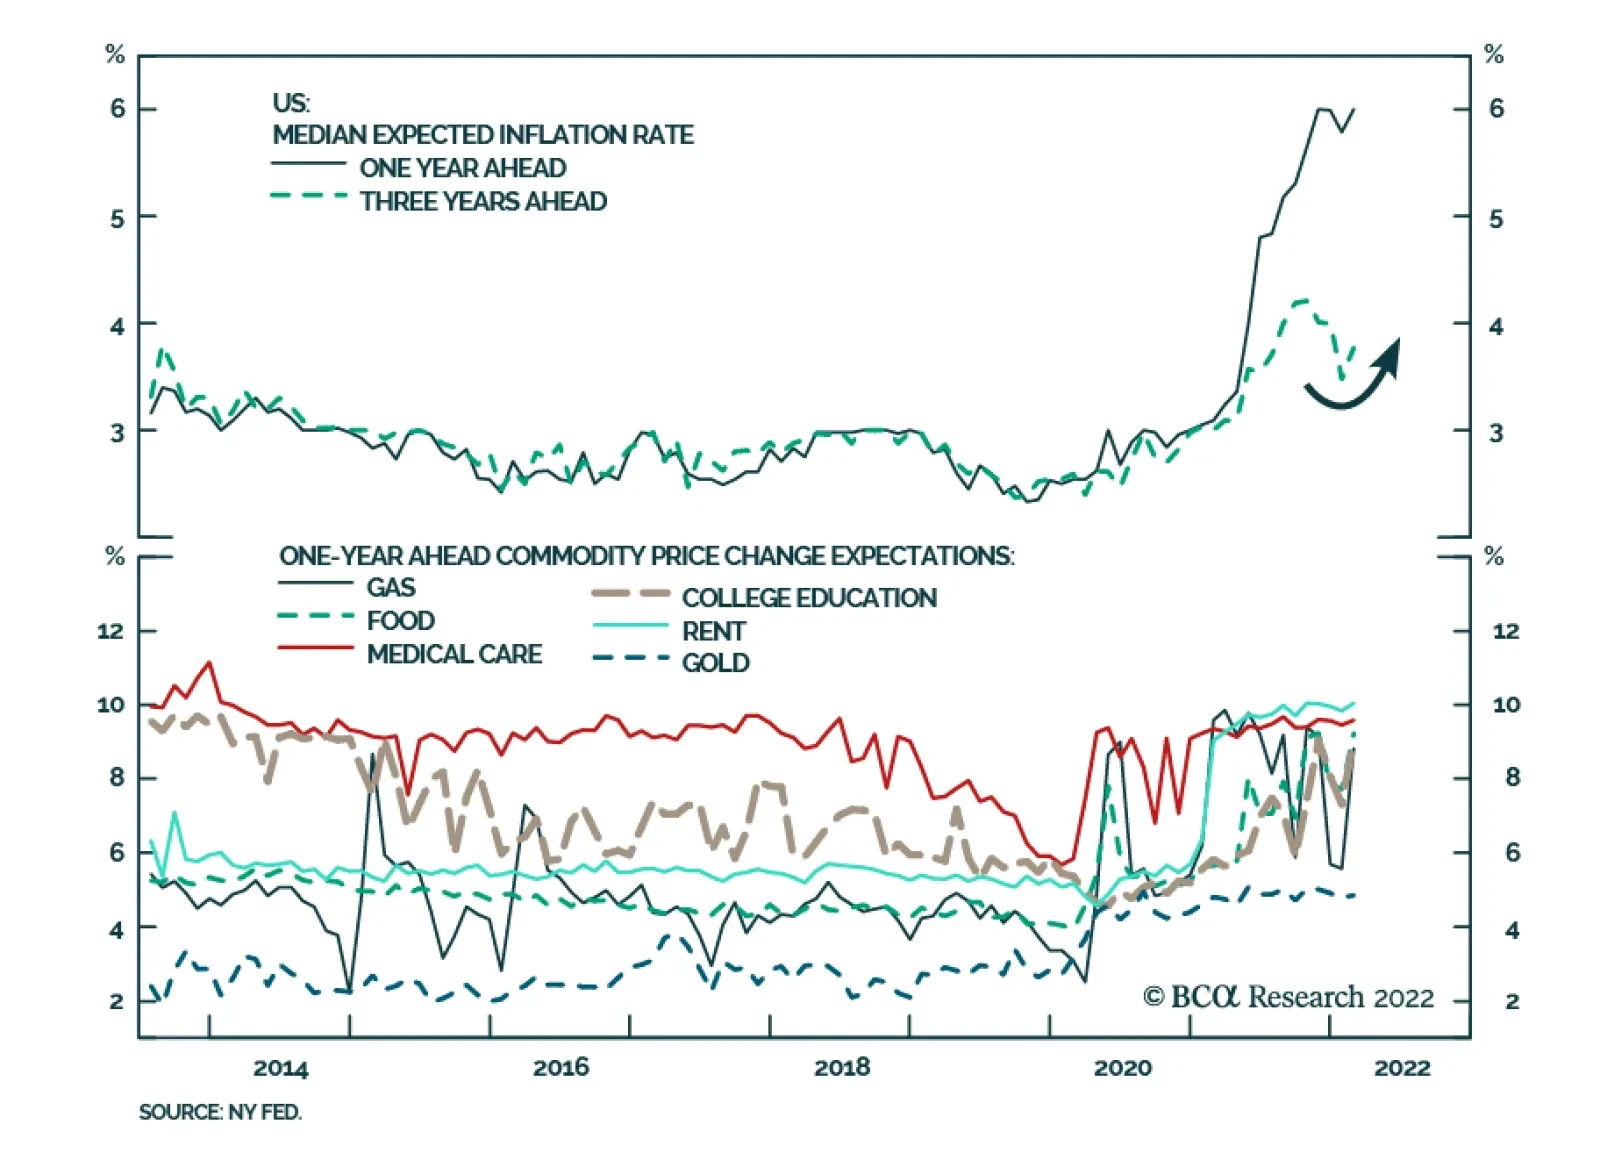
US consumer one-year ahead inflation expectations from the New York Fed’s Survey of Consumer Expectations increased from 5.8% to 6.0% in February. This latest reading marks a return to the record high reached in November 2021. The expected inflation rate…
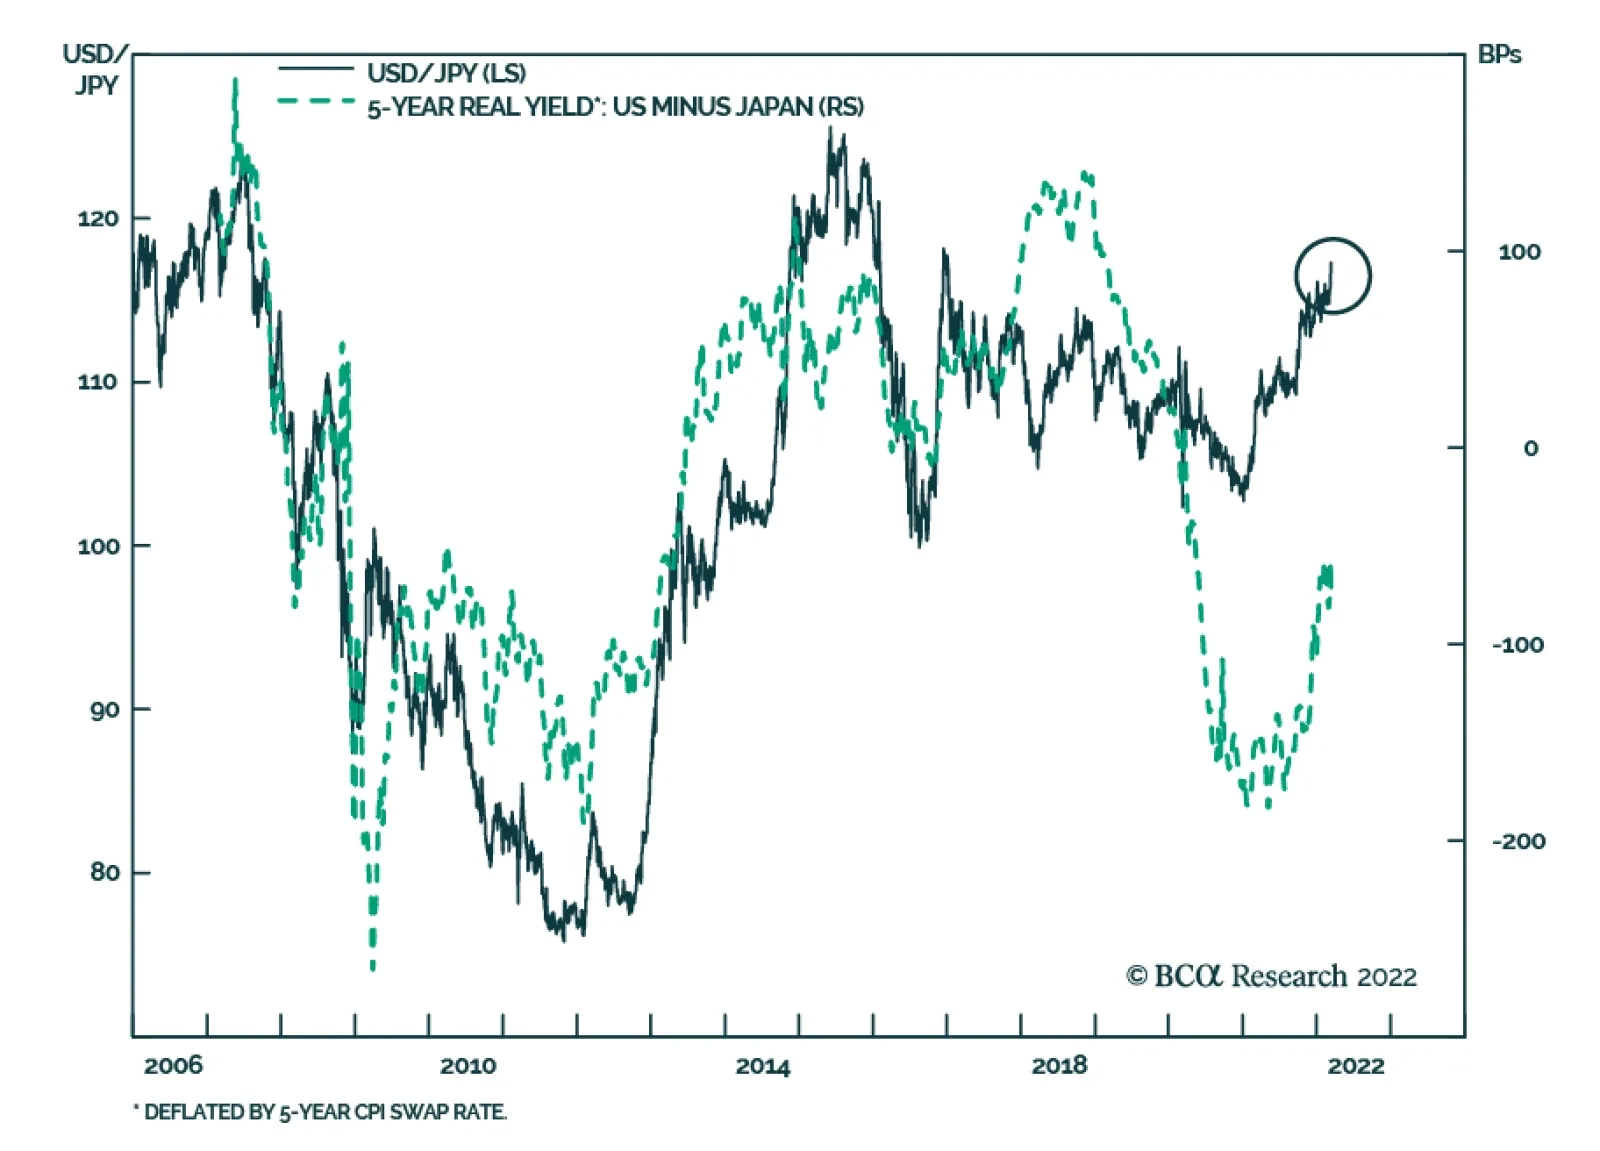
The Japanese yen has weakened significantly in recent days. It fell 2.9% vis-à-vis the US dollar in just over a week to its lowest level in five years. Several forces explain this recent yen weakness. First, the USD/JPY rally reflects rising global…
Executive Summary Winners And Losers
The Impact Of The Ukraine War On The US Economy And Equity Sectors
The Impact Of The Ukraine War On The US Economy And Equity Sectors
Combining Russia and Ukraine: Taken together, Russia and Ukraine account for a small fraction of global trade. However, Russia is a key player in the global energy and metals markets, providing rare materials like palladium. Ukraine is a sizable agricultural producer, as well as an exporter of specialized products such as neon. Effects on global trade: Shortages of metals and agricultural goods will reverberate across the global economy, exacerbating shortages and supply disruptions. Manufacturer anxiety about the availability of raw input materials catalyzed an explosive rally in the commodity universe. Effect on the US companies: Most US equity sectors have limited direct sales exposure to Russia. However, self-sanctioning will have an adverse immediate effect on many multinationals, while indirect effects of the war will be even more impactful. Winners and losers: At the margin, the escalation in Ukraine is a net positive for Energy, Big Tech, and Metals & Mining, while Travel, Consumer Staples, Semiconductors Manufacturers, and Automakers will be hit by shortages and surging input costs. Bottom Line:The war in Ukraine has wreaked havoc in the US equity market, even though US trade with Russia and Ukraine is insignificant and is mostly limited to energy, palladium, and other rare metals. However, US companies are affected by the scarcity of selected metals and materials, soaring prices, and supply chain disruptions. Feature Introduction The war in Ukraine has become the proverbial black swan that has blindsided even the most cautious investors. The world simply did not expect Russia to wage such a bloody, and all-out war. As such, tragically, small Ukraine has come out of obscurity, and became a focal point of the world’s attention, mostly for humanitarian reasons. While our heart goes out to the people living under fire, it is our job as investment strategists to conduct a detailed economic analysis of the effect of the war in Ukraine and sanctions on Russia’s goods and services on US equities. To do so, we will first investigate trade links between Ukraine, Russia, and the US. And then look at the indirect effects of the war on US equity sectors. Russia And Ukraine Effect On Global Trade Taken together, Russia and Ukraine account for about 3.5% of global GDP in PPP terms and only 1.9% in dollar terms. Even a deep recession in each of these economies is unlikely to cause a dent in global growth, at least not directly. Unfortunately, the indirect effects of this war are substantial. What Is Russia Producing? In 2019, Russia exported $407B in goods, which made it the 13th largest exporter in the world. It is the second-largest commodities exporter (after the US) and the second-largest oil producer, accounting for 12% of annual global output. Energy: Russia’s crude oil exports account for 8.4% of global crude consumption, while natural gas exports account for 5.9% of global consumption, and 3.4% for coal (Table 1). These energy products constitute roughly 60% of Russia’s exports. Its exports of natural gas represent close to half of all European gas imports. Table 1Russia’s Global Share In Various Commodities
The Impact Of The Ukraine War On The US Economy And Equity Sectors
The Impact Of The Ukraine War On The US Economy And Equity Sectors
Nickel: Russia is also one of the top metal producers. It is the third largest producer of nickel, accounting for 4.4.% of global output. The recent surge in nickel prices reflects manufacturers’ anxiety about the potential shortages of this metal.1 Elon Musk has said that a shortage of nickel is the “biggest challenge” in “producing high-volume, long-range batteries”. Palladium: In addition, to nickel, Russia accounts for 35.6% of global palladium output. Palladium is widely used in catalytic converters, electrodes, and other types of electronics.2 Palladium prices are up 46% since the start of the year. Chart 1War Wreaked Havoc In Commodities Market
The Impact Of The Ukraine War On The US Economy And Equity Sectors
The Impact Of The Ukraine War On The US Economy And Equity Sectors
Fertilizers: Together, Russia and Belarus account for about 40% of global potash production, a key ingredient in potassium-based fertilizers. Russia also produces two-thirds of all ammonium nitrate, the main source of nitrogen-rich fertilizers. Wheat and lumber: Russia produces 10% of the global supply of wheat and lumber. While Russia’s trading network is wide, the most common destinations for its exports are China (14%), Netherlands (10%), Belarus (5%), and Germany (4.6%), making its direct effect on global trade limited. What Is Ukraine Producing? Ukraine’s effect on global trade is less significant: In 2019 it exported only $49.5B, with exports dominated by agricultural products and metals (Chart 2). Food: Ukraine’s production is dominated by foodstuffs such as corn, wheat, and seed oils. Russia and Ukraine together account for 25% of global wheat exports, much of which is going to the developing nations of Africa and Asia (Chart 3). Russia and Ukraine are also significant producers of potatoes, sunflowers, and sugar beets. Chart 2Ukraine Exports Metals And Food
The Impact Of The Ukraine War On The US Economy And Equity Sectors
The Impact Of The Ukraine War On The US Economy And Equity Sectors
Chart 3Wheat Is Exported To North Africa And Asia
The Impact Of The Ukraine War On The US Economy And Equity Sectors
The Impact Of The Ukraine War On The US Economy And Equity Sectors
With war and sanctions, most of this output will be lost or kept for domestic consumption, accelerating food inflation, which is already rampant. Of course, the rest of the world could try to compensate for lost agricultural output, but there is a major snag: Russia, Ukraine, and Belarus are significant producers of fertilizer. Metals: Ukraine produces significant amounts of steel. ArcelorMittal and Metinvest suspended production at their Ukrainian plants last week. Auto Components: In addition, Ukraine is a major producer of automotive wire harnesses. Volkswagen, BMW, and Porsche have all had to curtail auto production due to war-related shortages. Neon: Then there are the more esoteric commodities. The bulk of semiconductor-grade neon, used in high-precision lasers, comes from Ukraine. A dearth of this critical gas could exacerbate the semiconductor shortage. While Ukraine trades predominately with its European neighbors, such as Russia, Germany, Poland, and Italy, shortages of agricultural products, semiconductors, and automotive components are likely to reverberate across the globe. The US Is An Island… Almost According to the OEC,3 in 2019 the US was the number two economy in terms of total exports ($1.51T), and the number one economy in total imports ($2.38T). Russia barely registers as the US trading partner, with only $14.B or 0.61% of total imports coming from Russia. Ukraine is even less significant for the US: Its exports constitute only $1.23B. US exports to Ukraine and Russia constitute less than 1% of its total exports. However, to uncover the potential effects of the possible halting of Russian trade on the US economy, let’s look at what goods the US is buying. The reality on the ground may be complex. Petrochemicals Refined and crude petroleum constitute about half of all Russian imports to the US and account for roughly $7 billion (Chart 4). The US sanctioning of Russian oil is unlikely to have a significant effect on the US economy: It constitutes only about 5.7% of all the US oil imports, both crude and refined, which in 2019 were about $123B. As a result, the recent US embargo of Russian oil is unlikely to have much impact. Platinum, Titanium, And Other Rare and Precious Metals US imports roughly $7B worth of platinum, over one-fifth of which is sourced from Russia. Russia also provides about 21.5% of all titanium and 23% of radioactive chemicals that the US imports. Chart 4US Imports Fuels And Rare Metals From Russia
The Impact Of The Ukraine War On The US Economy And Equity Sectors
The Impact Of The Ukraine War On The US Economy And Equity Sectors
Palladium The situation with palladium is even more strained: Russia produces 42% of the palladium imported by the US while South Africa supplies another 30%. All other exports of palladium are fragmented, and producers are unlikely to be able to ramp up production fast enough. Nickel US imports only $1.4B worth of nickel per year, 11% of which is coming from Russia. Australia and Canada are the only other large producers of this metal, and it is not clear if they will be able to step in and fill in the void left by Russia. How Much Production From Russia Will Be Curtailed? The West’s official sanctions affect Russian exports of certain commodities but there is also a reluctance on the part of private companies to buy or ship Russian exports. This latter factor makes it nearly impossible to gauge just how much supply of each individual commodity will be curtailed. In addition, Putin has announced his decision to suspend some commodity exports at least until 2023. Assuming in the near term that a considerable share of Russia’s commodity exports will be blocked from global markets, the largest impact will be on oil, palladium, copper, nickel, fertilizer, and grains. The Stock Market Is Not The Economy US Companies Most Exposed To Russian Trade Most US multinational companies have limited direct sales exposure to Russia. Among those that do have some exposure (Table 2), Philip Morris comes on top of the list at 8% of sales, PepsiCo 4.3%, Mondelez 3.1%, and McDonald’s 4.5%. Apple has generated only 1.3% of its sales in Russia. Overall, the Consumer Staples sector has the highest exposure to Russia. Exodus The majority of US multinationals have announced their exit from the Russian market in protest at the war. The exodus affects wide swaths of the Russian economy, including joint ventures in energy, auto manufacturing, finance, retail, entertainment, and fast food (See Appendix for the list). The war affects US sectors in many different way, and there are winners and losers (Chart 5). Table 2US Multinationals With The Highest Exposure To Russia
The Impact Of The Ukraine War On The US Economy And Equity Sectors
The Impact Of The Ukraine War On The US Economy And Equity Sectors
Chart 5Winners And Losers
The Impact Of The Ukraine War On The US Economy And Equity Sectors
The Impact Of The Ukraine War On The US Economy And Equity Sectors
Investment Implications Energy Sector – Positive The US embargo of Russian oil does not have a pronounced immediate and direct effect on the US energy sector as US imports from Russia are minor. Exxon’s exit from Russia is not going to have any noticeable short-term effect on the US energy sector. On the contrary, elevated oil and gas prices create an impetus for the US shale producers to ramp up output. Oil Equipment and Services companies will be the key beneficiaries of the new energy Capex cycle. While we closed our overweight in E&P companies with a view that OPEC will open oil spigots and cure high prices, locking in a gain of 60%, we remain overweight E&S Energy industry. Consumer Staples – Negative Companies such as Mondelez, Philip Morris, and PepsiCo are most exposed to the Russian market. All three have announced that they are discontinuing or curtailing Russian operations, taking a direct hit on earnings. However, disruptions in agricultural exports from Russia and Ukraine, and accompanying soaring food prices (Chart 6), are likely to have a broad negative effect on the sector, increasing input prices while sector margins are already razor-thin. So far, the sector had been able to pass on costs to customers, but its pricing power may be limited going forward (Chart 7). Chart 6Food Price Surge Is Parabolic
Food Price Surge Is Parabolic
Food Price Surge Is Parabolic
Chart 7Consumer Staples Have Been Able To Pass Costs On To Customers
Consumer Staples Have Been Able To Pass Costs On To Customers
Consumer Staples Have Been Able To Pass Costs On To Customers
We are overweight Consumer Staples thanks to its defensive attributes in the face of overall market volatility. However, we will be monitoring this position closely. Semiconductors - Neutral Disruptions in supplies of neon, palladium, and nickel, which are essential components of the manufacturing of semiconductors, will exacerbate global chip shortages, and hit profits of semiconductor manufacturers, mostly in Asia. However, the majority of the large US semiconductor companies are chip designers and are unlikely to be affected. The only exception is Intel, which is an integrated semiconductor company. Intel has also announced that it is exiting Russia, which may have an adverse effect on its profitability. Auto Manufacturers - Negative Overall, US car manufacturers have limited direct exposure to Russia. Ford has recently closed its joint venture with a Russian car manufacturer. GM does not have a significant presence in Russia, selling only 3,000 cars a year there, of the six million it sells worldwide. Tesla’s presence in Russia is also insignificant – there are only 700 Teslas registered there. However, there are supply problems. Shortages of metals, such as palladium and nickel, widely used in catalytic converters and electrodes, will compound shortages in tight auto component markets. Travel Complex: Hotels, Restaurants, and Airlines Hilton, Marriott, and Hyatt have announced that they are halting development and new investments in Russia. While these actions on the margin will have a long-lasting negative effect on their business, a more immediate concern is that a war in Europe will suppress travel, which only recently started rebounding after COVID-19 country closures. US airlines will suffer from a double whammy of rising fuel costs, and consumer reluctance for international travel in the light of hostilities in the heart of Europe. International and business travel are the most lucrative segments of their business, the rebound of which is needed for these companies to restore profitability. We were positive on airlines in light of the reopening of international travel as the Omicron wave was receding, but now have to reconsider our optimistic stance if oil prices don’t normalize soon. Fast-food restaurant closures in Russia (Burger King, McDonald’s, Starbucks, etc.) will result in a significant hit to their bottom line. To put these actions in perspective, McDonald’s announced that temporary closures of its 750 restaurants in Russia and 180 in Ukraine will make it lose $50 million a month, resulting in a 9% hit to its revenue. In addition, these businesses are already reeling from rising food prices and consumers shifting their goods and services away from discretionary spending to necessities because of negative wage growth. We are overweight the Travel complex but are likely to downgrade it in the coming days. Big Tech – Positive According to a recent report by the IDC, the global impact of a steep decline in Information and Communications Technology (ICT) spending in Russia and Ukraine will be somewhat limited. Combined, the two countries only account for 5.5% of all ICT spending in Europe and 1% worldwide.4 Meanwhile, tech spending among Western European countries may increase in part due to expanded defense and security allocations. We believe that dislocation also creates an opportunity for US technology companies, especially in the software and cybersecurity space. Exiting the Russian market is likely to have a limited negative effect on US technology companies’ revenue, as most of them derive only a very small proportion of it from Russia. We are overweight the Software and Cybersecurity industries. Metals and Mining - Positive Disruption of the supply of metals from Russia and Ukraine creates an opportunity for US metals and mining companies, with soaring pricing promising a profits windfall. Unlike with oil and gas, an increase of supply in metals not only takes substantial investment but also takes years to bring to production. As a result, there is no respite in sight. As such, we will consider adding to our existing position, bringing allocation to an overweight. Stay tuned. Bottom Line The war in Ukraine has wreaked havoc in the US equity market, even though US trade with Russia and Ukraine is insignificant and is mostly limited to energy, palladium, and other rare metals. However, the US economy is affected by the scarcity of selected metals and materials, soaring prices, and supply chain disruptions. As is often the case, there are winners and losers: Energy, and Metals & Mining are mostly immune to the crisis and are likely to benefit by picking up slack in supply. The Technology sector, especially Software and Cybersecurity, will benefit from the disruption of the war. Consumer Staples, Travel, Auto Manufacturers, and Semiconductor Manufacturers are likely to take a hit because of shortages and soaring input prices. Irene Tunkel Chief Strategist, US Equity Strategy irene.tunkel@bcaresearch.com Appendix: Companies’ Self-Sanctions In Russia5 Airlines American Airlines, Delta, and United cut ticket sales partnerships with Russian airlines. All three have stopped flying over Russia. Banks Goldman Sachs became the first American bank to announce that it is exiting Russia. Citigroup also indicated that it is curtailing operations in Russia. Technology Accenture is discontinuing its operations in Russia. Airbnb (ABNB) announced that the company is suspending all operations in Russia and Belarus. Amazon (AMZN)’s cloud division, Amazon Web Services (AWS), said it would halt new sign-ups for the service in Russia and Belarus. AWS indicated that it has no data centers in Russia and, as a matter of policy, it does not do business with the Russian government. It stated that while it had Russian customers, they are all headquartered outside of Russia. Apple (AAPL) has stopped selling its products in Russia, and limited access to digital services, such as Apple Pay, inside Russia. Google confirmed that it is no longer accepting new Google Cloud customers in Russia. It has also halted its advertisement operations in the country. IBM (IBM) has suspended all business in Russia. Intel (INTC) has stopped all shipments to Russia and Belarus, the company announced. Microsoft (MSFT) is suspending all new sales of its products and services in Russia. Microsoft (MSFT) also said it will continue aiding in Ukrainian cybersecurity. Netflix (NFLX) said it will be suspending its streaming service in Russia. Spotify (SPOT) said it has closed its office in Russia “indefinitely” and restricted shows “owned and operated by Russian state-affiliated media.” Adobe stopped all new sales in Russia Uber is divesting from internet company Yandex Paypal suspended all services in Russia Big Four Accounting Firms Ernst & Young, Deloitte, KPMG, and PwC are pulling out of the country. Energy Exxon pledged to leave its last remaining oil and gas project in Russia and not to invest in new developments in the country. Credit Card Providers All three American credit card giants, Mastercard (MA), Visa (V), and American Express (Amex), have suspended all their network operations in Russia. Credit cards issued by Russian banks will not work in other countries, and cards issued elsewhere will not work for purchases in Russia. Hotels Hyatt (H), Hilton (HLT), and Marriott (MAR) are halting development and new investments in Russia. Hilton and Marriott are closing their corporate offices. Hilton is keeping its existing 26 hotels open (a fraction of the company’s 6,800 properties worldwide). Marriott hotels are franchised and the company is evaluating the ability to keep these hotels open. Industrials 3 has halted operations in Russia. Dow (DOW) has suspended all purchases of feedstocks and energy from Russia. It has also stopped all investments in the region and is supplying only limited essential goods in Russia. General Electric (GE) suspended most of its operations in Russia, with the exception of “providing essential medical equipment and supporting existing power services.” John Deere (DE) has halted shipments of its products to Russia. Caterpillar (CAT) is suspending operations at its Russian manufacturing facilities. Boeing (BA) said it would suspend support for Russian airlines. Automakers Ford (F) announced it was suspending its operations in Russia. The American automaker has a 50% stake in Ford (F) Sollers, a joint venture that employs at least 4,000 workers. GM does not have much of a presence in Russia. Entertainment Disney (DIS) is also suspending the release of its theatrical films in Russia, citing “the unprovoked invasion of Ukraine.” WarnerMedia said on February 28 that it would pause the release of “The Batman” in Russia. The company is also pausing all new business in Russia, ceasing broadcast of its channels, halting all new content licensing with Russian entities, and pausing planned theatrical and games releases. Retail Estée Lauder Companies will suspend all commercial activity in Russia, including closing every store and brand site and halting shipments to any of our retailers in Russia. The company had also already suspended business investments and initiatives in Russia. TJX has promised to divest its equity ownership in Familia, an off-price retailer with more than 400 stores in Russia. Consumer Staples Mondelez (MDLZ) said it would scale back all non-essential activities in Russia “while helping maintain continuity of the food supply.” The company said it would focus on “basic offerings,” and discontinue all new capital investments and suspend advertising spending in the country. Procter & Gamble (PG) has discontinued all new capital investments in Russia and is suspending all media, advertising, and promotional activity. The company will continue to provide basic health, hygiene, and personal care items. Philip Morris suspended planned investments and will reduce manufacturing in Russia. PepsiCo will stop selling soda in Russia but will continue to produce dairy and baby food. Restaurants Yum Brands (YUM) is closing 70 company-owned KFC restaurants and 50 Pizza Hut franchises in Russia. It will also suspend all investment and restaurant development in the country. McDonald’s (MCD) is closing some 750 restaurants in Russia. Russia’s restaurants along with another 108 in Ukraine, accounted for 9% of the company’s revenue in 2021. The company said that halting Russian operations will cost it $50 million a month. Restaurant Brands International (owner of Burger King) will end corporate support for 800 locations in Russia and will not approve any additional investment or expansion. Starbucks is closing all of its locations in Russia. Transportation UPS, DHL, and FedEx have suspended operations in Russia and Belarus. Footnotes 1 The nickel price increase was compounded by a margin call on a major Chinese nickel producer that had accumulated a large short position through forward contracts in order to lock in a price for future delivery. 2 Palladium - Wikipedia 3 United States (USA) Exports, Imports, and Trade Partners | OEC - The Observatory of Economic Complexity 4 A New Report from IDC Looks at the Initial Impact of the Russia-Ukraine War on Global ICT Markets. 5 Which Companies Have Pulled Out of Russia? Here’s a List. - The New York Times (nytimes.com) and https://www.cnn.com/2022/03/02/business/companies-pulling-back-russia-ukraine-war-intl-hnk/index.html Recommended Allocation
Executive Summary The conflict in Ukraine will grind on until Kiev and the coastal cities fall and Russia is able to seat a government that will keep the country firmly within its sphere of influence. Rallies on slight hopes for an end to hostilities suggest that equities have more downside as they have yet to face up to the reality that the active military campaign has only begun. Surging energy prices imperil Europe’s expansion, but the net impact on the US economy will likely be modest, as increased employment and investment in the oil patch and better performance from high-yield borrowers offset higher gasoline prices. The US economy has enough momentum that it will be able to grow well above trend despite intensified inflation pressures from the Ukraine conflict. As US growth holds up, so too should S&P 500 earnings. Equities’ downside will be determined by how much P/E multiples contract. Though we expect additional near-term de-rating, we expect the market’s forward multiple will be resilient given the lack of positive-real-return alternatives. War Headwind Trumps Discount Rate Tailwind (For Now)
War Headwind Trumps Discount Rate Tailwind (For Now)
War Headwind Trumps Discount Rate Tailwind (For Now)
Bottom Line: We do not think equities have bottomed, but we expect that they will generate a positive real return between now and the rest of the year. Feature All Ukraine, all the time has been the story since Russia invaded on February 24th. The headlines on the front page, the gyrations in financial markets and the internet’s perpetual loop of images from embattled cities and villages have kept the conflict front and center. Our daily meeting has revolved around updates from the ground, discussions of diplomatic moves and countermoves and the evolution of market and economic impacts. An investor could be forgiven for feeling nostalgic about the halcyon pre-invasion days when equity markets fixated on the pace of rate hikes and what they might mean for stocks with high P/E multiples. Until those days return, investors will have to figure out how to manage their way through the multiple issues raised by the conflict. We devote this week’s report to the most pressing questions that have emerged in our discussions with colleagues and other investment professionals. We don’t know how the various issues will turn out, but we offer our current thinking on the way events may impact the economy and financial markets. Conditions are evolving rapidly and we’ll change our minds as the flow of events changes but we hold tight to the central idea that markets are hoping in vain that a ceasefire might be reached before Kiev is overrun. The Military Campaign Q: How do you see the military campaign progressing? Ukrainian forces seem to be holding their own; has that changed your view of the end game? Our Geopolitical Strategy team cautions against reading too much into the plodding pace of the Russian advance. The Ukrainian military has acquitted itself well against a better endowed opponent, but the Russians still have an overwhelming advantage and show no sign of abandoning their goal. BCA continues to expect that Russia’s offensive will proceed until Kiev is captured and a pro-Russian government is installed. Russian leadership wants a buffer between NATO and its border, and it will sacrifice its own economy and inflict unlimited devastation on Ukraine to get it. Our base-case scenario is that the full fury of the fighting will continue until Russia controls the eastern half of Ukraine and its southern coast, effectively partitioning the country into a Russian east and south and a Ukrainian west. It is possible that Russia may move to take the entire country, though it seems that would be more trouble than it’s worth. Given the commitment Ukrainians have already shown to their country, stifling the resistance in the territory Russia must have (east of the Dnieper and along the coast) looks like it will be a tall order (Map 1). In our base case, the war will end once redrawn political borders allow for a new Cold War equilibrium, but the road to that new steady state may contain several twists and turns. Map 1Redrawing The Borders
Q&A On Ukraine, Financial Markets And The Economy
Q&A On Ukraine, Financial Markets And The Economy
Q: How long do you think it will take to get to that steady state? Our Geopolitical Strategy team judges that Russian forces ought to be able to complete their mission of capturing Kiev in a matter of weeks or months and Ukraine’s coastal territory within half a year. While it appears that the victors face a determined ongoing insurgency, the clash between official forces will likely conclude by the end of the summer. We expect that Russia will move for a ceasefire once its objectives are met and a de facto partitioning of Ukraine could be accomplished by this time next year. Global investors will not wait for a full resolution before turning their attention elsewhere, but they will remain highly sensitive to any sign that the war will encompass more than Ukraine. Until Kiev falls, the risk of a broader conflict will remain high as Russia will attempt to cow all interested parties to hasten the inevitable. Conquering all of Ukraine would imply an extension of the war beyond our base-case scenario and our hypothetical timeline assumes that Russia does not attempt it because it doesn’t yet have enough boots on the ground to pull it off. The Russians will have their hands full with policing the rest of the country and the existence of a buffer zone between occupied territory east of Kiev and NATO territory on the Poland-Ukraine border may suit everyone’s interests. It will help reduce the probability of an accident that could turn into a battlefield face-off between Russia and NATO. A wider and potentially open-ended conflict would appear to be especially unwelcome from Russia’s perspective, given the way its economy is already buckling under sanctions. Involvement in a shooting war with the country holding the world’s second-largest nuclear arsenal is not in the West’s interests, either. The US and NATO have scrupulously avoided crossing the red line of direct involvement in Ukraine. Despite Ukrainian pleas, the American-European coalition will not impose a no-fly zone which could lead to head-to-head aerial combat, and no one would touch last week’s hot potato of providing Poland’s fleet of Soviet-era fighter planes to Ukraine. As heart-rending as it may be, the West is clearly willing to allow a partial conquest of Ukraine. We find it telling that Russia hasn’t extended the fight beyond the existing theater – hackers have yet to cut off access to our US-based team member’s checking and brokerage accounts or play havoc with the electric grid – and both sides’ revealed desire to limit the conflict supports our base case that they ultimately will. European anxiety will linger at Cold War-era levels, but the immediate risk of a larger conventional war on the continent should be limited once Russia neutralizes Ukraine. US Economic Impacts Q: How likely is the oil shock to tip the US economy into a recession? Chart 1Previous Shocks Have Heralded Recessions ...
Previous Shocks Have Heralded Recessions ...
Previous Shocks Have Heralded Recessions ...
It took seven years for prices to grow tenfold in the decade marked by the Arab state oil embargo and the Iranian revolution, but only ten months for prices to surge 500% from the pandemic bottom in the spring of 2020. On an annual-change basis, the current move is twice as large as any past oil shocks. Sudden surges in oil prices have historically been precursors of recessions (Chart 1). The EU, Japan and oil-importing emerging countries may face dire economic consequences, but the US is relatively better positioned. The production of one unit of US GDP today requires a third of the amount of oil it did in the 1970s (Chart 2). All developed economies have benefitted from the technological progress and the shift away from manufacturing to services that has enabled a more efficient use of oil, but its status as the world’s largest oil producer separates the US from its peers in terms of its vulnerability to rising energy prices. For the first time since the EIA started reporting petroleum import and export data, the US became a net exporter of oil in 2020 and 2021 (Chart 3). Increased prices incentivize higher oil production and lift export revenues (curbs on Russian imports have the potential to increase global demand for US oil). These dynamics, in turn, lead to increased CAPEX and higher employment (Chart 4) when oil prices rise, along with marginally better credit performance, given that the energy sector is heavily represented in high-yield bond indices. Chart 2... But Oil Intensity Has Fallen ...
... But Oil Intensity Has Fallen ...
... But Oil Intensity Has Fallen ...
Chart 3... Along With Import Dependency
... Along With Import Dependency
... Along With Import Dependency
There is a risk, however, that rising energy prices will push long-term inflation expectations higher and force the Fed to become more hawkish. They could also weigh on future consumption, as the dismal University of Michigan Consumer Sentiment Survey suggests. US households are well positioned to navigate higher inflation and higher interest rates nonetheless. A tight labor market is lifting income, particularly at the lower end of the wage distribution, while stimulus checks have allowed households to significantly reduce their level of indebtedness and amass large savings cushions. Rising wealth from financial market and home price advances will further support consumption. Chart 4Capex And Jobs Move With Prices
... Along With Import Dependency
... Along With Import Dependency
Q: How worried are you about a growth shortfall this year? The Ukrainian conflict will unleash a spate of indirect economic effects by interfering with the supply of commodities in markets that were already quite tight. In additional to persistently high energy prices, we can expect higher prices for base metals, aluminum, steel, wheat, corn and perhaps semiconductors, as Ukraine is an important source for neon that is essential to one aspect of the chip manufacturing process. Widespread increases in input prices could give inflation an additional spur and therefore have the potential to dent consumer confidence while encouraging the Fed to tighten monetary policy more than it otherwise might. Although today’s macro backdrop has more stagflationary elements than it has had in decades, we think the US will escape its grip. Regarding consumers, we reiterate our view that they are unusually well positioned to overcome higher prices at the pump. They have built up an enormous pandemic savings cushion (largely concentrated among the bottom 70% of taxpayers who qualified for the full share of economic impact payments and the lower-income service workers who bore the brunt of job losses), seen the value of their homes rise at a rapid clip (nearly two-thirds of households own their own homes) and benefitted from robust advances in financial markets (largely reserved to households at the top of the wealth scale). Voluntary debt paydowns and rock-bottom interest rates have combined to make their debt servicing burden as light as it’s ever been in the four decades that it’s been tracked (Chart 5). Higher gasoline prices are not going to unleash a paradox-of-thrift vicious circle. Chart 5A Light Yoke
A Light Yoke
A Light Yoke
The labor market is also poised to support consumption. Nonfarm payrolls are not likely to continue to expand at their 560 thousand a month clip since the start of 2021 (Chart 6), but the NFIB survey (Chart 7, top panel) and the record-high job-openings-to-unemployed ratio (Chart 7, bottom panel) indicate that businesses are still hunting for workers. The good times won’t last forever, but we maintain our view that the US economy will grow well above its 2% (inflation-adjusted) trend level this year. It has a lot of momentum, consumers have a lot of dry powder and COVID infections are dwindling by the day (Chart 8). Chart 6Job Gains Will Slow ...
Job Gains Will Slow ...
Job Gains Will Slow ...
Chart 7... But They Won't Stop
... But They Won't Stop
... But They Won't Stop
Chart 8Omigone
Omigone
Omigone
Tighter monetary policy could cool things off, but it works with a lag and rate hikes will take a while to take effect. We endorse our US Bond Strategy colleagues’ projection of a 25-basis-point hike in the target fed funds rate at each of this year’s seven remaining FOMC meetings. That would get fed funds up to 1⅞% by year end, but the hikes would not fully filter through the economy until the second half of 2023, after a lag of six to twelve months. BCA estimates that the fed funds rate will have to exceed 3% before monetary policy begins to restrain activity. US Market Impacts Q: How much more can equities decline? Following on from the discussion of the previous growth question, we think the S&P 500 can live up to less-than-demanding consensus 2022 earnings per share (EPS) expectations. 4Q21 index EPS were $54.14 but are projected to be just $51.55 this quarter, a nearly 5% sequential decline. For the full year, 2022 S&P 500 EPS are projected to be $225.68, 4% above 4Q21’s annualized run rate ($54.14 x 4 = $216.56). Sequential declines outside of recessions are extremely unusual and a 4% four-quarter run-rate increase sets the expectations bar quite low (Chart 9). Chart 9A Low Bar
A Low Bar
A Low Bar
Chart 10Multiple Compression Has Squeezed Stocks
Multiple Compression Has Squeezed Stocks
Multiple Compression Has Squeezed Stocks
Most investors focus on year-over-year changes, and full-year 2022 earnings per share are expected to grow 8% versus 2021. That’s hardly a slam dunk in a decelerating economy, but the deceleration is coming from an extremely high level and it’s important to remember that earnings are measured in nominal dollars. With consensus 2022 real GDP growth and PCE price index estimates of 3.6% and 5%, respectively, nominal GDP is expected to grow 8.6%. If S&P 500 revenues grow in line with nominal GDP and buybacks shrink the index’s share count by 2-3%, 8% EPS growth is doable despite downward pressure on profit margins from rising wages and other input costs. The decline in the S&P 500 so far this year (Chart 10, top panel) has entirely been a function of multiple contraction. Forward four-quarter earnings expectations are 1% higher than they were at the start of the year (Chart 10, middle panel) but the multiple investors are willing to pay for them has dropped by 13%, from 21.7 to 18.8 (Chart 10, bottom panel). While we expect continued de-rating in the near term, we don’t foresee a decline of more than another 10% (below 17) unless the Ukraine conflict sparks a broader European war. There simply are no public market alternatives that offer investors a better chance of achieving positive real returns and historically low real interest rates would support a return to the 20s (Chart 11), where the forward multiple has lingered for most of the pandemic. Summing Up Chart 11Divergence
Divergence
Divergence
The ideas that underpinned our pre-Ukraine view of financial markets and the US economy still apply, even though the distribution of potential outcomes has widened. We still believe that a recession is very unlikely over the next twelve months. We continue to hold that monetary policy will remain stimulative into 2023, as the fed funds rate will end this year well shy of its neutral level. We continue to flag inflation as the greatest risk to our constructive twelve-month views. Against that backdrop, we expect that equities and credit will rally once the outlines of our base-case Ukraine scenario take shape: Russia seeks peace once it topples the elected Ukrainian government, NATO and Russia exchange heated words but do not engage on the battlefield, and a rump state in western Ukraine provides a buffer against potential NATO-Russia accidents. As those events occur, COVID disruptions abate, commodity prices stop exploding higher and base effects rein in CPI prints beginning in April, inflation will start to decelerate. That should help financial markets and consumers breathe a sigh of relief and help earnings multiples to recover enough to allow the S&P 500 to generate positive real returns over the rest of the year. We remain constructive on markets and the US economy over the next twelve months. Doug Peta, CFA Chief US Investment Strategist dougp@bcaresearch.com Jennifer Lacombe Associate Editor jenniferl@bcaresearch.com
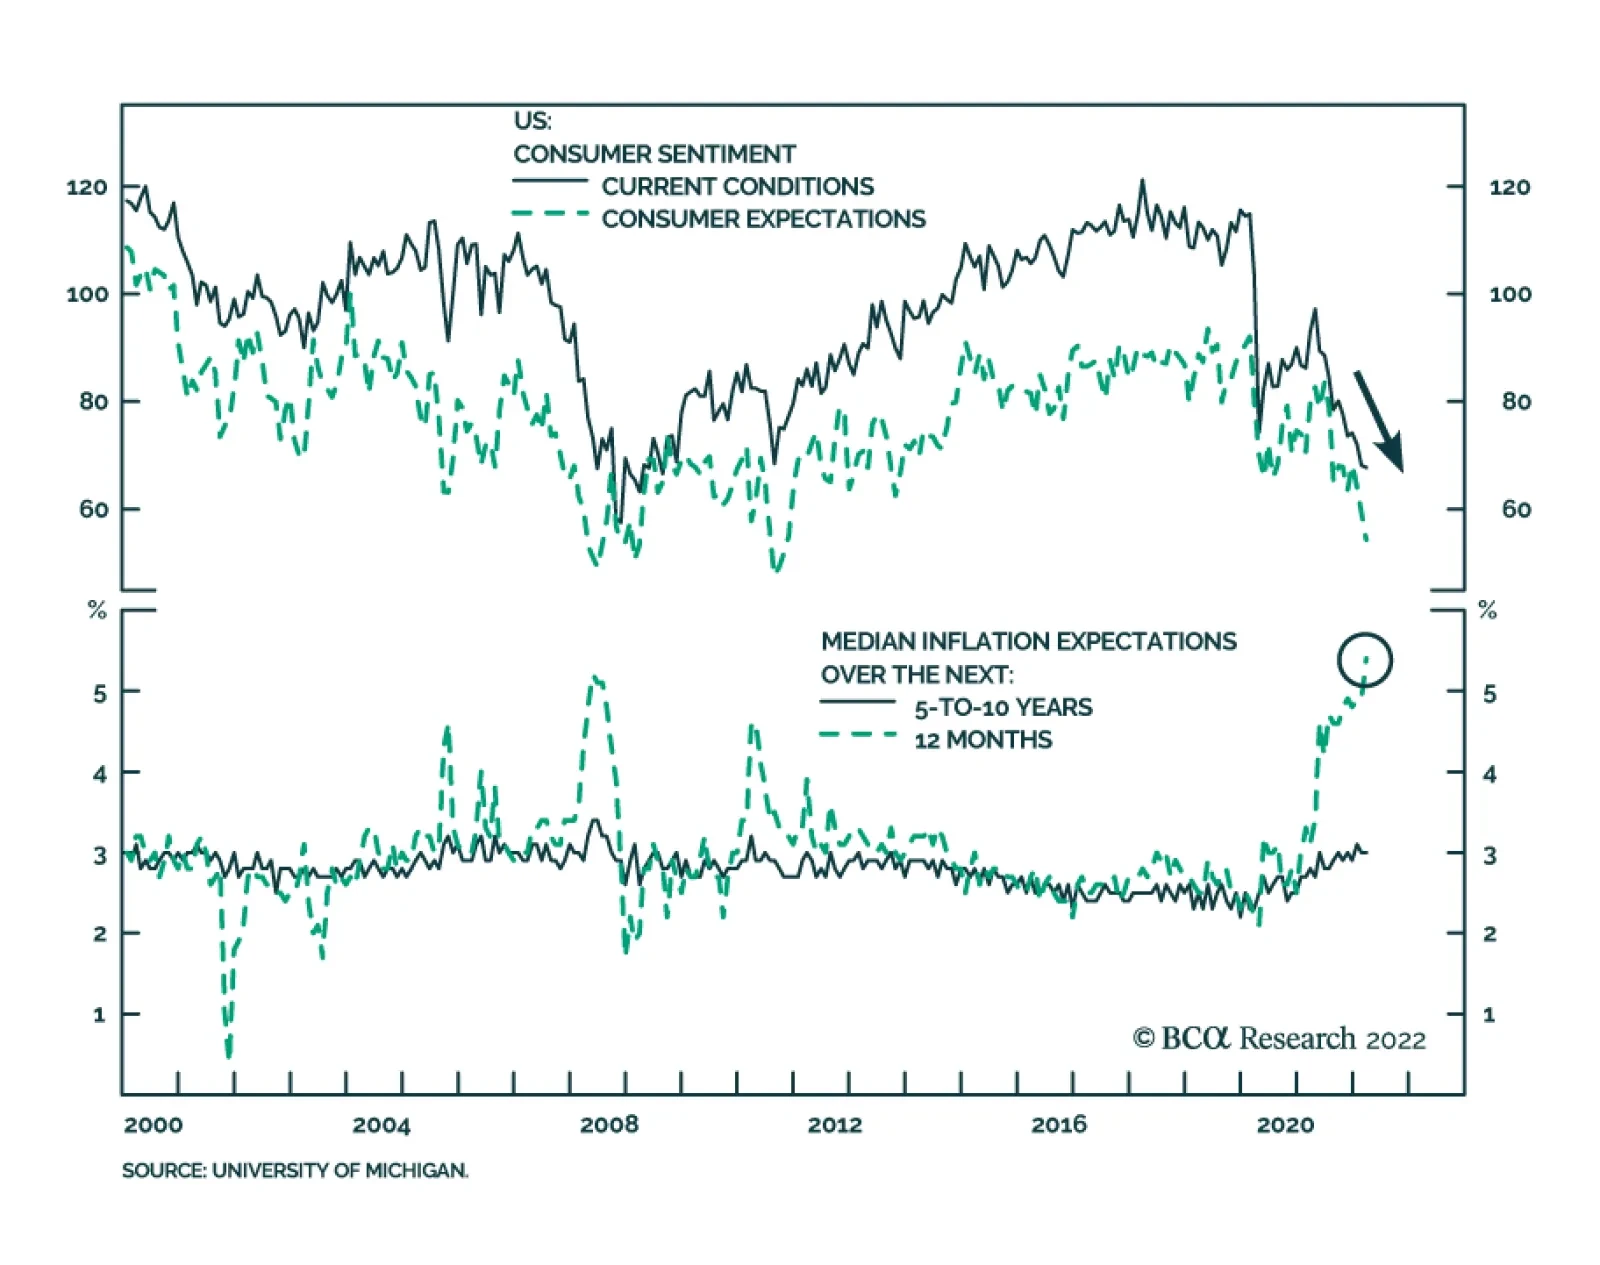
Price pressures are dampening the mood of American households. According to the preliminary release of the University of Michigan survey, consumer sentiment dropped 3.1 points to an 11-year low of 59.7 in March. This marks the third consecutive monthly…
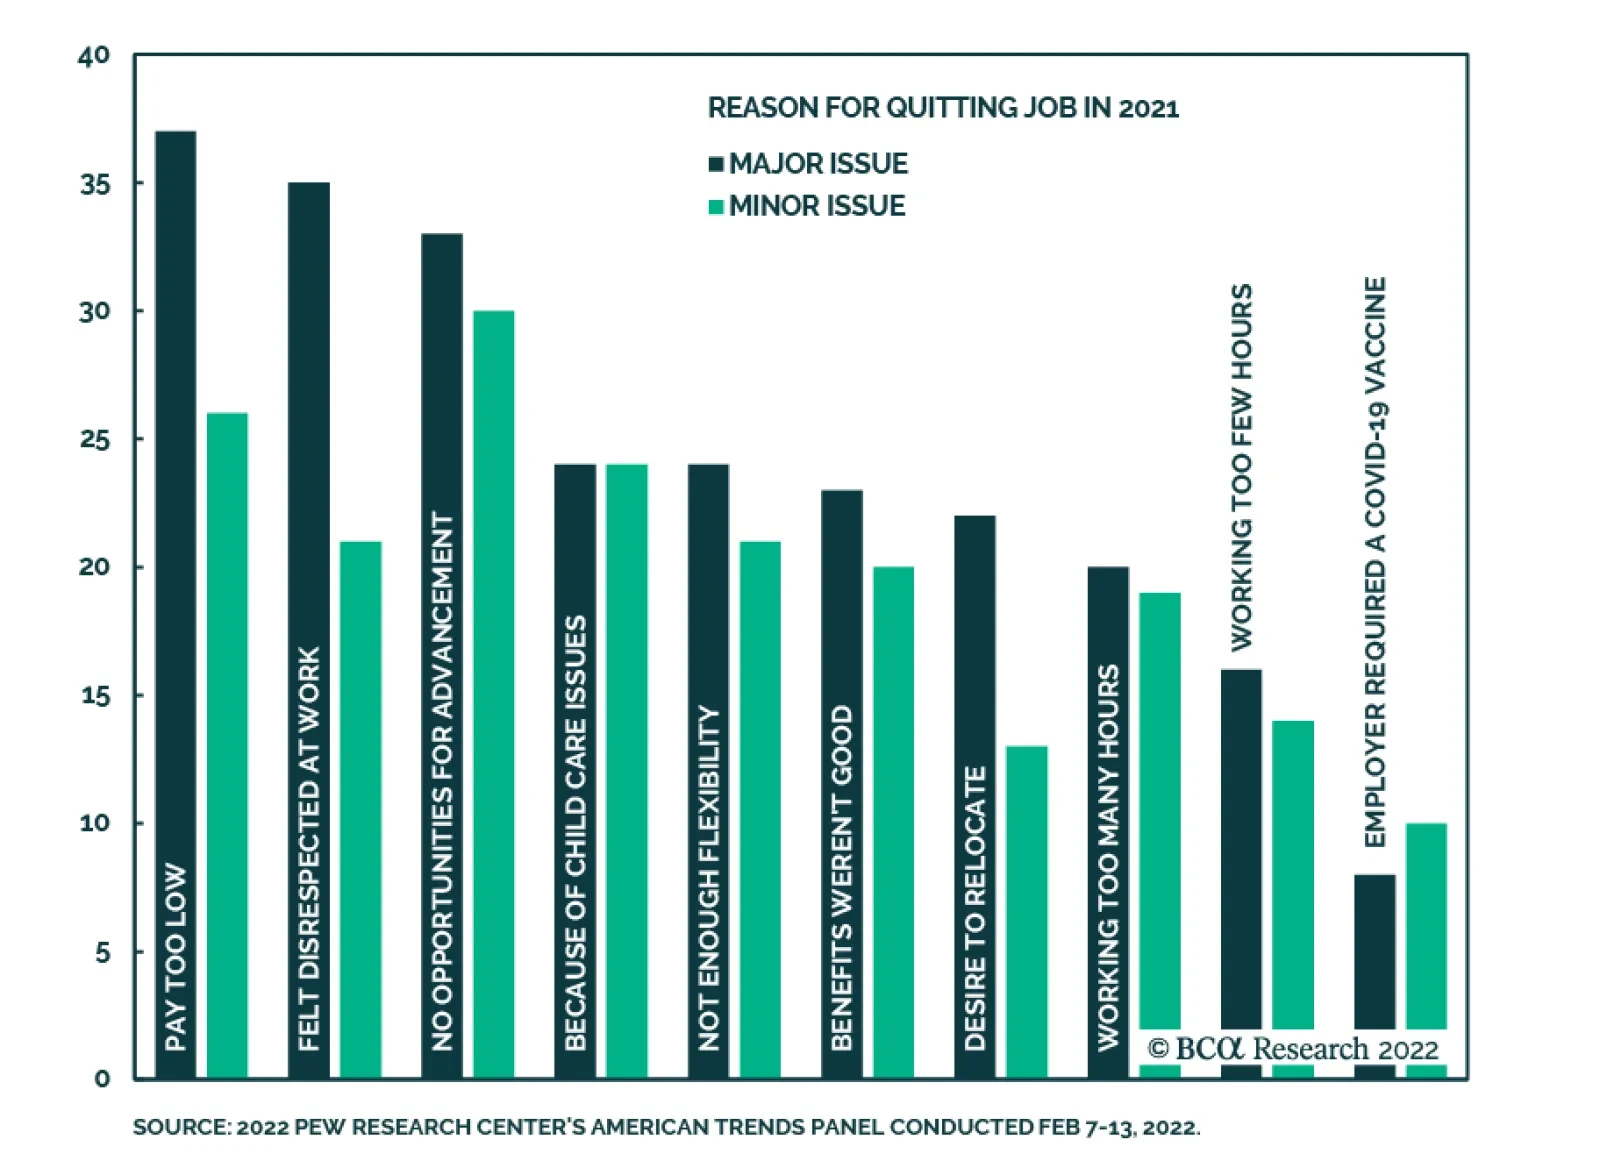
In an insight on Thursday we highlighted that the JOLTS and NFIB surveys continue to point to an extremely tight labor market in the US with job openings near all-time highs. The quits rate soared during the pandemic. While this dynamic is a signal that US…
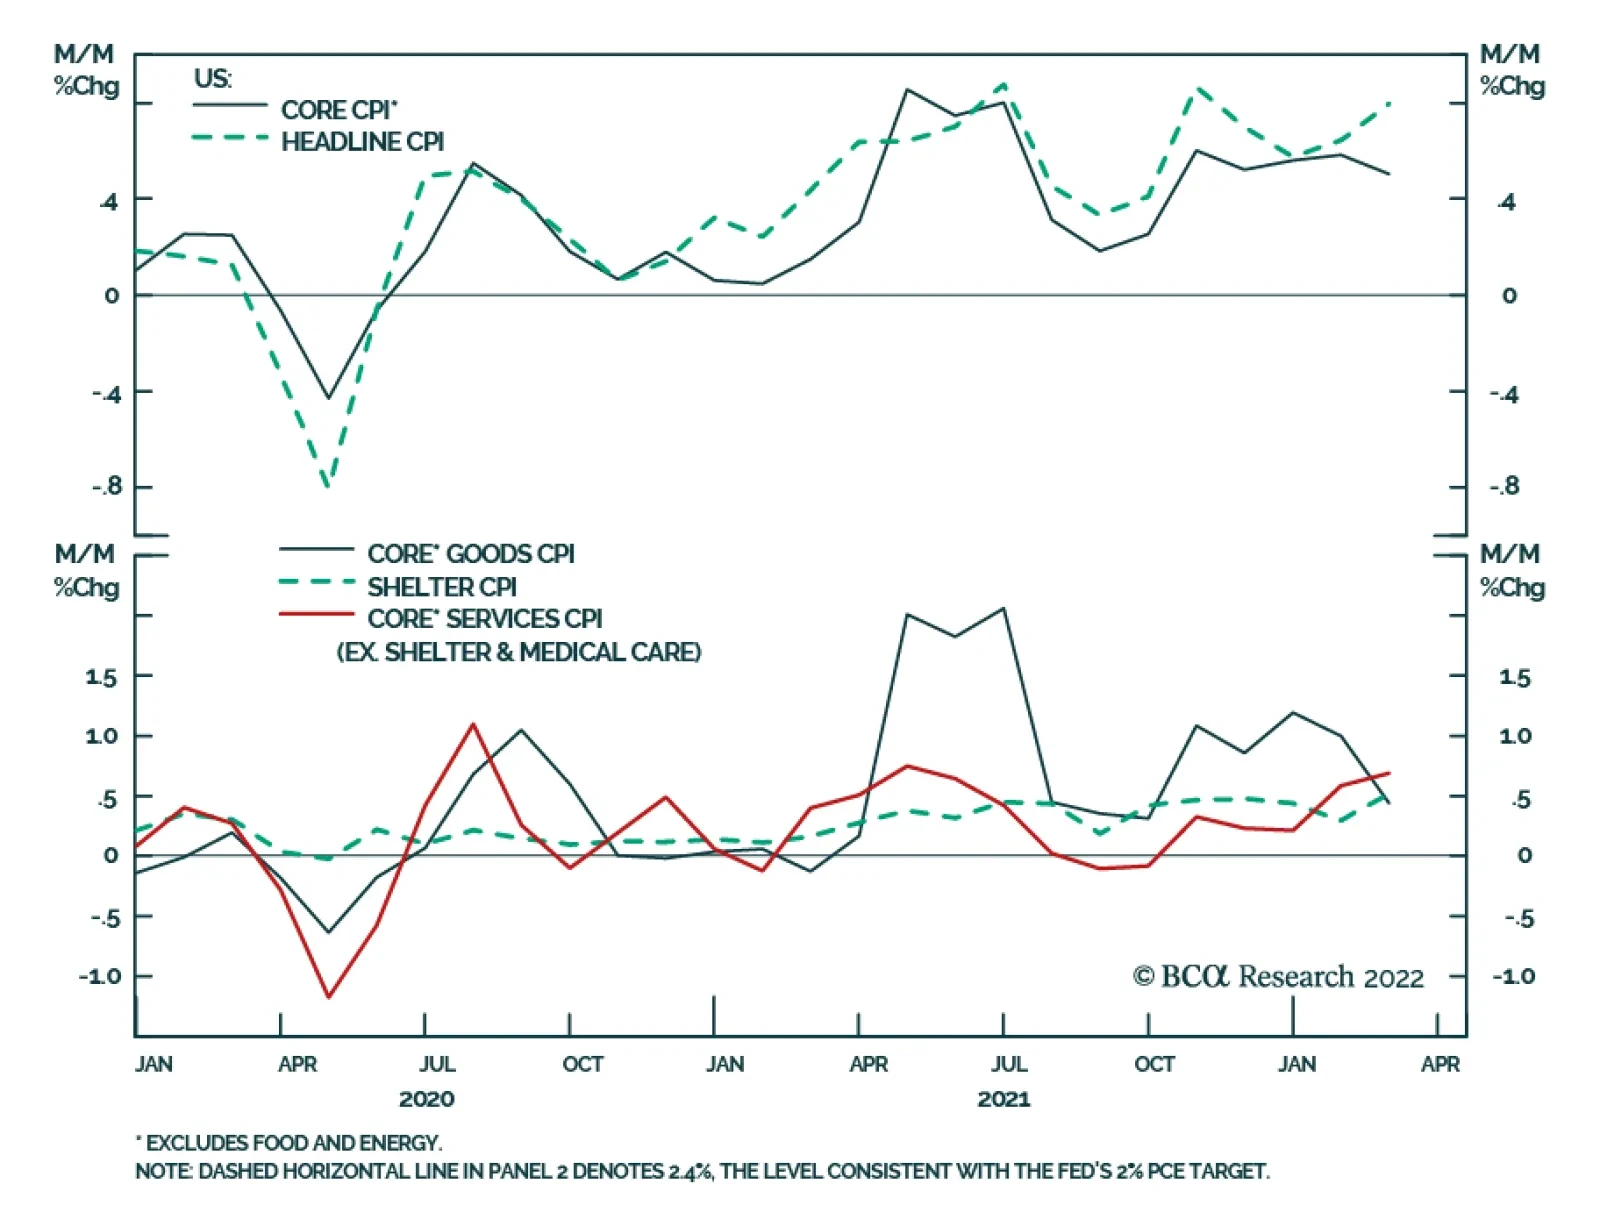
US CPI inflation accelerated in line with expectations in February. Headline inflation rose from 7.5% y/y in January to a fresh 40-year high of 7.9% y/y while core CPI grew 6.4% y/y following a 6.0% y/y increase. Headline inflation also advanced on a…