United States

Executive Summary Tight Inventories Spike Metals
Commodities' Watershed Moment
Commodities' Watershed Moment
Russia's war against Ukraine is a watershed moment, which will realign production, distribution and consumption of commodities globally. The development of new sources of the critical metals desperately needed to build out renewable energy grids and the drive to secure access to oil, gas and coal will intensify along political lines. China, reinforced by Russia, will lead the East, while the US and its allies will lead the West, in a redux of the Cold War. Local politics will intrude on this process, as left-of-center governments in important commodity-producing states secure their electoral victories and claim greater shares of commodity revenues. The rebuilding of defense systems, particularly in Europe, will compete with the renewable-energy transition. This will stress already-tight metals markets, where low inventories will predispose markets to higher volatility a la this week's oil, natgas and nickel price spikes. This will retard economic growth. In the short term, CO2 emissions will surge. Longer term, the transition to net-zero carbon emissions by 2050 will be pushed back years, as states compete for access to commodities. East-West trade restrictions and hoarding of commodities secured via trade within these respective blocs, as is occurring presently, will increase. Bottom Line: Russia's war against Ukraine is a watershed moment. The development of new sources of the critical metals desperately needed to build out renewable energy grids, and the drive to secure access to oil, gas and coal will intensify. China, reinforced by Russia, will lead the East, while the US and its allies will lead the West, in a redux of the Cold War. Feature Russia's war with Ukraine provoked a watershed moment for Europe: Leaders suddenly realized they had to reverse decades of energy dependence on Russia, rebuild their militaries, and sustain a massive buildout of the continent's renewable-energy generation and grid. This occurred as inventories of the basic commodities required to achieve all of these objectives were stretched so tight that the mere threat of the cutoff of pipeline natural gas was enough to send benchmark EU natgas prices to a record $113/MMBtu, up nearly 80% from the previous day's close before it settled back to still-elevated levels (Chart 1). Oil inventories also were stretched extremely thin even before Russia launched its invasion of Ukraine 24 February (Chart 2). The situation is not improving, since, in the wake of the Ukraine war, numerous refiners and trading companies now are observing self-imposed sanctions against taking any Russian oil or refined products. It is worthwhile remembering this began before the US and UK announced they would ban all imports of Russian material this week.1 This will stretch supply chains by unknow durations – the movement of crude from Russia to a refiner could take months instead of weeks, until new trade patterns are established. Chart 1Little Flex In EU Gas Inventories
Commodities' Watershed Moment
Commodities' Watershed Moment
Chart 2Little Flex In EU Gas Inventories
Little Flex In EU Gas Inventories
Little Flex In EU Gas Inventories
Global economic and policy uncertainty is massively elevated, with percent changes in oil and gas prices swinging on a double-digit basis daily. This makes it extremely difficult to bid or offer oil cargoes in the physical market or make markets (i.e., bid or offer) in the futures markets, which has the effect of compounding uncertainty and volatility. Fundamentals – supply, demand and inventories – take a back seat to fear and uncertainty in such markets. This makes it virtually impossible to assign a probability to any price outcomes based on supply and demand – the true definition of uncertainty in the Frank Knight sense – and to make long-term capex decisions over the long term.2 We raised our 2022 and 2023 Brent forecasts on the back of the massive uncertainty in the markets to $90/bbl and $85/bbl, respectively, right after Russia's invasion of Ukraine. We assume 1Q22 Brent will average $100/bbl. We expect core OPEC 2.0 producers – Saudi Arabia, UAE and Kuwait – will increase production beginning in 2Q22; US shale-oil output will rise, and ~ 1.2mm b/d of Iranian production will return to market in 2H22. Among the risks to our forecasts are a failure by core OPEC 2.0 to lift output (we expect an announcement at the end of this month when the producer coalition meets); lower-than-expected US shale output, and a failure to resolve the Iran nuclear deal with the US. Our modeling indicated these outcomes could lift Brent to between $120/bbl and $140/bbl by 2023 (Chart 3). We will be updating our forecasts next week.3 Chart 3Brent Forwards Lift
Brent Forwards Lift
Brent Forwards Lift
EU's Watershed Metals Moment EU leadership is setting out to reverse decades of energy dependence on Russia, rebuild their militaries, and sustain a massive buildout of the continent's renewable-energy grid, all a result of the Ukraine war. This will require massive investment in metals mining and refining, along with steel-making capacity. Already, Germany is pledging to increase LNG import capacity and measures to reduce its dependence on Russian natural gas by 75% this year.4 The EU is looking to restore its natgas inventories to 90% of capacity before next winter, and has pledged to double down on renewables, in order to remove member-state dependence on Russian energy exports.5 These ambitious goals are up against the hard reality of scarce base metals supply globally. This will be exacerbated going forward by actions taken by and against Russia. The Russia-Ukraine crisis will destabilize metal markets, given supply uncertainty from Russia and its contribution to global supply. The commodities heavyweight constitutes 6%, 5% and 4% of global primary aluminum, refined nickel and copper production. Against the backdrop of very low global inventories in these metals (Chart 4), the prices of all three hit record highs over the last few days due to uncertain supply (Chart 5). LME nickel prices more than quadrupled on Tuesday as traders rushed to cover short positions and margin calls. Chart 4Low Inventories...
Low Inventories...
Low Inventories...
Chart 5...Lead To Price Volatility
...Lead To Price Volatility
...Lead To Price Volatility
Uncertainty has engulfed metal markets, with a Western ban on Russian metal imports still a possibility. Putin’s announcement regarding raw material export restrictions will further fuel supply uncertainty.6 As in the case of oil, private entities’ self-sanctioning, sanctions on the Russian financial system, and war-related supply chain disruptions are causing current Russian metal export disruptions.7 So far, Western sanctions on commodities have not directly interfered with metal flows from Russia. But markets are taking it day to day. Supply disruptions and sanctions force the formation of new trade patterns, as private entities aim to maximize arbitrage opportunities. For example, high European aluminum price spreads incentivized shipments from China, the world’s largest producer and consumer of refined aluminum. Normally, Europe relies on Russia for aluminum supplies. Rising European physical premiums for delivered metal, caused by Russian export disruptions, will see trading companies take advantage of arbitrage opportunities in other commodities as well. Europe's Risk Profile Rising Since the Ukraine war began, rising European physical premiums in commodities ranging from metals to natgas indicate the continent – more so than others – is particularly vulnerable to Russian export disruptions. Europe’s reliance on Russian energy and its supply disruptions will raise operating costs for smelters and refiners on the continent, threatening smelter shutdowns similar to those we saw this past winter. Markets were expecting power price relief over the warmer months and higher smelting activity. Elevated fuel and power prices, however, will constrain metals refining in Europe, and could shut or close even more smelters, keeping refined metals supply scarce and prices high. Rebuilding Europe's Defenses EU leaders are scheduled to take up a new energy and defense funding proposal today, which media reports are describing as "massive" (no detail provided ahead of the meeting, of course). This program reportedly will be akin to the EU's $2 trillion COVID-relief fund.8 The EU's fast response to defense shortfalls comes against the backdrop discussed above regarding super-tight metals markets, which now face a further complication of unpredictable local politics in metals-producing states. Some of these states have voted left-of-center governments into office, which now appear to be intent on nationalizing mining operations.9 Chile, e.g., accounts for ~ 30% of global copper ore output, and is in the process of re-writing its constitution, which will change tax and royalty law, and could pave the way for nationalization of copper and lithium mines. This political risk compounds any long-term planning operations by consumers like the EU and producers. Investment Implications Energy markets – broadly defined to include oil, gas and coal along with the base metals required for renewables and their supporting grids and electric vehicles – are being rocked by Russia's war with Ukraine. Base metals, in particular, will have to find price levels that destroy demand among competing uses, if the EU's dual-track plan to build out its renewables generation and restore a military capability is approved. A "massive" funding effort in Europe, coupled with equally massive efforts in the US and China – both intent on building out their renewable generation and grids, as well as expanding their defensive capabilities – will be extremely difficult to pull off. Critical base metals inventories remain low, and prices are high because demand exceeds supply for the foreseeable future (Chart 6). Chart 6Tight Inventories Spike Metals
Commodities' Watershed Moment
Commodities' Watershed Moment
The EU will join a world in which the other two great economic centers – the US and China – will engage in a geopolitical competition over access to and control of scarce base metals, oil, gas and coal resources. Russia will remain aggressive toward the West, at least until the Putin regime falls, and will play an ancillary role to China. Fossil fuels and base metals have been starved for capex for more than a decade. Governmental pronouncements will not reverse this. These markets will remain tight, and will get tighter in order to allocate increasingly scarce supply with rapidly growing demand. As such, we remain long commodity-index exposure (S&P GSCI and the COMT ETF), along with equity exposure to oil and gas producers via the XOP ETF, and the XME and PICK ETFs to retain exposure to base metals and bulks producers and traders. Robert P. Ryan Chief Commodity & Energy Strategist rryan@bcaresearch.com Ashwin Shyam Research Associate Commodity & Energy Strategy ashwin.shyam@bcaresearch.com Footnotes 1 Please see Russian tankers at sea despite ‘big unknown’ over who will buy oil, published by ft.com on March 7, 2022. 2 Please see Explained: Knightian uncertainty, published by mit.edu for discussion. 3 Please see Oil Risk Premium Abates, But Still Remains, which we published on February 25, 2022. 4 Please see Germany Revives LNG Import Plans to Cut Reliance on Russian Natural Gas in Marked Policy Shift, published by naturalgasintel.com on March 1, 2022. 5 Please see Climate change: EU unveils plan to end reliance on Russian gas, published by bbc.co.uk on March 8, 2022, and The EU plan to drastically ramp renewables to replace Russian gas, published by pv-magazine.com on March 9, 2022. 6 Please see Russia to Omit Raw Material Exports but Omits Details, published by Bloomberg on March 9, 2022. 7 Please see here for Which companies have stopped doing business with Russia? 8 Please see Ukraine: ECB governing council to meet as crisis intensifies, published on March 8, 2022 by greencentralbanking.com. 9 Please see Chile a step closer to nationalizing copper and lithium, published by mining.com on March 7, 2022, and Add Local Politics To Copper Supply Risks, which we published on November 25, 2021. Investment Views and Themes Recommendations Strategic Recommendations
Feature We are closing our overweight of the Energy sector, bringing the allocation back to neutral in the face of a great geopolitical uncertainty. We have outperformed the S&P 500 by 60% since we initiated the trade on the 22 of November 2021. The recent war in Ukraine has upended the energy market, lifting the geopolitical risk premium. With oil surging 45% since the beginning of the year, and 20% since the beginning of the war, the trade has turned into a geopolitical gamble, held hostage by the immediate actions of OPEC. The BCA Commodity & Energy strategy expects to see an increase in the oil supply by the US shale producers, Saudi Arabia, and Gulf states, which will bring Brent crude back to $85 by the second half of 2022. This is a consensus position in the market, which is reflected in the extremely backwardated energy futures curve. It is important to note, that while OPEC members can open the oil spigots immediately, it takes the US shale producers roughly six months to ramp up production. To do so, they need to increase their Capex. In our recent Special Report on the Energy sector, we posited that the industry is in the early innings of the new Capex cycle. To reflect this structural theme in our portfolio, we will remain overweight Energy Equipment & Services (E&S) sub-industry. Chart 1
CHART 1
CHART 1
Chart 2
CHART 2
CHART 2
Bottom Line: We close overweight in the Energy industry, bringing the weight back to the benchmark. We have locked in a 60% gain since the position’s inception. We remain overweight the Energy Equipment & Services industry, as a leveraged play on the energy Capex revival. We will revisit the sector once the fog of war dissipates.
Executive Summary On a tactical (3-month) horizon, the inflationary impulse from soaring energy and food prices combined with the choke on growth from sanctions will weigh on both the global economy and the global stock market. As such, bond yields could nudge higher, the global stock market has yet to reach its crisis bottom, and the US dollar will rally. But on a cyclical (12-month) horizon, the short-term inflationary impulse combined with sanctions will be massively demand-destructive, at which point the cavalry of lower bond yields will charge to the rescue. Therefore: Overweight the 30-year T-bond and the 30-year Chinese bond, both in absolute terms and relative to other 30-year sovereign bonds. Overweight equities. Overweight long-duration US equities versus short-duration non-US equities. Fractal trading watchlist: Brent crude oil, and oil equities versus banks equities. The DAX Has Sold Off ##br##Because It Expects Profits To Plunge…
The DAX Has Sold Off Because It Expects Profits To Plunge...
The DAX Has Sold Off Because It Expects Profits To Plunge...
…But The S&P 500 Has Sold Off ##br##Because The Long Bond Has Sold Off
...But The S&P 500 Has Sold Off Because The Long Bond Has Sold Off
...But The S&P 500 Has Sold Off Because The Long Bond Has Sold Off
Bottom Line: In the Ukraine crisis, the protection from lower bond yields and fiscal loosening will not come as quickly and as powerfully as it did during the pandemic. If anything, the fixation on inflation and sanctions may increase short-term pain for both the economy and the stock market, before the cavalry of lower bond yields ultimately charges to the rescue. Feature Given the onset of the largest military conflict in Europe since the Second World War, with the potential to escalate to nuclear conflict, you would have thought that the global stock market would have crashed. Yet since Russia’s full-scale invasion of Ukraine on February 24 to the time of writing, the world stock market is down a modest 4 percent, while the US stock market is barely down at all. Is this the stock market’s ‘Wile E Coyote’ moment, in which it pedals hopelessly in thin air before plunging down the chasm? Is this the stock market’s ‘Wile E Coyote’ moment, in which it pedals hopelessly in thin air before plunging down the chasm? Admittedly, since the invasion, European bourses have fallen – for example, Germany’s DAX by 10 percent. And stock markets were already falling before the invasion, meaning that this year the DAX is down 20 percent while the S&P 500 is down 12 percent. But there is a crucial difference. While the DAX year-to-date plunge is due to an expected full-blooded profits recession that the Ukraine crisis will unleash, the S&P 500 year-to-date decline is due to the sell-off in the long-duration bond (Chart I-1 and Chart I-2). This difference in drivers will also explain the fate of these markets as the crisis evolves, just as in the pandemic. Chart I-1The DAX Has Sold Off Because It Expects Profits To Plunge...
The DAX Has Sold Off Because It Expects Profits To Plunge...
The DAX Has Sold Off Because It Expects Profits To Plunge...
Chart I-2...But The S&P 500 Has Sold Off Because The Long Bond Has Sold Off
...But The S&P 500 Has Sold Off Because The Long Bond Has Sold Off
...But The S&P 500 Has Sold Off Because The Long Bond Has Sold Off
During The Pandemic, Central Banks And Governments Saved The Day… We can think of a stock market as a real-time calculator of the profits ‘run-rate.’ In this regard, the real-time stock market is several weeks ahead of analysts, whose profits estimates take time to collect, collate, and record. For example, during the pandemic, the stock market had already discounted a collapse in profits six weeks before analysts’ official estimates (Chart I-3 and Chart I-4). Chart I-3The German Stock Market Is Several Weeks Ahead Of Analysts
The German Stock Market Is Several Weeks Ahead Of Analysts
The German Stock Market Is Several Weeks Ahead Of Analysts
Chart I-4The US Stock Market Is Several Weeks Ahead ##br##Of Analysts
The US Stock Market Is Several Weeks Ahead Of Analysts
The US Stock Market Is Several Weeks Ahead Of Analysts
We can also think of a stock market as a bond with a variable rather than a fixed income. Just as with a bond, every stock market has a ‘duration’ which establishes which bond it most behaves like when bond yields change. It turns out that the long-duration US stock market has the same duration as a 30-year bond, while the shorter-duration German stock market has the same duration as a 7-year bond. Pulling this together, and assuming no change to the very long-term structural growth story, we can say that: The US stock market = US profits multiplied by the 30-year bond price (Chart I-5 and Chart I-6). The German stock market = German profits multiplied by the 7-year bond price (Chart I-7 and Chart I-8). Chart I-5US Profits Multiplied By The 30-Year Bond Price...
US Profits Multiplied By The 30-Year Bond Price...
US Profits Multiplied By The 30-Year Bond Price...
Chart I-6...Equals The US Stock Market
...Equals The US Stock Market
...Equals The US Stock Market
Chart I-7German Profits Multiplied By The 7-Year Bond Price...
German Profits Multiplied By The 7-Year Bond Price...
German Profits Multiplied By The 7-Year Bond Price...
Chart I-8...Equals The German Stock Market
...Equals The German Stock Market
...Equals The German Stock Market
When bond yields rise – as happened through December and January – the greater scope for a price decline in the long-duration 30-year bond will hurt the US stock market both absolutely and relatively. But when bond yields decline – as happened at the start of the pandemic – this same high leverage to the 30-year bond price can protect the US stock market. When bond yields decline, the high leverage to the 30-year bond price can protect the US stock market. During the pandemic, the 30-year T-bond price surged by 35 percent, which more than neutralised the decline in US profits. Supported by this surge in the 30-year bond price combined with massive fiscal stimulus that underpinned demand, the pandemic bear market lasted barely a month. What’s more, the US stock market was back at an all-time high just four months later, much quicker than the German stock market. …But This Time The Cavalry May Take Longer To Arrive Unfortunately, this time the rescue act may take longer. One important difference is that during the pandemic, governments quickly unleashed tax cuts and stimulus payments to shore up demand. Whereas now, they are unleashing sanctions on Russia. This will choke Russia, but will also choke demand in the sanctioning economy. Another crucial difference is that as the pandemic took hold in March 2020, the Federal Reserve slashed the Fed funds rate by 1.5 percent. But at its March 2022 meeting, the Fed will almost certainly raise the interest rate (Chart I-9). Chart I-9As The Pandemic Took Hold, The Fed Could Slash Rates. Not Now.
As The Pandemic Took Hold, The Fed Could Slash Rates. Not Now.
As The Pandemic Took Hold, The Fed Could Slash Rates. Not Now.
As the pandemic was unequivocally a deflationary shock at its outset, it was countered with a massive stimulatory response from both central banks and governments. In contrast, the Ukraine crisis has unleashed a new inflationary shock from soaring energy and food prices. And this on top of the pandemic’s second-round inflationary effects which have already dislocated inflation into uncomfortable territory. Our high conviction view is that this inflationary impulse combined with sanctions will be massively demand-destructive, and thereby ultimately morph into a deflationary shock. Yet the danger is that myopic policymakers and markets are not chess players who think several moves ahead. Instead, by fixating on the immediate inflationary impulse from soaring energy and food prices, they will make the wrong move. In the Ukraine crisis, the big risk is that the protection from lower bond yields and fiscal loosening will not come as quickly and as powerfully as it did during the pandemic. If anything, the fixation on inflation and sanctions may increase short-term pain for both the economy and the stock market. Compared with the pandemic, both the sell-off and the recovery will take longer to play out. In the Ukraine crisis, the big risk is that the protection from lower bond yields and fiscal loosening will not come as quickly and as powerfully as it did during the pandemic. One further thought. The Ukraine crisis has ‘cancelled’ Covid from the news and our fears, as if it were just a bad dream. Yet the virus has not disappeared and will continue to replicate and mutate freely. Probably even more so, now that we have dismissed it, and Europe’s largest refugee crisis in decades has given it a happy hunting ground. Hence, do not dismiss another wave of infections later this year. The Investment Conclusions Continuing our chess metaphor, a tactical investment should consider only the next one or two moves, a cyclical investment should be based on the next five moves, while a long-term structural investment (which we will not cover in this report) should visualise the board after twenty moves. All of which leads to several investment conclusions: On a tactical (3-month) horizon, the inflationary impulse from soaring energy and food prices combined with the choke on growth from sanctions will weigh on both the global economy and the global stock market. As such, bond yields could nudge higher, the global stock market has yet to reach its crisis bottom, and the US dollar will rally (Chart I-10). Chart I-10When Stock Markets Sell Off, The Dollar Rallies
When Stock Markets Sell Off, The Dollar Rallies
When Stock Markets Sell Off, The Dollar Rallies
But on a cyclical (12-month) horizon, the short-term inflationary impulse combined with sanctions will be massively demand-destructive, at which point the cavalry of lower bond yields will charge to the rescue. Therefore: Overweight the 30-year T-bond and the 30-year Chinese bond, both in absolute terms and relative to other 30-year sovereign bonds. Overweight equities. Overweight long-duration US equities versus short-duration non-US equities. How Can Fractal Analysis Help In A Crisis? When prices are being driven by fundamentals, events and catalysts, as they are now, how can fractal analysis help investors? The answer is that it can identify when a small event or catalyst can have a massive effect in reversing a trend. In this regard, the extreme rally in crude oil has reached fragility on both its 65-day and 130-day fractal structures. Meaning that any event or catalyst that reduces fears of a supply constraint will cause an outsized reversal (Chart I-11). Chart I-11The Extreme Rally In Crude Oil Is Fractally Fragile
The Extreme Rally In Crude Oil Is Fractally Fragile
The Extreme Rally In Crude Oil Is Fractally Fragile
Equally interesting, the huge outperformance of oil equities versus bank equities is reaching the point of fragility on its 260-day fractal structure that has reliably signalled major switching points between the sectors (Chart I-12). Given the fast-moving developments in the crisis, we are not initiating any new trades this week, but stay tuned. Chart I-12The Huge Outperformance Of Oil Equities Versus Banks Equities Is Approaching A Reversal
The Huge Outperformance Of Oil Equities Versus Banks Equities Is Approaching A Reversal
The Huge Outperformance Of Oil Equities Versus Banks Equities Is Approaching A Reversal
Fractal Trading Watchlist Biotech To Rebound
Biotech Is Starting To Reverse
Biotech Is Starting To Reverse
US Healthcare Vs. Software Approaching A Reversal
US Healthcare Vs. Software Approaching A Reversal
US Healthcare Vs. Software Approaching A Reversal
Norway's Outperformance Could End
Norway's Outperformance Could End
Norway's Outperformance Could End
Greece’s Brief Outperformance To End
Greece Is Snapping Back
Greece Is Snapping Back
Dhaval Joshi Chief Strategist dhaval@bcaresearch.com Fractal Trading System Fractal Trades
Are We In A Slow-Motion Crash?
Are We In A Slow-Motion Crash?
Are We In A Slow-Motion Crash?
Are We In A Slow-Motion Crash?
6-Month Recommendations Structural Recommendations Closed Fractal Trades Indicators To Watch - Bond Yields Chart II-1Indicators To Watch - Bond Yields ##br##- Euro Area
Indicators To Watch - Bond Yields - Euro Area
Indicators To Watch - Bond Yields - Euro Area
Chart II-2Indicators To Watch - Bond Yields ##br##- Europe Ex Euro Area
Indicators To Watch - Bond Yields - Europe Ex Euro Area
Indicators To Watch - Bond Yields - Europe Ex Euro Area
Chart II-3Indicators To Watch - Bond Yields ##br##- Asia
Indicators To Watch - Bond Yields - Asia
Indicators To Watch - Bond Yields - Asia
Chart II-4Indicators To Watch - Bond Yields ##br##- Other Developed
Indicators To Watch - Bond Yields - Other Developed
Indicators To Watch - Bond Yields - Other Developed
Indicators To Watch - Interest Rate Expectations Chart II-5Indicators To Watch - Interest Rate Expectations
Indicators To Watch - Interest Rate Expectations
Indicators To Watch - Interest Rate Expectations
Chart II-6Indicators To Watch - Interest Rate Expectations
Indicators To Watch - Interest Rate Expectations
Indicators To Watch - Interest Rate Expectations
Chart II-7Indicators To Watch - Interest Rate Expectations
Indicators To Watch - Interest Rate Expectations
Indicators To Watch - Interest Rate Expectations
Chart II-8Indicators To Watch - Interest Rate Expectations
Indicators To Watch - Interest Rate Expectations
Indicators To Watch - Interest Rate Expectations
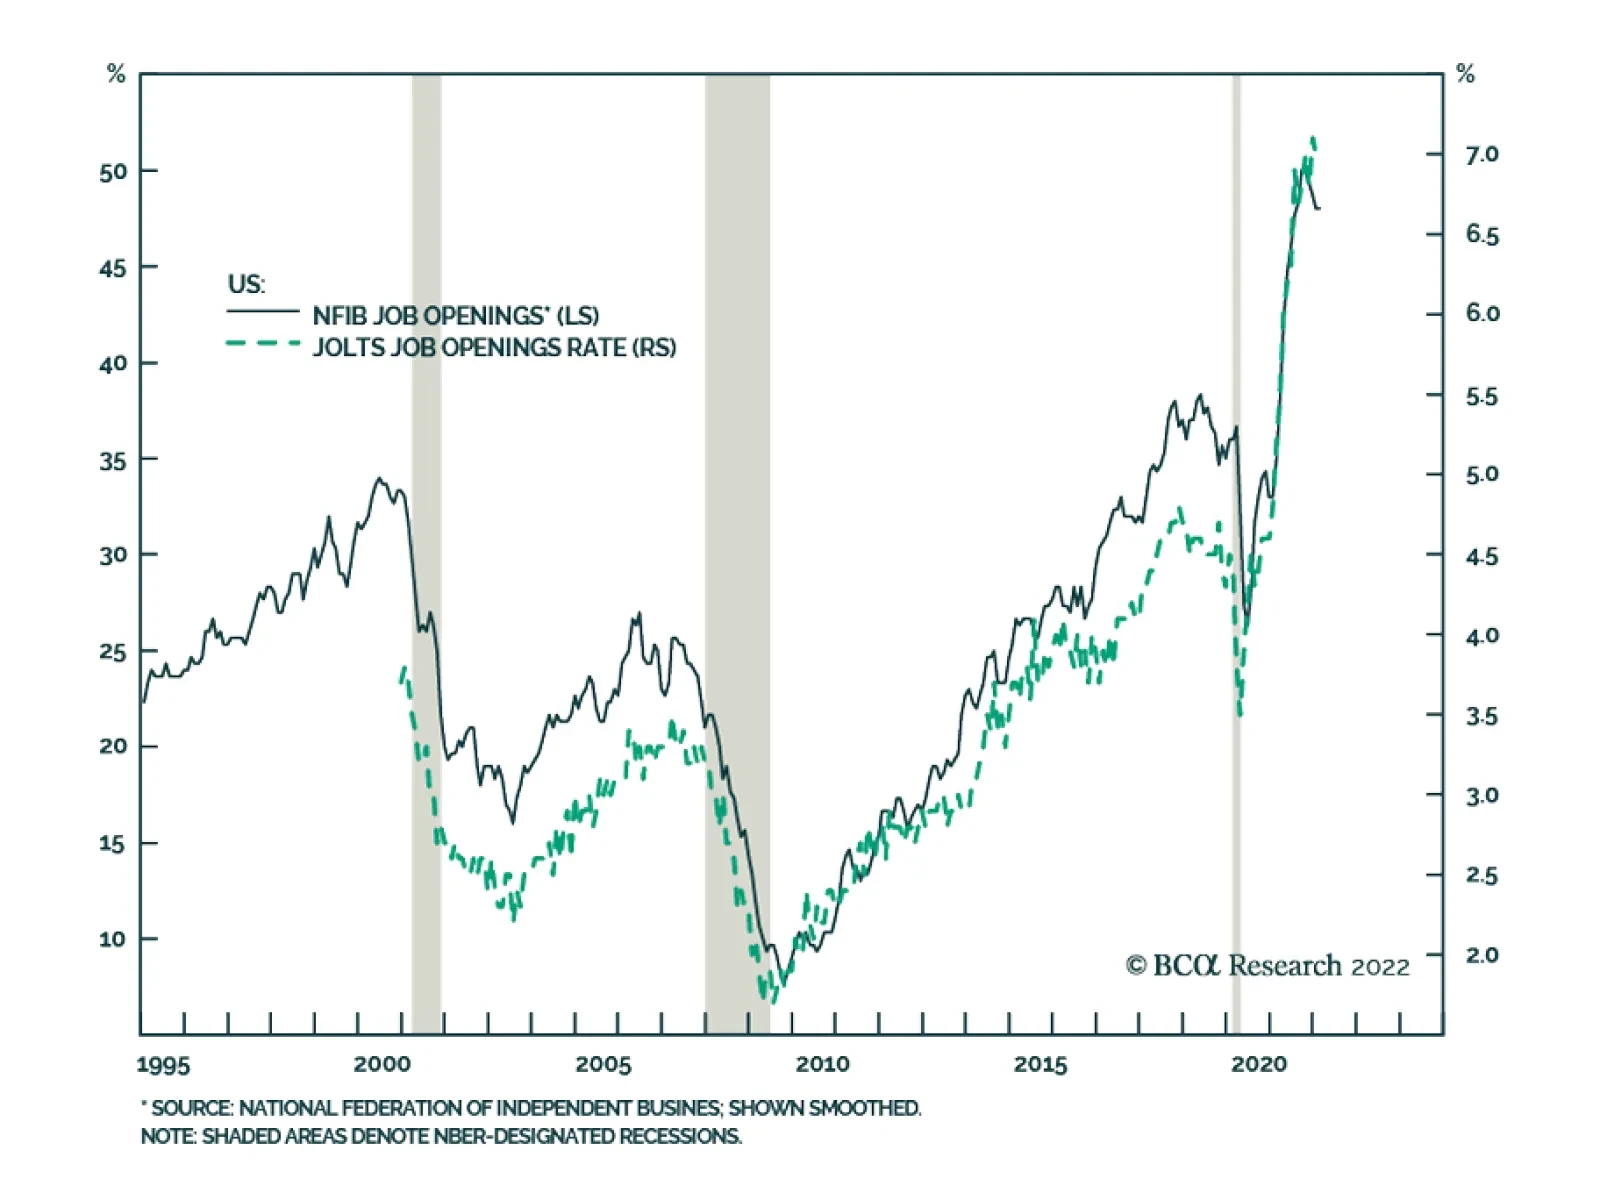
While the conflict in Ukraine remains a source of volatility for financial markets over the near-term, US economic growth is likely to remain well supported this year. The US economy is much less dependent on Russian commodity supplies than the Euro Area…
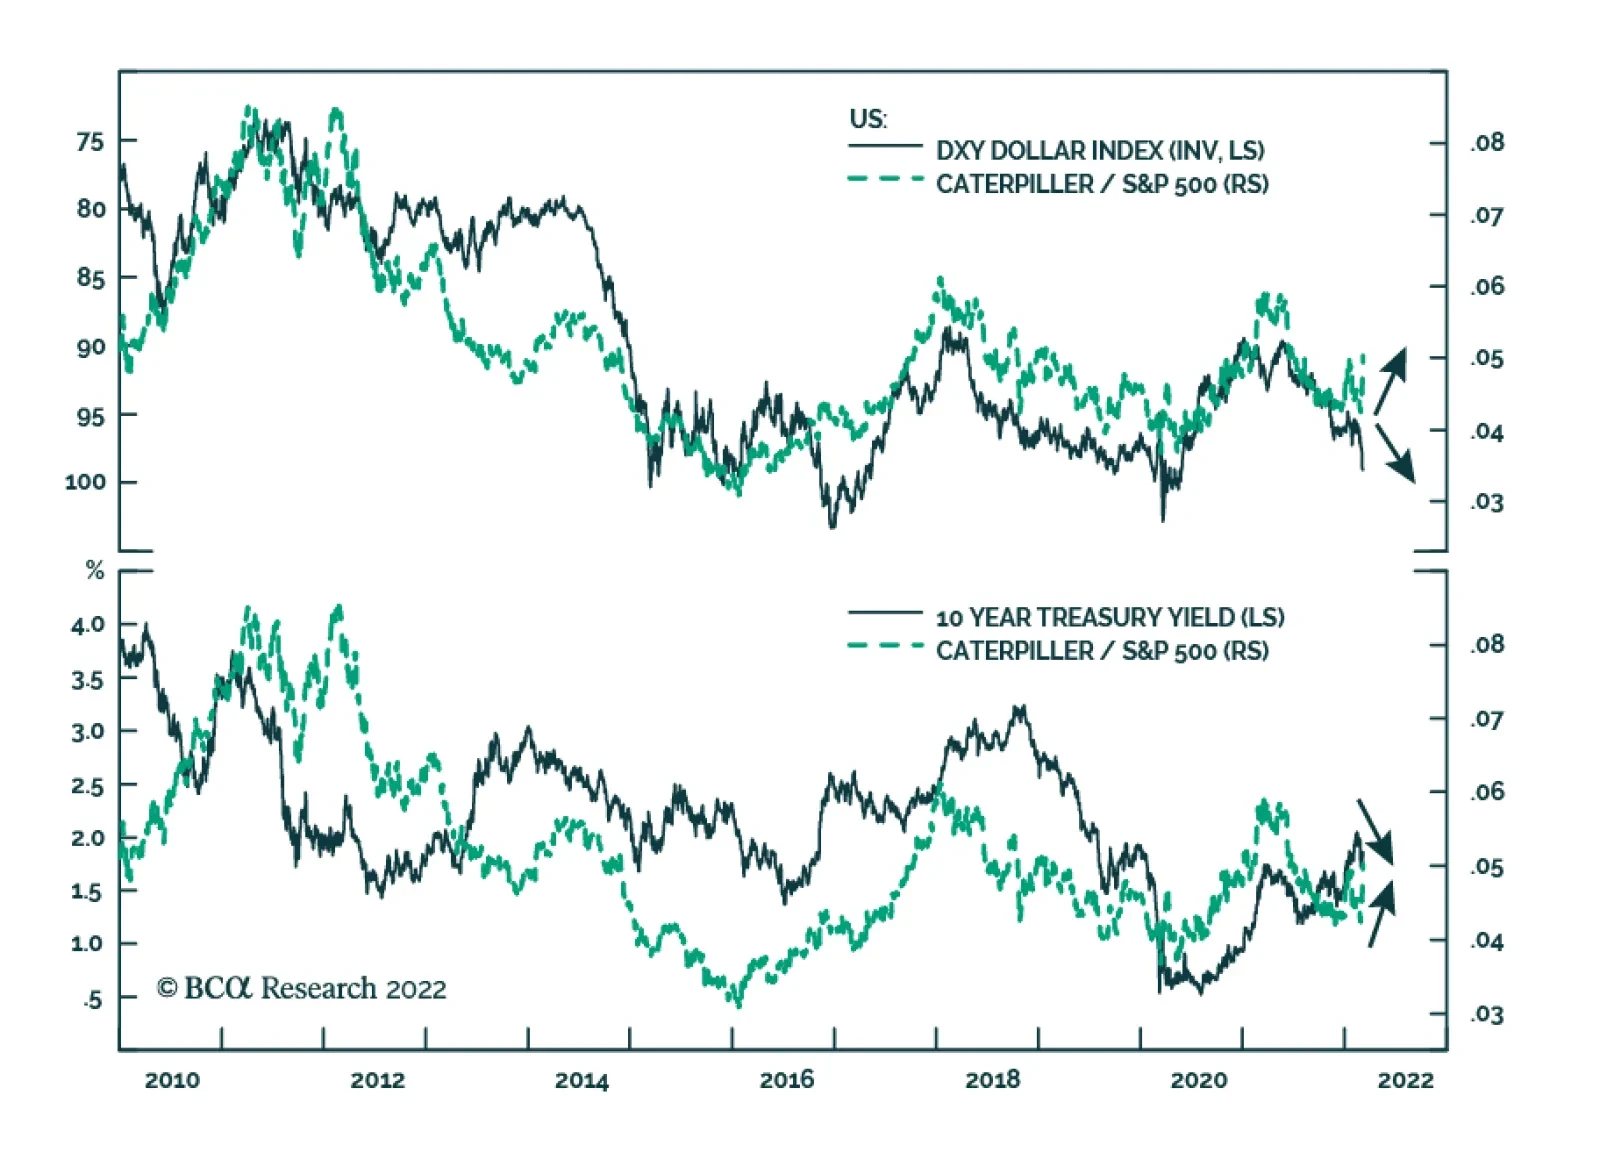
Caterpillar is up 12.5% since the start of the Russian invasion of Ukraine two weeks ago, significantly outperforming the S&P 500 which is down 1.3% over this period. The performance of the equipment maker’s stock is highly cyclical and therefore…
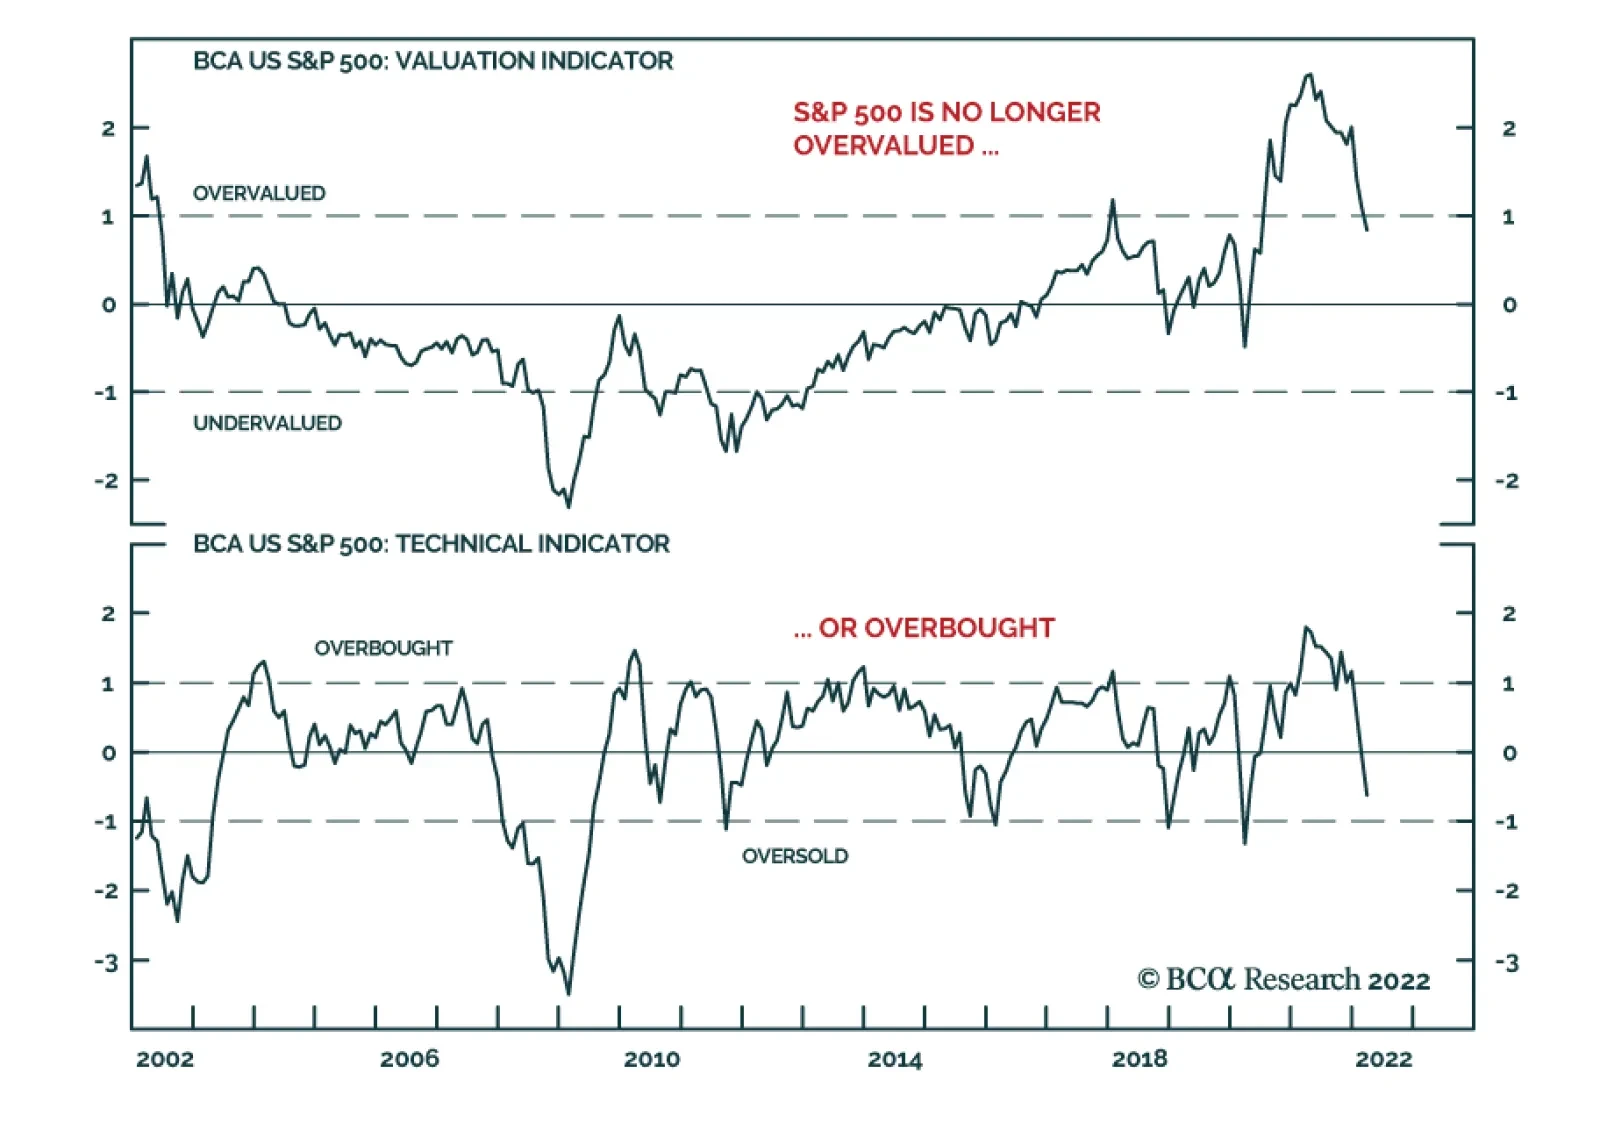
This year’s equity selloff has taken some froth off S&P 500 valuations. Our US Equity Strategists’ Composite Valuation Indicator – which is based on P/E, price-to-sales, price-to-dividends, and price-to-book –was two standard deviations above fair…
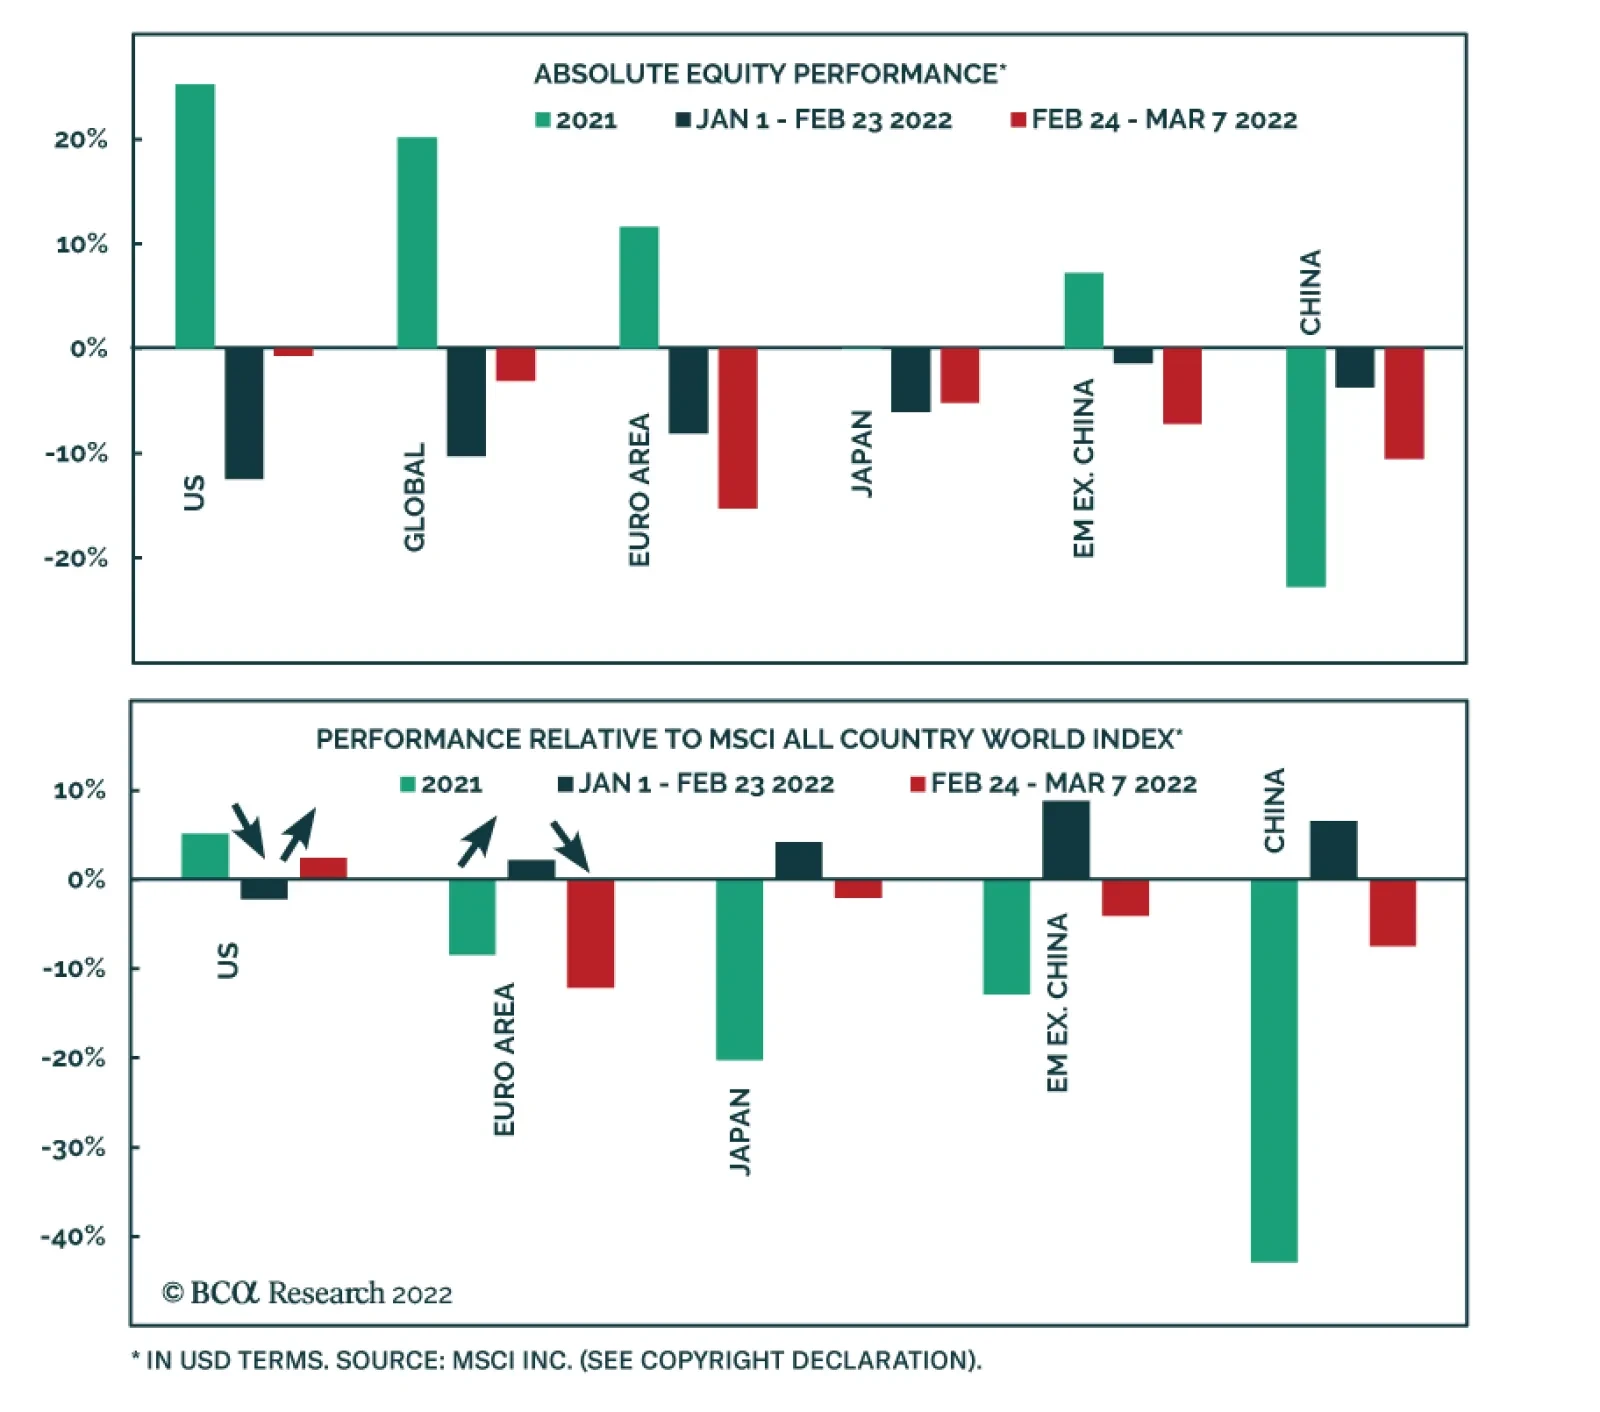
In late-January we highlighted that US stocks were the worst performing major global equity market at the start of this year. This reflected a reversal of last year’s trend: bourses that generated the greatest returns in 2021 generally suffered the biggest…
Executive Summary Will The War Stall The Expected Downturn In Inflation This Year?
Will The War Stall The Expected Downturn In Inflation This Year?
Will The War Stall The Expected Downturn In Inflation This Year?
The Russia/Ukraine conflict is impacting financial markets across numerous channels – uncertainty, risk aversion, growth expectations & inflation expectations – but all have a common link through soaring commodity prices, most notably for oil. For global bond investors, allocations to inflation-linked bonds are a necessary hedge to the war and the associated commodity shock, particularly with breakevens in most countries re-establishing the link to oil prices. We recommend investors maintain neutral allocations to inflation-linked bonds versus nominal government bonds across the developed world until there is greater clarity on future global oil production. Markets are discounting a peak in interest rates at the low end of the Bank of Canada’s neutral range, which is reasonable given high household debt levels in Canada. This creates an opportunity for bond investors to go long Canadian government bonds versus US Treasuries. Bottom Line: The supply premium on global oil prices will persist until there are signs of more global oil production or less chaos in the Ukraine – neither of which is imminent. Maintain neutral allocations to inflation-linked bonds versus nominal government debt across the developed markets. Feature Chart 1A Broad-Based Surge In Commodity Prices
A Broad-Based Surge In Commodity Prices
A Broad-Based Surge In Commodity Prices
The Russia/Ukraine war has sent an inflationary shock though the world through a very traditional source – rising commodity prices. Energy prices are getting most of the attention, with oil prices back to levels last seen in 2008 and US gasoline prices now above $4 per gallon. The commodity rally is not just in energy, though. Industrial metals prices have also gone up substantially, with the spot prices for copper and aluminum hitting an all-time-high and 16-year-high, respectively (Chart 1). Agricultural commodities have seen even larger increases, with the price of wheat up 22% and the price of corn up 11% since the Russian invasion began on February 24th. Europe is acutely exposed to the war-driven spike in energy prices given its reliance on Russia for natural gas supplies. Natural gas prices in Europe have spiked a staggering 117% since the invasion started, exacerbating a sharp demand/supply imbalance dating back to the reopening of Europe’s economy from COVID lockdowns one year ago (Chart 2). To date, booming energy prices have fueled a huge rise in headline inflation rates in the euro area – producer prices were up 31% on a year-over-year basis in January – but with little trickle down to core inflation which was only up 2.3% in January. High energy prices are not only a problem for global growth and inflation, but also for the future policy moves by central banks. Inflation rates boosted over the past year by commodity supply squeezes and supply chain disruptions were set to decline this year, but the Ukraine shock has thrown that into question. If the benchmark Brent oil price were to hit $150/bbl, this would end the decelerating trend for energy price inflation momentum, on a year-over-year basis, that has been in place since mid-2021 (Chart 3). That means a higher floor for the energy component of inflation indices, and thus overall headline inflation rates, throughout the major economies in the coming months. Chart 2Europe's Reliance On Russian Natural Gas Is A Big Problem
Europe's Reliance On Russian Natural Gas Is A Big Problem
Europe's Reliance On Russian Natural Gas Is A Big Problem
Chart 3Will The War Stall The Expected Downturn In Inflation This Year?
Will The War Stall The Expected Downturn In Inflation This Year?
Will The War Stall The Expected Downturn In Inflation This Year?
Chart 4The Oil Price Spike Makes Life More Difficult for CBs
The Oil Price Spike Makes Life More Difficult for CBs
The Oil Price Spike Makes Life More Difficult for CBs
How will bond markets respond to higher-than-expected inflation? Rate hike expectations have been highly correlated to the trend of headline inflation in the US, Europe, UK, Canada and Australia over the past year (Chart 4). Currently, overnight index swap (OIS) curves are still discounting between 5-6 rate hikes from the Fed, the Bank of England, the Bank of Canada and the Reserve Bank of Australia before the end of 2022. A single rate hike is still priced into the European OIS curve, even with the Ukraine shock. Global bond yields have been volatile, but surprisingly resilient despite the worries about war and commodity inflation. The 10-year Treasury yield has been trading in a range between 1.7% and 2% since the Russian offensive began, while the 10-year German Bund yield has hovered around 0%. Bond markets are pricing in a stagflation-type outcome of slowing growth and rising inflation, as multiple rate hikes are still discounted despite the geopolitical risks from the war. That reduces the value of using increased duration exposure to position for risk-off moves in a bond portfolio. At the same time, real bond yields are falling and breakeven rates are rising for global inflation-linked bonds – a part of the fixed income universe that looks to offer good protection against the uncertainties of war. Inflation-Linked Bonds – A Good Hedge Against War Risks Since the Russian invasion began, breakeven inflation rates on 10-year inflation-linked bonds have moved higher in the US (+13bps), Canada (+19bps), Australia (+15bps) and even Japan (+15bps). The moves have been even more significant on the European continent – 10-year breakevens have shot up in the UK (+23bps), Germany (+45bps), France (+31bps) and Italy (+36bps). Chart 5Inflation Breakevens Are Rising, Especially In Europe
Inflation Breakevens Are Rising, Especially In Europe
Inflation Breakevens Are Rising, Especially In Europe
The absolute levels of breakevens in Europe are high in the context of recent history (Chart 5). However, breakevens also look a bit stretched in other countries like the US. Our preferred metric to evaluate the upside potential for inflation-linked bonds is our Comprehensive Breakeven Indicators (CBI). The CBI for each country is comprised of three components: the deviation of 10-year breakevens from our model-implied fair value, the spread between 10-year breakevens and longer-term survey-based inflation expectations (the “inflation risk premium”) and the gap between actual inflation and the central bank inflation target. Those three components are all standardized and added together with equal weights to come up with the CBI. A higher CBI reading suggests less potential for inflation breakevens to widen, and vice versa. Currently, the CBIs for the eight countries in our Model Bond Portfolio universe are close to or above zero, suggesting more limited scope for breakevens to widen further (Chart 6). Only in Canada is the CBI below zero, and only slightly so as high realized Canadian inflation is offset by breakevens trading below both fair value and survey-based measures of inflation (Chart 7). Chart 6Global Inflation Breakeven Valuations Are Not That Cheap
A Crude Awakening For Bond Investors
A Crude Awakening For Bond Investors
In the US, the CBI is above zero mostly because of high realized US inflation. In Europe, the CBIs of the UK, Germany and Italy all are well above zero, while in France the CBI is close to zero. The UK has the highest CBI in our eight-country universe, with all three components contributing roughly equally (Chart 8). The Japanese CBI is also just above the zero line. Chart 7Some Mixed Signals On Inflation Breakeven Valuations
Some Mixed Signals On Inflation Breakeven Valuations
Some Mixed Signals On Inflation Breakeven Valuations
Chart 8European Breakevens Have Adjusted Sharply To The Energy Shock
European Breakevens Have Adjusted Sharply To The Energy Shock
European Breakevens Have Adjusted Sharply To The Energy Shock
We have been recommending a relative cautious allocation to global breakeven bonds in recent months. We saw the upside potential on breakevens as capped given the dearth of “cheap” signals on breakevens from our CBIs, especially with central banks moving towards monetary tightening in response to elevated inflation – moves intended to restore inflation-fighting credibility with bond markets. Yet the Ukraine commodity shock has boosted inflation breakevens even in countries with modest underlying (non-commodity) inflation like Japan and the euro area. We now see greater value in owning inflation-linked bonds in global bond portfolios as a hedge against the inflation risks stemming from the Ukraine and the worsening geopolitical tensions between the West and Russia. This is true even without the typical positive signal for breakevens from having CBIs below zero. We recommend that fixed income investors maintain a neutral allocation to inflation-linked bonds in dedicated government bond portfolios across the entire developed market “linker” universe. In our model bond portfolio, we had been allocating to linkers based off the signal from the CBIs, but in the current stagflationary war environment, we see country allocations as secondary to having neutral exposure to linkers in all countries. The new weightings to inflation-linked bonds are shown in the model bond portfolio tables on pages 12-14.1 Bottom Line: For global fixed income investors, allocations to inflation-linked bonds are a necessary hedge to the war and the associated commodity shock, particularly with breakevens in most countries re-establishing the link to oil prices. Canada Update: BoC Liftoff At Last The Bank of Canada (BoC) raised its policy interest rate by 25bps to 0.5% last week, commencing the start of the first rate hike cycle since 2018. The move was no surprise after BoC Governor Tiff Macklem signaled at the January monetary policy meeting that the start of a rate hiking cycle was imminent. The Canadian Overnight Index Swap (OIS) curve is discounting another 171bps of hikes in 2022, with a peak rate of 1.98% reached by March 2023 - near the low-end of the BoC’s range of neutral rate estimates between 1.75% and 2.75% (Chart 9). Chart 9Markets Discounting A Shallow BoC Rate Hiking Cycle, Even With High Inflation
Markets Discounting A Shallow BoC Rate Hiking Cycle, Even With High Inflation
Markets Discounting A Shallow BoC Rate Hiking Cycle, Even With High Inflation
The BoC noted that the Canadian economy was recovering faster than expected from the effects of the Omicron variant and the associated restrictions on activity, coming off a robust 6.7% annualized real GDP growth rate in Q4/2021. The BoC now estimates that economic slack created by the pandemic shock has been fully absorbed, with the unemployment rate at 6.5%. Canadian headline inflation reached a 32-year high of 5.1% in January (Chart 10) – a level that Governor Macklem bluntly called “too high” in a speech the day following the rate hike. The BoC’s CPI-trim measure that excludes the most volatile components is also at an elevated reading of 4%, suggesting that the higher inflation is broad based. The BoC sees persistent high inflation as a risk to the stability of medium-term inflation expectations, thus justifying tighter monetary policy. According the latest BoC Survey of Consumer Expectations, Canadians expect inflation to be 4.1% over the next two years and 3.5% over the next five years, both of which are above the BoC’s 1-3% inflation target band. So with a robust economy, tight labor market, inflation well above the BoC target and elevated consumer inflation expectations showing no signs of settling, why is the OIS curve discounting such a relatively low peak in the BoC policy rate? The answer lies with Canada’s housing bubble and the associated high household debt levels. In a recent Special Report, our colleagues at The Bank Credit Analyst estimated that the neutral rate in Canada was no higher than 1.75%- the previous peak in rates during the 2017-2018 tightening cycle. A big reason for that was the high level of Canadian household debt, which now sits at 180% of disposable income. This compares to the equivalent measure in the US of 124%, showing that unlike their southern neighbors, Canadian households had little appetite for deleveraging after the 2008 financial crisis (Chart 11). Chart 10Good Reasons For A More Aggressive BoC
Good Reasons For A More Aggressive BoC
Good Reasons For A More Aggressive BoC
Chart 11A Big Reason For A Less Aggressive BoC
A Big Reason For A Less Aggressive BoC
A Big Reason For A Less Aggressive BoC
Chart 12Position For Narrower Canada-US Bond Spreads
Position For Narrower Canada-US Bond Spreads
Position For Narrower Canada-US Bond Spreads
The Bank Credit Analyst report estimated that if the BoC hiked rates to 2.5% over the next two years – just below the high end of the BoC neutral range – the Canadian household debt service ratio would climb to a new high of 15.5% (bottom panel). This would greatly restrict Canadian consumer spending and likely trigger a sharp pullback in both housing demand and real estate prices. The conclusion: the neutral interest rate in Canada is likely closer to the peak seen during the previous 2018/19 hiking cycle around 1.75%. We have been recommending an underweight stance on Canadian government bonds in global fixed income portfolios dating back to the spring of 2021. However, with markets now discounting a peak in rates within plausible estimates of neutral, the window for additional underperformance of Canadian government bonds may be closing - but not equally versus all developed economies. We have found that a useful leading indicator of 10-year cross-country government bond yield spreads is the differential between our 24-month discounters. The discounters measure the cumulative amount of short-term interest rate increases over the next two years priced into OIS curves. Currently the “discounter gaps” are signaling room for Canadian spread widening versus the UK and Japan and, to a lesser extent, core Europe (Chart 12). However, the discounter gap is pointing to significant potential for narrowing of the Canada-US 10-year spread over the next year (top panel). This would occur even if the BoC follows the Fed with rate hikes in 2022, as the Fed is likely to deliver more increases in 2023/24 than the BoC. This week, we are introducing two new recommended positions to benefit from narrower Canada-US government bond spreads: We are reducing the size of our underweight position in our model bond portfolio in half, offset by a reduction in the allocation to US Treasuries (see the table on page 13). We are introducing a new trade in our Tactical Overlay, going long Canadian 10-year government bond futures versus selling 10-year US Treasury futures on a duration-matched basis (the specific details of the trade can be found in the table on page 15) We are maintaining our cyclical underweight recommendation on Canada, in a global bond portfolio context, given the potential for Canadian yield spreads to widen versus core Europe, Japan and the UK. That underweight recommendation will be more concentrated versus countries relative to the US. Bottom Line: Markets are discounting a peak in interest rates at the low end of the Bank of Canada’s neutral range, which is reasonable given high household debt levels in Canada. This creates an opportunity for bond investors to go long Canadian government bonds versus US Treasuries. Robert Robis, CFA Chief Fixed Income Strategist rrobis@bcaresearch.com Footnotes 1 The allocations to inflation-linked bonds shown in the model bond portfolio reflect both the recommended country weights and the recommended weighting of linkers versus nominal bonds within each country. For example, we are neutral US TIPS versus nominal bonds within the US Treasury component of the portfolio, but since we are also underweight the US as a country allocation, the TIPS allocation is below the custom benchmark index weight. GFIS Model Bond Portfolio Recommended Positioning Active Duration Contribution: GFIS Recommended Portfolio Vs. Custom Performance Benchmark
A Crude Awakening For Bond Investors
A Crude Awakening For Bond Investors
The GFIS Recommended Portfolio Vs. The Custom Benchmark Index Global Fixed Income - Strategic Recommendations* Cyclical Recommendations (6-18 Months)
A Crude Awakening For Bond Investors
A Crude Awakening For Bond Investors
Tactical Overlay Trades
Highlights Chart 1A Tough Balancing Act For The Fed
A Tough Balancing Act For The Fed
A Tough Balancing Act For The Fed
In last week’s Congressional testimony, Fed Chair Jay Powell talked about his goal of achieving a “soft landing”. That is, the Fed will tighten enough to slow inflation but not so much that the economy tips into recession. This balancing act was always going to be difficult, and recent world events have only complicated it. On the one hand, the US labor market has essentially returned to full employment. The prime-age employment-to-population ratio is just 1% below its pre-COVID level, a gap that will soon be filled by the 1.2 million people being kept out of the labor force by the pandemic (Chart 1). On the other hand, risk-off market moves driven by the war in Ukraine have caused the yield curve to flatten (Chart 1, bottom panel). The Fed’s task is to respond to the strong US economy by lifting rates, but to also avoid inverting the yield curve. To split the difference, the Fed will proceed with a 25 bps rate hike at each FOMC meeting, but will slow down if the curve inverts. Our recommended strategy is to keep portfolio duration close to benchmark for the time being given the uncertainty in Ukraine. However, the Treasury curve is now priced for too shallow a path for rate hikes. We are actively looking for a good time to re-initiate duration shorts. Feature Table 1Recommended Portfolio Specification
Sticking The Landing
Sticking The Landing
Table 2Fixed Income Sector Performance
Sticking The Landing
Sticking The Landing
Investment Grade: Neutral Chart 2Investment Grade Market Overview
Investment Grade Market Overview
Investment Grade Market Overview
Investment grade corporate bonds underperformed the duration-equivalent Treasury index by 124 basis points in February, dragging year-to-date excess returns down to -238 bps. The index option-adjusted spread widened 16 bps on the month and it currently sits at 130 bps. Our quality-adjusted 12-month breakeven spread has moved up to its 36th percentile since 1995 (Chart 2). The corporate bond sell-off that began late last year on heightened expectations of Fed tightening has accelerated in recent weeks, this time driven by the war in Ukraine. The result of the turmoil is that a significant amount of value has returned to the corporate bond market. In fact, spreads have not been this wide since early 2021. Continued uncertainty about how the Ukrainian situation will evolve causes us to recommend a neutral stance on investment grade corporate bonds in the near term. However, enough value has been created that a buying opportunity could soon emerge. Corporate balance sheets remain healthy. In fact, the ratio of total debt to net worth on nonfinancial corporate balance sheets is at its lowest level since 2010 (bottom panel). Further, the most likely scenario is that the economic contagion from Russia/Ukraine to the United States will be limited. While Fed tightening is set to begin this month, spreads are now wide enough that a flat but positively sloped yield curve is not sufficient to justify an underweight stance on corporate bonds. Investors should stay neutral for now but look for an opportunity to turn more bullish. Table 3ACorporate Sector Relative Valuation And Recommended Allocation*
Sticking The Landing
Sticking The Landing
Table 3BCorporate Sector Risk Vs. Reward*
Sticking The Landing
Sticking The Landing
High-Yield: Overweight Chart 3High-Yield Market Overview
High-Yield Market Overview
High-Yield Market Overview
High-Yield underperformed the duration-equivalent Treasury index by 56 basis points in February, dragging year-to-date excess returns down to -213 bps. The index option-adjusted spread widened 17 bps on the month and it currently sits at 376 bps. The 12-month spread-implied default rate – the default rate that is priced into the junk index assuming a 40% recovery rate on defaulted debt and an excess spread of 100 bps – also moved up to 4.6% (Chart 3). The odds are good that defaults will come in below 4.6% during the next 12 months, and as such, we expect high-yield bonds to outperform a duration-matched position in Treasuries. This warrants a continued overweight allocation to High-Yield on a cyclical (6-12 month) horizon, though we acknowledge that further spread widening is likely until the situation in Ukraine reaches a place of greater stability. High-Yield valuations continue to be more favorable than for investment grade corporates (panel 3). We therefore maintain a preference for high-yield corporate bonds over investment grade. MBS: Underweight Chart 4MBS Market Overview
MBS Market Overview
MBS Market Overview
Mortgage-Backed Securities underperformed the duration-equivalent Treasury index by 48 basis points in February, dragging year-to-date excess returns down to -60 bps. The zero-volatility spread for conventional 30-year agency MBS widened 12 bps on the month, driven by an 11 bps widening of the option-adjusted spread (OAS). The compensation for prepayment risk (option cost) increased by 1 bp on the month (Chart 4). We wrote in a recent report that MBS’ poor performance in 2021 was attributable to an option cost that was too low relative to the pace of mortgage refinancings, noting that the MBA Refinance Index was slow to fall in 2021 despite the back-up in yields.1 This valuation picture is starting to change. The option cost is now up to 44 bps, its highest level since 2016 and refi activity is slowing as the Fed moves toward rate hikes. At 30 bps, the index OAS remains unattractive. However, the elevated option cost raises the possibility that the OAS may be over-estimating the pace of mortgage refinancings for the first time in a while. If these trends continue, it may soon make sense to increase exposure to agency MBS. We closed our recommendation to favor high coupon over low coupon securities on February 15th, concurrent with our decision to increase portfolio duration. We will likely re-establish this position when we move portfolio duration back to below benchmark. Emerging Market Bonds (USD): Underweight Chart 5Emerging Markets Overview
Emerging Markets Overview
Emerging Markets Overview
Emerging Market bonds underperformed the duration-equivalent Treasury index by 399 basis points in February, dragging year-to-date excess returns down to -483 bps. EM Sovereigns underperformed the Treasury benchmark by 519 bps on the month, dragging year-to-date excess returns down to -646 bps. The EM Corporate & Quasi-Sovereign Index underperformed by 323 bps on the month, dragging year-to-date excess returns down to -379 bps. Russian sovereign bonds were recently downgraded to below investment grade, but before they were removed from the index they contributed -367 bps to Sovereign excess returns in February. In other words, if Russian securities are excluded, the EM Sovereign index only lagged Treasuries by 152 bps in February and actually outperformed a duration-matched position in US corporate bonds. As a result, the EM Sovereign index now offers less yield than a credit rating and duration-matched position in US corporate bonds (Chart 5). This recent shift in valuation leads us to reduce our recommended exposure to EM Sovereigns from overweight to underweight. Russian securities also negatively influenced EM Corporate & Quasi-Sovereign returns in February, but that index still offers a significant yield premium over US corporates whether Russian bonds are included or not (bottom panel). The turmoil overseas causes us to reduce exposure to this sector as well, but we will retain a neutral allocation instead of underweight because of still-attractive valuations. Municipal Bonds: Overweight Chart 6Municipal Market Overview
Municipal Market Overview
Municipal Market Overview
Municipal bonds underperformed the duration-equivalent Treasury index by 5 basis points in February, dragging year-to-date excess returns down to -126 bps (before adjusting for the tax advantage). While the war in Ukraine introduces a great deal of uncertainty into the economic outlook, the municipal bond sector should be better placed than most to deal with the fallout. Trailing 4-quarter net state & local government savings are incredibly high (Chart 6) and 2021’s federal spending splurge will continue to support state & local government coffers for some time. That said, relative muni valuations have tightened significantly during the past few months and the recent back-up in corporate spreads will eventually give us an opportunity to increase exposure to that sector. With that in mind, this week we downgrade our municipal bond allocation from “maximum overweight” (5 out of 5) to “overweight” (4 out of 5). We calculate that 12-17 year maturity Revenue munis offer a breakeven tax rate of 5% relative to credit rating and duration matched US corporate bonds. 12-17 year General Obligation Munis offer a breakeven tax rate of 11% versus corporates (panel 2). Both figures are down considerably from their 2020 peaks. For their part, high-yield muni spreads have also not kept pace with the recent widening in high-yield corporate spreads (bottom panel). Treasury Curve: Buy 2-Year Bullet Versus Cash/10 Barbell Chart 7Treasury Yield Curve Overview
Treasury Yield Curve Overview
Treasury Yield Curve Overview
The Treasury curve flattened dramatically In February, driven by a re-pricing of Fed expectations in the first half of the month and then later by flight-to-quality flows spurred by the war in Ukraine. The 2/10 and 5/30 Treasury slopes flattened by 22 bps and 3 bps in February. They currently sit at 24 bps and 51 bps, respectively (Chart 7). As noted on the first page of this report, during the next few months the Fed will be forced to strike a balance between tightening policy fast enough to prevent a de-stabilizing increase in inflation expectations and slow enough to prevent an inversion of the yield curve. The latter would likely signal an unacceptable increase in recession risk. In the near-term, we view the risks as clearly tilted toward further curve flattening as the Fed initiates a rate hike cycle while geopolitical uncertainties keep a lid on long-dated yields. However, this dynamic will eventually give way when political uncertainties abate and/or the Fed is forced to move more slowly in response to an inverted (or almost inverted) curve. With that in mind, a position in curve steepeners continues to make sense on a 6-12 month investment horizon. We also maintain our recommendation to favor the 20-year bond over a duration-matched barbell consisting of the 10-year note and 30-year bond. This position offers an enticing 26 bps of duration-neutral carry. TIPS: Neutral Chart 8TIPS Market Overview
TIPS Market Overview
TIPS Market Overview
TIPS outperformed the duration-equivalent nominal Treasury index by 150 basis points in February, bringing year-to-date excess returns up to +127 bps. The 10-year TIPS breakeven inflation rate rose 19 bps on the month and the 5-year/5-year forward TIPS breakeven inflation rate rose 7 bps. Perhaps the most interesting recent market move is that TIPS breakeven inflation rates rose during the past month, even as flight-to-safety flows surged into the US bond market. That is, while nominal Treasury yields declined, TIPS yields fell even more, and the cost of inflation compensation embedded in US bond prices increased. At present, the 10-year TIPS breakeven inflation rate is 2.70%, above the Fed’s 2.3% to 2.5% target range (Chart 8). The 5-year/5-year forward TIPS breakeven inflation rate is 2.16%, still below the Fed’s target range but significantly higher than where it was in January. The bond market has responded to the war in Ukraine and resultant surge in commodity prices by bidding up the cost of inflation compensation. While we agree that higher commodity prices increase the risk that inflation will remain elevated in the second half of the year, we still think the most likely outcome is that core inflation starts to moderate in the coming months as supply chain pressures ease and the pandemic exerts less of an impact on daily life. Upcoming Fed rate hikes will also apply downward pressure to long-maturity TIPS breakeven inflation rates. As a result, we maintain our recommended neutral allocation to TIPS versus nominal Treasuries at the long-end of the curve and re-iterate our recommendation to underweight TIPS versus nominal Treasuries at the front-end of the curve. ABS: Overweight Chart 9ABS Market Overview
ABS Market Overview
ABS Market Overview
Asset-Backed Securities underperformed the duration-equivalent Treasury index by 25 basis points in February, dragging year-to-date excess returns down to -5 bps. Aaa-rated ABS underperformed by 25 bps on the month, dragging year-to-date excess returns down to -6 bps. Non-Aaa ABS underperformed by 22 bps on the month, dragging year-to-date excess returns down to -1 bp. During the past two years, substantial federal government support for household incomes has caused US households to build up an extremely large buffer of excess savings. During this period, many households have used their windfalls to pay down consumer debt and credit card debt levels have fallen to well below pre-COVID levels (Chart 9). Though consumer credit growth has rebounded, debt levels are still low. This indicates that the collateral quality backing consumer ABS remains exceptionally strong. This also indicates that while surging gasoline prices will weigh on consumer activity in the coming months, household balance sheets are starting from such a good place that we don’t expect a meaningful increase in consumer credit delinquencies. Investors should remain overweight consumer ABS and should take advantage of the high quality of household balance sheets by moving down the quality spectrum, favoring non-Aaa rated securities over Aaa-rated ones. Non-Agency CMBS: Neutral Chart 10CMBS Market Overview
CMBS Market Overview
CMBS Market Overview
Non-Agency Commercial Mortgage-Backed Securities underperformed the duration-equivalent Treasury index by 95 basis points in February, dragging year-to-date excess returns down to -98 bps. Aaa Non-Agency CMBS underperformed Treasuries by 90 bps on the month, dragging year-to-date excess returns down to -92 bps. Non-Aaa Non-Agency CMBS underperformed by 108 bps on the month, dragging year-to-date excess returns down to -105 bps (Chart 10). Though CMBS spreads remain wide compared to other similarly risky spread products, we continue to recommend only a neutral allocation to the sector because of the structurally challenging environment for commercial real estate. Agency CMBS: Overweight Agency CMBS underperformed the duration-equivalent Treasury index by 24 basis points in February, dragging year-to-date excess returns down to -21 bps. The average index option-adjusted spread widened 6 bps on the month. It currently sits at 46 bps (bottom panel). The average Agency CMBS spread remains below its pre-COVID level, but it continues to look attractive compared to other similarly risky spread products. Stay overweight. Appendix A: The Golden Rule Of Bond Investing We follow a two-step process to formulate recommendations for bond portfolio duration. First, we determine the change in the federal funds rate that is priced into the yield curve for the next 12 months. Second, we decide – based on our assessments of the economy and Fed policy – whether the change in the fed funds rate will exceed or fall short of what is priced into the curve. Most of the time, a correct answer to this question leads to the appropriate duration call. We call this framework the Golden Rule Of Bond Investing, and we demonstrated its effectiveness in the US Bond Strategy Special Report, “The Golden Rule Of Bond Investing”, dated July 24, 2018. Chart 11 illustrates the Golden Rule’s track record by showing that the Bloomberg Barclays Treasury Master Index tends to outperform cash when rate hikes fall short of 12-month expectations, and vice-versa. At present, the market is priced for 172 basis points of rate hikes during the next 12 months. Chart 11The Golden Rule's Track Record
The Golden Rule's Track Record
The Golden Rule's Track Record
Appendix A: The Golden Rule Of Bond Investing We can also use our Golden Rule framework to make 12-month total return and excess return forecasts for the Bloomberg Barclays Treasury index under different scenarios for the fed funds rate. Excess returns are relative to the Bloomberg Barclays Cash index. To forecast total returns we first calculate the 12-month fed funds rate surprise in each scenario by comparing the assumed change in the fed funds rate to the current value of our 12-month discounter. This rate hike surprise is then mapped to an expected change in the Treasury index yield using a regression based on the historical relationship between those two variables. Finally, we apply the expected change in index yield to the current characteristics (yield, duration and convexity) of the Treasury index to estimate total returns on a 12-month horizon. The below tables present those results, along with excess returns for a front-loaded and a back-loaded rate hike scenario. Excess returns are calculated by subtracting assumed cash returns in each scenario from our total return projections.
Sticking The Landing
Sticking The Landing
Appendix B: Butterfly Strategy Valuations The following tables present the current read-outs from our butterfly spread models. We use these models to identify opportunities to take duration-neutral positions across the Treasury curve. The following two Special Reports explain the models in more detail: US Bond Strategy Special Report, “Bullets, Barbells And Butterflies”, dated July 25, 2017, available at usbs.bcaresearch.com US Bond Strategy Special Report, “More Bullets, Barbells And Butterflies”, dated May 15, 2018, available at usbs.bcaresearch.com Table 4 shows the raw residuals from each model. A positive value indicates that the bullet is cheap relative to the duration-matched barbell. A negative value indicates that the barbell is cheap relative to the bullet. Table 4Butterfly Strategy Valuation: Raw Residuals In Basis Points (As Of February 28, 2022)
Sticking The Landing
Sticking The Landing
Table 5 scales the raw residuals in Table 4 by their historical means and standard deviations. This facilitates comparison between the different butterfly spreads. Table 5Butterfly Strategy Valuation: Standardized Residuals (As Of February 28, 2022)
Sticking The Landing
Sticking The Landing
Table 6 flips the models on their heads. It shows the change in the slope between the two barbell maturities that must be realized during the next six months to make returns between the bullet and barbell equal. For example, a reading of -29 bps in the 5 over 2/10 cell means that we would expect the 5-year to outperform the 2/10 if the 2/10 slope flattens by less than 29 bps during the next six months. Otherwise, we would expect the 2/10 barbell to outperform the 5-year bullet. Table 6Discounted Slope Change During Next 6 Months (BPs)
Sticking The Landing
Sticking The Landing
Appendix C: Excess Return Bond Map The Excess Return Bond Map is used to assess the relative risk/reward trade-off between different sectors of the US bond market. It is a purely computational exercise and does not impose any macroeconomic view. The Map’s vertical axis shows 12-month expected excess returns. These are proxied by each sector’s option-adjusted spread. Sectors plotting further toward the top of the Map have higher expected returns and vice-versa. Our novel risk measure called the “Risk Of Losing 100 bps” is shown on the Map’s horizontal axis. To calculate it, we first compute the spread widening required on a 12-month horizon for each sector to lose 100 bps or more relative to a duration-matched position in Treasury securities. Then, we divide that amount of spread widening by each sector’s historical spread volatility. The end result is the number of standard deviations of 12-month spread widening required for each sector to lose 100 bps or more versus a position in Treasuries. Lower risk sectors plot further to the right of the Map, and higher risk sectors plot further to the left. Chart 12Excess Return Bond Map (As Of February 28, 2022)
Sticking The Landing
Sticking The Landing
Recommended Portfolio Specification
Sticking The Landing
Sticking The Landing
Other Recommendations
Sticking The Landing
Sticking The Landing
Ryan Swift US Bond Strategist rswift@bcaresearch.com Footnotes 1 Please see US Bond Strategy Weekly Report, “The Omicron Impact”, dated November 30, 2021. Treasury Index Returns Spread Product Returns
Executive Summary US Can Do Without Russia's Oil, EU, NATO … Not So Much
US Will Ban Russian Oil Imports
US Will Ban Russian Oil Imports
The US will ban Russian oil imports shortly. This is not as big a deal markets had feared over the weekend, when news of a possible ban of Russian oil and refined products into the US and Europe was telegraphed by US officials, powering prices to $140/bbl.1 The US imported a combined 400k b/d of Russian crude oil and refined products in December 2021, the EIA reports, which accounted for less than 5% of the 8.6mm b/d of imports. Europe is another story. Roughly 60% of Russia's 11.3mm b/d of crude oil and refined-products output goes to OECD Europe, according to the IEA. Russia considers Western sanctions to be on an equal footing with a declaration of war.2 President Putin has threatened a nuclear response if the West interferes with invasion of Ukraine, which could elicit a similar response from the West.3 US shale producers will be highly incentivized to increase output given high prices. Our view continues to include a production increase from core OPEC 2.0 – Saudi Arabia, UAE and Kuwait. We also anticipate a return of 1mm b/d from Iran, following a nuclear deal with the US. Bottom Line: We remain long commodity-index exposure (S&P GSCI and the COMT ETF), along with equity exposure to oil and gas producers via the XOP ETF. Footnotes 1 Please see Crude price jumps on talk of US oil ban as Russia steps up shelling of civilian areas, published by the Financial Times on March 6, 2022. 2 Please see Putin says Western sanctions are akin to declaration of war, published on March 5, 2022. 3 Please see How likely is the use of nuclear weapons by Russia?, published by Chatham House on March 1, 2022. The report notes, " If Russia were to attack Ukraine with nuclear weapons, NATO countries would most likely respond on the grounds that the impact of nuclear weapons crosses borders and affects the countries surrounding Ukraine. NATO could respond either by using conventional forces on Russian strategic assets, or respond in kind using nuclear weapons as it has several options available."