United States

Executive Summary A Perfect Metals Storm
A Perfect Metals Storm
A Perfect Metals Storm
The bitter truth at the heart of the Ukraine conflict is that the constraints the US and Europe are willing to impose on Russia are not enough to deter it from completing its conquest of the eastern and coastal parts of the country and installing a puppet government in Kiev. The conflict will reduce the available supplies of oil and gas, base metals and grains. Increasing commodity costs will add to existing inflation pressures and threaten to aggravate slowing growth trends in Europe. However, we expect that the net effect in the US will be more inflationary than deflationary, as flush consumers are well positioned to withstand upward price pressure. BCA has turned tactically neutral on equities as it does not appear that stock markets have yet come to terms with the glum reality of the military campaign. We foresee increased near-term market turbulence as investors experience periodic episodes of panic in response to developments on the ground. We are making several moves to dial down the risk in our ETF portfolio for the time being. We plan to unwind the moves before too long to align the portfolio with our bullish 12-month view but are relieved to have adopted a more defensive position while financial markets digest the implications of the geopolitical shock. Bottom Line: Financial market moves seem to be lagging the course of events in Ukraine. We recommend that investors position more defensively until markets catch up. Feature Chart 1Extreme Volatility
Extreme Volatility
Extreme Volatility
Ukraine has dominated the news since Russia invaded it a week and a half ago. The fighting has already triggered huge single-day swings in global financial markets with Russian equities falling nearly 40% the day the invasion began and rising 26% the next day before failing to open all of last week (Chart 1, top panel), western European sovereign 10-year bond yields falling by over six standard deviations across the board last Tuesday before retracing much of the move the next day (Chart 1, second panel) and Brent crude moving more than three standard deviations on several days (Chart 1, third panel). The S&P 500’s reversal from losing 3.5% in overnight futures markets to closing up 3% during the New York session on the day of the invasion is modest by comparison, as is the 10-year Treasury yield’s 2-3-standard deviation moves (Chart 1, bottom panel), though they show that the US is not immune. The inevitability that US markets and the US economy will be affected by events seven time zones away has led us to devote this week’s report to Ukraine and its potential consequences. This report is not meant to be the definitive guide to the conflict. It simply synthesizes the views expressed within BCA under the leadership of our Geopolitical Strategy team and adds our own thoughts about market implications and how investors in US markets might prepare to manage their way through the crisis. What’s The Endgame? BCA does not expect Russia to halt its offensive until Kiev is captured and Ukraine’s government is toppled. We therefore view any rallies on hopes for a negotiated settlement to be premature and vulnerable to subsequent reversals. Despite their stirring courage, resolve and pluck, the Ukrainians are massively outgunned and the ultimate military outcome is not in doubt. The cities that are under siege will fall unless Russian forces relent. No one within BCA imagines that Russia will relent until it achieves its aim of establishing a buffer between NATO forces and its own territory. It appears as if the only logical option for Russia’s Vladimir Putin is to proceed until Kiev has fallen. Now that he has already triggered nearly all the economic retaliation that the US and a surprisingly united Europe is likely to muster, there is very little reason not to complete his objective. As dispiriting as it is for humankind, conditions on the ground are likely to get worse. BCA’s base-case scenario is that the military campaign will continue until the coast and all the major cities east of the Dnieper River have succumbed (Map 1). At that point, we expect that the de facto political outcome will leave Russia in control of the eastern half of the country and its southern coast while the remnants of Ukraine’s democratically elected officials establish a new federal government in the country’s west. Once the political borders are redrawn, the active conquest can end. Russia will remain a pariah state, and heated rhetoric between Washington and Moscow and various European capitals and Moscow will wax and wane, but no party will have an incentive to disturb the fragile and uneasy equilibrium. Map 1Tightening The Noose
Ukraine’s Grim Tidings
Ukraine’s Grim Tidings
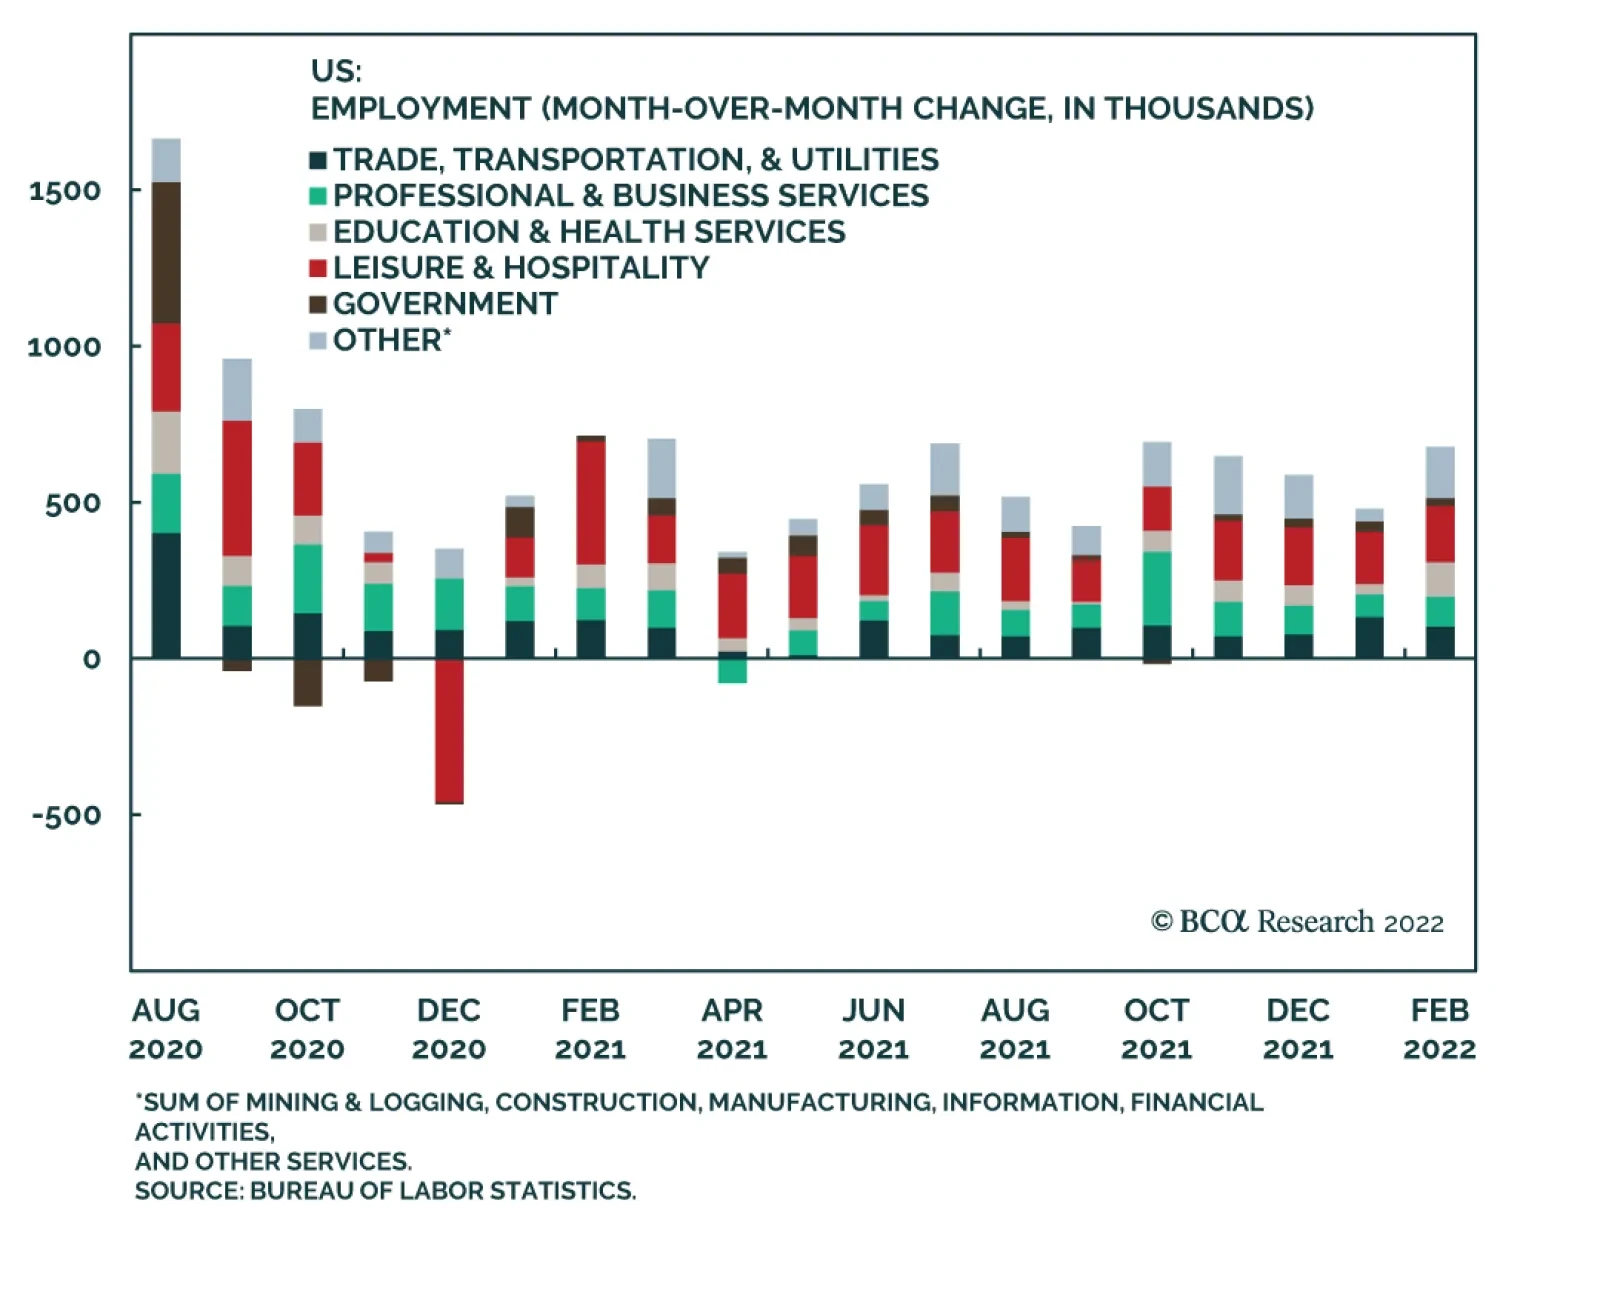
We are saddened by the Ukrainian peoples’ grim plight. We are dismayed by the way that events have laid bare multilateral institutions’ weaknesses. We lament the clinical tone with which we are discussing events that involve extreme human suffering. As we’ve said before, albeit in more comfortable contexts, our job is bullish or bearish, not good or bad and not right or wrong. The coldly objective bottom line is that the US and Europe are unwilling to interpose their own troops or risk escalating tensions with the possessor of the world’s second largest nuclear arsenal over the integrity of Ukraine’s borders. The constraints they are willing to impose on Russia’s actions are insufficient to preserve Kiev and the other cities within its crosshairs. Economic And Market Implications The most immediate economic consequence will be a reduction in the supply of crude oil, natural gas, several base metals and wheat and corn. Russia is the world’s third-largest oil producer; second-largest natural gas producer; a major source of aluminum, copper and nickel; and Russia and Ukraine together account for one-seventh of global wheat and corn production. Banks and shipping companies are increasingly unwilling to finance and transport Russian exports and Ukraine’s ability to cultivate and ship crops will likely be limited by ground-level hazards and Russian control of its ports. Crop and metals prices will rise at least temporarily while alternatives to established trade flows are developed and energy prices could spike if either side cuts off flows between Russia and Europe. Increased energy prices are properly viewed as a tax on economic activity for oil importing economies and the 1973-74 Arab oil embargo’s contribution to the November 1973 to March 1975 recession and the grinding 1973-74 equity bear market loom large in American minds. There are two key distinctions between then and now, however. First, the American economy is far less energy intensive than it was in the early seventies (Chart 2). Second, now that the US is the world’s largest oil producer, rising oil prices lead to increased employment (Chart 3), greater income and marginally better credit performance, given that the energy sector is the plurality issuer of high-yield bonds. Higher oil prices are no longer unadulteratedly negative for the US economy. Chart 3... And Higher Prices Now Mean More Jobs
... And Higher Prices Now Mean More Jobs
... And Higher Prices Now Mean More Jobs
Chart 2Oil Ain't What It Used To Be ...
Oil Ain't What It Used To Be ...
Oil Ain't What It Used To Be ...
There is a threat, however, that rising commodity prices could push up long-run inflation expectations, forcing the Fed to take a harder line on rate hikes than it otherwise might. Although the 10-year Treasury yield fell last week, inflation expectations rose (Chart 4). Fortunately, American households are unusually well positioned to confront higher inflation, thanks to their modest debt burden, enormous savings cushion and robust pandemic wealth gains powered by advances in financial markets and home prices. We therefore expect that events in Ukraine will prove to be more inflationary than deflationary in the US, though risk-off moves may make it look like the economy is slowing in a worrisome way in the near term. Chart 4Longer-Run Inflation Expectations Have Perked Up
Longer-Run Inflation Expectations Have Perked Up
Longer-Run Inflation Expectations Have Perked Up
From Investment Strategy … Though we are still constructive on financial markets and the economy, we expect that markets will be subject to downdrafts as investors come to terms with the likely course of events in Ukraine. Although our base-case scenario does not include an expansion of the conflict beyond Ukraine’s borders, financial markets will experience additional turbulence as they price in the non-zero probability that it might. Against that backdrop, we are tactically reducing risk in our ETF portfolio and recommend that investors follow suit. … To Portfolio Construction To reduce our near-term exposure to what our Global Investment Strategy colleagues describe as “panic events,” we are temporarily closing out our equity overweight. We are also reducing our cyclicals-over-defensives, value and small-cap positions as a further way of trimming the sails. We are directly investing in two sub-industry groups that will help protect the portfolio against lower interest rates and higher metals prices. To get our overall equity exposure down by 500 basis points (bps), we are reducing our four remaining equal weight sector exposures (Table 1). Table 1Tactical Equity Adjustments In The ETF Portfolio
Ukraine’s Grim Tidings
Ukraine’s Grim Tidings
To reduce our cyclicals-over-defensives exposure, we are closing out the respective 160- and 100-bps overweights in Industrials (XLI) and Financials (XLF) while reducing our Consumer Staples (XLP) underweight by 230 bps. Those moves have the effect of reducing our net equity exposure by 30 bps. We are dialing back our Value (RPV) overweight by 250 bps to defend against the potential drag on the Financials-heavy position from lower interest rates and a flatter yield curve. We are trimming our small-cap exposure (IJR) by 100 bps. These moves free up 350 bps of capital. The potential for further war-inspired disruptions leads us to drill down from sectors to sub-industry groups to tailor exposure to homebuilders and miners of metals and alternative fuels. Consumer Discretionaries are rate-sensitive but homebuilders are hyper sensitive, as their customers typically finance 80 to 90% of their purchase price. Every penny of the group’s revenue is earned in the US, which is less exposed to Ukraine disruptions than Europe, Japan (which imports all of its oil and gas) and emerging markets (vulnerable to a rising dollar). Demand is robust (Chart 5), supply will remain limited and the group’s low P/E multiple stands out in a world with few cheap stocks. We are selling 100 bps of our overall sector exposure (XLY) to fund the targeted purchase of ITB, the ETF offering the purest play on homebuilders. We follow the same targeted-exposure playbook in zeroing out our overall Materials position (XLB) to initiate a 150-bps position in XME, a pure-play metals and mining ETF which our Commodity and Energy Strategy team recommends to profit from tight base metals markets (Chart 6). As a tactical move, we are effectively swapping exposure to chemicals, which use natural gas as a feedstock, for base metals, precious metals and coal and uranium. XLB is vulnerable to higher natural gas prices while XME would benefit from them, as well as from base metals supply interruptions and flight-to-safety demand for gold and silver. Given our commodity colleagues’ expectation that alternative energy ambitions will keep base metals well bid for an extended period, XME may remain in the portfolio after markets fully digest Ukraine implications. Chart 5The Homebuilding Outlook ##br##Is Bright
The Homebuilding Outlook Is Bright
The Homebuilding Outlook Is Bright
Chart 6Metals Inventories Were Tight Before Russian Resources Went Offline
Metals Inventories Were Tight Before Russian Resources Went Offline
Metals Inventories Were Tight Before Russian Resources Went Offline
The foregoing equity moves reduce our net holdings by 380 bps; we trim each of our four remaining equal weight positions – in Communication Services (XLC), Health Care (XLV), Real Estate (XLRE) and Tech (XLK) – by 30 bps to shed the remaining 120 bps needed to reset equities to equal weight to ride out temporary market turbulence. We also reduce our hybrid preferred stock position (VRP), as there’s less need for variable-rate protection if yields are going to decline and the preferred space may become more volatile as retail investors react to unsettling headlines. The 250-bps hybrid drawdown will be allocated to traditional fixed income, along with 250 bps of the equity sales proceeds, to bulk up our Treasury positions (SHY, IEI and IEF) in the proportion required to maintain benchmark duration (Appendix Table, shown at the back of the report). The remaining 250 bps raised by equity sales will be parked in cash to await an opportunity to re-risk the portfolio in line with our bullish cyclical view. Our relative equity sector positioning as of today is shown in Chart 7 and our relative fixed income positioning is shown in Chart 8. Chart 7Narrowing Our Sector Tilts
Ukraine’s Grim Tidings
Ukraine’s Grim Tidings
Chart 8Shrinking Our Treasury Underweight
Ukraine’s Grim Tidings
Ukraine’s Grim Tidings
Doug Peta, CFA Chief US Investment Strategist dougp@bcaresearch.com Cyclical ETF Portfolio
Ukraine’s Grim Tidings
Ukraine’s Grim Tidings
The US February nonfarm payroll report was stellar. The world’s biggest economy added 678K jobs, versus a consensus of 423K. The unemployment rate fell to 3.8%, just a whisker above pre-pandemic levels. Wage growth came in at 5.1%, a deceleration from…
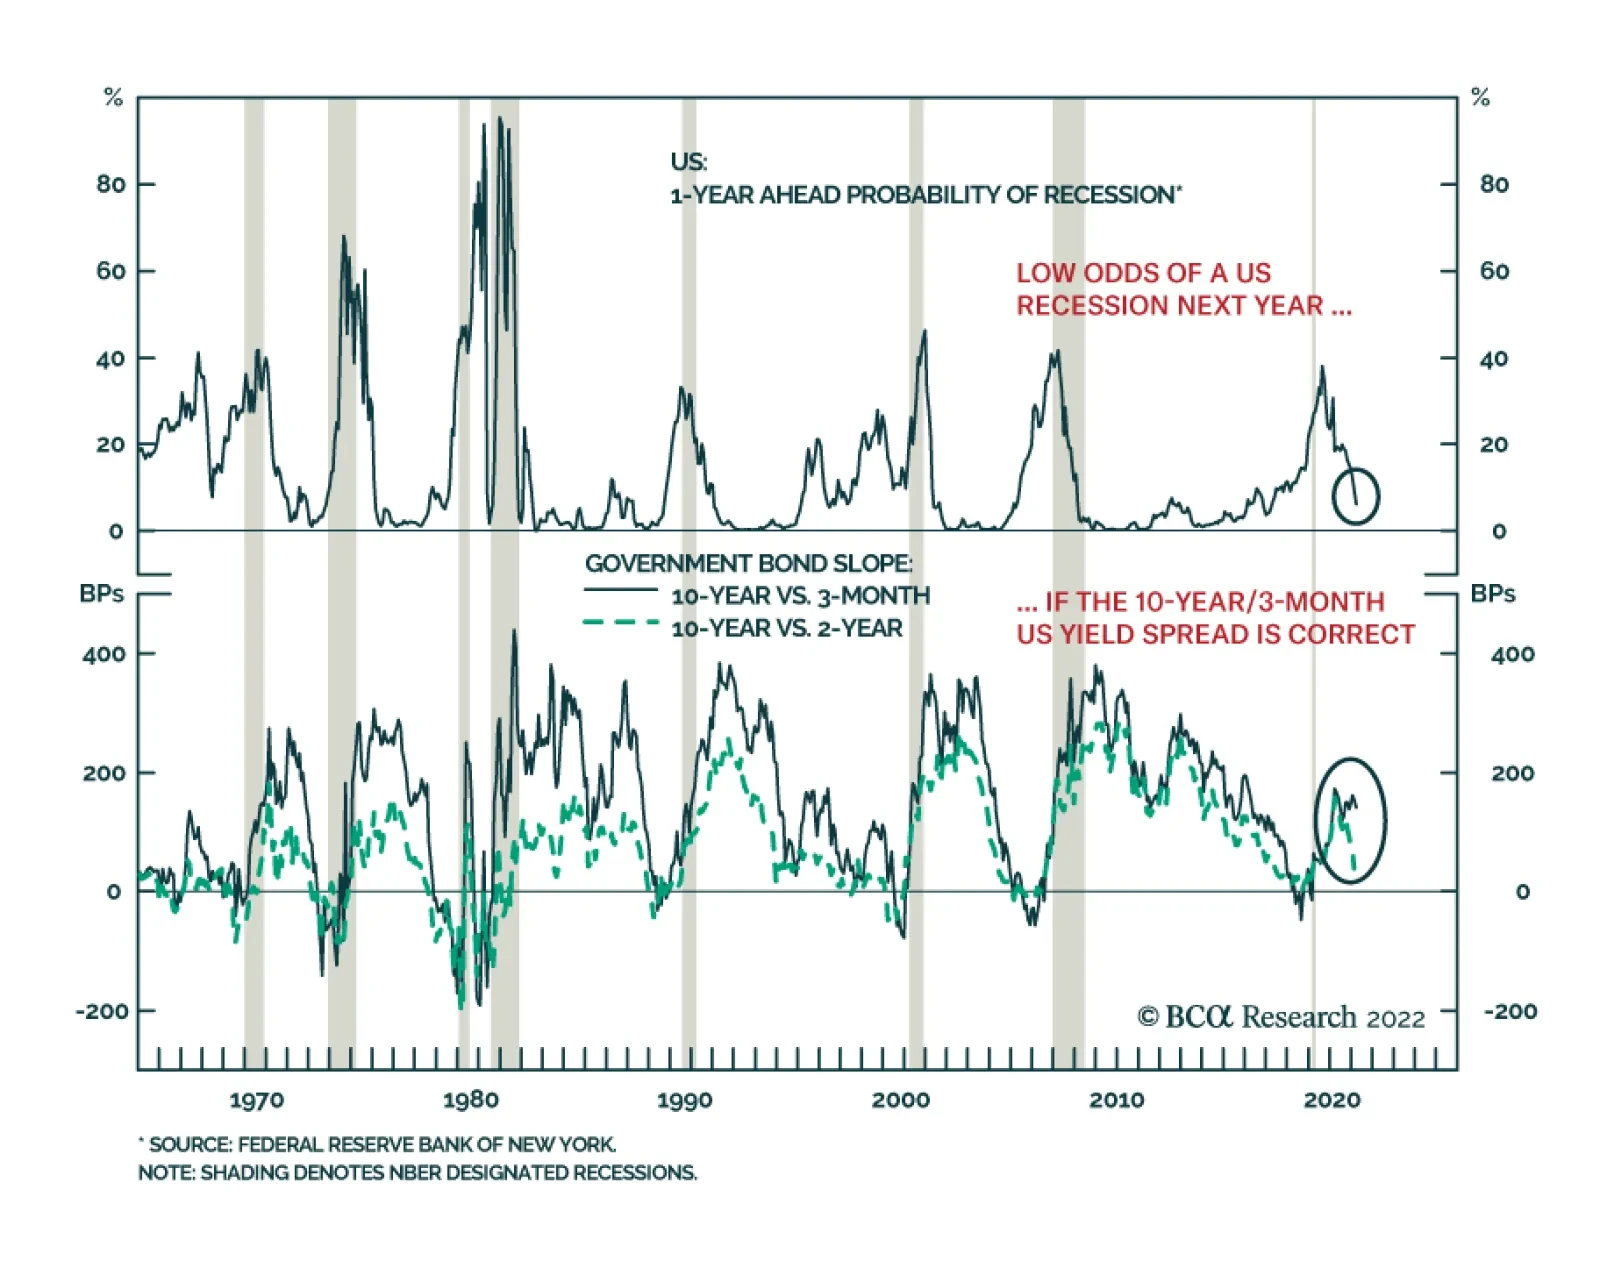
Every US recession since 1960 has been preceded by an inversion of the US Treasury curve, with shorter-maturity yields rising above longer-maturity ones. Currently, the yield spread between the 10-year and 2-year Treasuries is at 35bps, and on a…
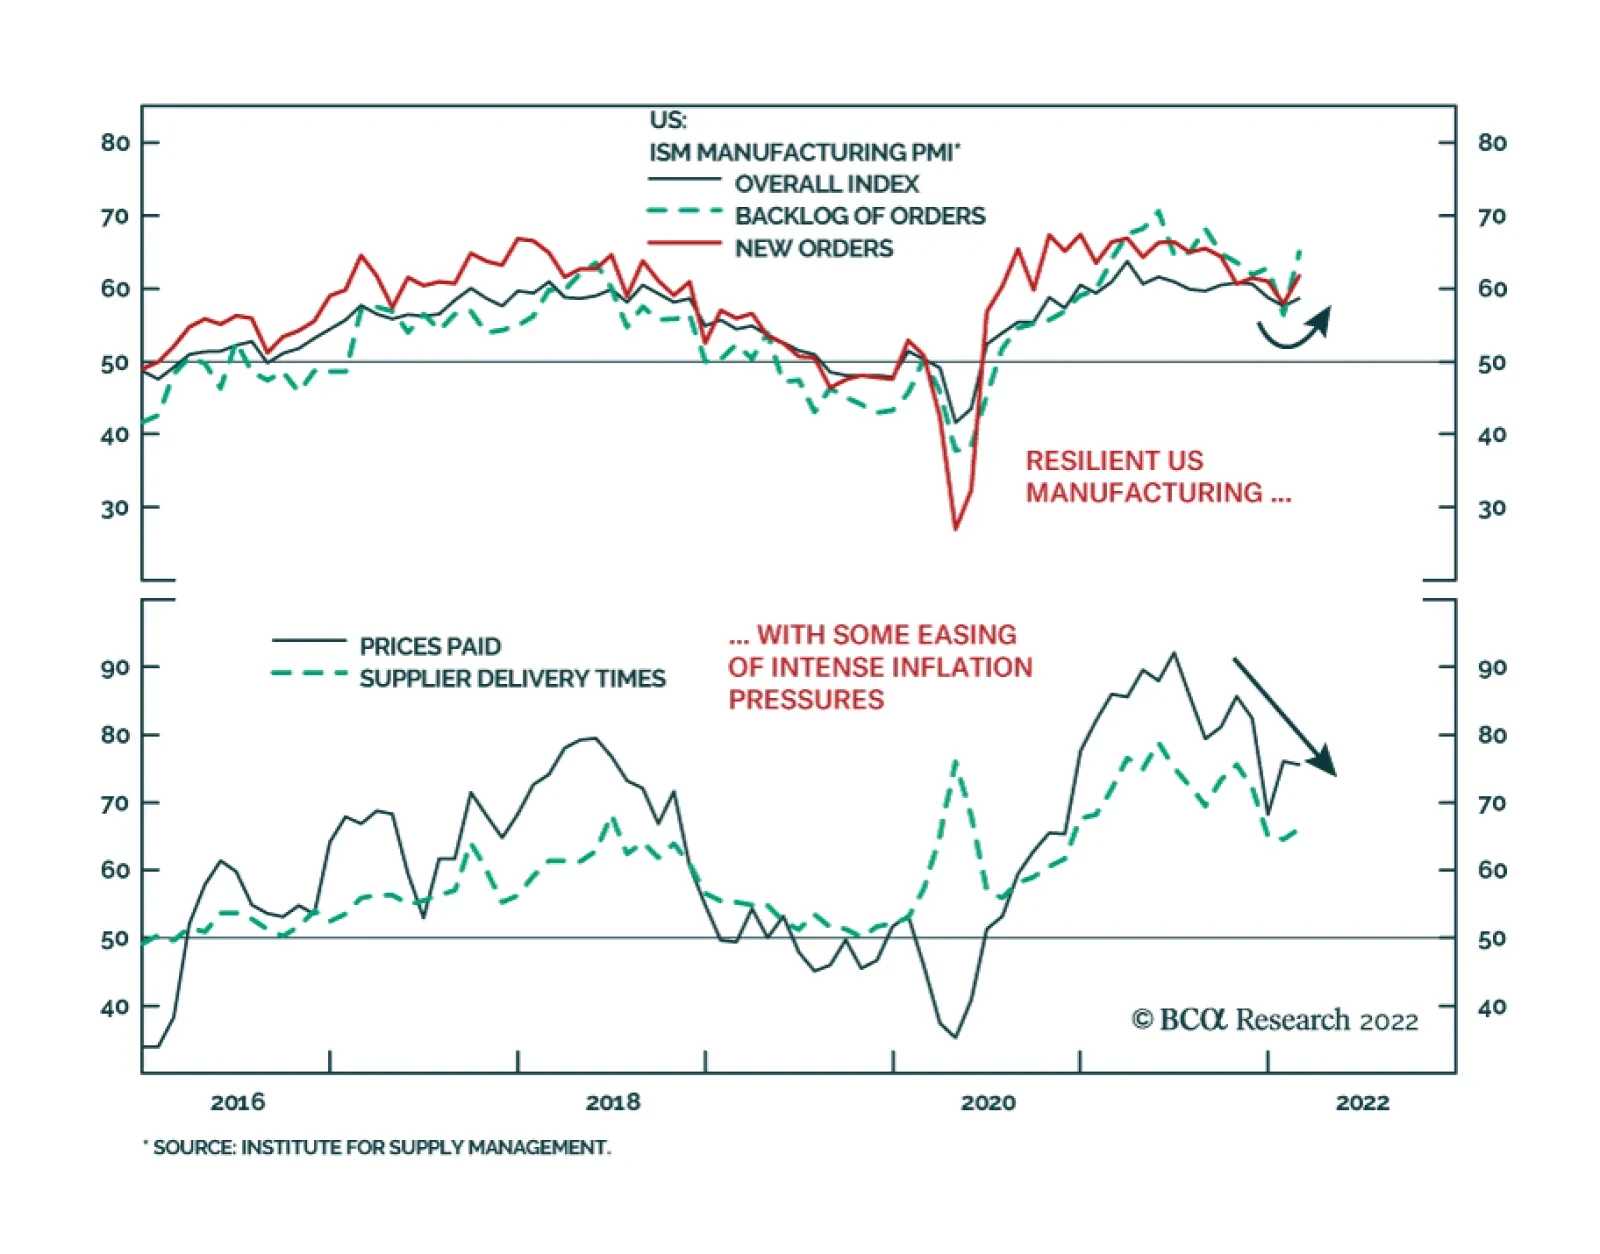
The February US manufacturing PMI report showed that the US economy was emerging from the Omicron-related softness during the previous three months. The overall index rose to 58.6 from 57.6 in January, a modest upside surprise versus the consensus…
Executive Summary Upgrade Global Duration Exposure To Neutral
Upgrade Global Duration Exposure To Neutral
Upgrade Global Duration Exposure To Neutral
The Russian invasion of Ukraine is a stagflationary shock that comes at a difficult time for developed market central banks that have been laying the groundwork for a tightening cycle. We tactically upgraded our recommended duration exposure in the US to neutral last week, as the market was pricing in too much Fed tightening in 2022. We are doing similar upgrades in non-US government bonds this week for the same reason. We are maintaining our cyclical country allocations, however, as those remain in line with interest rate pricing beyond 2022. We are underweight markets where terminal rate expectations remain too low (the US, UK & Canada) and overweight countries where markets are discounting too many rate hikes in 2023/24 (Germany, Japan, Australia). In light of the instability caused by the Russian invasion of Ukraine, we are reducing weightings in our model bond portfolio to credit sectors highly exposed to the war - European high-yield and emerging market hard currency debt. Bottom Line: The Ukraine war comes at a time when global growth momentum was already starting to roll over and with global inflation momentum set to peak soon. Upgrade duration exposure to neutral from underweight in global bond portfolios. Feature Among the tail risks that investors contemplated in their planning for 2022, World War III was likely not ranked too highly on the list. The horrific images of the Russian invasion of Ukraine – and the sharp response of the West to isolate Russia through unprecedented economic and financial sanctions - have shocked global financial markets that had been focused on relatively mundane concerns like the timing of interest rate hikes. BCA sent a short note to all clients late last week that discussed the investment implications of the invasion for several asset classes. In this report, we consider the bond market ramifications of war in Eastern Europe. Our main conclusion is that the Ukraine situation will produce a brief “stagflationary” shock that will boost global inflation and slow global growth, on the margin. High energy prices will be the main driver of that stagflation, given the uncertainties over the availability of Russian oil and natural gas supplies (Chart 1). Tighter financial conditions - beyond what has already occurred so far this year as global equity and credit markets have sold off (Chart 2) – will also contribute to the moderation of the pace of global growth. Chart 1A Mild Inflationary Shock From The Russian Invasion
A Mild Inflationary Shock From The Russian Invasion
A Mild Inflationary Shock From The Russian Invasion
Chart 2The Ukraine War Is Adding To 2022 Risk-Off Trends
The Ukraine War Is Adding To 2022 Risk-Off Trends
The Ukraine War Is Adding To 2022 Risk-Off Trends
The stagflation shock should be relatively short, perhaps 3-6 months. BCA’s Commodity & Energy Strategy service expects OPEC to eventually supply more oil to the global market – a move that was already likely before the Russian invasion – helping to reduce the Russian supply premium in oil prices. Putin will likely have to be satisfied with claiming eastern Ukraine rather than being stuck in a protracted battle with fierce Ukrainian resistance while Russia suffers under crippling sanctions. BCA’s Geopolitical Strategy service does not expect the conflict to spread beyond Ukraine’s borders, as neither Russia nor NATO have an interest in war with each other (despite the nuclear saber-rattling by Russian President Putin in response to Western sanctions). A mild bout of stagflation will only delay, and not derail, the cyclical move towards tighter global monetary policies in response to elevated inflation and tightening labor markets, particularly in the US. This will take some of the upward pressure off global bond yields as central banks will be less hawkish than expected in 2022, but does not change the outlook for higher bond yields in 2023 and 2024. In terms of changes to our fixed income investment recommendations, and the allocations to our Model Bond Portfolio, we come to the following three conclusions. Upgrade Tactical Non-US Duration Exposure To Neutral We recently upgraded our recommended tactical duration exposure in the US to neutral, with the Fed likely to deliver fewer rate hikes this year than what is discounted by markets. The Ukraine situation makes it even more likely that the Fed will underwhelm expectations. A 50bp rate hike at the March FOMC meeting is now off the table, as the equity and credit market selloffs in response to the conflict have tightened US (and global) financial conditions on the margin. However, the war is not enough of a negative shock to US growth to derail the Fed from starting a gradual tightening process this month with a 25bp hike. Our decision to change our US duration stance was largely predicated on a view that US inflation will soon peak and slow significantly over the rest of 2022. However, there is a strong case to increase non-US duration exposure, as well. Our Global Duration Indicator - comprised of leading cyclical growth indicators and which itself leads the year-over-year change in our “Major Countries” GDP-weighted aggregate of 10-year government bond yields by around six months - peaked back in February 2021 (Chart 3). The Global Duration Indicator is now at a “neutral” level consistent with more stable bond yield momentum. Declines in the ZEW economic expectations survey in the US and Europe, and in our global leading economic indicator, are the main culprits behind the fall in the Global Duration Indicator (Chart 4). Chart 3Upgrade Global Duration Exposure To Neutral
Upgrade Global Duration Exposure To Neutral
Upgrade Global Duration Exposure To Neutral
Chart 4Growth Expectations Have Turned Less Bond Bearish ... For Now
Growth Expectations Have Turned Less Bond Bearish ... For Now
Growth Expectations Have Turned Less Bond Bearish ... For Now
While the ZEW series have rebounded in the first two months of 2022, which could set the stage for a move back to higher yields later this year, the Ukraine situation will likely hurt economic expectations (particularly in Europe) in the near-term. We expect our Global Duration Indicator to continue signaling a more neutral backdrop for global bond yields over the next few months. In our Model Bond Portfolio on pages 13-14, we are expressing our view change by increasing the duration for all countries such that the overall duration of the portfolio is in line with the custom benchmark index (7.5 years). Importantly, we view this as only a tactical view change for the next few months, as developed economy interest rate markets are still discounting too few rate hikes – and in some countries like the UK and US, actual rate cuts – in 2023/24 (Chart 5). Chart 5Priced For Short, Shallow Hiking Cycles
Priced For Short, Shallow Hiking Cycles
Priced For Short, Shallow Hiking Cycles
Maintain Cyclical Government Bond Country Allocations That Favor Lower Inflation Regions Chart 6Oil Is Inflationary Now, Will Be Disinflationary Later
Oil Is Inflationary Now, Will Be Disinflationary Later
Oil Is Inflationary Now, Will Be Disinflationary Later
While we are neutralizing our global duration stance over a tactical time horizon (0-6 months), we are sticking with our current recommended cyclical (6-18 months) government bond country allocations. These are based on underlying inflation trends and the expected monetary policy response over the next couple of years. As noted earlier, BCA’s commodity strategists expect oil prices to fall from current war-elevated levels in response to increased supply from OPEC. The benchmark Brent oil price is forecasted to reach $88/bbl at the end of this year and $87/bbl and the end of 2023. The result will be a sharp decline in the year-over-year growth rate of oil prices that will help bring down headline inflation in all countries (Chart 6). Lower energy inflation, however, will not be the only factor reducing overall inflation across the developed world. Goods price inflation should also slow from current elevated levels over the next 6-12 months, as consumer spending patterns shift away from goods towards services with fewer pandemic-related restrictions on activity. Less goods spending will help ease some of the severe supply chain disruptions that have fueled the surge in global goods price inflation over the past year. That process has likely already begun – indices of global shipping costs have peaked and supplier delivery times have been shortening according to global manufacturing PMI surveys. The shift from less goods spending towards more services spending will lead to trends in overall inflation being determined more by services prices than goods prices. The central banks in countries that have higher underlying inflation, as evidenced by faster services inflation, will be under more pressure to tighten policy over the next couple of years. Therefore, our current cyclical recommended country allocations (and our Model Bond Portfolio weightings) within developed market government bonds reflect the relative trends in services inflation. We are currently recommending underweights in the US, UK and Canada where services inflation is currently close to 4%, well above the central bank 2% inflation targets (Chart 7). At the same time, we are recommending overweights in core Europe (Germany and France) and Australia, where services inflation is around 2.5%, and Japan where services prices are deflating (Chart 8). Chart 7Higher Underlying Inflation In Our Recommended Underweights
Higher Underlying Inflation In Our Recommended Underweights
Higher Underlying Inflation In Our Recommended Underweights
Chart 8Lower Underlying Inflation In Our Recommended Overweights
Lower Underlying Inflation In Our Recommended Overweights
Lower Underlying Inflation In Our Recommended Overweights
Chart 9Faster Wage Growth In Our Recommended Underweights
Faster Wage Growth In Our Recommended Underweights
Faster Wage Growth In Our Recommended Underweights
The trends in services inflation are also reflected in wage growth in those same groups of countries – much higher in the US, UK and Canada compared to Australia, the euro area and Japan (Chart 9). We expect these relative trends to continue over the next 12-24 months, with higher underlying inflation pressures forcing the Fed, the Bank of England (BoE) and the Bank of Canada (BoC) to be much more hawkish, on a relative basis, than the European Central Bank (ECB), the Reserve Bank of Australia (RBA) and the Bank of Japan (BoJ). Our current bond allocations not only fit with underlying inflation trends, but also with market-based interest rate expectations. In Table 1, we show the pricing of interest rate expectations over the next few years, taken from Overnight Index Swap (OIS) forwards. We show the OIS projection for 1-month interest rates 12 months from now and 24 months from now. We also include 5-year/5-year forward OIS rates as a measure of market expectations of the terminal rate, a.k.a. the peak central bank policy rate over the next tightening cycle. In the table, we also added neutral policy rate estimates taken from central bank sources.1 Table 1Medium-Term Interest Rate Expectations Still Too Low In The US & UK
Adjusting Our Bond Recommendations For A More Uncertain World
Adjusting Our Bond Recommendations For A More Uncertain World
In the US and UK, the OIS rate projections two years out, as well as the 5-year/5-year forward rate, are below the range of neutral rate estimates. This justifies an underweight stance on both US Treasuries and UK Gilts with both the Fed and BoE now in tightening cycles. In Japan and Australia, the OIS projections are already within the range of neutral rate estimates, but the RBA and, especially, the BoJ are not yet signaling a need to begin normalizing the level of policy rates. This justifies an overweight stance on Australian government bonds and Japanese government bonds. In the euro area, OIS projections are below the range of neutral rate estimates, but the ECB is now signaling that any monetary tightening actions will need to be delayed because of the growth uncertainties stemming from the Ukraine conflict and high energy prices. Thus, an overweight stance on core European government debt is still warranted. In Canada, the OIS projections are within the range of neutral rate estimates, but the BoC has been preparing markets for a series of rate hikes. This makes our underweight stance on Canadian government bonds a more “mixed” call, although we remain confident that Canadian bonds will underperform in a global bond portfolio context versus European and Japanese government bonds. In sum, we see our recommended country allocations as the most efficient way to express our cyclical (medium-term) central bank views, given the strong link between forward interest rate expectations and longer-term bond yields (Chart 10). This is why we are not making changes to our country allocation recommendations alongside our move to tactically upgrade our global duration stance to neutral. Chart 10Too Much Tightening Priced Over The Next Year
Too Much Tightening Priced Over The Next Year
Too Much Tightening Priced Over The Next Year
Chart 11Bond Markets Not Priced For A Relatively More Hawkish Fed
Bond Markets Not Priced For A Relatively More Hawkish Fed
Bond Markets Not Priced For A Relatively More Hawkish Fed
Given our high-conviction view that markets are underestimating how high the Fed will need to lift interest rates in the upcoming tightening cycle – likely more than any other major developed economy central bank - positioning for US Treasury market underperformance on a 1-2 year horizon still looks like an attractive bet with forward rates priced for little change in US/non-US bond spreads (Chart 11). A wider US Treasury-German Bund spread remains our highest conviction cross-country spread recommendation. Reduce Spread Product Exposure In Europe & Emerging Markets Chart 12Cut EM & European High-Yield Exposure, But Stay O/W Italian BTPs
Cut EM & European High-Yield Exposure, But Stay O/W Italian BTPs
Cut EM & European High-Yield Exposure, But Stay O/W Italian BTPs
The geopolitical uncertainty stemming from the Ukraine war and the stagflationary near-term impact of high energy prices are negatives for all risk assets, on the margin. That leads us to tactically reduce the allocation to spread product to neutral versus government debt in our Model Bond Portfolio. We are implementing this by cutting allocations to riskier fixed income sectors that are most impacted by the Russia/Ukraine conflict – European high-yield corporate debt and emerging market (EM) USD-denominated hard currency debt (Chart 12). We had already been cautious on EM debt before the Russian invasion, with an underweight allocation to both USD-denominated sovereigns and corporates, so the latest moves just increase the size of the underweight. European high-yield, on the other hand, had been one of our highest conviction overweight positions – particularly versus US high-yield - entering 2022. However the Ukraine war is likely to have a bigger negative impact on the European economy than the US economy, thus we are cutting our recommended exposure to European high-yield only. The uncertainty of a war on European soil, combined with the spike in energy prices (especially natural gas), is negative for European growth momentum, reducing 2022 euro area real GDP growth by as much as 0.4 percentage points according to ECB estimates. This raises the hurdle for any ECB monetary tightening this year. An early taper of bond buying in the ECB’s Asset Purchase Program, an outcome that ECB officials claim is a required precursor to rate hikes, is now highly unlikely. Fears of reduced ECB bond buying had weighed on the relative performance of Italian government bonds last month, but a more dovish ECB policy stance should lead to lower Italian yields and a narrowing of the BTP-Bund spread (bottom panel). We continue to recommend a cyclical overweight stance on Italian government debt. A Final Thought We need to reiterate that the recommended changes made in this report – increasing global duration exposure to neutral and cutting EM and European high-yield – are over a tactical time horizon, largely in response to the Ukraine conflict. This is more of a “risk management” exercise, rather than a change in our fundamental cyclical views. We still believe global growth will remain above trend in 2022 and likely 2023, which will prevent a complete unwind of last year’s inflation surge, particularly in the US. We expect global bond yields to begin climbing again later this year and into 2023, and we envision an eventual return to a below-benchmark duration stance. Robert Robis, CFA Chief Fixed Income Strategist rrobis@bcaresearch.com Footnotes 1 The sources of the neutral rate estimates are listed in the footnotes of Table 1. GFIS Model Bond Portfolio Recommended Positioning Active Duration Contribution: GFIS Recommended Portfolio Vs. Custom Performance Benchmark
Adjusting Our Bond Recommendations For A More Uncertain World
Adjusting Our Bond Recommendations For A More Uncertain World
The GFIS Recommended Portfolio Vs. The Custom Benchmark Index
Adjusting Our Bond Recommendations For A More Uncertain World
Adjusting Our Bond Recommendations For A More Uncertain World
Global Fixed Income - Strategic Recommendations* Tactical Overlay Trades
Executive Summary Russian Stocks Are Breaking Below Their 2008 And 2015 Lows
Russian Stocks Are Breaking Below Their 2008 And 2015 Lows
Russian Stocks Are Breaking Below Their 2008 And 2015 Lows
The Kremlin will not halt its military operations in Ukraine for now. The strategic objective of Putin is to bring Ukraine back into its geopolitical and economic orbit. His immediate goal is to unseat the current government in Kyiv and install a pro-Kremlin administration. Russia is embracing a long period of economic and financial isolation. Russian financial markets will remain uninvestable for an extended period. We are downgrading Central European equities and local currency bonds to underweight within their respective EM portfolios. As a new trade, we recommend shorting the Polish zloty versus the US dollar. Recommendation Inception Date Return Short PLN / Long USD Mar 02, 2022 Bottom Line: The security situation in Europe will continue to deteriorate, especially if the Russian army fails to secure a rapid military victory. This poses a risk to global and EM risk assets. Within a global equity portfolio, investors should overweight the US, and underweight EM and Europe. Feature Global macro has taken a back seat and geopolitics has become the dominant driver of financial markets. Still, we believe geopolitical risks are underappreciated by global financial markets. Will Western Sanctions Halt Russia’s Military Operation? While sanctions have started and will continue to hurt the Russian economy and its financial system, the Kremlin will not halt its military operations in Ukraine for now. The strategic objective of Putin is to bring Ukraine back into its geopolitical and economic orbit. His immediate goal is to unseat the current government in Kyiv and install a pro-Kremlin administration. In fact, having already incurred considerable economic and financial costs, Russia will not pull back its army anytime soon. If anything, Russia’s rhetoric and actions will get more aggressive in the coming weeks. For now, the Kremlin will not agree to anything short of the surrender of Ukraine’s government and its army. In turn, Ukraine authorities and its military intend to continue fighting with the support of arms supplies from the West. As a result, any peace talks will be futile. The situation will thus continue to escalate and the risk premium in global financial markets will rise further. The global political uncertainty index will be rising and, as a rule of thumb, it heralds a lower P/E ratio for global equities (Chart 1). Chart 1Rising Geopolitical Risks = Lower P/E Ratio
Rising Geopolitical Risks = Lower P/E Ratio
Rising Geopolitical Risks = Lower P/E Ratio
The main question is, therefore, how bad could it get? We believe the conflict might take a turn for the worse. If the Russian military fails to achieve its goal to remove the current government in Kyiv, Putin will go all out. Losing this war is not an option for him. The failure of the Kremlin to secure a rapid military victory implies a massive escalation on two fronts: (1) the military actions of the Russian army in Ukraine will intensify and civilian infrastructure and potentially the population at large might be threatened; and (2) Russia will become more aggressive in its threats to the West. If and when Putin perceives that his military operation is failing or his power is threatened at home, he will resort to the extreme actions he has been warning about. Putin will bolster his military threats to Europe and to the US. In such a scenario, global risk assets will tank. Bottom Line: The security situation in Europe will continue to deteriorate, especially if the Russian army fails to secure a rapid military victory. Investors should position their portfolio to account for the fact that things will get worse before they improve. Russian Markets Are Uninvestable Chart 2No Buyers For Russian Bonds
No Buyers For Russian Bonds
No Buyers For Russian Bonds
Russian markets have become uninvestable and will remain so for some time (Chart 2). The elevated odds of further military escalation in Ukraine entails more downside in Russian financial assets. Additional sanctions on the Russian economy cannot be ruled out at this point. These sanctions as well as the capital controls imposed by Russia on both residents and non-residents make Russian financial markets uninvestable. We downgraded Russian stocks to underweight within an EM equity portfolio on December 17, 2021, arguing that geopolitical tensions surrounding Ukraine would escalate. Chart 3 suggests that Russian share prices in USD terms are about to break below their 2008 and 2015 lows. Technically speaking, if this transpires, it will entail considerable downside. Similarly, the ruble versus an equally-weighted basket of the US dollar and euro on a total return basis has formed a technically bearish head-and-shoulders configuration (Chart 4, top panel). Notably, the ruble’s real effective exchange rate based on both CPI and PPI is not as cheap as it was in 1998 and 2015 (Chart 4, bottom panel). Chart 4More Downside In The Ruble
More Downside In The Ruble
More Downside In The Ruble
Chart 3Russian Stocks Are Breaking Below Their 2008 And 2015 Lows
Russian Stocks Are Breaking Below Their 2008 And 2015 Lows
Russian Stocks Are Breaking Below Their 2008 And 2015 Lows
The sanctions have effectively cut off the largest Russian commercial banks1 from the SWIFT electronic system and frozen the central bank of Russia’s (CBR) foreign exchange reserves deposited at foreign institutions. As of June 2021, roughly US$ 377 billion out of US$ 585 billion of Russian foreign exchange reserves were held in Western commercial banks or institutions, most of it in liquid financial securities. Meanwhile, the rest were held either in gold physical holdings (US$ 127 billion) or at Chinese institutions (US$ 80 billion). If all western countries freeze the CRB’s assets held at their banks, Russia’s effective foreign exchange reserves will be down to US$ 207 billion. This assumes the amount of international reserves at western banks has not changed since June 2021. As a result, the ratio of the central bank’s foreign reserves-to-broad money supply (all household and corporate local currency deposits) has dropped from 0.9 to 0.6 (Chart 5). This suggests that the central bank’s available amount of foreign exchange reserves coverage of broad money supply has been reduced dramatically in recent days due to economic and financial sanctions. This and a massive flight of capital out of the country has led the authorities to impose capital controls. Also, the government is compelling domestic exporting firms to sell 80% of their foreign generated revenues. Will the West lift sanctions right after the war in Ukraine ends? We doubt it. In our view, Russia is embracing a long period of economic and financial isolation. Besides, Russia lacks the manufacturing capabilities needed to mitigate the effects of these sanctions. Chart 6 shows that Russia has been investing little outside resource sectors and real estate. At 8-8.5% of GDP, investment in non-resource sectors excluding properties has been too low for too long. Chart 5Russia: FX Reserves' Coverage Of Money Supply
Russia: FX Reserves' Coverage Of Money Supply
Russia: FX Reserves' Coverage Of Money Supply
Chart 6Russia Has Not Been Investing Much
Russia Has Not Been Investing Much
Russia Has Not Been Investing Much
This entails that Russia cannot become self-sufficient in many manufacturing sectors and technology. Trade with China will be the main channel that Russia can secure the manufacturing goods, machinery and technology it requires. Still, this will not allow the Russian economy to avoid a prolonged period of stagflation. Bottom Line: Odds are high that Russian financial markets will remain uninvestable for an extended period. The Russia economy is facing years of stagflation. Central European Financial Markets: Contagion Or An Existential Threat? Chart 7Central European Currencies Will Depreciate
Central European Currencies Will Depreciate
Central European Currencies Will Depreciate
Although Central European countries are not at risk from Russia’s military attack, their financial markets will remain jittery for a while. We are downgrading Polish, Czech and Hungarian equities, currencies and domestic bonds to underweight (Chart 7). The likelihood of strikes on Poland, the Baltic states or any other neighboring NATO member country is very low. Attacking a NATO member would trigger Article V of NATO and force the organization to defend its member. Importantly, we do not think the Kremlin has the appetite for war against NATO. Even though Russia is unlikely to stage an attack on any NATO member, there could still be threats from Moscow and escalation involving central European countries. This will be especially so if Putin fails to secure the change of government in Kyiv in the coming weeks and starts threatening the West due to the latter’s support of Ukraine. As a result, Central European financial markets will continue selling off further in response to this potential escalation. Bottom Line: We are downgrading Central European equities and local currency bonds to underweight within a respective EM universe. We are maintaining the long CZK / short HUF trade. As a new trade, we recommend shorting the Polish zloty versus the US dollar. Investment Recommendations Global share prices will continue selling off. Our US equity capitulation indicator has fallen significantly but is not yet at 2010, 2011, 2015-16 and 2018 levels (Chart 8). It will at least reach this level before the S&P 500 bottoms. Chart 8The S&P 500 Selloff Is Not Over
The S&P 500 Selloff Is Not Over
The S&P 500 Selloff Is Not Over
Our capitulation indicator for EM stocks is not low yet either (Chart 9). Hence, there is more downside. Investors should continue to take a defensive stance. Chart 9EM Stocks: Is There A Capitulation Phase Still Ahead?
EM Stocks: Is There A Capitulation Phase Still Ahead?
EM Stocks: Is There A Capitulation Phase Still Ahead?
Chart 10US Stocks Are About To Resume Their Relative Outperformance
US Stocks Are About To Resume Their Relative Outperformance
US Stocks Are About To Resume Their Relative Outperformance
Within a global equity portfolio, investors should overweight the US, and underweight EM and Europe. As US/global bond yields drop due to geopolitical jitters, the US stock market and growth stocks will resume their outperformance, at least for a period of time (Chart 10). Within an EM equity portfolio, we recommend overweighting Brazil, Mexico, Chinese A-shares, Singapore and Korea and underweighting Russia, Central Europe, South Africa, Indonesia, Turkey, Peru, Chinese Investable Stocks, Colombia and Chile. EM currencies and fixed-income markets remain vulnerable as the global risk off move causes the US dollar to spike. Arthur Budaghyan Chief Emerging Markets Strategist arthurb@bcaresearch.com Andrija Vesic Associate Editor andrijav@bcaresearch.com Footnotes 1 Following the invasion of Ukraine on February 26, the US administration added the two largest Russian banks, Sberbank and VTB Bank, to the sanction lists. Both banks combined total assets represent close to 40% of total Russian banking system assets.
According to BCA Research’s Global Investment Strategy service, hopes of an imminent peace deal between Russia and Ukraine will be dashed. The conflict will worsen over the coming days. As was the case during the original Cold War, both sides will…
Executive Summary Wars Don’t Usually Affect Markets For Long
Monthly Portfolio Update: Keep Calm And Stay Invested
Monthly Portfolio Update: Keep Calm And Stay Invested
We expect the war in Ukraine to stay within its borders, and therefore to have little impact on global growth. Markets will be volatile, but we recommend allocators stay invested – with some moderate hedges in place. The Fed won’t tighten as fast as markets expect, and US long rates will not rise much further this year. So, within fixed-income, we raise government bonds to neutral. Flat rates remove a positive for the Financials equity sector, which we lower to neutral. The oil price will fall back to $85 by the second half, as Saudi and others increase supply. We reduce our recommendation for Canadian equities and the CAD. Recommendation Changes
Monthly Portfolio Update: Keep Calm And Stay Invested
Monthly Portfolio Update: Keep Calm And Stay Invested
Bottom Line: Stay invested in risk assets, but have some hedges. We shift from Financials to the defensive-growth IT sector, raise our weight in UK equities, and suggest long positions in cash, CHF and JPY. Recommended Allocation
Monthly Portfolio Update: Keep Calm And Stay Invested
Monthly Portfolio Update: Keep Calm And Stay Invested
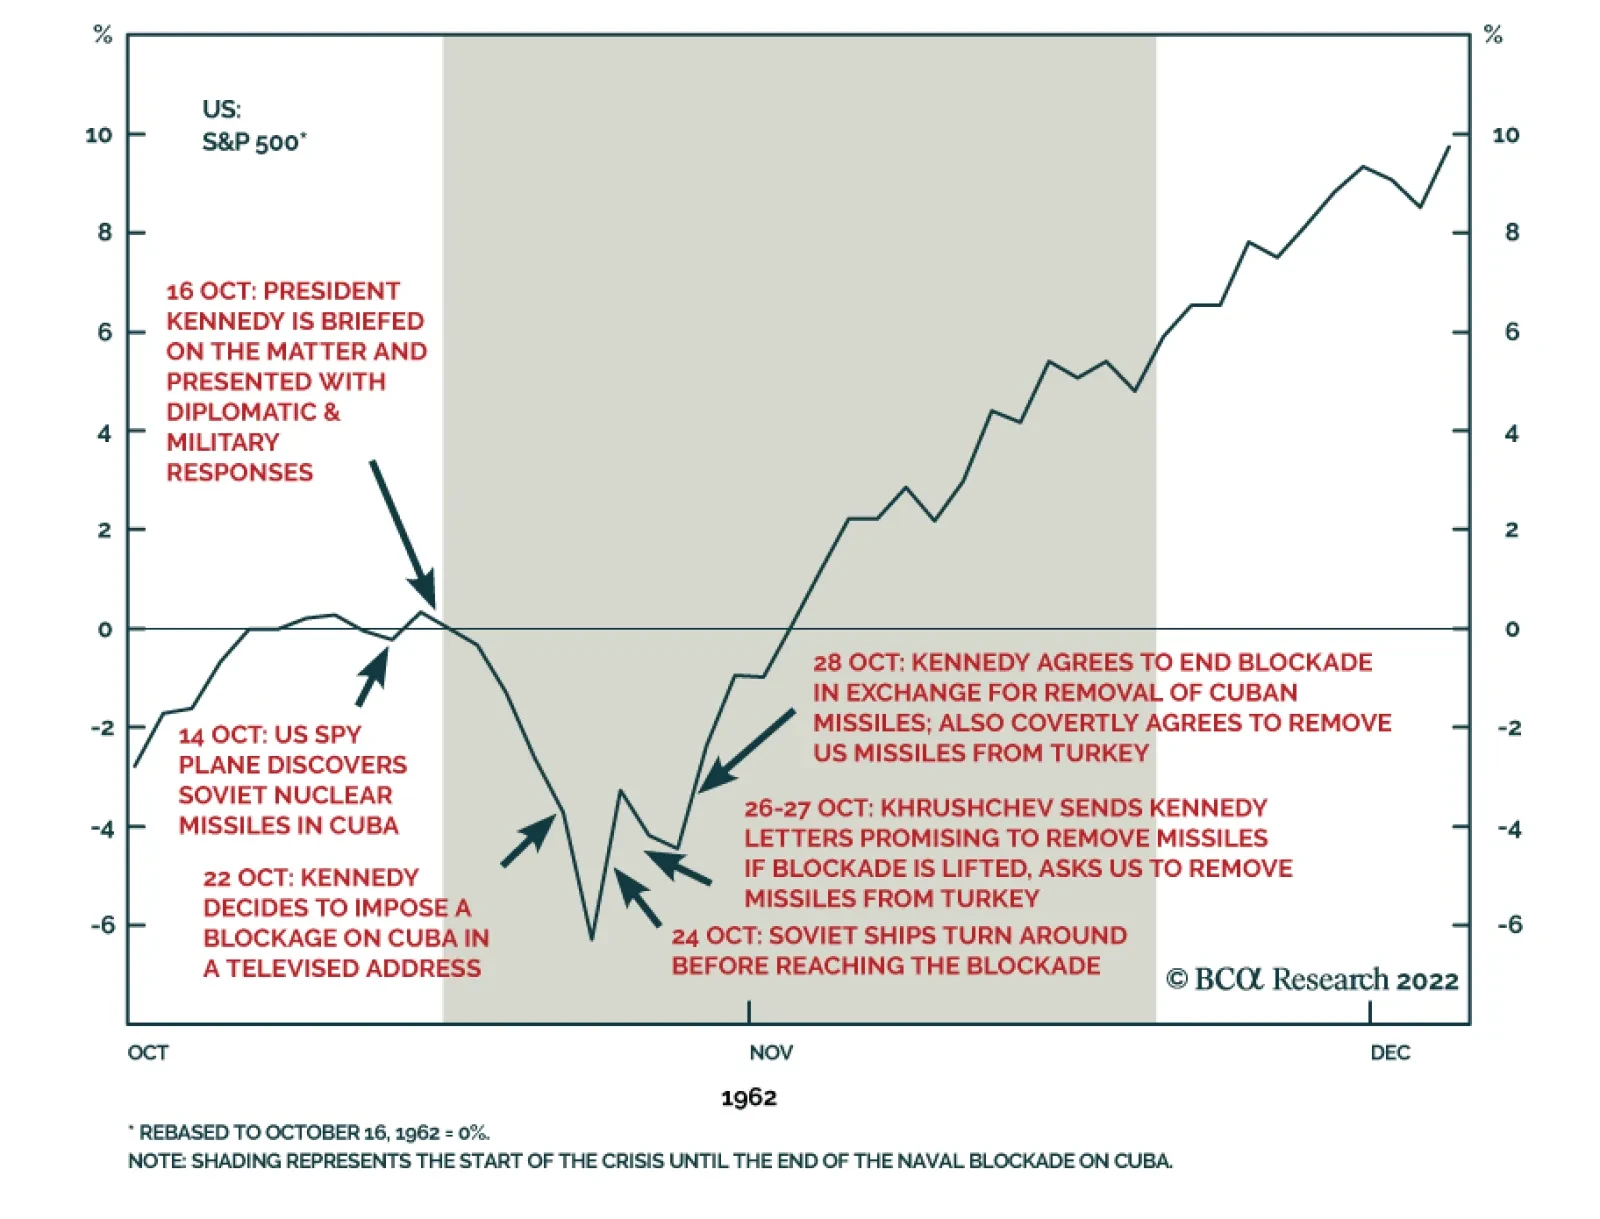
The war in Ukraine is likely to have only a limited impact on markets beyond the short term. As disturbing as the human tragedy is, Russia’s aims are limited to regime change in Kyiv. The European Union and US face restraints on how draconian sanctions against Russia can be, balking (so far at least) at blocking imports of Russian energy to the EU, given how much this would hurt the economy. The risk of the conflict spreading beyond Ukraine’s borders is low, limited perhaps to cyberattacks on Western targets. A Russian attack on a NATO member, such as Poland or one of the Baltic states, is extraordinarily unlikely – though Moldova and Georgia (not NATO members) might be more vulnerable at some point in the future. For more detailed analysis, please read the two reports on the Ukraine situation by our Geopolitical Service that we have made available to all BCA Research subscribers.1 Asset allocators need to look at these events dispassionately. Markets are likely to remain volatile over the coming months, as events in Ukraine unfold. But the lesson of most major conflicts is that they typically do not have a long-lasting impact on asset performance (Chart 1). There is little chance that the Ukraine war will significantly dent global growth. The only exception would be if the oil price were to rise much further to, say, $120 a barrel as some are forecasting. Certainly, in the past, a jump in the oil price has often been associated with recessions – even though the causality is unclear (Chart 2). But BCA’s Energy strategists expect to see an increase in oil supply by Saudi Arabia and Gulf states which will bring Brent crude back to $85 by the second half (from $98 now). Chart 1Wars Don't Usually Affect Markets For Long
Wars Don't Usually Affect Markets For Long
Wars Don't Usually Affect Markets For Long
Chart 2But A Jump In Oil Prices Would
But A Jump In Oil Prices Would
But A Jump In Oil Prices Would
Meanwhile, global growth remains robust, with all major economies expected to continue to grow well above trend this year, supported by robust consumption and capex (Chart 3). And sentiment towards equities has turned very pessimistic since the start of the year, with indicators such the US Association of Individual Investors’ weekly survey at its most bearish level since 2008 (Chart 4). These sort of sentiment levels have typically pointed to a rebound in risk assets. Chart 4Sentiment Is At Rock-Bottom
Sentiment Is At Rock-Bottom
Sentiment Is At Rock-Bottom
Chart 3Economic Growth Still Above Trend
Monthly Portfolio Update: Keep Calm And Stay Invested
Monthly Portfolio Update: Keep Calm And Stay Invested
Our advice now would be to stay invested, but with some moderate safe-haven hedges in place – largely as we have recommended since late last year. We continue to recommend an overweight in cash, but will look to allocate this to risk assets when it becomes clearer how the situation in Ukraine will pan out. The trajectory of markets over the rest of this year still largely comes down to what the Fed and other central banks will do. The hawkish turn by the Fed in December has been the driver of markets in the past two months, with the result that none of the major asset classes have produced positive returns year to-date – only inflation hedges such as commodities and gold (Chart 5). Chart 5Most Asset Classes Are Down Year-To-Date
Monthly Portfolio Update: Keep Calm And Stay Invested
Monthly Portfolio Update: Keep Calm And Stay Invested
The futures market is pricing the Fed to raise rates seven times over the next 12 months, the fastest rate of predicted tightening since the early 2000s (Chart 6). We think that is a little excessive. Inflation, as we have argued previously, is likely to fade over the coming quarters, as the supply response to strong consumer demand for manufactured goods brings down the price of cars, semiconductors, shipping and other major items. The Fed may well start in March with the intention of raising rates by 25bps every meeting, but the slowing of inflation we expect, and the tightening of financial conditions already under way (Chart 7), make it unlikely that it will continue at that pace. And remember that Fed policy will need to be even more hawkish than the market is currently pricing in for it to have an incrementally negative impact on risk assets. Chart 6Market Believes Fed Will Hike Fast
Market Believes Fed Will Hike Fast
Market Believes Fed Will Hike Fast
Chart 7Financial Conditions Have Already Tightened
Financial Conditions Have Already Tightened
Financial Conditions Have Already Tightened
There are certainly risks to this scenario. The forward yield curve is pointing to inversion one year ahead, something which normally presages recession over the following 1-3 years (Chart 8). Higher prices are starting to hurt consumer confidence, though there is a big disparity between the two main US indicators (Chart 9). Chart 8Will Yield Curve Invert Within A Year?
Will Yield Curve Invert Within A Year?
Will Yield Curve Invert Within A Year?
Chart 9Inflation May Be Hurting Consumer Confidence
Inflation May Be Hurting Consumer Confidence
Inflation May Be Hurting Consumer Confidence
What all this boils down to is how high a level of interest rates the economy is able to withstand. The futures markets imply that, in most countries, central banks will raise rates aggressively this year, but then be forced to stop or even cut rates after that because their actions cause an economic slowdown (Table 1). Our view is that the terminal rate is much higher than what is priced by markets and projected by central banks: In the US perhaps 3-4% in nominal terms.2 Even with seven Fed hikes over the next year, the policy rate would therefore remain well below neutral – an environment in which historically equities have outperformed bonds (Chart 10). Table 1Central Banks Will Hike Aggressively – But Then Stop Soon
Monthly Portfolio Update: Keep Calm And Stay Invested
Monthly Portfolio Update: Keep Calm And Stay Invested
Chart 10Even In A Year, Rates Will Be Well Below Neutral
Even In A Year, Rates Will Be Well Below Neutral
Even In A Year, Rates Will Be Well Below Neutral
One final comment: On long-term returns. As a result of the recent moderate equity correction, strong earnings growth, and higher long-term rates, the outlook is somewhat rosier than when we published our most recent report on Return Assumptions in May 2021 – though admittedly forward long-term returns are still likely to be lower than over the past 20 years (Table 2). This is not, then, a time to turn defensive. Table 2Long-Term Return Outlook No Longer Looks So Gloomy
Monthly Portfolio Update: Keep Calm And Stay Invested
Monthly Portfolio Update: Keep Calm And Stay Invested
Fixed Income: In the short-term, government bonds look oversold (Chart 11). With inflation set to peak and the Fed likely to be less hawkish than the market has priced in, we do not see the 10-year US Treasury yield rising more than another 25 basis points or so above its current level this year. Accordingly, we are changing our duration call from underweight to neutral, and raise our recommendation for government bonds within the (still underweight) fixed-income bucket to neutral. For more cautious investors, a slight increase in government bond holdings might be warranted. Within credit, investment-grade bonds still offer little pickup, despite the moderate rise in spreads this year (from 92 to 121 in the US, for example), and so we lower this asset class to underweight. We continue to prefer high-yield bonds, which in the US now imply a jump in the default rate from 1.2% over the past 12 months to 4.5% over the coming year (Chart 12). As long as the economy grows in line with our expectations, that is very unlikely. Chart 11Government Bonds Look Oversold
Government Bonds Look Oversold
Government Bonds Look Oversold
Chart 12Will Defaults Really Jump This Much?
Will Defaults Really Jump This Much?
Will Defaults Really Jump This Much?
Equities: With the economy continuing to grow above-trend, global earnings should remain robust. This will not be a classic year for equity returns, but we expect them to do better than bonds. We continue to prefer US over European equities. As was seen in the aftermath of the invasion of Ukraine, US stocks are more defensive, and European growth will continue to be under threat from higher energy prices (Chart 13). We also move our recommended portfolio a little in the defensive direction by going overweight UK equities (which have a particularly high weight in defensive growth sectors, such as a 13 point overweight in Consumer Staples); we fund this by lowering Canadian equities to underweight, given their close linkage with oil (Chart 14), and the vulnerability of the Canadian housing market to rising rates. We remain underweight EM, but Chinese stocks (which were very oversold in late 2021) have been a relative safe haven as China started to stimulate, and so we continue with our neutral position for now. Chart 13Higher Energy Prices Threaten Europe
Higher Energy Prices Threaten Europe
Higher Energy Prices Threaten Europe
Chart 14Canadian Stocks Move With The Oil Price
Canadian Stocks Move With The Oil Price
Canadian Stocks Move With The Oil Price
Chart 15Financials Not So Attractive If Rates Don't Rise
Financials Not So Attractive If Rates Don't Rise
Financials Not So Attractive If Rates Don't Rise
Our view that long-term rates have limited upside this year makes us more cautious on Financials stocks, which are closely correlated with rates, and so we cut this sector to neutral (Chart 15). A period of slowing growth points towards a preference for defensive growth, and so we raise our recommended weight in the IT sector to overweight from neutral. It is tempting to think of this sector as being composed of ridiculously overvalued speculative internet names, but it is in fact dominated by established hardware and software titans with deep competitive moats (Table 3). While the sector is not exactly cheap, its risk premium over bonds is quite reasonable by historical standards (Chart 16). Table 3Tech Sector Is Not Made Up Of Speculative Stocks
Monthly Portfolio Update: Keep Calm And Stay Invested
Monthly Portfolio Update: Keep Calm And Stay Invested
Chart 16Tech Is Not Unreasonably Priced
Tech Is Not Unreasonably Priced
Tech Is Not Unreasonably Priced
Chart 17Relative Rates Suggest Some Upward Pressure On USD
Relative Rates Suggest Some Upward Pressure On USD
Relative Rates Suggest Some Upward Pressure On USD
Currencies: A neutral position on the US dollar still makes sense. Short-term rates are likely to rise somewhat faster in the US, relative to expectations, than in Europe or Japan (Chart 17). Nevertheless, the USD is expensive, and long-dollar is a consensus trade – reasons why the dollar has risen by less than 1% year-to-date on a trade-weighted basis, despite all the higher rate expectations and geopolitical shocks. Investors looking for hedges against downside risk might look to the Japanese yen, which is particularly cheap, and the Swiss franc. By contrast, the Canadian dollar, like Canadian equities, is closely linked to the oil price and a fallback in the Brent price would be negative; we move underweight. We also raise the CNY to neutral, since it may become a safe haven currency in the current geopolitical situation, though the Chinese authorities won’t let it rise too much since that would slow the economy. Commodities: China’s stimulus remains somewhat halfhearted (Chart 18). Although the credit and fiscal impulse has bottomed, we expect to see it rebound only moderately, with just minor cuts in interest rates and the reserve ratio. This will stabilize Chinese growth, but not cause a boom as in 2020, 2016 or 2013. The rise in industrial commodities prices, therefore, is likely to be limited from here. For oil, as mentioned above, we expect to see Brent crude return to around $85 by the second half, as new supply comes onto the market. Gold has done well, as expected, in the face of a major geopolitical event. But it is expensive by historical standards, vulnerable to a rise in real (as opposed to nominal rates) as inflation eases (Chart 19), and faces cryptocurrencies as a rival. We keep our neutral, as a hedge against the tail-risk of much higher inflation, but would not chase the price at this level. Chart 18China's Stimulus Isn't Enough To Help Metals Prices
China's Stimulus Isn't Enough To Help Metals Prices
China's Stimulus Isn't Enough To Help Metals Prices
Chart 19Rising Real Rates Are Negative For Gold
Rising Real Rates Are Negative For Gold
Rising Real Rates Are Negative For Gold
Garry Evans, Senior Vice President Global Asset Allocation garry@bcaresearch.com Footnotes 1 Please see Geopolitical Strategy Special Reports, “Russia Takes Ukraine: What Next?” dated February 24, 2022, and "From Nixon-Mao To Putin-Xi," dated February 25, 2022. 2 Please see Global Investment Strategy, “The New Neutral” dated January 14, 2022. Recommended Asset Allocation Model Portfolio (USD Terms)
Executive Summary The heightened uncertainty of the current situation means it makes sense to keep portfolio duration close to benchmark. The recent market turmoil means that a 50 bps rate hike is off the table for the March FOMC meeting, but the Fed will proceed with a 25 bps rate hike this month and signal a further steady pace of tightening. As of Monday morning, the market is priced for close to 150 bps of tightening during the next 12 months. This is reasonable assuming that inflation moderates in the second half of the year and that long-dated inflation expectations remain well contained. A moderation of inflation in H2 remains our base case, but the war in Ukraine increases the risk that inflation will be sticky and that long-dated inflation expectations will move higher. The Golden Rule Of Bond Investing
The Golden Rule Of Bond Investing
The Golden Rule Of Bond Investing
Bottom Line: An ‘at benchmark’ portfolio duration stance makes sense for now, but the recent drop in Treasury yields could eventually present us with an opportunity to re-initiate a ‘below-benchmark’ portfolio duration position. Stay tuned. Feature The Russian invasion of Ukraine is ongoing and financial markets will surely remain volatile until a resolution is reached. For more details on how we see the crisis evolving please refer to last week’s BCA Special Report.1 As we go to press on Monday, the market is trying to digest the impact of sanctions that will block the access of some Russian banks to the SWIFT financial messaging system and freeze some Russian central bank reserves that are held abroad in USD and EUR. Taken together, the sanctions will impart a large stagflationary impulse to the Russian economy and, as would be expected, the Ruble is depreciating rapidly on Monday morning. The reaction in US bond markets is so far more muted. The 10-year Treasury yield is currently 1.86% - down from 1.99% last Wednesday – and the 2-year Treasury yield is 1.44% - down from 1.58% last Wednesday (Chart 1). Movements in the real and inflation components of US Treasury yields do show that the US market is pricing-in some stagflationary contagion. The real 10-year Treasury yield is down to -0.71% (from -0.54% last Wednesday) and the 10-year TIPS breakeven inflation rate is up to 2.57% (from 2.53% last Wednesday). The same divergence between a falling real yield and rising cost of inflation compensation is seen at the 2-year maturity point (Chart 1, bottom 2 panels). The market has also moved to price-in a shallower path for Fed rate hikes compared to last week (Chart 2). The market-implied odds of a 50 bps rate hike this month are now slim and the market is now looking for only 139 bps of cumulative tightening (just under six 25 basis point rate hikes) by the end of this year. Chart 2Fed Funds Rate Expectations
Fed Funds Rate Expectations
Fed Funds Rate Expectations
Chart 1A Stagflationary Shock
A Stagflationary Shock
A Stagflationary Shock
We agree with the market that the heightened uncertainty and tightening of financial conditions takes a 50 bps rate hike off the board for the March FOMC meeting. A 25 bps rate hike this month remains the most likely scenario. However, we also think the market might be over-estimating the extent to which contagion from Russia will limit the pace of Fed tightening later in the year. In fact, we are inclined toward the view that the lasting impact of the crisis on the US economy might be more inflationary than deflationary. Chart 3Expect US/German Yield Differential To Widen
Expect US/German Yield Differential To Widen
Expect US/German Yield Differential To Widen
The inflationary risk is that a sustained upward shock to the oil price could keep headline inflation higher than it would otherwise be. This could also bleed through into other commodity prices and possibly even to inflation expectations. The textbook central bank response should be to ignore a commodity price shock and set policy based on trends in core inflation. However, in the current environment it will be difficult for the Fed to ignore yet another inflationary shock, especially if long-dated inflation expectations move higher. On the other hand, the economic fallout from a Russian recession will be much worse for Europe than for the United States. European Central Bank (ECB) Chief Economist Philip Lane recently estimated that the Ukrainian war could shave 0.3%-0.4% off Eurozone GDP this year.2 If the shock leads to a wider divergence between Fed and ECB policy expectations, then we would expect to see a widening of US yields versus European yields and upward pressure on the US dollar. Given that US bond yields can only diverge so far from yields in the rest of the world, a stronger dollar may cap any increase in US bond yields and eventually limit the extent of Fed tightening. So far, trends in the dollar and dollar sentiment have been supportive of rising US bond yields, but it will be important to watch this situation in the coming months to see if it changes (Chart 3). Investment Conclusions The heightened uncertainty of the current situation means it makes sense to keep portfolio duration close to benchmark. The Fed is likely to proceed with tightening policy at a steady pace, starting with a 25 bps rate hike this month. Trends in inflation and financial conditions will determine the pace of rate hikes in H2 2022. Right now, our sense is that the lasting impact of the Ukrainian crisis on the US economy will prove to be more inflationary than deflationary. With that in mind, the recent drop in Treasury yields may eventually present us with an opportunity to re-initiate a ‘below-benchmark’ portfolio duration position. Checking In With Our Golden Rule Given the current market turmoil, we think it’s a good time to step back and check in with our Golden Rule of Bond Investing.3 The Golden Rule is a framework that investors can use to implement portfolio duration trades. It states that investors should determine the expected change in the fed funds rate that is priced into markets for the next 12 months and then decide whether the actual change in the funds rate will be greater or less than what is priced in the market. If you expect the fed funds rate to rise by more than what is priced in (a hawkish surprise), you should keep portfolio duration low. If you expect the fed funds rate to rise by less than what is priced in (a dovish surprise), you should keep portfolio duration high. It is admittedly a simple framework, but it does have a strong track record of performance. In general, hawkish surprises coincide with the Bloomberg Barclays Treasury index underperforming cash and dovish surprises coincide with the index outperforming cash (Chart 4). Chart 4The Golden Rule Of Bond Investing
The Golden Rule Of Bond Investing
The Golden Rule Of Bond Investing
More specifically, if we look at rolling 12-month periods going back to 1990, we see that dovish surprises have coincided with positive excess Treasury returns versus cash 85% of the time for an average 12-month excess return of 4.0%. Conversely, hawkish surprises have coincided with negative excess Treasury returns 72% of the time for an average 12-month excess return of -1.5% (Chart 5 & Table 1). Table 112-Month Treasury Excess Returns And Fed Funds Rate Surprises (1990 - Present)
Waiting For The Fog To Clear
Waiting For The Fog To Clear
Chart 5The Golden Rule’s Track Record
Waiting For The Fog To Clear
Waiting For The Fog To Clear
As of today, the market is priced for 149 bps of Fed tightening during the next 12 months. That is very close to six 25 basis point rate hikes at the next eight FOMC meetings. Given our view that inflation will moderate in the second half of the year, this seems like a reasonable forecast that is consistent with our ‘at benchmark’ portfolio duration stance. However, as noted above, we believe the war in Ukraine could lead to an increase in inflationary pressures in the United States. Therefore, we see the balance of risks as tilted toward more rate hikes than are currently discounted rather than fewer. It will be vital to monitor long-dated inflation expectations during the next few months to assess how the pace of Fed rate hikes will evolve. Using The Golden Rule To Forecast Treasury Returns One more application of our Golden Rule framework is that we can use it to create forecasts for Treasury index returns. This is done by first looking at the historical correlation between the Fed Funds Surprise – the difference between the expected 12-month change in the fed funds rate and the realized change – and the change in the Treasury index yield (Chart 6). A regression between these two variables allows us to estimate the change in the Treasury index yield based on an assumed Fed Funds Surprise. Chart 6The Correlation Between Treasury Yields And Fed Funds Surprises
Waiting For The Fog To Clear
Waiting For The Fog To Clear
Once we have an expected 12-month change in the Treasury index yield, we can translate that change into an expected return using the index’s average yield, duration and convexity. The result of this analysis is presented in Table 2. Table 2Using The Golden Rule To Forecast Treasury Returns
Waiting For The Fog To Clear
Waiting For The Fog To Clear
Table 2 shows that we would expect the Treasury index to deliver a total return of 1.82% in a scenario where the Fed lifts rates by 150 bps during the next 12 months. This would equate to the Treasury index beating a position in cash by between 0.07% and 0.83%, depending on whether rate hikes are front-loaded or back-loaded. A pace of one 25 basis point rate hike per meeting (+200 bps during the next 12 months) would lead to the Treasury index underperforming cash by between -2.35% and -3.02%. Conversely, we can see that the index is expected to beat cash by between 3.25% and 3.92% if the Fed only lifts rates four times during the next 12 months. Ryan Swift US Bond Strategist rswift@bcaresearch.com Footnotes 1 Please see BCA Special Report, “Russia Takes Ukraine: What Next?”, dated February 24, 2022. 2 https://www.reuters.com/business/exclusive-ecb-policymakers-told-ukraine-war-may-shave-03-04-off-gdp-2022-02-25/ 3 Please see US Bond Strategy Special Report, “The Golden Rule Of Bond Investing”, dated July 24, 2018. Treasury Index Returns Spread Product Returns Recommended Portfolio Specification
Waiting For The Fog To Clear
Waiting For The Fog To Clear
Other Recommendations
Waiting For The Fog To Clear
Waiting For The Fog To Clear
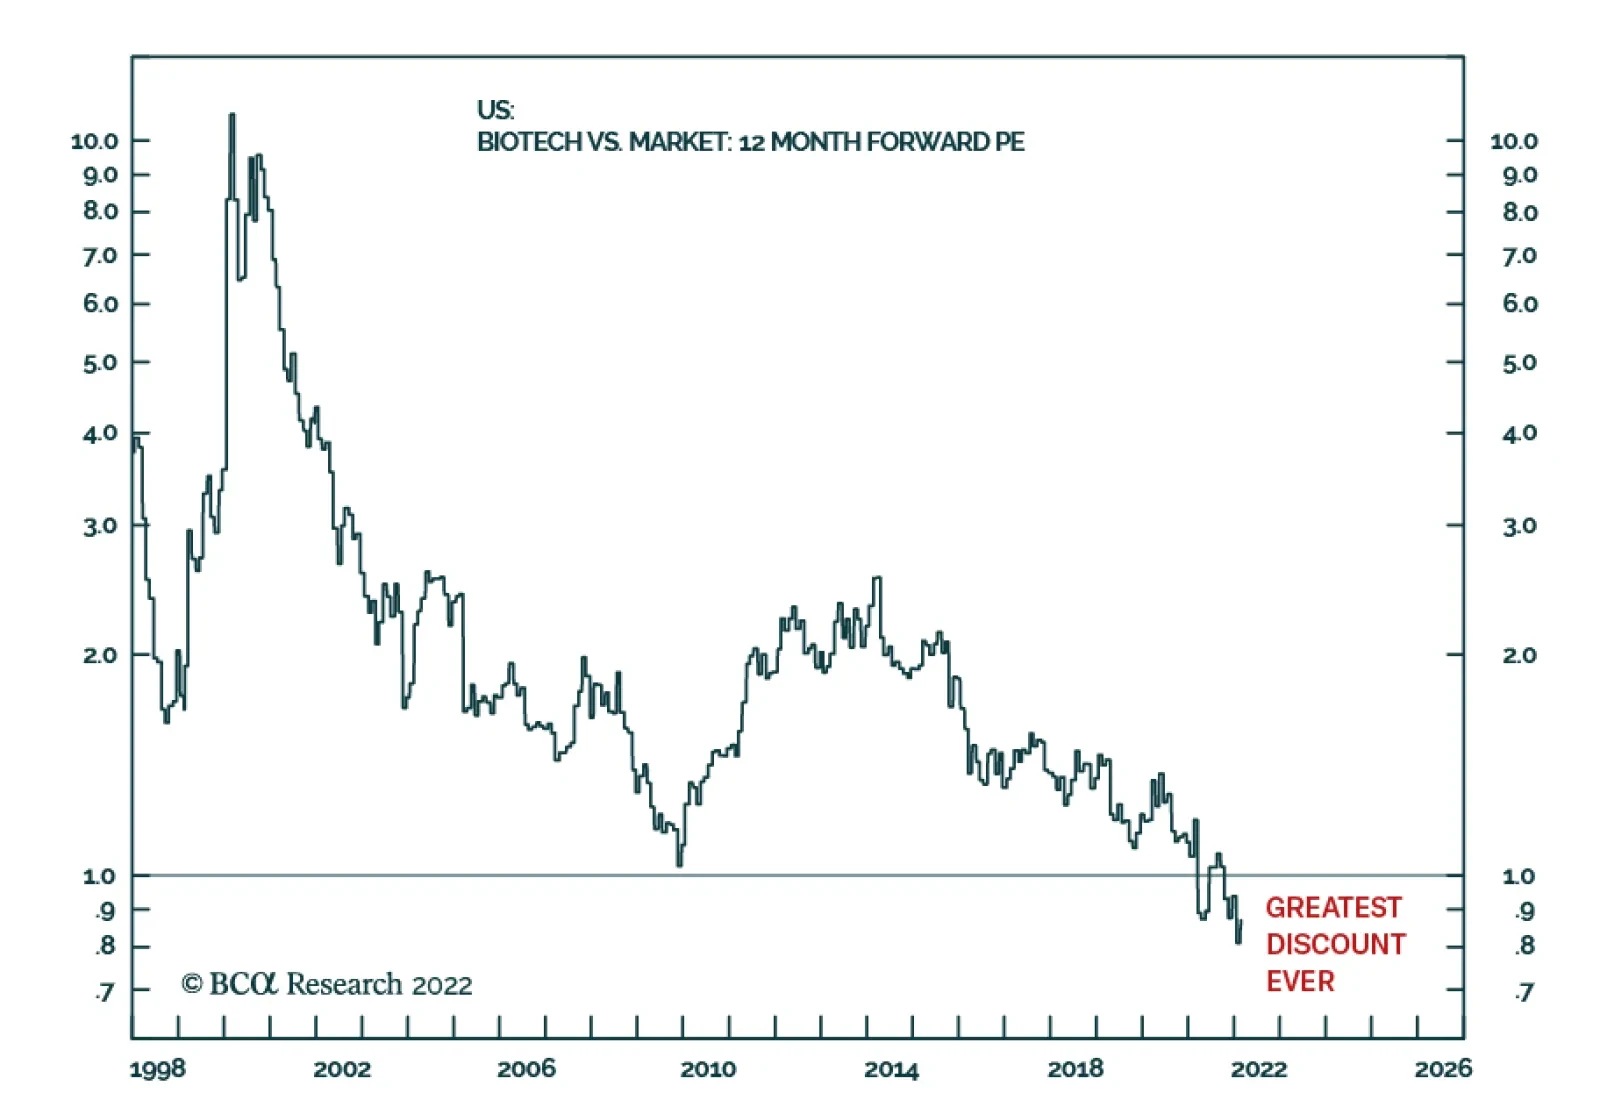
Every now and then comes a rare opportunity to buy a deeply unloved asset at a bargain basement price. The beaten-down biotech sector provides such an opportunity now – as it is trading at its greatest-ever discount to the market. Much of biotech’s…