United States
According to BCA Research’s US Investment Strategy service, Ukraine underscores the potential for volatility to surge from an already elevated base as news items interact with uncertainty about the Fed. The team is still constructive on US financial…
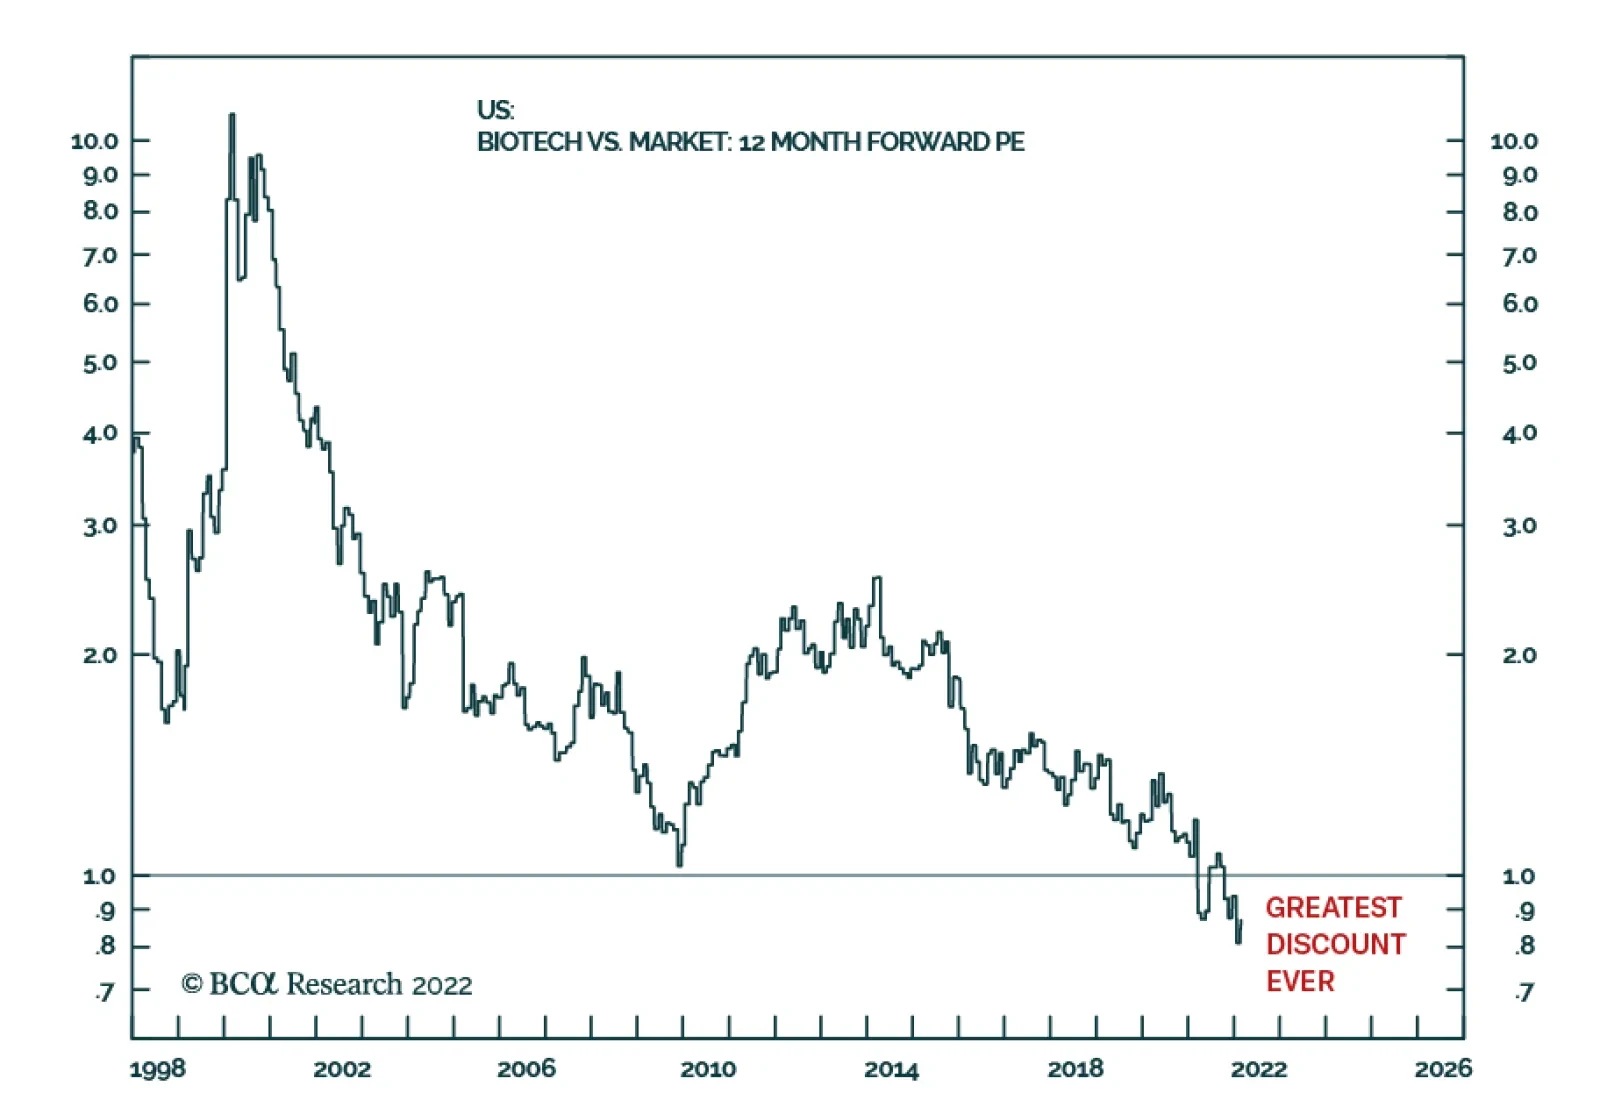
Every now and then comes a rare opportunity to buy a deeply unloved asset at a bargain basement price. The beaten-down biotech sector provides such an opportunity now – as it is trading at its greatest-ever discount to the market. Much of biotech’s…

Executive Summary Through February 24th, our ETF portfolio outperformed its benchmark by 18 basis points. Its risk-friendly orientation helped it generate double that amount of outperformance in its first two weeks but cost it as markets broadly declined over the last two weeks. In line with our fixed income strategists’ recommendation, we are tactically shifting our fixed income positioning to neutral duration from below-benchmark duration. Our longer-run expectation for higher interest rates remains intact. We are not making any portfolio adjustments in response to Russia’s invasion of Ukraine. Although the situation is fluid, we share the BCA house view that the conflict will be narrowly confined to Ukraine and the Black Sea as long as the flow of energy between Russia and the EU continues unabated. Ukraine underscores the potential for volatility to surge from an already elevated base as news items interact with uncertainty about the Fed. We will continue to manage the ETF portfolio with a more tactical bent than we otherwise would. 2022 Rate Hike Expectations Have Gone Too Far
2022 Rate Hike Expectations Have Gone Too Far
2022 Rate Hike Expectations Have Gone Too Far
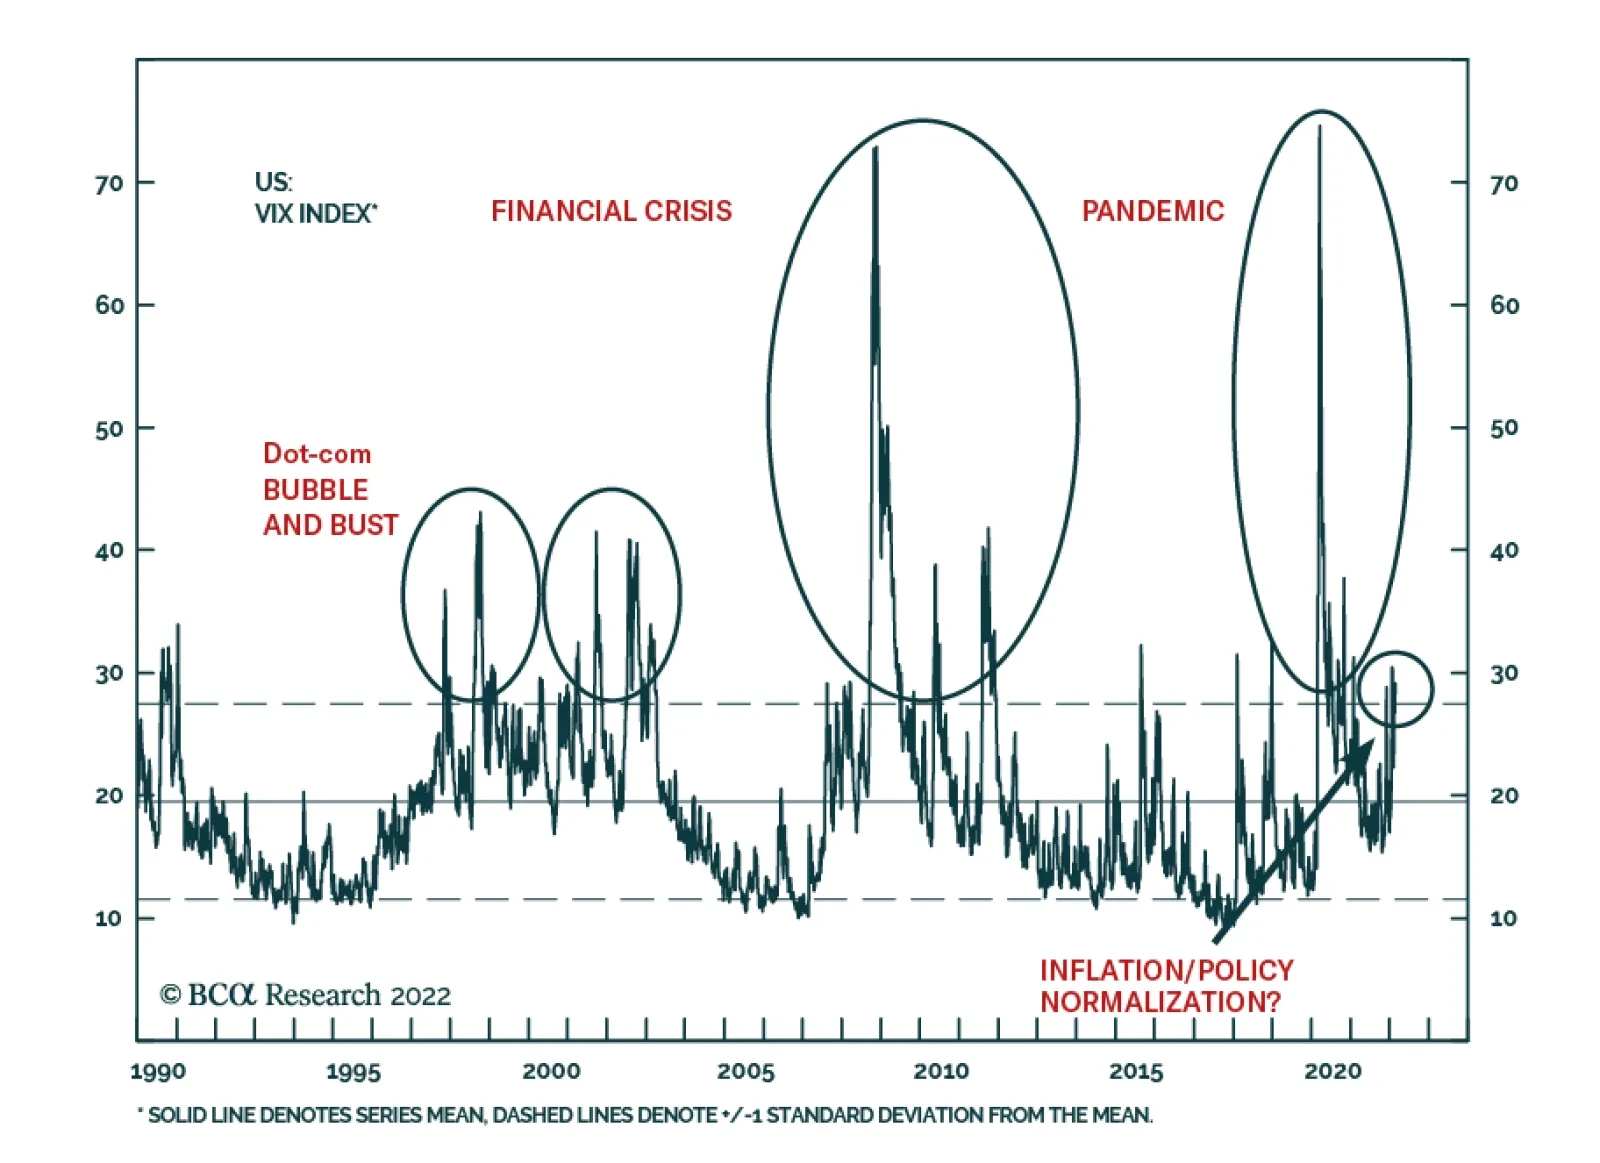
Bottom Line: Russia’s movements of troops and materiel have been weighing on equity markets. Now that it has made its move, the bottom of the range may be near. Feature This is the first of a series of monthly reports devoted to the ETF portfolio we launched at the end of January. Each report will review the previous month’s performance, tracking the portfolio's relative return and highlighting its key contributors. More importantly, it will reassess our forward-looking views and situate them in an asset allocation/portfolio construction context. This monthly report will also be our primary vehicle for making portfolio adjustments, though we will make intra-month changes if market prices or our views change enough to merit them. In the immediate future, the conflict in Ukraine looms large. Russia’s full-scale incursion into Ukraine on February 24th roiled global financial markets, especially in Europe, with US equities executing a stunning reversal, exemplified by the high-beta NASDAQ, which fell 3% in overnight futures trading before recovering all the decline en route to a 3% gain in the live session. The wild action highlighted the potential for volatility to spike while investors are already on edge over unusually high inflation and the Fed’s attempts to contain it. We reiterate that we expect volatility will remain elevated this year and perhaps across the entire rate hiking cycle. Looking Ahead On a call last week, a client asked us if we were more confident or less confident in our views than we were on our quarterly webcast two weeks ago. Though no major new data had arrived in the interim (and Russia had not yet invaded Ukraine), we responded that our conviction level was unchanged to slightly higher, given the comfort we derived from our fixed income colleagues’ well-reasoned argument for why they think rates have peaked in the near term and our own analysis of the University of Michigan consumer sentiment survey respondents’ perceptions of inflation. The Ukraine conflict has the potential to push energy prices higher in the very near term, but it does not alter our six-to-twelve-month view. Chart 1Entering The Fourth Wave Of Persistently High Volatility?
Entering The Fourth Wave Of Persistently High Volatility?
Entering The Fourth Wave Of Persistently High Volatility?
Chart 2A Whole Lot Of Dry Powder ...
A Whole Lot Of Dry Powder ...
A Whole Lot Of Dry Powder ...
We are still constructive on financial markets and the economy, as well, though we expect that geopolitics may well provide a catalyst for rolling surges in the already elevated VIX (Chart 1). The escalation of the Ukraine conflict will temporarily preserve the geopolitical risk premium embedded in crude oil prices, but the evergreen commodity rule that high prices are the best cure for high prices will soon assert itself. Our Commodity & Energy Strategy team projects that oil producers will ramp up supply sufficient to dislodge the risk premium by the end of the year, taking Brent crude down to $85 a barrel, where it expects it will remain throughout 2023. While high oil prices are a tax on economic activity, their adverse effect on the US is mitigated by its status as the world’s largest oil producer. Our positive outlook for the US economy rests on our expectation that flush American households will begin drawing down their mountain of pandemic savings (Chart 2, bottom panel) now that COVID infections are less numerous (Chart 3, top panel) and less serious (Chart 3, bottom panel). As the pandemic wanes, households will regain their full range of consumption options, from dining out and in-person entertainment to travel and lodging. Our base-case outlook has them spending about half of their $2-plus trillion of pandemic savings, but we note that they can draw upon other pools of capital. Household net worth has surged at a record rate over the eight quarters of the pandemic as the value of financial assets and homes surged, and banks are eager to help consumers deploy their idle credit capacity to top up their buying power (Chart 4). Chart 3... Is Ready To Be Deployed Now That Omicron Is Out Of The Way
... Is Ready To Be Deployed Now That Omicron Is Out Of The Way
... Is Ready To Be Deployed Now That Omicron Is Out Of The Way
Chart 4Banks Are Eager To Lend To Consumers
Banks Are Eager To Lend To Consumers
Banks Are Eager To Lend To Consumers
Persistent inflation could erode some of that buying power while weighing on consumer sentiment. The Russia-Ukraine conflict has the potential to push food costs higher along with energy costs, as Ukraine is a top ten producer of both corn and wheat and Russia is a global wheat heavyweight, but emerging markets are likely to bear the brunt of higher agricultural commodity prices as the US and the EU are net exporters of both grains. As detailed below, we expect inflation will soon peak and begin decelerating at a rapid clip, so we do not expect higher prices to weaken the consumption tailwind, no matter what the Ukraine affair may bring. We continue to have very high conviction that the US will grow well above trend in 2022 and expect that S&P 500 earnings per share will grow in the mid-to-high single digits. Yields Have Backed Up Enough (For Now) We expect that volatility will remain elevated throughout this year and perhaps over the course of the Fed’s entire rate-hiking campaign as investors navigate an unfamiliar inflation backdrop and the Fed grapples with the challenges of normalizing monetary policy after a decade and a half of extraordinary accommodation. We have therefore recommended that investors consider adopting a more tactical approach to portfolio management and we are committed to following our own advice in the ETF portfolio. Although our cyclical view of interest rates has not changed – we expect they are ultimately headed higher than bond market participants do – we are persuaded by our fixed income colleagues’ argument that they’ve backed up too much too soon. We are therefore unwinding our below-benchmark duration positioning in the fixed income segment of our portfolio and tactically shifting to benchmark duration. Our colleagues cite several reasons for their call, but they all coalesce around the way that relentless upside inflation surprises have prompted aggressive rate hike expectations. They argue that market participants have overestimated how much the FOMC will hike the fed funds rate this year, as the overnight index swap curve is now pricing in about 150 basis points (bps) of hikes (Chart 5). That is well above the FOMC’s median 75-bps projection in December, and even though the official projection will rise at the March meeting, there is almost no chance that the committee’s guidance will be more hawkish than what the market is already discounting. Since the FOMC cannot surprise to the upside, rate hike expectations cannot push yields any higher for now. Chart 5Interest Rate Markets Have Gotten Ahead Of Themselves
Interest Rate Markets Have Gotten Ahead Of Themselves
Interest Rate Markets Have Gotten Ahead Of Themselves
The uninterrupted run of upside US inflation surprises drove the bond market to ramp up its rate hike expectations, but we expect that US inflation will peak this spring and decelerate rapidly to less uncomfortable levels, even though they will remain well above the Fed’s 2% target. The Manufacturing ISM Prices Paid Index, which leads headline inflation by six months (Chart 6, middle panel), reflects the deceleration in commodity and other input prices that is already underway (Chart 6, top panel). The ISM Supplier Deliveries Indexes suggest that global supply chain pressures have already started to ease (Chart 6, bottom panel). Ukraine disruptions aside, our commodity and energy strategists see oil price momentum losing steam, with Brent crude falling to $85 per barrel in the second half of the year and holding at that level across 2023 (Chart 7). Chart 6Good Tidings From The ISM Survey ...
Good Tidings From The ISM Survey ...
Good Tidings From The ISM Survey ...
Chart 7... And Relief On The Oil Front
... And Relief On The Oil Front
... And Relief On The Oil Front
As COVID recedes and people can resume typical day-to-day activities, consumer spending will continue to shift from goods to services (Chart 8). High-demand goods in categories subject to supply constraints have undergone a natural experiment in surge pricing. With supply at a deficit relative to demand, prices have risen to ration items like new automobiles to purchasers with the greatest time preference. Easing supply chain bottlenecks will help on the supply side of the equation and the new availability of services alternatives – attending live events instead of upgrading home theater and audio systems, going to the gym instead of buying home exercise equipment, taking a summer vacation instead of building a new backyard deck – will help relieve some of the upward pressure on demand. Chart 8When Demand Shifts To Services ...
When Demand Shifts To Services ...
When Demand Shifts To Services ...
Chart 9... Inflation Will Ease
... Inflation Will Ease
... Inflation Will Ease
A shift in spending patterns favoring services will allow headline inflation to move away from extreme double-digit goods inflation to merely elevated services inflation (Chart 9). Chart 10No One Left To Sell
No One Left To Sell
No One Left To Sell
Our colleagues also expect that upward pressure on wages, which has been concentrated in service-sector positions at the low end of the scale, will ease as Omicron fades and workers are able to return to the labor force without fearing for their health. The tightening of financial conditions that has occurred as rates have backed up and equity prices have fallen will cool growth momentum and reduce the potential for overheating. With inflation soon peaking and longer-run inflation expectations having remained well anchored, the Fed will feel less pressure to hike rates according to markets’ accelerated timetable. Finally, Treasury market positioning is now so unbalanced to the short side that investors would appear to be nearly out of selling capacity to push yields higher (Chart 10). Bottom Line: We expect that Treasury yields will ultimately rise much higher than the bond market currently anticipates, but the forces that have pushed them sharply higher since early December are spent. The near-term path of least resistance for bond yields is to the downside and we are shifting to a tactically neutral duration position to prepare for it. Portfolio Changes We are leaving our current equity positioning intact, as it remains appropriate to overweight the energy, industrials and financials sectors while avoiding consumer staples and utilities and maintaining direct out-of-benchmark exposure to the S&P 500 Pure Value Index via RPV and to the S&P SmallCap 600 Index via IJR (please refer to Cyclical ETF Portfolio table on page 11). We are reducing our exposure to the 1- to 3-year segment of the Treasury curve by 200 bps (SHY) and to the 3- to 7-year segment by 60 bps (IEI) and increasing our exposure to the 7- to 10-year segment by 260 bps (IEF) to bring portfolio Treasury duration into balance with the benchmark. We are exiting LQDH, the rate-hedged investment-grade corporate bond ETF, and reallocating the proceeds to its unhedged LQD version to bring corporate bond duration into balance. Portfolio Performance Market volatility and equity declines over the past ten trading days have cut its alpha in half, but the risk-friendly cyclical ETF portfolio we introduced last month has nevertheless outperformed its benchmark by 18 basis points (“bps”) through last Thursday’s close. Our equity positioning accounted for most of the value-add (Chart 11). Rising yields were a significant tailwind given our short duration stance. They also supported our value and small-cap tilts and, to a lesser extent, our overweight position in financials. The surge in energy prices generously rewarded our energy equities overweight (XLE). Chart 11Direct Equity Sector Deviations
March 2022 Cyclical ETF Portfolio Review
March 2022 Cyclical ETF Portfolio Review
Widening spreads since the beginning of the year were a headwind to our positioning within the fixed-income space (Chart 12). Our overweight to variable-rate preferred stocks (VRP) as an alternative to dearly priced bonds was the main detractor. Chart 12Fixed Income Deviations
March 2022 Cyclical ETF Portfolio Review
March 2022 Cyclical ETF Portfolio Review
Doug Peta, CFA Chief US Investment Strategist dougp@bcaresearch.com Jennifer Lacombe Associate Editor jenniferl@bcaresearch.com Cyclical ETF Portfolio
March 2022 Cyclical ETF Portfolio Review
March 2022 Cyclical ETF Portfolio Review
The US Personal Income and Outlays report confirms the signal from the retail sales report that consumption was strong in January. Personal spending rebounded by 2.1% m/m in nominal terms and 1.5% m/m in real terms, with both measures beating consensus…
US factory orders surprised to the upside in January. New orders for durable goods increased by 1.6% m/m in January, beating expectations of a 1% m/m rise. New orders for core capital goods (non-defense capital goods, excluding aircraft) were up 0.9% m/m,…
Dear client, In addition to this weekly report, we sent you a Special Report from our Geopolitical Strategy service, highlighting the risk from the Russo-Ukrainian conflict. Kind regards, Chester Executive Summary The Ukraine crisis will lead to a period of strength for the DXY. Countries requiring foreign capital will be most at risk from an escalation in tensions. Portfolio flows have reaccelerated into the US, on the back of a rise in Treasury yields. This will be sustained in the near term. The euro area on the other hand has already witnessed significant portfolio outflows, on the back of Russo-Ukrainian tensions and an energy crisis. Countries with balance of payment surpluses like Switzerland and Australia are good havens amidst the carnage. Oil-producing countries such as Norway and Canada have also seen an improvement in their balance of payments, on the back of a strong terms-of-trade tailwind. This will be sustained in the near term. Balance Of Payments Across The G10
The Ukraine Crisis And Balance Of Payments
The Ukraine Crisis And Balance Of Payments
Bottom Line: The dollar is king in a risk-off environment. That said, the US and the UK sport the worst balance of payments backdrops, while Norway, Switzerland, and Sweden have the best. This underpins our long-term preference for Scandinavian currencies in an FX portfolio. In the near term, we think the DXY will peak near 98-100, but volatility will swamp fundamental biases. Feature Chart 1The US Runs A Sizeable Deficit
The Ukraine Crisis And Balance Of Payments
The Ukraine Crisis And Balance Of Payments
The Russia-Ukraine conflict continues to dictate near-term FX movements. With Russia’s invasion of Ukraine, the risk of escalation and/or a miscalculation has risen. FX volatility is increasing sharply, and with it, the risk of a further selloff in currencies dependent on foreign capital inflows. As a reserve currency, the dollar has also been strong. It is difficult to ascertain how this imbroglio will end. However, in this week’s report, we look at which currencies are most vulnerable (and likely to stay vulnerable) from a balance of payments standpoint. Chart 1 plots the basic balance – the sum of the current account balance and foreign investment – across G10 countries. It shows that at first blush, Norway, Switzerland, Sweden, and Australia are the most resilient from a funding standpoint, while New Zealand, the UK, and the US are the most vulnerable. In Chart 2, we rank G10 currencies on eight different criteria: The basic balance, which we highlighted above. Real interest rate differentials, using the 10-year tenor and headline inflation. Relative growth fundamentals, as measured by the Markit manufacturing PMI. Three fair value models which we use in-house. The first is our Purchasing Power Parity model, which adjusts consumption basket weights across the G10 to reflect a more apples-to-apples comparison. The second is our long-term fair value model (LTFV), which adjusts for productivity differentials between countries; and the final is our intermediate-term timing model (ITTM), which separates procyclical from safe-haven currencies by including a risk factor such as corporate spreads. All three models are equally weighted in our rankings. The net international investment position (NIIP), which highlights currencies that are most likely to witness either repatriation flows or a positive income balance in the current account. Finally, net speculative positioning, which tells us which currencies have crowded long positions, and which ones sport a consensus sell. Chart 2The Scandinavian Currencies Are Attractive
The Ukraine Crisis And Balance Of Payments
The Ukraine Crisis And Balance Of Payments
The conclusions from this chart are similar to our basic balance scenario – NOK, SEK, AUD, CHF, and JPY stand out as winners while GBP, NZD, and USD are the least attractive. The US dollar is a special case given its reserve currency status, with a persistent balance of payments deficit. The rise in the greenback amidst market volatility is a case in point. However, portfolio flows into the dollar also tend to be cyclical, so a resolution in the Ukraine/Russia conflict will put a cap on inflows. Equity portfolio flows had dominated financing of the US current account deficit but are relapsing (Chart 3). Bond portfolio flows have rebounded on the back of rising US yields, but US TIPS yields remain very low by historical standards (Chart 4). If they do not improve much further, specifically relative to other developed markets, it will be tough to justify further inflows into US Treasurys. Chart 3Equity Portfolio Flows Into The US Are Relapsing
Equity Portfolio Flows Into The US Are Relapsing
Equity Portfolio Flows Into The US Are Relapsing
Chart 4Bond Portfolio Flows Into The US Are Strong
Bond Portfolio Flows Into The US Are Strong
Bond Portfolio Flows Into The US Are Strong
In this week’s report, we look at the key drivers of balance of payments dynamics across the G10, starting with the US, especially amidst a scenario where the forfeit of foreign capital could come to the fore. United States Chart 5US Balance Of Payments
US Balance Of Payments
US Balance Of Payments
The US trade deficit continues to hit record lows at -$80.7 billion for the month of December. Over the last few years, it has become increasingly difficult to fund this widening trade deficit via foreign purchases of US Treasurys. A positive net income balance has allowed a slower deterioration in the US current account balance, though at -$214.8 billion for Q3, it remains close to record lows. The overall picture for both the trade and current account balance is more benign as a share of GDP, given robust GDP growth (Chart 5). That said, as a share of GDP, the trade balance stands at -3.5%, the worst in over a decade. Foreign direct investment into the US has been improving of late. This probably reflects an onshoring of manufacturing, triggered by the Covid-19 crisis. That said, despite this improvement, the US still sports a negative net FDI backdrop. In a nutshell, the basic balance in the US (the sum of the current account and foreign direct investment) is still deteriorating. The dollar tends to decline on a multi-year basis when the basic balance peaks and starts worsening. Euro Area Chart 6Euro Area Balance Of Payments
Euro Area Balance Of Payments
Euro Area Balance Of Payments
The trade balance in the euro area has significantly deteriorated in recent quarters, on the back of an escalating energy crisis. Russia’s invasion of Ukraine marks the cherry on top. On a rolling 12-month basis, the trade surplus has fallen to 1% of GDP (Chart 6). This is particularly telling since for the month of December, the trade balance came in at €-4.6 billion, the worst since the euro area debt crisis. The current account continues to post a surplus of 2.6% of GDP, on the back of a positive income balance. However, FDI inflows are relapsing. After about two decades of underinvestment in the euro area, FDI inflows were at their highest level, to the tune of about 2% of GDP in 2021. Those have now completely reversed on the back of uncertainty. The combination of an energy crisis and dwindling FDI is crushing the euro area’s basic balance surplus. A rising basic balance surplus has been one of the key pillars underpinning a bullish euro thesis. Should the deterioration continue, it will undermine our longer-term bullish stance on the euro. It is encouraging that portfolio investments have turned less negative in recent quarters, as bond yields in the euro area are rising. Should this continue, it will be a good offset to the deterioration in FDI. Japan Chart 7Japan Balance Of Payments
Japan Balance Of Payments
Japan Balance Of Payments
Like the euro area, the trade balance in Japan continues to be severely hampered by rising energy imports. The trade deficit in January deteriorated to a near record of ¥2.2 trillion, even though export growth remained very robust. Income receipts from Japan’s large investment positions abroad continue to buffer the current account, but a resolution to the energy crisis will be necessary to stem Japan’s basic balance from deteriorating (Chart 7). The process of offshoring has sharply reversed since the Covid-19 crisis. While FDI is still deteriorating, it now stands at -2.4% of GDP, compared to -4.3% just before the pandemic. Net portfolio investments are also accelerating, especially given the rise in long-term interest rates in Japan, positive real rates, and the value bias of Japanese equities. We are buyers of the yen over the long term, but a further rise in global yields and energy prices are key risks to our view. United Kingdom Chart 8UK Balance Of Payments
UK Balance Of Payments
UK Balance Of Payments
The UK has the worst trade balance in the G10, and the picture has not improved much since the pandemic (currently at -6.7% of GDP). Similar to both the euro area and Japan, much of the drag on the trade balance has been due to rising import costs from energy and fuels. This puts the UK at risk of an escalation in the conflict between Ukraine and Russia. Meanwhile, the improvement in the income balance over the last few years has started to deteriorate, as transfer payments under the Brexit withdrawal agreement kick in. As a result, the current account balance is deteriorating anew (Chart 8). Both portfolio and direct investment in the UK were robust in the post-Brexit environment but have started to deteriorate. This is critical since significant foreign investment is necessary to boost productivity in the UK and prevent the pound from adjusting much lower. With bond yields in the UK rising, and the FTSE heavy in cyclical stocks, this should limit further deterioration in the UK’s financial account. A significant drop in the estimated path of settlement payments for Brexit will also boost the income balance. The key for the pound over the coming years remains how fast the UK can improve productivity, which will convince foreign investors that the return on capital for UK assets will increase. Canada Chart 9Canada Balance Of Payments
Canada Balance Of Payments
Canada Balance Of Payments
Canada’s domestic economy has been relatively insulated from the geopolitical shock in Europe, but its export sector is benefiting tremendously from it. Rising oil prices are boosting Canadian terms of trade. As a result, the current account has turned into a surplus for the first time since 2009, in part driven by an improving trade balance (Chart 9). Outside of trade, part of the improvement in the Canadian current account balance is specifically driven by income receipts from Canada’s positive net international investment position. At C$1.5 trillion, income receipts are becoming an important component of the current account balance. Foreign direct investment into Canada continues to remain robust, given strong commodity prices. This is boosting our basic balance measure, which today sits at a surplus of 2.4% of GDP and should continue to improve. Finally, because of Canada’s improving balance-of-payments backdrop, it is no longer reliant on foreign capital as it had been in the past, which supports the loonie. Australia Chart 10Australia Balance Of Payments
Australia Balance Of Payments
Australia Balance Of Payments
Australia continues to sport the best improvement in both its trade and current account balances over the last few years. As a result, the basic balance has eclipsed 4% of GDP for the first time since we have been measuring this series (Chart 10). The story for Australia remains improving terms of trade, specifically in the most desirable commodities – copper, high-grade iron ore, liquefied natural gas, and to a certain extent, high-grade coal. Foreign direct investment in Australia has eased significantly. Investment in projects in the resource space are now bearing fruit, easing the external funding constraint. Meanwhile, domestic savings can now be easily recycled for sustaining capital investment. In fact, foreign direct investment turned negative in Q4 2021. This also explains the drop in net portfolio investment since Australians now need to build a positive net international investment position. We have a limit buy on the Aussie dollar at 70 cents, as we are bullish the currency over a medium-term horizon. New Zealand Chart 11New Zealand Balance Of Payments
New Zealand Balance Of Payments
New Zealand Balance Of Payments
For the third quarter of 2021, New Zealand’s current account balance hit record lows, despite robust commodity (agricultural) prices. Imports of fertilizers, crude oil, and vaccines have led to a widening trade deficit. A drop in the exports of wood also affected the balance. With a negative net international investment position of about 48% of GDP, the income balance also subtracted from the current account total (Chart 11). From a bigger-picture perspective, New Zealand’s basic balance has been negative for many years, as coupon and dividend payments to foreign investors, as well as valuation adjustments from net foreign liabilities, have kept the current account in structural deficit. However, as the prices of key agricultural goods head higher, New Zealand can begin to benefit from a terms-of-trade boom that will limit its external funding requirement. In that respect, portfolio investments are also improving. New Zealand has the highest bond yield in the G10, on the back of the highest policy rate so far (the RBNZ raised interest rates again this week). New Zealand’s defensive equity market has also corrected sharply amidst the general market riot. As such, foreign investors could begin to favor this market again based on high yields and a reset in valuations. Going forward, New Zealand should continue to see further improvement in its basic balance relative to the US, supporting the kiwi. Switzerland Chart 12Switzerland Balance Of Payments
Switzerland Balance Of Payments
Switzerland Balance Of Payments
The Swiss trade balance remains in a structural surplus, with a post Covid-19 boom that has led a new high as a share of GDP (Chart 12). Global trade has been rather resilient due to high demand for goods. While Switzerland has a large net international investment position, income flows this quarter were hampered by servicing costs for foreign direct investments. The net international investment position did improve by CHF27 billion on a quarter-over-quarter basis in Q3, on the back of a net increase in foreign asset purchases. Currency movements also had little impact on the portfolio in Q3, which is atypical. The SNB will always have to contend with a structural trade surplus that puts upward pressure on the currency. This will keep the Swiss franc well bid, especially in times of crisis when the positive balance-of-payments backdrop makes the CHF a safe haven. Norway Chart 13Norway Balance Of Payments
Norway Balance Of Payments
Norway Balance Of Payments
Q3 2021 saw a strong recovery in Norway’s trade account that is likely to carry over to this year. A recovery in crude oil and natural gas prices was a welcome boon. The lack of tourism also boosted the services account (Norwegians travel and spend less abroad than foreigners visiting Norway). The ongoing electricity crisis in Europe was also an opportune export channel for Norway, which for the first time, opened its 450-mile-long, 1400-megawatt North Sea cable link to the UK. Positive income flows also benefit the current account and the krone (Chart 13). With one of the largest NIIPs in the world heavily skewed towards equity dividends, the NOK benefits when yields rise, even though the domestic fixed-income market is highly illiquid. While a resolution of the Russian-Ukrainian crisis could sap the geopolitical risk premium from oil, the reopening of the global economy will benefit Norwegian exports of oil and gas. Tepid investment in global oil and gas exploration will also ensure Norway’s terms of trade remain robust. Sweden Chart 14Sweden Balance Of Payments
Sweden Balance Of Payments
Sweden Balance Of Payments
The Swedish current account balance has deteriorated slightly in the last few quarters, on the back of supply-side bottlenecks. Particularly, exports of cars have been hampered amidst a semiconductor shortage. That said, the primary income surplus remains a key pillar of the current account, keeping the basic balance at a healthy surplus of about 6% of GDP (Chart 14). Portfolio inflows into Sweden have dwindled, like most other European economies. If this has been due to geopolitical tensions in Europe, it will eventually prove to be fleeting. That said, the Riksbank remains one of the most dovish in the G10 and the OMX is also one of the most cyclical stock markets, which may have spooked short-term foreign investments. The Swedish krona has been the weakest G10 currency year-to-date. Given that we expect most of the headwinds to be temporary, and the basic balance backdrop remains solid, we will go long SEK versus both the euro and the US dollar. Chester Ntonifor Foreign Exchange Strategist chestern@bcaresearch.com Trades & Forecasts Strategic View Cyclical Holdings (6-18 months) Tactical Holdings (0-6 months) Limit Orders Forecast Summary

Executive Summary Risk Premium Abates, But Does Not Disappear
Oil Risk Premium Abates, But Still Remains
Oil Risk Premium Abates, But Still Remains
The risk premium in crude oil and natural gas prices is abating, and we expect that to continue. In the immediate aftermath of Russia's invasion, Brent crude oil traded close to $105/bbl on Thursday. At the urging of China's Xi Jinping, Russian President Vladimir Putin suggested he is prepared to enter negotiations with Ukraine in Minsk to discuss the latter's neutrality. Whether Ukraine is amenable to negotiations framed in this manner remains to be seen. Nothing has changed in supply-demand balances for oil or natgas. Markets are tight, and more supply is needed. In this highly fluid situation, we project Brent crude oil will average $100.00/bbl in 1Q22; $90.30/bbl in 2Q22; $85.00/bbl in 3Q22; and $85.00/bbl in 4Q22 (see Chart). Our estimate for 2023 Brent averages $85.00/bbl. Upside risk dominates in the near term. We expect the Kingdom of Saudi Arabia (KSA), the United Arab Emirates (UAE), and Kuwait, the only members of OPEC 2.0 with the capacity to increase and sustain higher production, to lift output by 1.75mm b/d. The Iran nuclear deal likely gets a boost from the Russian invasion, which will hasten the return of ~ 1.0mm b/d of production in 2H22, perhaps sooner. We also expect the US, and possibly the OECD, to release strategic petroleum reserves, but, as typically is the case, this will have a fleeting impact on markets and pricing. These supply increases will return prices closer to our base case forecast, which we raise slightly to $85/bbl from 2H22 to end-2023. If we fail to see an increase in core-OPEC production, or the US shales, or if Iranian barrels are not returned to export markets, oil prices have a good chance of moving to $140/bbl, as can be seen in the accompanying Chart. Bottom Line: We remain long commodity-index exposure (S&P GSCI and the COMT ETF), along with equity exposure to oil and gas producers via the XOP ETF.
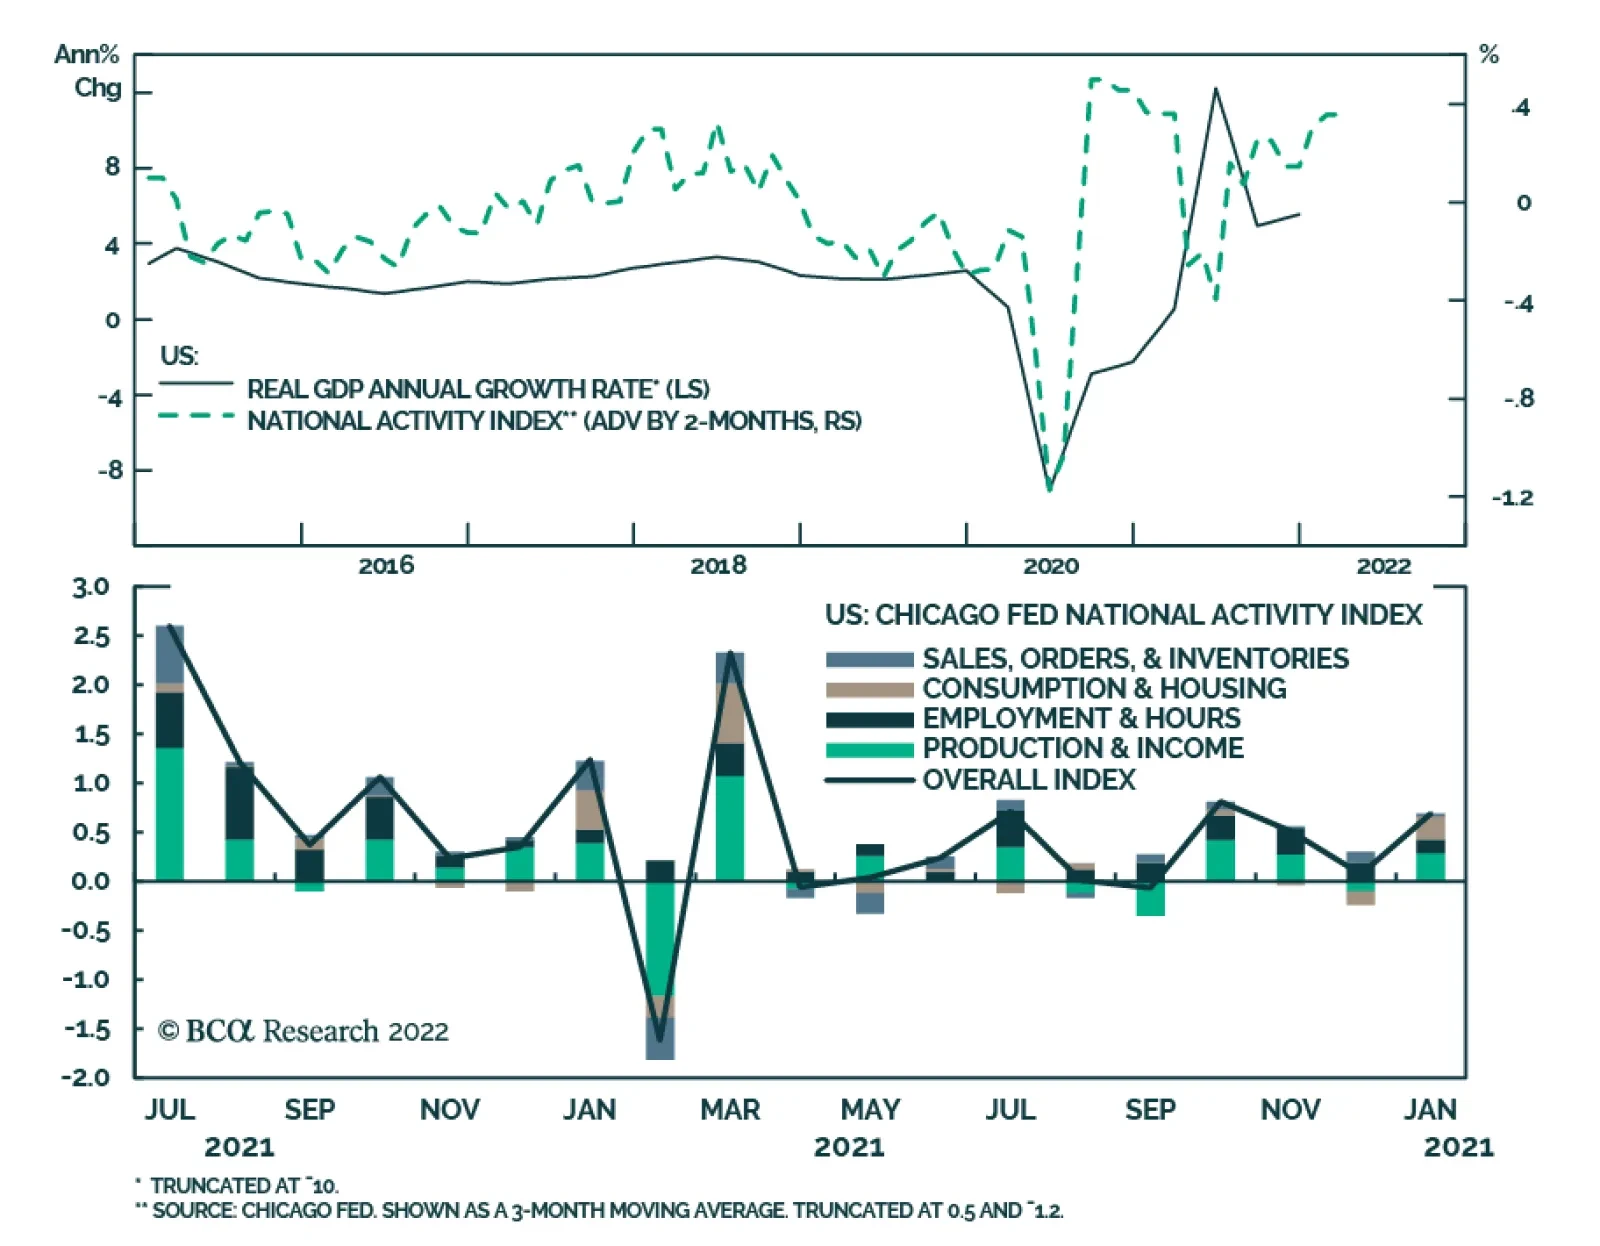
The Chicago Fed National Activity Index (CFNAI) surprised to the upside in January, increasing to 0.69 versus expectations of 0.16. Moreover, the December figure was revised up from -0.15 to 0.07. The positive readings suggest that the US economy grew at an…
Despite the Ukraine conflict (see Market Focus), we expect the Fed to proceed with a 25 basis point rate hike at its meeting in March. However, risks and uncertainty surrounding the crisis reduce the likelihood of a steeper 50 basis point rate hike. This is…
According to BCA Research’s US Political Strategy service, there are three reasons why the US political structure will remain stable enough to sustain economic productivity over the coming years, despite the enormous upheaval on the cyclical level of…