United States
According to BCA Research’s US Political Strategy service, there are three reasons why the US political structure will remain stable enough to sustain economic productivity over the coming years, despite the enormous upheaval on the cyclical level of…

Executive Summary US Policy Uncertainty Rises With ERP
US Policy Uncertainty Rises With ERP
US Policy Uncertainty Rises With ERP
The US is witnessing a rolling political crisis that will escalate again in the 2022-24 election cycle and presents a tail-risk of constitutional fracture. However, fundamental economic, constitutional, and geopolitical factors are structurally positive. US domestic political risk is not greater than foreign geopolitical risk affecting other major markets like Europe. The US faces challenges to maintain its competitive and technological edge. But the combination of a vibrant private sector and increasingly proactive fiscal policy give reason for optimism. The 2022-24 macroeconomic and political cycles will likely cause an increase in policy uncertainty and hence the equity risk premium – but foreign markets face even greater risks. Recommendation (Tactical) Inception Level Initiation Date Stop Loss Long DXY Feb 23/2022 Bottom Line: Go tactically long US dollar (DXY) on the anticipation that US and especially global policy uncertainty and political risk premiums will rise. Feature With President Joe Biden’s approval rating falling to a new net low of -13%, investors are starting to ask about the future of American politics once again. It is highly likely that Democrats will lose control of Congress this fall, setting up a tumultuous 2024 election cycle. With political polarization at historic highs, it is worth asking whether US policy uncertainty will inject a risk premium into US equities. Our answer is yes, uncertainty and the risk premium will rise. But the US also contains fundamental strengths, especially relative to other major markets. With geopolitical risk rising for Europe as Russia engages in new military adventures, the US market will remain attractive over the long run. Natural Advantages Any fundamental assessment of US capability should begin with its people. The US working-age population continues to grow, while that of Europe and China has started to plateau or decline (Chart 1). China’s working population is four times bigger than that of the US, so if China can manage its transition to a higher-wage economy (i.e. if it can maintain productivity growth) then it can compete for global investment capital. But the US’s continued labor force growth, despite social change and political instability, suggests that the US will not follow Japan and Europe into sluggish trend growth, unless sharp curbs on immigration are put into place. The maxim that “the people are the riches of a nation” is only true if economic opportunity and job creation are sufficient. People need access to capital to become more productive. Europe has the largest capital stock in the world, at $100,000 per capita, compared to the US’s $71,000 and China’s $33,000. But Europe’s capital stock has been flat-to-down since the Great Recession. China’s capital stock is rising rapidly and has a lot further to go given its low level. But the country also faces a difficult transition to a new economic model and a debt-deleveraging process that may slow down the pace of capital deepening in the coming years, forcing the government to step in and promote capital projects (Chart 2). Meanwhile the US’s capital stock continues to grow steadily. Chart 1The People Are The Riches Of A Nation...
The People Are The Riches Of A Nation...
The People Are The Riches Of A Nation...
Chart 2...As Long As The People Are Not Starved Of Capital
...As Long As The People Are Not Starved Of Capital
...As Long As The People Are Not Starved Of Capital
Since the shale boom the US has become nearly energy self-sufficient and now produces 20% of global oil and fuel. This development is a blessing from an economic and national security perspective. But it also poses the risk of a kind of resource curse, in which the US could lack the motivation to pioneer renewable energy technology. Currently the US only produces 4% of the world’s renewable energy, a share that has been declining. Europe and China are both energy import-dependent, which is a national security vulnerability, and they will continue to invest in renewable solutions to improve their energy security (Chart 3). Russian aggression will motivate Europe to go down this path, whereas China will go down this path for fear of American strategic containment. For now, however, the US is energy self-sufficient while technologically capable of advancing in renewable energy. The US has a range of structural problems: rising income inequality, extreme political polarization, and a policy turn away from globalization over the past 20 years. However, these problems have not weighed on GDP per capita growth. Of course, the greatest strides in GDP per capita are occurring in the developing world: China and India show the most promise. But the US’s GDP per capita is still growing at an annual average rate of 3%, putting it alongside Germany and ahead of the much less developed Brazil (Chart 4). Germany did not see anywhere near as big of increases in inequality and polarization and is still generally committed to globalization, yet its GDP per capita growth is about the same as the US’s, despite faster US population growth. Chart 3North America's Natural Resource Blessing
North America's Natural Resource Blessing
North America's Natural Resource Blessing
Chart 4Does Political Instability Harm Productivity?
Does Political Instability Harm Productivity?
Does Political Instability Harm Productivity?
Partisanship Means Big Government None of the above benefits have been reversed by the US’s historic increase in political polarization and partisanship over the past three decades. Make no mistake, the latter trends are harmful and could weigh on US stability and productivity in coming years, primarily through deteriorating fiscal management. But so far their bad effects have been contained. The two US political parties have won control of the White House, the Senate, and the House of Representatives a roughly equal number of times. While Republicans have a larger regional presence, across the 50 states, and tend to perform better in the Electoral College and the Senate, this advantage is very slight judging by the number of electoral victories. Meanwhile Democrats have a larger popular presence and perform better in the House of Representatives but this advantage is also slight (Chart 5). The two parties are evenly balanced, which is one explanation for why they compete so viciously for marginal victories. But it also prevents either party from achieving absolute power and distorting or corrupting American bureaucracy and corporate structures to perpetuate single-party rule. Chart 5An Even Balance Of Power Between The Parties
The US's Rolling Political Crisis
The US's Rolling Political Crisis
The size of the federal government fluctuates within a fairly low and narrow range. Federal government receipts hovered around 16% of GDP in the 1950s-60s, peaked at 20.4% in 2000, and today stand right in the middle of this post-war range at 18.5%. Major increases in revenue follow the business cycle and it is rare that Democrats manage to raise taxes enough to have a substantial impact. This point is clear from looking at periods when Democrats controlled both the House of Representatives and the White House (shaded areas in Chart 6): the large increases in tax take mostly coincide with economic growth spurts. It is conceivable that the Biden administration will raise a minimum corporate tax this year via the budget reconciliation process, but the odds of that have been falling and it will not change the pattern in this chart, which shows rising revenue relative to GDP as the economy recovers but is not likely to match what was seen in the late 1990s. From the perspective of federal government spending, the growth in the size of government is clearer, rising from the post-war 15% of GDP to today’s 25% of GDP, with a pronounced structural uptrend. Republicans rarely control both the White House and the House of Representatives and only in the 1950s did they reduce spending outright. The past two Republican administrations presided over large increases in spending, while also capping revenue via tax cuts (Chart 7). Chart 6US Federal Revenue Does Not Change Much Over Time
US Federal Revenue Does Not Change Much Over Time
US Federal Revenue Does Not Change Much Over Time
Chart 7US Federal Spending Does Not Change Much Over Time
US Federal Spending Does Not Change Much Over Time
US Federal Spending Does Not Change Much Over Time
Thus in America’s highly polarized and populist political scene, Republicans fail to cut spending while Democrats fail to increase taxes. The takeaway is that budget deficits will remain structurally large. The political outlook reinforces this point as it promises a return to congressional gridlock. Historically speaking, Biden’s net negative approval rating implies that Democrats will lose 40 seats in the House of Representatives and 4 seats in the Senate this fall. It is unlikely that Democratic fortunes will improve much between now and this November given that midterm elections almost always punish the ruling party and midterm voters tend to make up their minds early in the year. Moreover the ruling party’s ailments are not easily reversed: headline inflation is running at 7.5%, crime and immigration are growing at historic rates, while foreign policy challenges will likely feed the narrative that the Biden administration is weak on the global stage. The likelihood of congressional gridlock from 2022-24 (and maybe beyond) entails that future increases in fiscal spending will be automatic, through lack of entitlement reform, rather than through grandiose new spending programs, which will not pass into law. As such, “Big Government” is back but it is still “limited government” in the US tradition – i.e. limited big government. Neither party has a blank check or dominates for long. And if anything a period of fiscal normalization (or pseudo-normalization) is on the horizon. Constitutional And Geopolitical Advantages The balance of the parties is not accidental but essential to the American constitutional system. This system is based on the tradition of “mixed” or “balanced” constitutionalism, which developed in ancient Greece and Rome and came to the Americas via the United Kingdom. The system can be discussed in philosophical or ideological terms but it is rooted in real, physical, institutional power. The tradition begins with great philosophers like Plato and Aristotle but is perhaps best illustrated by the Greek historian Polybius. Polybius observed a violent historical cycle that ceaselessly shifted from despotism to oligarchy to the tyranny of the masses to anarchy and finally back to despotism. He argued that the Roman constitution, by mingling the different social classes (the leaders, the elite, and the masses), could produce a durable constitutional order that would prolong the time period until the state decayed and collapsed. We call this the “Polybius Solution” (Diagram 1). Diagram 1The Polybius Solution
The US's Rolling Political Crisis
The US's Rolling Political Crisis
The US constitution is successful because, like several of the oldest European constitutions, it mixes the different social classes and sources of power so that the leaders, elites, and masses each have a share in the political system and no single group can predominate and overwhelm the others. It is an extra benefit that the US constitution is one of the longest continually operating constitutions in the world, since the long fortification of the system in practice helps provide sociopolitical and economic stability, whereas the ideas themselves are not well taught or understood (Table 1). The fact that the constitution is written in a single document is useful but not decisive, as the British constitution similarly provides stability over long periods of change and upheaval both at home and abroad. Table 1The Balanced Constitution
The US's Rolling Political Crisis
The US's Rolling Political Crisis
Investors should not mistake this constitutional system merely for a set of preferential ideas. Opinions change very easily. But it is physically difficult for ruling classes to take away rights and privileges that the masses of people have been given. Thus the mixture of constitutional powers is based in political realism, not idealism. The US constitution operates not because Americans are more well-meaning, educated, civic-minded, altruistic, or enlightened than others. It operates because the oligarchy is not powerful enough to disenfranchise the democracy, while the democracy is not powerful enough to purge the oligarchy. The government leaders themselves (the president, the lawmakers, the career bureaucrats, etc) are not powerful enough to suspend term limits and stay in power forever. Nor have they been able to ally with either the oligarchy or the democracy closely enough to permanently exclude the other one from its share of power within the system. There is a clear and present danger that the constitutional system could come under too much strain and fracture amid recent power struggles among the American social classes. The struggles between the classes have intensified since the fall of the Soviet Union (which deprived America of a common enemy) and especially the Great Recession (which provoked populist democratic movements). Some fear that a president could turn into an autocrat and refuse to yield power, others fear that the oligarchic faction could steal elections or manipulate the legal system, others fear that the democratic faction could steal elections or ride roughshod over legal procedures. Of these risks, the risk of autocracy is the lowest, while the risk of institutional corruption or electoral manipulation or majoritarian rule-breaking are the highest. Certainly political risk and policy uncertainty will rise from current levels over the 2022-24 election cycle, which promises to be extremely disruptive. However, there are three reasons to hold the baseline view that the US political structure will remain stable enough to sustain economic productivity over the coming years, despite enormous upheaval on the cyclical level of politics. The US remains secure from invasion, while provoked to meet rising geopolitical challenges. Neither Canada nor Mexico poses a fundamental threat to US national security – the US is capable of militarizing the borders, however undesirable – and the US is inaccessible to more distant enemies due to the tyranny of distance across the Atlantic and Pacific oceans. Yet the resurgence of Russia and the rise of China are likely to present common external rivals around which America’s elites will attempt to galvanize public opinion to maintain national security and keep themselves in office. Because elections still tend to swing on historically critical regions, such as the Midwestern heartland, politicians will need to pursue some degree of economic nationalism to stay in power (Map 1). Map 1USA: Splendid Isolation?
The US's Rolling Political Crisis
The US's Rolling Political Crisis
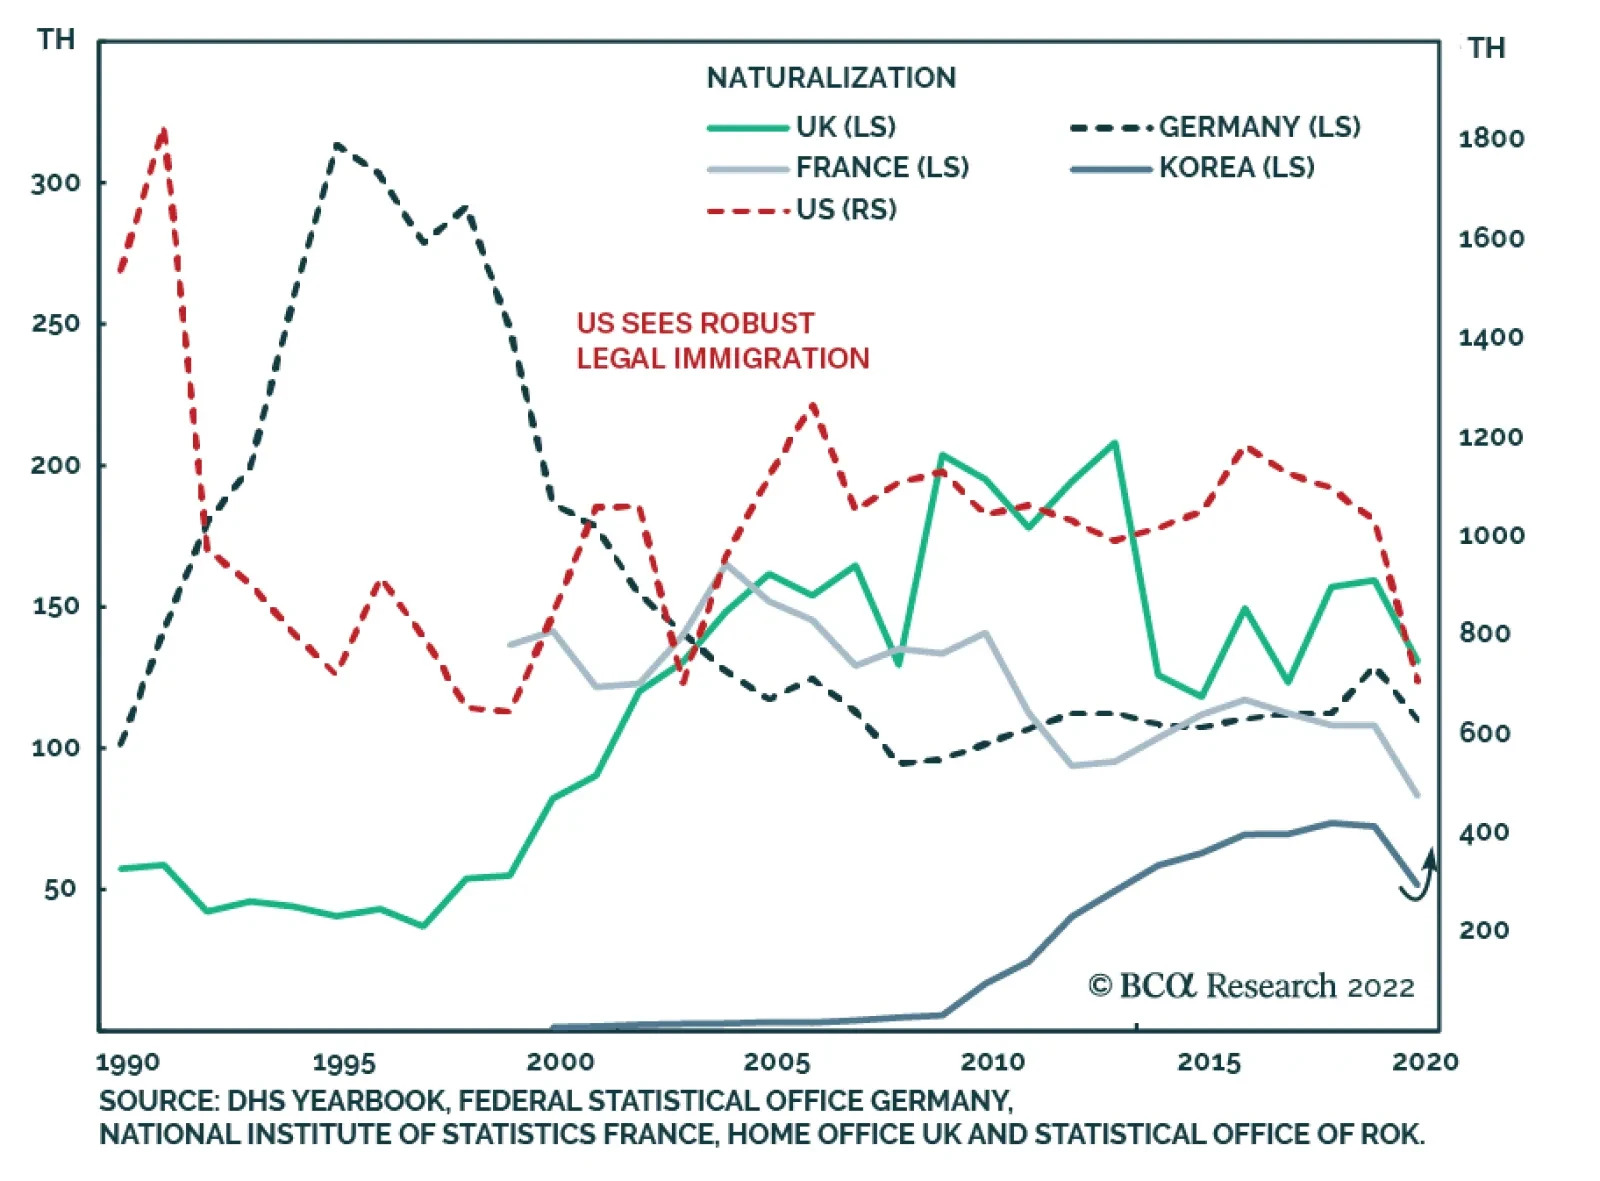
The US continues to benefit from a “brain drain” of talented foreign immigrants and will keep that door open if and when it curbs immigration more broadly. Immigration flows into the US are typically robust according to various indicators, including the numbers of newly naturalized citizens, which is itself an indicator of the US’s abiding advantages (Chart 8). The global pandemic caused a decline that is quickly rebounding. Immigration is one of the major outstanding sources of power struggle between the US political factions. It will become a centerpiece of the 2022-24 election cycle. The outcome is unclear. But general American attitudes toward immigration are not hostile, while elite attitudes favor immigration. Therefore whatever government policy finally emerges, it will likely preserve the US’s national interest of continuing to import global talent . Chart 8People Voting With Their Feet
The US's Rolling Political Crisis
The US's Rolling Political Crisis
The US’s chronic trade imbalance generated a new policy consensus in favor of strengthening American competitiveness. The US pursued a policy of globalization and de-industrialization for decades but it became untenable in the wake of the Great Recession, which spawned a populist backlash. The Biden administration has largely coopted the Trump administration’s hawkish approach to trade. While US trade and current account deficits will remain very large for the foreseeable future, reflecting a fundamental imbalance of savings relative to investment (Chart 9), nevertheless the US will undertake targeted policies to improve supply chain resilience and domestic high-tech competitive edge. The Congress’s likely passage of the American Competes Act of 2022 exemplifies the new bipartisan consensus around the need to invest in American industrial and technological capabilities so as to better compete with great powers overseas (Table 2). Chart 9US Competitiveness Waning?
People Voting With Their Feet
People Voting With Their Feet
Table 2US Bipartisan Consensus On Restoring Competitiveness
The US's Rolling Political Crisis
The US's Rolling Political Crisis
By contrast, other regions face greater geopolitical threats to their homelands and greater difficulties coping with hypo-globalization. Europe’s strategic vulnerability to Russia will dampen investment sentiment and risk appetite. Russia’s economic trajectory has suffered since 2014 and its ongoing conflict with the West will result in isolation and lower productivity. China will see rising tensions with its neighbors due to its economic transition, emerging protectionism, and its need to become more assertive for the sake of supply security. By contrast the US is relatively insulated. Investment Takeaways The US’s economic, constitutional, and geopolitical advantages are structural positives. Rising domestic policy uncertainty over the 2022-24 election cycle might overshadow these positives temporarily, but they are likely to persist over the long run. Increasing geopolitical risks abroad suggest that domestic American policy uncertainty is likely to be overrated. Great power competition – stemming from geopolitical risks – will fuel capital spending among the major nations as well as research and development investments. In this respect the United States faces challenges to maintain its competitive edge. But it is still the leader and the combination of a vibrant private sector and an increasingly proactive public sector are positive (Chart 10). Are the US’s structural advantages already priced? To a great extent, yes. The US equity risk premium today stands at 300 basis points, compared to 660 in Europe and 570 in China. And yet global geopolitical risk, highlighted by Russia’s escalating conflict with the West, suggest that this divergence can get worse before it gets better. We expect the 2022-24 election cycle to cause an increase in policy uncertainty and the political risk premium. But as things stand the increase in uncertainty and risk premiums abroad will be even greater (Chart 11). Chart 10US Investing In The Future?
US Investing In The Future?
US Investing In The Future?
Chart 11US Stocks Priced The Good News?
US Stocks Priced The Good News?
US Stocks Priced The Good News?
Matt Gertken Senior Vice President Chief US Political Strategist mattg@bcaresearch.com Strategic View Open Tactical Positions (0-6 Months) Open Cyclical Recommendations (6-18 Months) Table A2Political Risk Matrix
The US's Rolling Political Crisis
The US's Rolling Political Crisis
Table A3US Political Capital Index
The US's Rolling Political Crisis
The US's Rolling Political Crisis
Chart A1Presidential Election Model
Biden’s Floor, Republican Cracks
Biden’s Floor, Republican Cracks
Chart A2Senate Election Model
Biden’s Floor, Republican Cracks
Biden’s Floor, Republican Cracks
Table A4APolitical Capital: White House And Congress
The US's Rolling Political Crisis
The US's Rolling Political Crisis
Table A4BPolitical Capital: Household And Business Sentiment
The US's Rolling Political Crisis
The US's Rolling Political Crisis
Table A4CPolitical Capital: The Economy And Markets
The US's Rolling Political Crisis
The US's Rolling Political Crisis
Footnotes
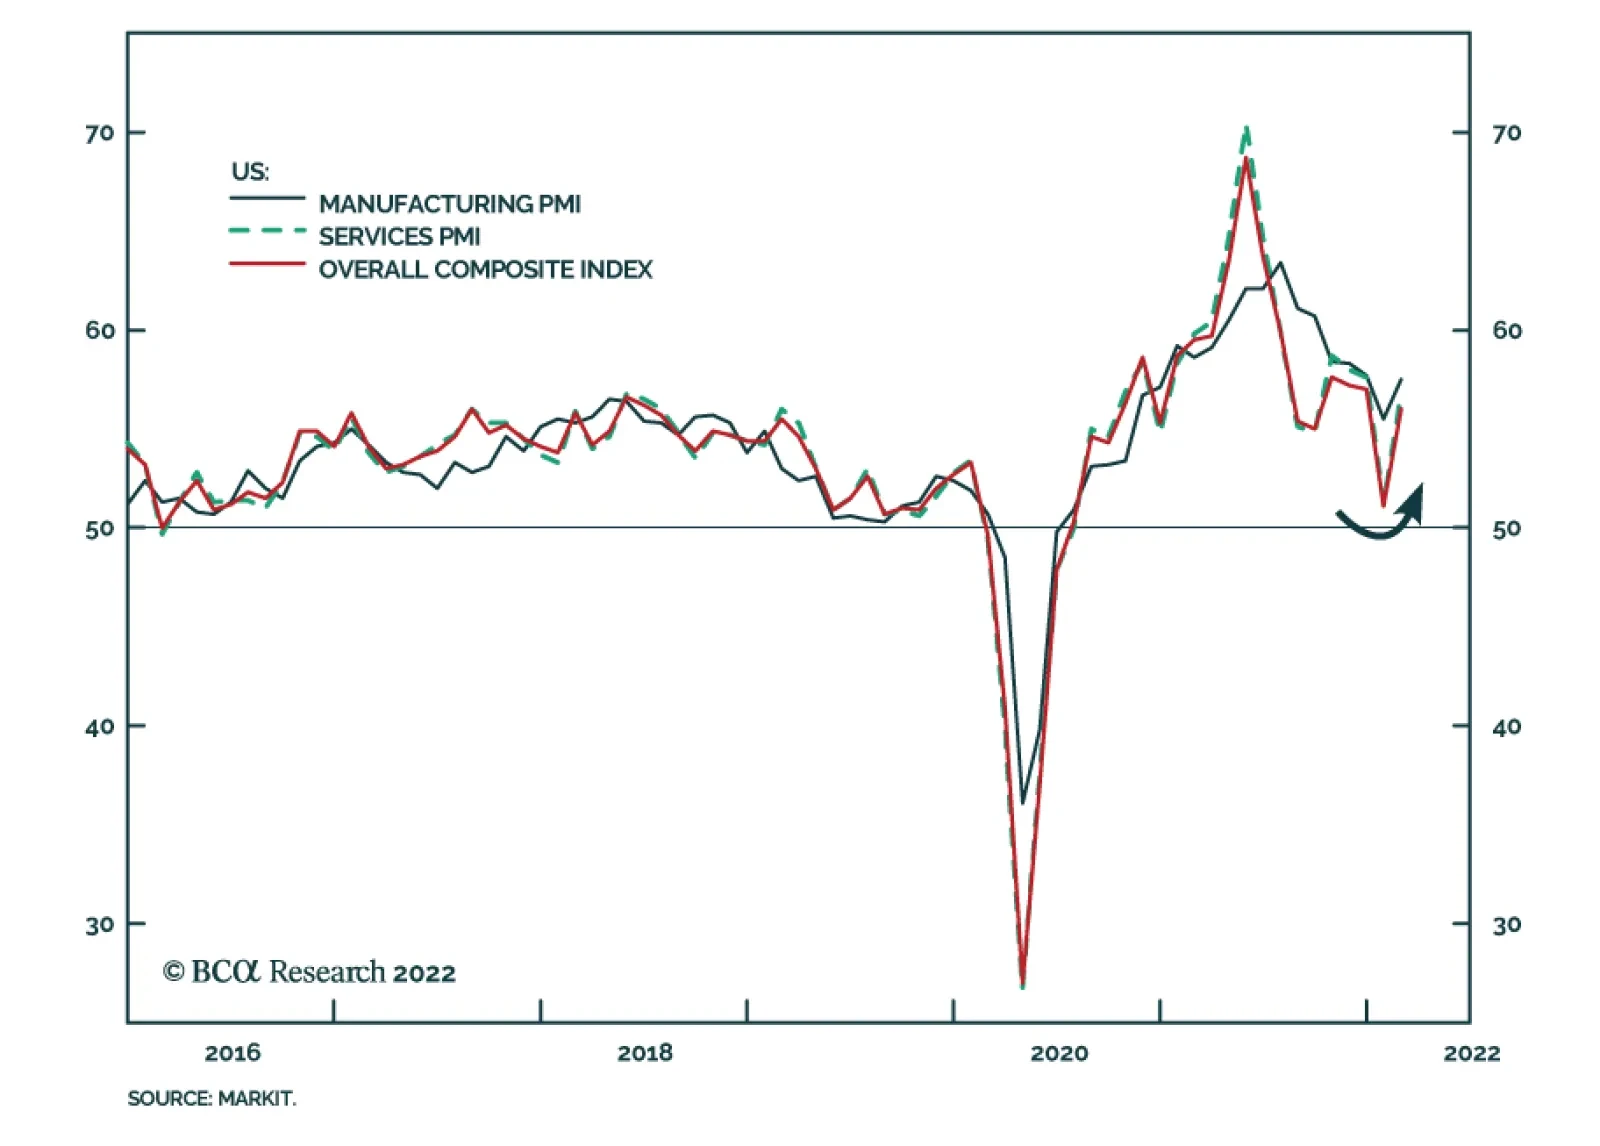
The preliminary estimate of the Markit PMI suggests that US economic activity rebounded in January. The Composite index gained 4.9 points to 56.0, beating expectations of a more moderate improvement to 52.5. Greater than expected improvements in both the…
According to BCA Research’s Global Fixed Income Strategy and US Bond Strategy services, the surge in US Treasury yields looks overdone in the near-term. In the near term, there are several good reasons to expect the recent big run-up in US bond…
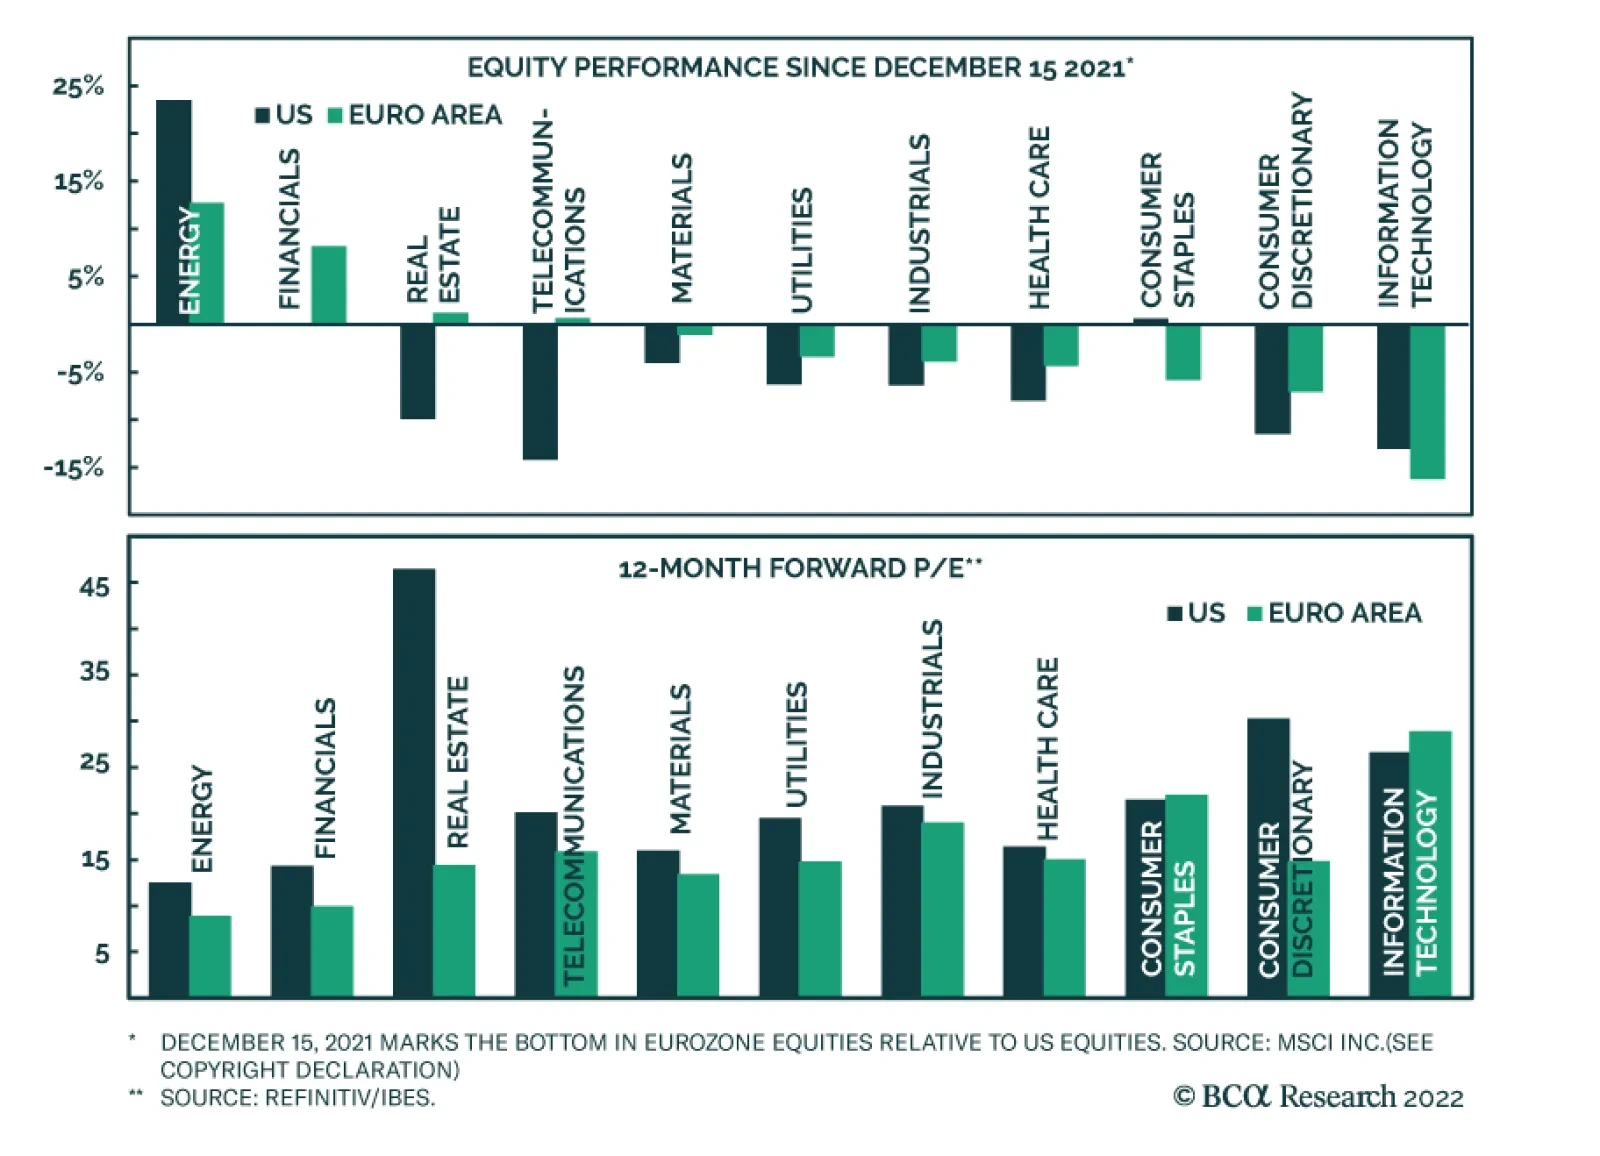
Even though the Eurozone economy is more exposed to potential negative ramifications from the deterioration in Russia’s relationship with the West, Euro Area equities have been passively outperforming US ones since mid-December. Several factors likely explain…
Executive Summary US Treasury yields have surged in response to high US inflation and Fed tightening expectations. However, the move looks overdone in the near-term. Too many Fed hikes are now discounted for 2022, US realized inflation should soon peak, inflation expectations have stabilized, financial conditions have started to tighten, and positioning in the Treasury market is now quite short. These factors will act to stabilize Treasury yields over the next few months, even with the cyclical backdrop remaining bond bearish. Markets Think The Fed Will Hike More Sooner And Less Later – The Opposite Is More Likely
Markets Think The Fed Will Hike More Sooner And Less Later - The Opposite Is More Likely
Markets Think The Fed Will Hike More Sooner And Less Later - The Opposite Is More Likely
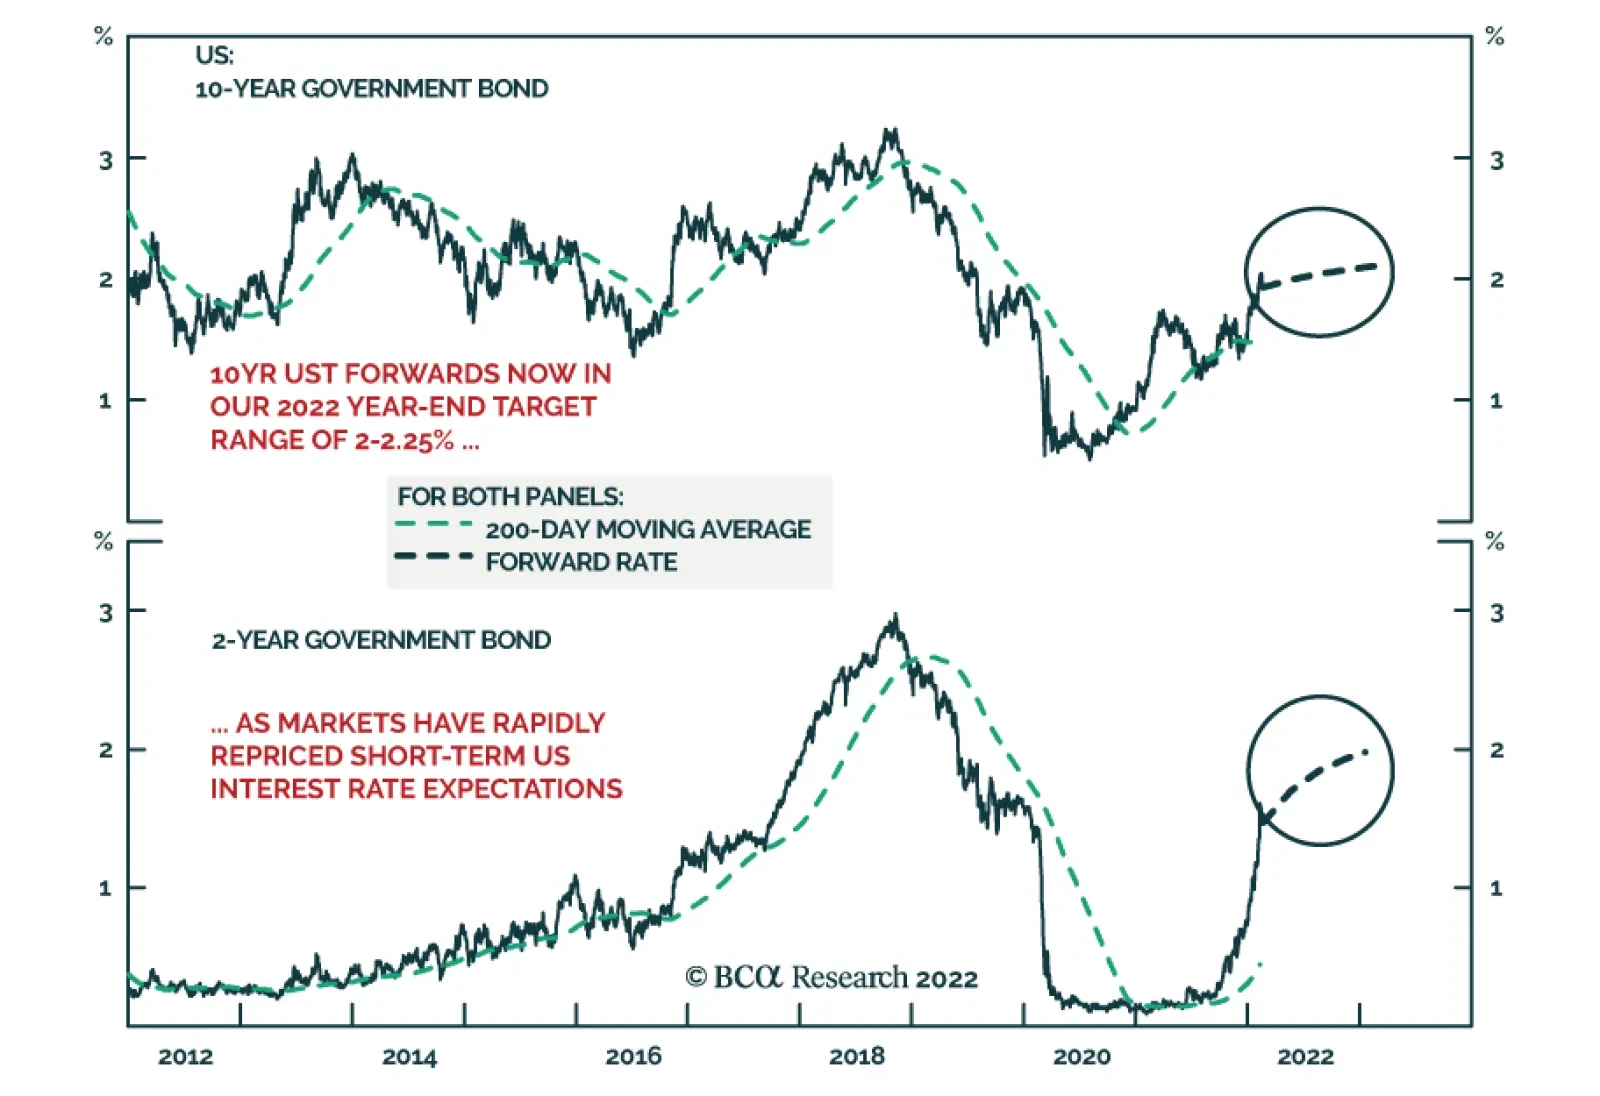
Recommendation Inception Level Inception Date Long Dec 2022/Short Dec 2024 3-Month SOFR Future 0.25 Feb 22/22 New Trade: Go long the December 2022 US SOFR interest rate futures contract versus shorting the December 2024 SOFR contract. The former discounts too many Fed hikes for this year and the latter discounts too few hikes over the next three years. Bottom Line: US Treasury yields now discount the maximum likely hawkish scenario for Fed rate hikes in 2022, with risks all pointing in the direction of the Fed delivering less than expected. Upgrade US duration exposure to neutral from below-benchmark on a tactical basis. Feature Chart 1A Near-Term Overshoot For UST Yields
Five Reasons To Tactically Increase US Duration Exposure Now
Five Reasons To Tactically Increase US Duration Exposure Now
During the BCA Research US Bond Strategy quarterly webcast last week, we announced a shift in our recommended US duration stance, moving from below-benchmark to neutral. This move was more tactical (i.e. shorter-term) in nature, as we still strongly believe that bond markets are underestimating the eventual peak for US bond yields over the next couple of years. In the near term, however, we see several good reasons to expect the recent big run-up in US bond yields to pause, warranting a more neutral tactical duration exposure (Chart 1). We discuss those reasons – and the implications for both US duration strategy - in this report published jointly by BCA Research’s US Bond Strategy and Global Fixed Income Strategy services. Reason #1: Too Many Fed Rate Hikes Are Now Discounted For 2022 The US overnight index swap (OIS) curve currently discounts 146bps of Fed rate hikes by the end of 2022. This is a big change from the start of the year when only 77bps of hikes were priced (Chart 2). The OIS curve repricing now puts the path of the funds rate for this year well above the last set of FOMC interest rate projections published at the December 2021 Fed meeting. In other words, the market has already moved to discount a big upward shift in the FOMC “dots” for 2022, and even for 2023, at next month’s FOMC meeting. Chart 2Markets Think The Fed Will Hike More Sooner And Less Later - The Opposite Is More Likely
Markets Think The Fed Will Hike More Sooner And Less Later - The Opposite Is More Likely
Markets Think The Fed Will Hike More Sooner And Less Later - The Opposite Is More Likely
We think a more likely outcome for 2022 is that the Fed lifts rates four or five times, not six or even seven times as some Wall Street investment banks are forecasting. We set out the reasons why we think the Fed will go less than expected in the rest of this report. At a minimum, there is virtually no chance that the Fed will provide guidance to markets that is more hawkish than current market pricing, which would push bond yields even higher in the near term. Reason #2: US Inflation Will Soon Peak The relentless string of upside surprises on US inflation has been the main reason the bond market has moved so rapidly on pricing in more Fed rate hikes. The story is about to change, however, as US inflation should peak sometime in the next few months and begin to rapidly decelerate toward levels much closer to, but still well above, the Fed’s 2% inflation target. Already, the intense global inflation pressures from commodities and traded goods prices over the past year has started to lose potency. The annual growth rate of the CRB Raw Industrials index has eased from a peak of 45% in June to 18%, in line with slowing growth momentum of global manufacturing activity (Chart 3, top panel). The softening of input price pressures is evident in business survey measures like the ISM Manufacturing Prices Paid index, which typically leads US headline CPI inflation by six months and has fallen by 16 points since the peak in June (middle panel). Chart 3Global Inflation Pressures Easing
Global Inflation Pressures Easing
Global Inflation Pressures Easing
The global supply chain disruptions that have caused inventory shortages in products ranging from new cars to semiconductors also appear to be easing. Supplier delivery times are shortening according to the ISM Manufacturing and Non-Manufacturing surveys (bottom panel). Combined with other indications of the loosening of supply chain logjams, like lower shipping costs, the influence of supply disruptions on inflation should diminish, on the margin. Energy prices should also soon contribute to disinflationary momentum (Chart 4). BCA Research’s Commodity & Energy Strategy service is forecasting the Brent oil price to reach $76/bbl at the end of 2022 and $80/bbl at the end of the 2023. That represents a significant decline from the current $95/bbl price that reflects a large risk premium for the potential oil market supply disruptions in response to a Russian invasion of Ukraine. A war-driven spike in oil prices does risk extending the current period of high US (and global) inflation. However, it should be noted that the annual growth in oil prices has been decelerating even as oil prices have been rising recently, showing the power of base effect comparisons that should lead to a lower contribution to overall inflation from energy prices over the next 6-12 months. Chart 4Oil Prices Will Soon Turn Disinflationary
Oil Prices Will Soon Turn Disinflationary
Oil Prices Will Soon Turn Disinflationary
Chart 5A Changing Mix Of US Consumer Spending Will Lower Overall Inflation
A Changing Mix Of US Consumer Spending Will Lower Overall Inflation
A Changing Mix Of US Consumer Spending Will Lower Overall Inflation
Looking beyond the commodity space, a shifting mix of US consumer spending should also help push overall US inflation lower. US core CPI inflation hit a 34-year high of 6.0% in January, fueled by 11.7% growth in core goods inflation (Chart 5). We anticipate that overall core inflation will slow to levels more consistent with the trends seen in more domestically focused sectors like core services and shelter, where inflation is running around 4%. US consumers have started to shift their spending patterns away from goods, which was running well above its pre-pandemic trend, back toward services, which was running below its pre-pandemic trend (Chart 6). This will help narrow the gap between goods and services inflation, particularly as easing supply chain disruptions help dampen goods inflation. Chart 6Goods Inflation Should Soon Peak
Goods Inflation Should Soon Peak
Goods Inflation Should Soon Peak
Chart 7There Are Still Pockets Of Available US Labor Market Supply
There Are Still Pockets Of Available US Labor Market Supply
There Are Still Pockets Of Available US Labor Market Supply
Chart 8US Wage Growth Should Soon Begin To Moderate
US Wage Growth Should Soon Begin To Moderate
US Wage Growth Should Soon Begin To Moderate
There is also the potential for some of the pressures stemming from the tight US labor market to become a bit less inflationary in the coming months. While the overall US unemployment rate of 4% is well within the range of full employment NAIRU estimates produced by the FOMC, there are notable differences across employment categories suggesting that there are still sizeable pockets of labor supply. For example, the unemployment rate for managerial and professional workers is a tiny 2.3%, while the unemployment rate for services workers was a more elevated 6.7% (Chart 7, top panel). There are also noteworthy differences in US labor market trends when sorted by wage growth. Employment in industries with lower wages – predominantly in services – has not returned to the pre-pandemic peak, unlike employment in higher wage cohorts (middle panel).1 As the US economy puts the Omicron variant in the rearview mirror, service industries most impacted by pandemic restrictions should see an increase in labor supply as workers return to the labor force. This will help close the one percentage point gap between the labor force participation rate for prime-aged workers (aged 25-54) and its pre-pandemic peak (bottom panel). This will also help to mitigate the current upturn in service sector wage growth, which reached 5.2% at the end of 2021 according to the US Employment Cost Index (Chart 8). When US inflation finally peaks in the next few months – most notably for goods prices and service sector wages – the Fed will be under less pressure to hike rates as aggressively as discounted in current bond market pricing. Reason #3: US Inflation Expectations Have Stabilized Chart 9TIPS Breakevens Are Not Telling The Fed To Be More Aggressive
TIPS Breakevens Are Not Telling The Fed To Be More Aggressive
TIPS Breakevens Are Not Telling The Fed To Be More Aggressive
The Fed always pays a lot of attention to inflation expectations, particularly market-based measures like TIPS breakevens, to assess if its monetary policy stance is appropriate. The current message from breakevens is that the Fed does not have to turn even more hawkish than expected to bring inflation back down to levels consistent with the Fed’s 2% target. The 10-year TIPS breakeven is currently 2.4%, down from a peak of 2.8% and within the 2.3-2.5% range that we deem consistent with the Fed’s inflation target. Inflation expectations are even more subdued on a forward basis, with the 5-year TIPS breakeven, 5-years forward now down to 1.95% (Chart 9). Shorter term TIPS breakevens remain elevated, with the 2-year breakeven at 3.7%. We continue to favor positioning for a narrower 2-year TIPS breakeven spread – realized inflation will soon peak and the New York Fed’s Consumer Expectations survey shows that household inflation expectations for the next three years have already fallen significantly (bottom panel). Lower inflation expectations, both market-based and survey-based, suggest that the Fed can be cautious on the pace of rate hikes after liftoff next month. Reason #4: US Financial Conditions Are Tightening Alongside Cooling US Growth Momentum We have long described the link between financial markets and the Fed’s policy stance as “The Fed Policy Loop.” In this framework, the markets act as a regulator on Fed hawkishness (Chart 10). If the Fed comes across as overly hawkish, risk assets will sell off (lower equity prices, wider corporate credit spreads), the US dollar will appreciate, the US Treasury curve will flatten and market volatility measures like the VIX index will increase. All of those trends act to tighten US financial conditions, threatening a growth slowdown that will force the Fed to back off from its previous hawkish bias. Chart 10The Fed Policy Loop
Five Reasons To Tactically Increase US Duration Exposure Now
Five Reasons To Tactically Increase US Duration Exposure Now
Financial conditions have indeed tightened as markets have priced in more Fed rate hikes in 2022 (Chart 11). Since the start of the year, the S&P 500 is down 9% year-to-date, US investment grade corporate spreads have widened 26bps, the 2-year/10-year US Treasury curve has flattened by 34bps and the VIX index has increased 11 pts. In absolute terms, US financial conditions remain highly stimulative and the risk asset selloff so far poses little threat to US economic growth. However, if the Fed were to deliver all of the rate hikes in 2022 that are currently discounted in the US OIS curve, the market selloff would deepen as investors began to worry about a Fed-engineered economic slowdown. This would lead to a more significant tightening of financial conditions, representing an even bigger risk to US growth. The Fed cannot risk appearing too hawkish too soon, with US growth momentum already showing signs of slowing (Chart 12). The Conference Board US leading economic indicator has stopped accelerating and may be peaking, US business confidence is softening and consumer confidence is very depressed according to the University of Michigan survey. Importantly, high inflation is cited as the main reason for weak consumer confidence, as wage increases have not matched price increases. If realized inflation falls, as we expect, this could actually provide a boost to consumer confidence as households would feel an improvement in real incomes and spending power – a development that could eventually lead to more Fed rate hikes in 2023 if consumer spending improves, especially if inflation stays above the Fed’s 2% target. Chart 11Fed Hawkishness Has Already Tightened Financial Conditions
Fed Hawkishness Has Already Tightened Financial Conditions
Fed Hawkishness Has Already Tightened Financial Conditions
Chart 12Not The Best Time For The Fed To Be More Aggressive
Not The Best Time For The Fed To Be More Aggressive
Not The Best Time For The Fed To Be More Aggressive
For now, however, the risk of a preemptive tightening of financial conditions will ensure that the Fed delivers fewer rate hikes than the market expects this year. Reason #5: Treasury Market Positioning Is Now Very Short Chart 13Reliable Bond Indicators Calling For A Pause In The UST Selloff
Reliable Bond Indicators Calling For A Pause In The UST Selloff
Reliable Bond Indicators Calling For A Pause In The UST Selloff
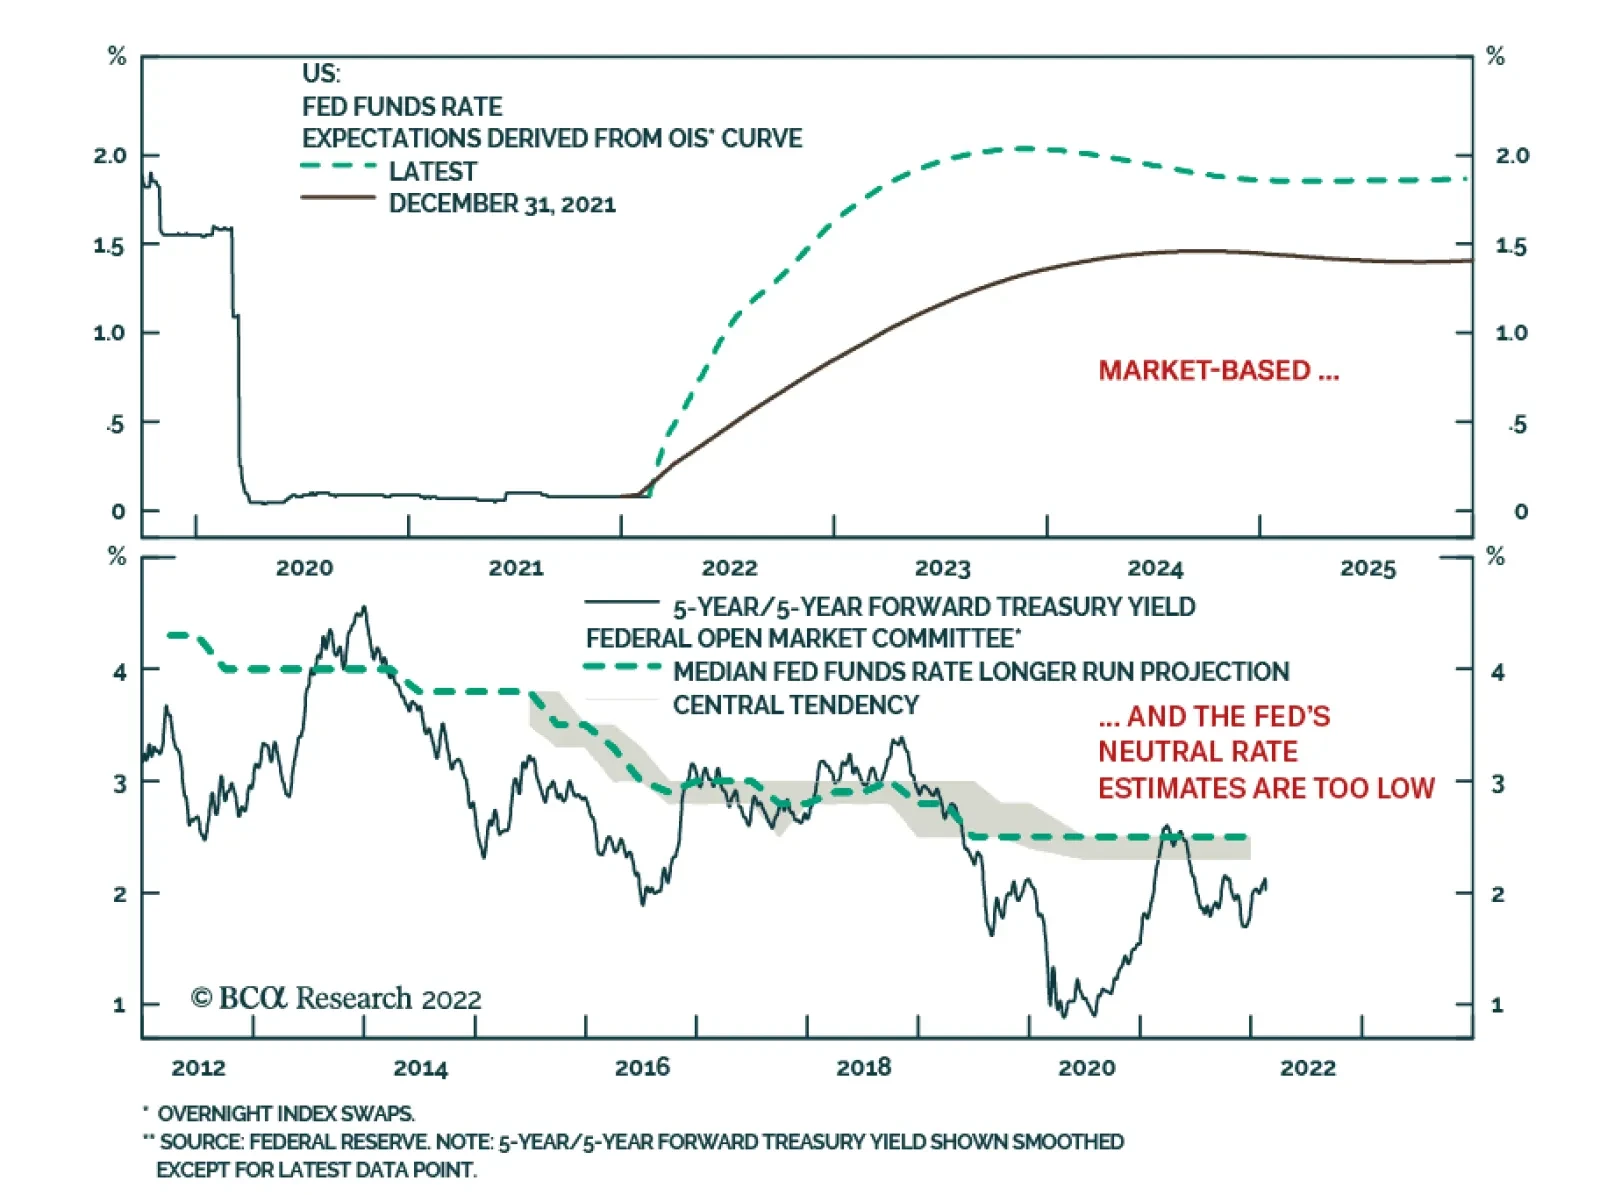
The final reason to increase US duration exposure now is that Treasury market positioning has become quite short and has become a headwind to higher bond yields and lower bond prices. The JP Morgan fixed income client duration survey shows that bond investors are running duration exposures well below benchmark (Chart 13). Speculators are also running significant short positions in longer-maturity US Treasury futures. This suggests limited selling power in the event of more bond bearish news and increased scope for short-covering in the event of risk-off event – like a shooting war in Ukraine – or surprisingly negative US economic data. On that front, the Citigroup US data surprise index, which is typically highly correlated to the momentum of US Treasury yields, has dipped a bit recently but remains at neutral levels (top panel). A similar measure of neutrality is sent by some of our preferred cyclical bond indicators like the ratio of the CRB raw industrials index to the price of gold – the 10-year yield is now in line with that ratio, which appears to be peaking (middle panel). Investment Conclusions Given the five reasons outlined in this report – too many Fed hikes are now discounted for 2022, US realized inflation should soon peak, inflation expectations have stabilized, financial conditions have started to tighten, and positioning in the Treasury market is now quite short – we decided last week to upgrade our recommended US portfolio duration to neutral from below-benchmark. However, this move is only for a tactical investment horizon. We still see the cyclical backdrop as bond bearish, as Treasury yields do not yet reflect how high US interest rates will rise in the upcoming tightening cycle. The 5-year Treasury yield, 5-years forward is currently at 2.0%. This lies at the low end of the range of estimates of the longer-run neutral fed funds rate (Chart 14) from the New York Fed’s survey of bond market participants (2%) and the median FOMC longer-run interest rate projection from the Fed dots (2.5%). We see the Fed having to lift rates faster than markets expect in 2023 and 2024. US inflation this year is expected to settle at a level above the Fed’s 2% target before picking up again next year alongside renewed tightening of labor market conditions once the remaining supply of excess labor is fully absorbed. Chart 14The Cyclical UST Bear Market Is Not Over Yet
The Cyclical UST Bear Market Is Not Over Yet
The Cyclical UST Bear Market Is Not Over Yet
Chart 15Go Long The Dec/22 SOFR Contract Vs. The Dec/24 Contract
Go Long The Dec/22 SOFR Contract Vs. The Dec/24 Contract
Go Long The Dec/22 SOFR Contract Vs. The Dec/24 Contract
As a way to position for the Fed doing fewer rate hikes than expected in 2022, but more hikes than expected in 2023/24, we are entering a new trade this week – going long the December 2022 3-month SOFR US interest rate futures contract versus a short position in the December 2024 3-month SOFR contract. The implied interest rate spread on those two contracts has tightened to 25bps (Chart 15). We expect that trend to reverse, however, with the spread increasing as markets eventually move to price out rate hikes in 2022 and price in much more Fed tightening in 2023 and 2024. We will discuss the implications of the shift in our US duration stance for our views on non-US bond markets in next week’s Global Fixed Income Strategy report. Our initial conclusion is that our country allocation recommendations for government bonds will remain unchanged – underweighting the US, UK, and Canada; overweighting core Europe, peripheral Europe, Japan and Australia – but we will also increase duration exposure within most (if not all) countries. As in the US, we also see markets pricing in too many rate hikes in the UK and Canada for 2022 but too few rate hikes over the next two years. On the other hand, markets are pricing in too many rate cumulative hikes over the next 2-3 years in Europe, Australia and Japan (Table 1). Table 1Markets Have Pulled Forward Rate Hikes Everywhere
Five Reasons To Tactically Increase US Duration Exposure Now
Five Reasons To Tactically Increase US Duration Exposure Now
Robert Robis, CFA Chief Fixed Income Strategist rrobis@bcaresearch.com Footnotes 1 The definitions for the wage cohorts can be found in the footnote of Chart 7. Cyclical Recommendations (6-18 Months)
Five Reasons To Tactically Increase US Duration Exposure Now
Five Reasons To Tactically Increase US Duration Exposure Now
Tactical Overlay Trades
BCA Research’s US Investment Strategy service is inclined to side with the Conference Board’s upbeat consumer confidence reading over the University of Michigan’s dismal one. The two leading surveys have wildly different takes on consumer confidence.…
Market expectations for the Fed Funds rate derived from the OIS curve reveal that investors expect the Fed to embark on an aggressive tightening campaign over the coming year. 167 basis points of rate hikes are currently priced over the coming 12 months.…
Executive Summary Earnings Growth Outpacing Multiple Expansion
Energy: After Seven Lean Years (Part II)
Energy: After Seven Lean Years (Part II)
The US Energy sector is in a good place right now: Rising demand and faltering supply from OPEC 2.0 translate into a price of oil anchored at around $80 to $85/bbl. This price is twice the breakeven production cost for the majority of US producers. High prices have also created an opening for US Energy producers to restart Capex to increase production. Further, the Energy sector tends to outperform in an environment of high inflation and rising rates. As a real asset, oil is also a good inflation hedge, a quality that extends to Energy-related equities. The favorable macro backdrop is also complimented by bombed-out valuation. Meanwhile, technicals are overbought signaling that a near-term pause is needed for prices to reset. Bottom Line: We reiterate our cyclical overweight in the Energy sector, despite the rising probability or a near-term pullback. Within Energy, we recommend a cyclical overweight of the upstream and equipment & services segments, underweight midstream, and equal weight downstream and integrated stocks. Feature Dear client, In lieu of the February 28th publication, we will be sending you a Special Report on Wednesday, February 23rd written by our US Political Strategy service colleagues. Our regular weekly publication will resume Monday, March 7th. Kind Regards, Irene Tunkel Chief Strategist, US Equity Strategy Part I Recap Last week, in Part I of this Special Report, we described the structure of the Energy sector, its value chain, key industry drivers, and supply/demand/oil price dynamics. The Energy value chain consists of four distinct segments, with each segment corresponding to a section of the oil production value chain. The GICS classifies them as Oil & Gas Exploration and Production (Upstream or E&P), Oil & Gas Equipment and Services (E&S), Storage and Transportation (Midstream or S&T), and Refining and Marketing (Downstream or R&M). Integrated Oil & Gas straddles the entire supply chain (Integrated). Demand exceeds supply: We concluded that crude oil demand is expected to return to trend, driven by strong economic growth and the receding pandemic. In the meantime, production remains suppressed because of curtailments by OPEC 2.0 members, investment restraint from US producers, and multiple supply disruptions. Sizzling tensions with Iran, Russia, and a possible new market share war with the Saudis exacerbate supply problems and lead to heightened volatility in crude oil prices. The US Energy producers are ramping up supply: To meet the increasing oil demand, US shale oil producers are now perfectly positioned to pick up the slack in supply. To ramp up production, the US oil companies will have to invest in new and existing wells, starting a new Capex cycle, after “seven lean years” of Capex (Chart 1). There are early signs that the US Energy sector is in the early innings of new Capex and production. This week, we rely on our investment process, i.e., analysis of the macroeconomic backdrop, fundamentals, valuations, and technicals to shape our view on each segment of the Energy value chain. We are currently overweight the Energy sector and are ahead of the benchmark by 35%. Chart 1The Energy Industry Is In The Early Innings Of New Capex Cycle
The Energy Industry Is In The Early Innings Of New Capex Cycle
The Energy Industry Is In The Early Innings Of New Capex Cycle
Macroeconomic Backdrop Can Withstand Rising Rates And High Inflation The Energy sector tends to outperform in the environment of high inflation and rising rates (Chart 2). As a real asset, oil is also a good inflation hedge, a quality that extends to Energy-related equities. Appreciating Dollar Is A Temporary Phenomenon There is a tight inverse relationship between the USD and energy prices due to the simple fact that commodity prices are quoted in dollars. Over the past seven years, the nominal WTI oil price has been over 70% inversely correlated with the strength of the USD trade-weighted index (TWI), with a beta of oil to USD of -1.6. That is, a 1% change in the TWI would be expected to translate into a $1.60/barrel change in the price of WTI (Chart 3). Chart 2The Energy Sector Is Resilient To Rising Rates
Energy: After Seven Lean Years (Part II)
Energy: After Seven Lean Years (Part II)
Chart 3Price Of Oil And USD Are Inversely Correlated
Price Of Oil And USD Are Inversely Correlated
Price Of Oil And USD Are Inversely Correlated
According to the BCA Research FX Strategy team, the recent dollar strengthening is a temporary phenomenon, catalyzed by the rising interest-rate differential with the rest of the world. However, historically, equity portfolio flows have been more important than other factors in explaining dollar moves. Rising rates undermine the performance of US equities and are likely to lead to a reversal in cross-border equity flows, damaging the key pillar of support for the dollar. Hence, risks to the dollar are on the downside. Fundamentals And Valuations The Energy Sector Is Enjoying Strong Sales EIA reports that “global oil consumption outpaced oil production for the six consecutive quarters, ending with the fourth quarter of 2021 (4Q21), which has led to persistent withdrawals from global oil inventories and significant increases in crude oil prices”.1 As a result of higher production, and WTI prices increasing from $52 to $85 over 2021, energy company sales have soared (Chart 4). Looking ahead, we expect sales growth to remain robust, albeit lower than in 2021: Not only are comparables more challenging, but economic growth is also decelerating. What can bring the strong sales growth to a halt? The answer is that it may be either higher prices or higher volumes: Surging prices destroy demand while surging volumes suppress oil prices, which, eventually, weigh on Capex and production. At the moment, both production levels and price are in a sweet spot: All segments of the value chain are benefiting from high but not excessive prices and volumes. Chart 4Energy Sales Surged In 2021
Energy Sales Surged In 2021
Energy Sales Surged In 2021
Chart 5Sector Profitability Is Tied To The Price Of Oil
Sector Profitability Is Tied To The Price Of Oil
Sector Profitability Is Tied To The Price Of Oil
Profit Recovery Continues The overall profitability of the Energy sector is also tightly linked to the price of oil (Chart 5). The BCA Research house view is WTI centered around $80-85, with substantial volatility triggered by geopolitical tensions. With oil prices likely peaking, barring any negative geopolitical developments, earnings growth normalization off the high levels is expected (Chart 6). However, even if they are slowing, Energy sector earnings are expected to grow by 26% over the next 12 months, exceeding S&P 500 earnings by 17%. Further, over the next five years, energy earnings growth is expected to re-accelerate towards the 26% range. Chart 6Energy Sector's Earnings Growth To Exceed The Market's
Energy Sector's Earnings Growth To Exceed The Market's
Energy Sector's Earnings Growth To Exceed The Market's
Chart 7Margins To Continue To Expand
Margins To Continue To Expand
Margins To Continue To Expand
Importantly, sector operating margins are expected to expand towards 10% (Chart 7), which is quite a feat considering the broad-based margin contraction of the other S&P 500 sectors and industries. Our verdict? Earnings growth expectations look darn good! Despite Recent Outperformance, Valuations Are Still Attractive The BCA valuation indicator, which is a composite of P/B, P/S, and DY relative to the S&P 500, standardized relative to its own history, shows that the sector is still undervalued (Chart 8), despite a recent run of performance – earnings growth still outpaces multiple expansion (Chart 9). The energy sector is currently trading with a nearly 40% discount to the S&P 500 (Table 1) on a forward earnings basis (12.4x vs 20.3x). Chart 8Still Undervalued…
Still Undervalued…
Still Undervalued…
Chart 9Earnings Growth Outpacing Multiple Expansion
Energy: After Seven Lean Years (Part II)
Energy: After Seven Lean Years (Part II)
Table 1Valuation Summary
Energy: After Seven Lean Years (Part II)
Energy: After Seven Lean Years (Part II)
Cheap But Overbought! Curiously, despite modest valuations, from a technical standpoint the sector appears overbought (Chart 10). Worse yet, our Energy Sentiment Composite is outright in the bullish zone (Chart 11) with a reading last achieved in 2009. This is certainly concerning, as euphoria is inevitably followed by panic and disappointment. However, we need to keep in mind that the technical indicators are short term in scope by design, and their main use is to help refine the position entry and exit timing. Chart 10...But Overbought!
...But Overbought!
...But Overbought!
Chart 11Sentiment Is Extended
Sentiment Is Extended
Sentiment Is Extended
Why such a pronounced dichotomy with valuations? Technical indicators are based on returns, which have been rather outstanding for the sector, while valuations take into account earnings growth, which explains and justifies the surging returns. Too Much Cash Our analysis would be amiss if we did not bring energy companies’ free cash flow (FCF) into the discussion. With a curtailed supply of energy and rising prices, these companies have been awash in cash (Chart 12) – their FCF has increased by nearly 80% year over year, and profits have surged. What will companies do with this windfall? Well, first and foremost, during the seven lean years of extreme Capex discipline, these companies have gotten their commitment to returning cash to shareholders embedded in the corporate psyche, which is something that is unlikely to change fast. Energy continues to be the highest-yielding sector in the S&P 500 (Chart 13). However, having learned the lesson the hard way, many companies are adopting variable dividends to avoid potential disappointment if the oil price collapses. In addition to disbursing cash, the energy companies are paying off debt and are investing in expanding production. Chart 12Windfall Of Cash
Windfall Of Cash
Windfall Of Cash
Chart 13Energy Is The Highest Yielding Sector
Energy: After Seven Lean Years (Part II)
Energy: After Seven Lean Years (Part II)
Investment Outlook By Segments Of The Energy Value Chain The macroeconomic backdrop for Energy appears benign, with rates rising, inflation elevated, and the dollar likely contained. The sector also appears attractive from both a profitability and a valuation standpoint. However, a near-term pullback is likely as the sentiment around the sector is overly bullish – but that is likely to be short-lived. While we like the sector overall, we aim to provide granular industry group recommendations. To do so, we will zoom in on each segment of the value chain. Oil And Gas Exploration & Production (Upstream) Strong demand recovery and OPEC 2.0 oil production shortages bode well for the US E&P companies, which are cautiously starting to restart capital investment and ramp up production. We expect the E&P, especially shale oil production, companies to be one of the best performing energy subsectors, with WTI anchored around a consensus of $80-85/bbl. The upstream segment is highly dependent on the price of oil, which is currently in a sweet spot: High but not high enough to cause demand destruction (Chart 14). With oil prices peaking, E&P sales growth is decelerating (Chart 15). However, upstream also benefits from the sustainable cost reductions achieved through improved experience in well siting, drilling, and completion techniques. Chart 14Upstream Earnings Depend On The Price Oil
Upstream Earnings Depend On The Price Oil
Upstream Earnings Depend On The Price Oil
Chart 15Sales Growth Is Normalizing
Sales Growth Is Normalizing
Sales Growth Is Normalizing
As a result of growing, albeit decelerating, sales and effective cost management, E&P is one of the most profitable segments of the energy complex: Operating margins are currently at 22% and are expected to expand to 27% (Chart 16). From a valuation standpoint, the industry is trading at 10 times forward earnings, which represents an 50% discount to the S&P 500. The BCA valuation indicator for the industry group is also in the undervalued territory (Chart 17). Chart 16Margins To Continue To Expand
Margins To Continue To Expand
Margins To Continue To Expand
Chart 17E&P Is Still Cheap
E&P Is Still Cheap
E&P Is Still Cheap
Overweight Oil and Gas Exploration & Production industry Equipment And Services Is A High Octane Play On The New Capex Cycle Upstream Capex is revenue for E&S companies. After “seven lean years” of the Capex cycle, the fortunes of E&S companies are finally turning, with a rising price of oil finally enticing upstream companies to expand production by reopening existing and drilling new wells (Chart 18). According to CFRA, upstream Capex is expected to increase by 25% in 2022, and 7% in 2023. With the new energy Capex cycle in sight, Oil Services is the only energy segment for which sales growth is expected to accelerate over the coming year (Chart 19). In fact, sales will continue to grow at a healthy clip until the cycle matures – a time period measured in years. Chart 18Capex Has Restarted
Capex Has Restarted
Capex Has Restarted
Chart 19Sales Growth Is Rebounding Sharply
Sales Growth Is Rebounding Sharply
Sales Growth Is Rebounding Sharply
The profitability of the sector is also normalizing after a pandemic slump, and margins are expected to stay flat (Chart 20) despite industry labor costs rising sharply to 8% year over year (Chart 21). Earnings are expected to rise by a third in 2022, albeit off very low levels. Chart 20Profit Margins Will Stabilize
Profit Margins Will Stabilize
Profit Margins Will Stabilize
Chart 21Rising Wages Are Cutting Into Profitability
Rising Wages Are Cutting Into Profitability
Rising Wages Are Cutting Into Profitability
In terms of valuations, the E&S industry is one of the cheapest in the sector, with the BCA Valuations Indicator standing at -1.5 standard deviations below a long-term average. We are positive on the Energy Equipment and Services space, which we consider a high octane play on the upcoming production increases and the new energy cycle. Overweight Energy Equipment and Services Storage And Transportation Will Benefit From Rising Production Volumes The midstream segment is one of the most profitable in the energy supply chain. This industry has high fixed costs, and its profitability is a function of production volume, not oil price. (Chart 22). From that standpoint, the industry is in a good place: US production volume, especially of shale oil, is poised to increase, filling the pipelines and driving sales growth. However, there are also challenges: Pipelines installed in older shales start to see original contractual commitments expiring, resulting in lower cash flows as the pipelines try to re-commit suppliers within a market that has an abundance of pipeline capacity. On the cost side, the S&T segment is seeing an increase in labor costs, with average hourly earnings (AHE) rising close to 10%. Chart 22Production Volume Is A Driver Of Midstream Segment's Profitability
Production Volume Is A Driver Of Midstream Segment's Profitability
Production Volume Is A Driver Of Midstream Segment's Profitability
With challenges on the sales side and rising costs, it is not surprising that the market expects earnings in the S&T industry to stay flat over the next year or so (Chart 23). Operating profit margins will contract over the next year from the 19% the industry is enjoying now to roughly 14% (Chart 24). Chart 23Midstream Earnings Are To Stay Flat
Midstream Earnings Are To Stay Flat
Midstream Earnings Are To Stay Flat
Chart 24Industry Is Highly Profitable But Margins Are Contracting
Industry Is Highly Profitable But Margins Are Contracting
Industry Is Highly Profitable But Margins Are Contracting
In addition, it is important to note that pipelines run through public land. The recent tightening of EPA regulations and an administration hostile to fossil fuel may halt or slow down pipeline build-out. This may be a short-term negative as some companies may have to forego some of their investments. Over the long run, this may limit pipeline availability and lead to higher energy transportation and storage costs. Underweight Energy Storage and Transportation Industry Energy Refining And Marketing– Favorable Backdrop But No Oomph Similar to the midstream segment, refiners are a high fixed cost operation, and their business is only loosely dependent on the price of oil. Profitability of downstream companies is a function of capacity utilization of the refining facilities, and the crack spread or price differential between the price of crude and refined oil. Thanks to rising demand for oil, and rising volumes, capacity utilization stands at nearly 90% and is approaching pre-pandemic levels (Chart 25, bottom panel). Crack spreads are also high in absolute terms thanks to low inventories (Chart 25, top panel). Chart 25High Capacity Utilization and Wide Crack Spreads Are A Boon For Downstream…
High Capacity Utilization and Wide Crack Spreads Are A Boon For Downstream…
High Capacity Utilization and Wide Crack Spreads Are A Boon For Downstream…
Chart 26...But Razor-Thin Margins Make The Industry Vulnerable
...But Razor-Thin Margins Make The Industry Vulnerable
...But Razor-Thin Margins Make The Industry Vulnerable
With the upstream segment ramping up production, refining volumes should increase, further improving capacity utilization. And while margins are razor-thin, they are projected to increase over the next year (Chart 26). The key concern about the industry is that, with margins this narrow, there is little or no buffer to absorb changes in crack spreads or capacity utilization should oil prices rise or volumes decline. And yet, downstream, while cheap, is more expensive than Oil Services, midstream, or Integrated Oil. Equal-weight Energy Refining and Marketing industry Integrated Oil & Gas Is A Safe Bet Integrated Oil is an industry that is diversified across all the segments of the value chain. The characteristics that allowed Integrated Companies to maintain their stock prices better during the downturn – less financial leverage, less reinvestment volatility, stronger dividend support, and counter-cyclical improvement of downstream operations – will work against these stocks during an oil price recovery. As such, while Integrated stocks should benefit from higher prices and production volumes, this is a lower beta proposition: It is better to own Integrated Oil on the way down, but riskier and higher beta E&P or Oil Services stocks during the up leg of the energy cycle. Equal-Weight Integrated Oil & Gas Investment Implications The US Energy sector is in a good place right now: Rising demand and faltering supply from OPEC 2.0, translates into a price of oil anchored around $80 to $85/bbl. This price is twice the breakeven production cost for the majority of the US producers. Rising oil prices had resulted in windfall profits and surging free cash flow, which the Energy companies are dutifully returning to shareholders. High prices have also created an opening for US Energy producers to restart their Capex to increase production. This positive stance of upstream companies is benefiting the entire supply chain. Energy Equipment and Services providers are enjoying accelerated sales growth as E&P increases Capex. Transportation and storage companies are benefiting from higher volumes. And last, the downstream segment benefits from high-capacity utilization of its refineries and wide crack spreads thanks to low refined oil inventories. We are cyclically positive on the Energy sector, the fundamentals of which are solid, and for which valuations are modest. However, overextended technicals indicate that a near-term correction after a strong run is highly likely. We won’t sell to avoid the pullback but will use it as an opportunity to add to the existing positions. Within the Energy Sector, we are constructive on the upstream and E&S segments, both of which benefit from the high price of oil. We are less keen on the midstream segment, which, despite the benefits of increased production volume, is handicapped by rising labor costs, and expiring transportation contracts. And lastly, we are equal-weight the downstream segment, which, despite rising volumes and wide crack spreads, has razor-thin margins. Integrated Oil is the most diversified segment, which is more resilient during the down leg of the energy cycle, but too tame during the upcycle. Bottom Line We recommend a cyclical overweight to the Energy sector as it is in the early innings of the new energy cycle, thanks to surging demand and constrained production capacity out of the US. It is also the highest yielding sector in the S&P 500. However, a near-term pullback after a strong run is likely – we will leverage it to add to our existing overweight. We also recommend a cyclical overweight of the upstream and Oil Equipment & Services segment, underweight midstream, and equal weight downstream. Irene Tunkel Chief Strategist, US Equity Strategy irene.tunkel@bcaresearch.com Footnotes 1 https://www.eia.gov/outlooks/steo/ Recommended Allocation
Executive Summary While inflation has unquestionably surprised to the upside, the US will not enter a self-reinforcing spiral unless an inflation mindset takes hold throughout the economy. The two leading surveys have wildly different takes on consumer confidence. The available evidence sides with the Conference Board’s robust reading rather than the University of Michigan’s dismal one. We are not concerned about housing’s near-term outlook. There is an undersupply of homes in America and mortgage rates have not backed up enough to put a meaningful dent in demand. Financial markets are jumpy and will likely remain hypersensitive to speculation about the Fed’s policy choices. We nonetheless continue to favor risk assets over the next twelve months and will look out for tactical buying opportunities whenever volatility is on the cusp of easing. Consumers Aren't Chasing High Prices And That's A Good Sign
Consumers Aren't Chasing High Prices And That's A Good Sign
Consumers Aren't Chasing High Prices And That's A Good Sign
Bottom Line: The ride is likely to be bumpy for financial markets this year, but we expect it will ultimately be rewarding. Growth will hold up despite recurring fears. Feature Our recent discussions with colleagues and investors indicate that US financial market participants are preoccupied with one of three issues: a potential inflation breakout, a slowdown induced by a consumption shortfall or, worse yet, both. We add to our thoughts on inflation and consumption after digging into some less-watched series, and check in on the housing market following the surge in mortgage rates. Our conclusion remains unchanged: we still expect potent growth in 2022, and we think investors should maintain at least equal weight exposures to risk assets. Amidst elevated volatility brought on by Fed uncertainty, however, investors should be willing to act more opportunistically. Consumers Are Not Adding Fuel To The Fire … We have spoken repeatedly about the inflation mindset, a concept lifted from Japan’s ongoing experience with chronic stagnation. The malaise ailing Japan is in large part attributable to the deflation mindset that has swept consumers, businesses and investors. Economic participants conditioned to expect continuously falling prices change their behavior to adapt to them, so consumers have put off discretionary purchases, anticipating that goods will be cheaper (and better) next year; businesses confronting steadily falling revenue have shunned investment in favor of shrinking their cost bases to preserve profit; and investors have been willing to funnel capital to the lowest-yielding sovereign bonds in the world, content with meager purchasing power accretions. The central theorem of macroeconomics – my spending is your income and your spending is my income – has sentenced the economy to quietly wither in a self-reinforcing loop. Conversely, we believe an inflation mindset in which economic actors expect continually rising prices is a necessary precondition for an upward inflation spiral. The spiral is stoked by a chain reaction of worker and investor demands for increased compensation, wholesale and retail price hikes, and consumers’ rush to maximize their declining purchasing power by buying ahead of the next inevitable increase. Despite all the inflation agita, Treasury investors are untroubled about its long-run prospects, as their 5-year inflation expectations five years from now remain below the bottom end of the Fed’s target range (Chart 1). The hedgers, speculators and market makers who compose the CPI swaps market are also serene (Chart 2). Though all parties see intense price pressures lasting for another year, they expect them to dissipate over time (Table 1). Chart 1Long-Run Inflation Expectations Are Subdued, ...
Long-Run Inflation Expectations Are Subdued, ...
Long-Run Inflation Expectations Are Subdued, ...
Chart 2... Despite Big Near-Term Swings
It All Depends On Whom You Ask
It All Depends On Whom You Ask
Per the University of Michigan’s sentiment survey, consumers also anticipate that near-term inflation pressures will fade in the intermediate term (Chart 3). They are consequently wary about making large purchases at a price they’ll later come to regret. Viewing today’s high prices as temporary, they think it is a historically inopportune time to buy cars, houses and large household durables. Their responses suggest that the inflation mindset has yet to make any headway with consumers; for now, there is no danger that shoppers harbor inflation fears that could become self-fulfilling. Table 1The Inflations Expectations Curve Is Sharply Inverted
It All Depends On Whom You Ask
It All Depends On Whom You Ask
Chart 3Survey Says: Temporary!
Survey Says: Temporary!
Survey Says: Temporary!
The share of respondents citing sticky/rising prices as a reason for buying cars now is at very low levels (Chart 4, top panel) while those citing high prices as a reason not to buy continues to make record highs (Chart 4, middle panel). The spread between the two has never been wider (Chart 4, bottom panel) – a sizable majority of consumers with discretion over when they buy is committed to waiting out the conditions that have sent prices zooming higher. Chart 4Resisting A Spiral
Resisting A Spiral
Resisting A Spiral
Michigan respondents have been on the right side of chronically deflating new car prices, as those who think prices won’t come down have been nearly continuously outnumbered for the last 40 years (Chart 5, bottom panel). Since vehicle buying conditions became a regular survey component, there have been only three stretches when consumers reported a net urgency to buy, all of which coincided with real increases in new car prices (Chart 5, top panel). The chart is silent on the direction of causality, though we would suspect that consumer urgency follows from observed price increases, which it then amplifies and/or extends. Chart 5Just Say No
Just Say No
Just Say No
The Michigan surveyors also ask consumers about the timeliness of buying houses and major household durables. Charts for houses (not shown) and durables (Chart 6) look much like cars, though the Good-Won’t Come Down/Bad-Prices Are High spread for houses is as persistently negative as it is for cars (ex-the 2012 to 2015 recovery from the aftermath of the housing bust). Consumer demand for the biggest-ticket items is apparently more elastic than it is for major appliances. Chart 6Consumers Aren't Chasing Household Durables Prices Higher,Either
Consumers Aren't Chasing Household Durables Prices Higher,Either
Consumers Aren't Chasing Household Durables Prices Higher,Either
Bottom Line: Consumers are disinclined to go along with surging prices on big-ticket items. An inflationary spiral will not take hold while they are committed to putting off major purchases with the expectation that they will get a better deal in the future. … But Could They Be Losing Their Nerve? Consumers’ discipline has positive inflation implications, but the bombed-out vehicle buying conditions chart in the Executive Summary could be sending a worrisome growth signal. Foregone spending is lost income, and if enough buyers defer purchases, a recession could be just around the bend. True enough, but investors should keep in mind that the buying conditions indexes measure demand urgency, not overall demand. Those with discretion over the timing of their purchases may be holding off, but American consumers are not turning Japanese. Surging home and new and used car prices eloquently testify to fierce competition among buyers. We do not therefore see cause for concern in the diverging consumer confidence surveys. Over time, the indexes produced by the Conference Board and the University of Michigan have tended to send similar messages (Chart 7). The relationship has frayed over the last five years, however, and the two series completely diverged last spring. That would be of no more than passing interest if the composite average of both surveys’ expectations component had not formerly been such a reliable coincident indicator of real consumption growth (Chart 8). Chart 7Parting Company
Parting Company
Parting Company
Chart 8The Confidence-Consumption Link Has Been Severed
The Confidence-Consumption Link Has Been Severed
The Confidence-Consumption Link Has Been Severed
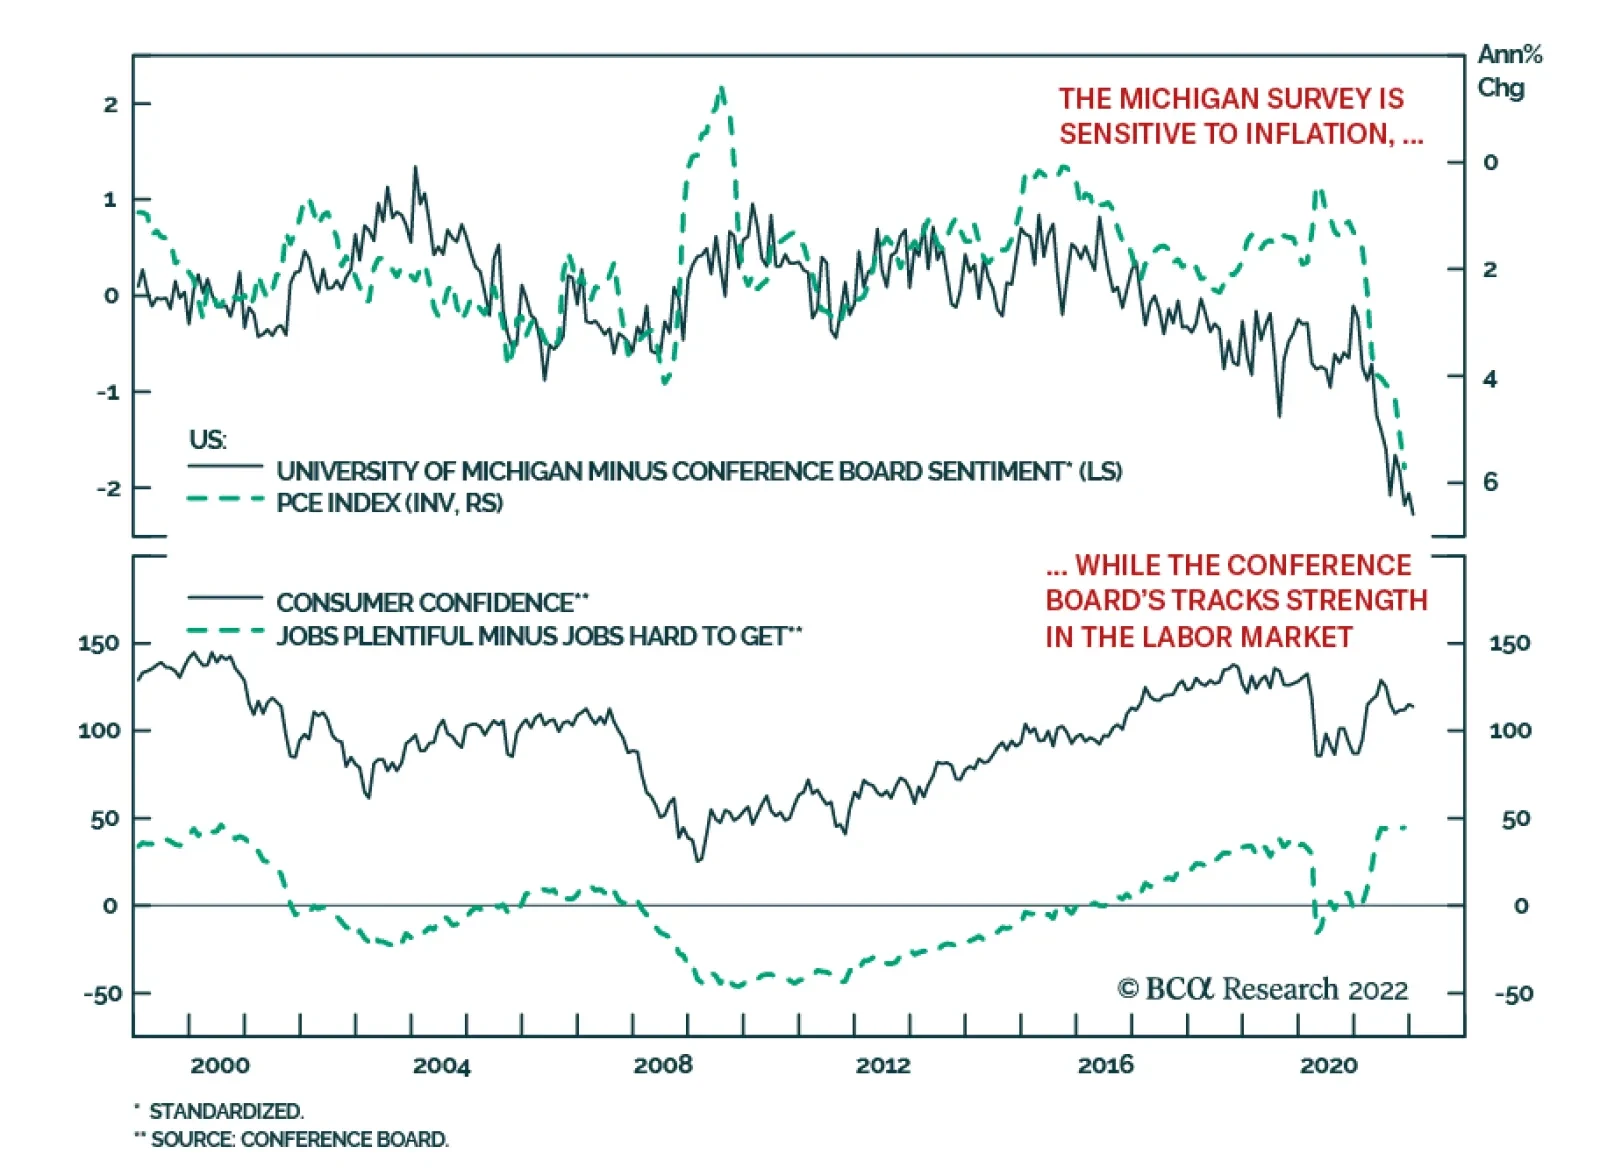
Investors may wonder whether consumption will take its lead from the Conference Board’s cheer or Michigan’s gloom. The Conference Board survey consists of just five questions asking respondents to assess current business and employment conditions and offer their six-month expectations about business conditions, employment conditions and their family’s income. The more extensive Michigan survey runs to twelve full pages, touching on business conditions; personal finances; economic policy; unemployment, interest-rate, inflation and home-price expectations; and buying conditions for homes, household durables and motor vehicles. A layperson reading through the Michigan survey might think it was designed to provoke anxiety in unsuspecting respondents – what are the chances your income will keep pace with inflation, that you or your spouse will involuntarily lose a job over the next five years, that you will have enough money for retirement, etc. – but its readings are not uniformly bleak. Since the financial crisis, it has tended to be cheerier than the Conference Board survey when inflation is low or negative while its relative nosedive has coincided with inflation’s breakout (Chart 9). The relationship would logically follow from the Michigan survey’s explicit focus on inflation and one’s personal relation to it. The Conference Board survey is linked much more closely to perceptions of the job market (Chart 10) and it may therefore be expected to lag during disinflationary/deflationary periods but outperform when inflation accelerates. Chart 9The Michigan Survey Is Sensitive To Inflation, ...
The Michigan Survey Is Sensitive To Inflation, ...
The Michigan Survey Is Sensitive To Inflation, ...
Chart 10... While The Conference Board's Tracks Strength In The Labor Market
... While The Conference Board's Tracks Strength In The Labor Market
... While The Conference Board's Tracks Strength In The Labor Market
Bottom Line: Given the robust growth outlook, we are inclined to side with the Conference Board’s upbeat consumer confidence reading. We do not expect that flush households with pent-up demand will turn into misers. The 2,400-Square-Foot Gorilla Chart 11Level Trumps Direction
Level Trumps Direction
Level Trumps Direction
The sharp backup in mortgage rates so far this year has many observers concerned about the potential consequences of a housing slowdown. A major slump would idle construction workers, pressure housing industry suppliers, and dampen demand for the furnishings and major appliances that fill homes. We think the concerns are overdone and believe that the housing market will be well supported through the rest of the year. Affordability concerns come back to the level-versus-direction debate that has flared ever since real economic growth began to decelerate from its torrid 6.5% pace in the first half of last year. 3% or 4% is nothing to sneeze at for an economy with a long-run trend growth rate of 1.75 – 2%, however. Deceleration from an extremely high level to a very high level still leaves room for ample corporate earnings gains and risk assets duly delivered chunky excess returns across last year’s second half. 30-year fixed mortgage rates have risen 100 basis points from their pandemic low but remain extremely low relative to history (Chart 11, middle panel). As a result, homes remain quite affordable (Chart 11, top panel), despite the relative increase in median home prices (Chart 11, bottom panel). The horizontal line across the affordability series puts its level into a fuller context. Except for a few years in the early seventies, when the median home price was just two-and-a-half times median household income, affordability never exceeded 140 before the global financial crisis ushered in zero interest rate policy. A supply shortfall will bolster the market. Household formations have outstripped housing starts by a wide margin over the last two years (Chart 12, top panel) and available inventory (Chart 12, middle panel) and vacant units (Chart 12, bottom panel) are at all-time lows. Homebuilder sentiment is firing on all cylinders (Chart 13, top panel), as current sales are strong (Chart 13, second panel), buyer traffic remains elevated (Chart 13, third panel) and future sales expectations are rosy (Chart 13, bottom panel). Chart 12There Isn't Enough Supply ...
There Isn't Enough Supply ...
There Isn't Enough Supply ...
Chart 13... And Builders Know It
... And Builders Know It
... And Builders Know It
Bottom Line: Despite the backup in mortgage rates and twelve months of turbo-charged home price appreciation, housing will do just fine this year. A slump weighing on employment and activity is not in store. Investment Implications 2022 has so far been characterized by the serial emergence of issues that have roiled financial markets. Rising rates/falling tech stocks, impending Fed rate hikes, persistent upside inflation surprises and Ukraine have combined to push the VIX into the 20s and 30s, knock the S&P 500 down 9% and drive losses in Treasuries and spread product. We expect that concerns about Fed policy, growth and inflation will linger throughout the year and across the entirety of the Fed’s rate hiking cycle, waxing and waning with the news and data flow. Our base case is that 2022 growth will be quite strong, boosted by avid consumption and investment underpinned by savings and wealth gains, easy monetary conditions, and a tight job market. We expect that stout macro fundamentals will support earnings gains and that a dearth of alternatives to equities that can be expected to generate positive inflation-adjusted returns will keep earnings multiples elevated. If the mildness of Omicron variant infections points to a future in which COVID-19 becomes no more than a nuisance, global growth will get an additional fillip and some supply-chain pressures should ease, allowing inflation to come off the boil. While we reiterate our constructive view on financial markets and the economy, however, we do not expect a smooth ride to our year-end destination. Most investors lack first-hand experience managing against an inflation backdrop that has not been in place since the early ‘80s and volatility will likely be elevated as they find their footing. We are therefore adopting a more tactical perspective, seeking out opportunities to exploit temporary volatility, and we advise that clients consider shortening timeframes and increasing turnover to the extent their individual mandates will allow it. We do not think that the major inflection point marked by a shift from accommodative to restrictive monetary policy settings will arrive until the second half of 2023 at the earliest, but the run-up to it will likely be bumpy. Doug Peta, CFA Chief US Investment Strategist dougp@bcaresearch.com