United States

Executive Summary A Swedish Warning
A Swedish Warning
A Swedish Warning
Stocks are oversold but downside risks persist. The Fed is on the verge of beginning a tightening cycle, which creates a process often linked to deeper and longer equity corrections around the world. Global economic activity is decelerating, as growth transitions away from splurging on consumer goods to a return to trend in the service sector. Equities are more levered to industrial than services activity, which creates a risk window. Ukraine remains another near-term hurdle. Equity risk premia are not elevated enough to compensate for these threats. Despite near-term risks, the equity bull market will recover and Europe stocks will ultimately outperform. Bottom Line: Investors need to continue to hold portfolio hedges as the near-term outlook remains treacherous for equities. Nonetheless, a wholesale portfolio liquidation is unwarranted as we face a mid-cycle slowdown, not a recession. Feature Last week’s pattern of relaxation and renewed tensions in Ukraine is an acute reminder that markets remain fragile in the near-term. Investors must still contend with an imminent monetary tightening cycle in the US. Additionally, a few cracks are emerging on the global growth picture as a transition from spending on goods to services takes place. Under this light, we worry that risk premia remain too low, and that equities are still vulnerable to further near-term pullbacks. The situation is particularly complex for Europe, which is most exposed to the Ukrainian problems and to the global manufacturing cycle. We thus continue to recommend investors exposed to Europe hold protections. Oversold Enough? Many commentators argue that following the January equity sell-off, the mood of investors soured enough to warrant buying equities anew and closing our eyes. Most famously, the AAII Bull/Bear ratio is once again flirting with its 2018 and 2020 lows, two periods that, in hindsight, proved to be selling climaxes (Chart 1). The picture is complex. BCA’s Equity Capitulation Index is indeed becoming oversold (Chart 2). However, its reading is murky. It can either decline further, which would imply greater weaknesses in stocks, or rebound. Our first instinct is to look at the indicator’s behavior at the onset of Fed tightening cycles, which constitute close historical analogues: Chart 2... But Maybe Not Enough
... But Maybe Not Enough
... But Maybe Not Enough
Chart 1Stocks Are Oversold...
Stocks Are Oversold...
Stocks Are Oversold...
In late 2015, when the last Fed tightening cycle began, the Capitulation Index plunged to much lower levels as stocks collapsed. In the background, the global economy was weakened by EM countries hammered by China’s slowdown and balance of payments crises. Around the hiking cycle that begun in June 2004, the Capitulation Index never plunged considerably, but the S&P 500 fell more than 8% between March and August 2004, in a volatile pattern. Back then, both US and global growth was very robust. In 1999, once the Fed resumed hiking rates after the 75bps of cuts following the LTCM debacle, the Capitulation Index and equities were very resilient. This strength persisted until the Nasdaq peaked in March 2000. The S&P 500 formed a complex top between March and August before starting a relentless collapse that September. Following the onset of the 1994-1995 tightening cycle, the Capitulation Index collapsed to much more oversold readings than current ones and equities entered a range-bound volatile episode that lasted until Q1 1995, as the Fed stopped hiking rates. The economy was replete with inflation fears and a mid-cycle slowdown was descending upon the US. The hiking cycle that started in 1988 did not witness significant downside in the Capitulation Index and stocks, but it took place soon after the 1987 crash when equities had become exceptionally oversold. Black Monday itself happened as inflation fear rose as a result of a weak dollar and as the Fed hiked rates through 1987. In 1984, the rate hike cycle was accompanied by a collapse in the Capitulation Index. The tightening in financial conditions caused by the Fed was exacerbated by the surge in the dollar that hurt US profitability and increased EM borrowing costs tremendously. After the 1981 hiking cycle, the Capitulation Index plunged as the US economy entered the second leg of the early 1980s double-dip recession. The latter was an economic crisis prompted by Federal Chairman Paul Volcker’s willingness to put an end to the inflation mentality of the 1970s. These historical experiences highlight one thing: Economic conditions were key to periods when the beginning of a tightening cycle caused a deeper correction in stocks than the one witnessed until now. Economic Clouds Today, the big question shaping the investment world is inflation. BCA expects inflation to peak over the coming months, whether in the US or in Europe. However, this process will take more time. CPI will not crest until after the Fed has begun to hike rates. In the meantime, there are plenty of factors that could easily fan inflation worries and, consequently, a continued upward repricing of the Fed’s interest rate path in the next few weeks. As Arthur Budaghyan highlighted in the most recent Emerging Market Strategy Report, US labor costs are rapidly rising, with the Atlanta Fed Median Wage growth measure up 5.1% annually and the Employment Cost Index (ECI) expanding at a 4.5% annual rate. Of particular worry, this surge in wages does not reflect underlying productivity and unit labor costs, which are up 3.2% annually (Chart 3), their highest rate since 2001, when the Fed funds rate was 4% and 10-year Treasurys yielded 5.4%. Chart 3US Wage-Price Spiral?
US Wage-Price Spiral?
US Wage-Price Spiral?
Elevated unit labor costs are a powerful inducement for inflation and, thus, are likely to continue to fan inflation fears among market participants. Of particular concern today, the rise in unit labor costs is not counterbalanced by a decline in US import prices and foreign deflationary pressures. Inflation fears remain a major risk for the market. As our BCA Monetary Indicator highlights, the liquidity backdrop is not supportive of equities anymore (Chart 4). Moreover, the technical picture is deteriorating, while speculation remains elevated. With investors fretting about the threat of inflation, the danger is that they start to anticipate a greater deterioration in monetary conditions. The problem is not unique to the US. At the global level, 75% of central banks are tightening policy and those that have not yet done so are gearing up to remove monetary accommodation. Adding to inflation fears are signs of a slowdown in the global goods sector. This slowdown reflects a natural transition from the spending binge on goods that took place during the pandemic, which is ebbing, to service spending, which is accelerating (Chart 5). This pattern is particularly evident for US consumers, the largest spenders in the world. Chart 5Transitioning From Goods To Services
Transitioning From Goods To Services
Transitioning From Goods To Services
Chart 4Deteriorating Liquidity Conditions
Deteriorating Liquidity Conditions
Deteriorating Liquidity Conditions
One of the world’s most sensitive economies to the global industrial cycle is already feeling the pinch from this adjustment: Sweden. Swedish economic numbers have been weakening and Swedish assets are particularly soft (Chart 6), which heralds poorly for the global manufacturing sector. This deceleration in goods spending and industrial activity is a problem for equities because stock market profits are more geared toward the evolution of the industrial cycle than the service sector (Chart 7). Chart 6A Swedish Warning
A Swedish Warning
A Swedish Warning
Chart 7Manufacturing, Not Services, Drives Profits
Manufacturing, Not Services, Drives Profits
Manufacturing, Not Services, Drives Profits
Investment Conclusions In this context, it is prudent to maintain hedges to protect stock holdings. It is commonly argued that stocks are expensive, but if one considers the low level of bond yields, these valuations can be justified. Chart 8 challenges this notion. Yes, the earnings yield is still very elevated relative to 30-year Treasury bond yields; however, it is at its lowest in 42 years against core inflation. Why would core inflation be relevant? In a context in which investors are worried about the impact of inflation on both profit margins (higher labor costs) and the direction of policy, they are unlikely to remain unmoved by inflation fears, especially as the perception of higher policy rates may lift rates higher. Moreover, with many investors anxious that the Fed is falling far behind the curve, the marginal market players could easily become the individuals concerned that a catch up by the Fed will lead the economy into a recession. Considering the risks linked to Ukraine, the potentially negative impact on profitability of slowing goods spending, the growing policy uncertainty globally and in the US, and the inversion of many segments of the yield curve, prudence remains appropriate (Chart 9). Chart 8Value Is In The Eye Of The Beholder
Value Is In The Eye Of The Beholder
Value Is In The Eye Of The Beholder
Chart 9Rising Policy Uncertainty
Rising Policy Uncertainty
Rising Policy Uncertainty
Chart 10The Importance Of Manufacturing To Europe
The Importance Of Manufacturing To Europe
The Importance Of Manufacturing To Europe
The problem for European equities is their elevated beta and pro-cyclicality. A pullback in US stocks will automatically drag down European stocks. Moreover, the region’s heavy reliance on manufacturing activity is reflected in the sectoral tilt of European benchmarks. As a result, the performance of European stocks is particularly sensitive to the evolution of the global industrial cycle (Chart 10). Add the fact that European economies are much more exposed to potential energy market disruptions emanating from Ukraine and the recent rebound in Europe’s relative equity performance becomes tenuous at best. Why would these dynamics be temporary and only warrant hedges, not a cyclical underweight in stocks and Europe? First, the inflation fear will recede in the second half of 2022. Our Global Supply Disruption Index has peaked and suggests that inflation surprises will soon ebb. Moreover, a measure of suppliers’ constraints based on the ISM Supplier Delivery Times, Backlog of Orders, Prices Paid, and Inventories is also rolling over (Chart 11). Second, a deepening of the stock market correction will tighten financial conditions and push credit spreads higher. This is a deflationary process that will cause inflation fears to recede and, thus, the pricing of expected Fed rate hikes to lessen. Third, the slowdown in the goods sector is concentrated among consumer goods. Capex will firm up. Capex intentions are elevated in Europe and the US, and global capital goods orders remain robust, despite having decelerated from their extraordinary rebound following the Q1 2020 shutdowns (Chart 12). Moreover, the political and corporate demand to build greater redundancy in global supply chains following the disruptions caused by the Sino-US trade war and COVID-19 will also boost corporate investments for a few more years. This means that many industrial sectors will recover globally and propel industrial equities higher. Chart 11Apex Bottlenecks?
Apex Bottlenecks?
Apex Bottlenecks?
Chart 12Capex Will Stay Strong
Capex Will Stay Strong
Capex Will Stay Strong
Fourth, Matt Gertken, BCA’s geopolitical strategist, continues to see a limited Ukrainian conflict as the most likely outcome of the current tensions. As a result, any dislocation to global stocks and European assets caused by a conflict will be transitory. Finally, the business cycle has further to run. In 1994/95 and in 2015/16, the Fed tightening cycle materialized around the time of a mid-cycle slowdown. The economy recovered and profit firmed up anew, which allowed stocks to rebound. The Fed Funds rate is rising but remains below the neutral rate. Interest rates in Europe also have ample scope to rise before monetary policy becomes tight. Simultaneously, the recovering service sector will continue to support employment and, thus, final demand. Equity bear markets rarely materialize outside of recessions (Chart 13). Chart 13Bear Markets Demand A Recession
Bear Markets Demand A Recession
Bear Markets Demand A Recession
Bottom Line: Global equities are oversold, but the combination of rising inflation, Fed tightening, Ukrainian risks, and a transition from a goods-driven recovery to a service sector-led economy means that stocks risk becoming even more oversold in the near term. European equities are not immune to these threats. While rising rates are a lesser problem for Europe than the US, the developments in Ukraine and a manufacturing transition represent greater hurdles. Ultimately, the difficulties faced by stocks reflect a mid-cycle slowdown taking place alongside a period of policy tightening. It will be, therefore, temporary. Consequently, investors should not abandon stocks, but rather continue to hold protections. Mathieu Savary, Chief European Strategist Mathieu@bcaresearch.com Tactical Recommendations Cyclical Recommendations Structural Recommendations Closed Trades
Executive Summary The Market Thinks The Fed Will Be Unable To Raise Rates Much Above 2%
The Market Thinks The Fed Will Be Unable To Raise Rates Much Above 2%
The Market Thinks The Fed Will Be Unable To Raise Rates Much Above 2%
The Fed tightening cycle is likely to proceed in two stages. In the first stage, which is now well anticipated, the Fed will seek to restore its credibility by raising rates to 2% – the lower bound of what it regards as “neutral” – by early next year. The decline in goods inflation over the next 12 months, facilitated by the easing of supply-chain bottlenecks, will allow the Fed to take a break from tightening for most of 2023. Unfortunately, the respite from rate hikes will not last. The neutral rate of interest is around 3%-to-4%, significantly higher than what either the Fed or investors believe. A wage-price spiral will intensify starting in late 2023, setting the stage for the second, and more painful, round of tightening. Trade Inception Level Initiation Date Stop Loss Long June 2023 3-month SOFR futures contract (SFRM3) / December 2024 (SFRZ4) -8 bps Feb 17/2022 -30 bps New Trade: Go short the December 2024 3-month SOFR futures contract versus the June 2023 contract. Investors expect the fed funds rate to be somewhat higher in mid-2023 than at end-2024. They are wrong about that. Bottom Line: The market has priced in the first stage of the Fed’s tightening cycle, which suggests that bond yields will stabilize over the next few quarters. However, the market has not priced in the second stage. Once it starts to do so, the bull market in equities will end. Investors should remain bullish on stocks for now but look to reduce equity exposure by the middle of 2023. Dear Client, Instead of our regular report next week, we will be sending you a Special Report written by Matt Gertken, BCA Research’s Chief Geopolitical Strategist, discussing Russia’s geopolitical outlook over the long run. I hope you will find it insightful. Best regards, Peter Berezin Chief Global Strategist Who’s the Boss? Who sets interest rates: The economy or the Fed? The answer is both. In the short run, the Fed has complete control over interest rates. In the long run, however, the economy calls the shots. If the Fed sets rates too high, unemployment will rise, forcing the Fed to cut rates. If the Fed sets rates too low, the opposite will happen. Chart 1The Fed's Estimate Of The Neutral Rate Is Still Quite Low By Historical Standards
The Fed's Estimate Of The Neutral Rate Is Still Quite Low By Historical Standards
The Fed's Estimate Of The Neutral Rate Is Still Quite Low By Historical Standards
Thus, over the long haul, it all boils down to where the neutral rate of interest – the interest rate consistent with full employment and stable inflation – happens to be. In the latest Summary of Economic Projections, released on December 15th, 9 out of 17 FOMC participants penciled in 2.5% as their estimate of the appropriate “longer run” level of the federal funds rate. Six participants thought the neutral rate was lower than 2.5%, while two participants thought it was higher (both put down 3%). Back in 2012, when the Fed began publishing its dot plot, the median FOMC participant thought the neutral rate was 4.25%. Investors have revised up their estimate of the neutral rate over the past two months. But at 2.09%, the 5-year/5-year forward bond yield – a widely-used proxy for the neutral rate – is still exceptionally low by historic standards (Chart 1). Desired Savings and Investment Determine the Neutral Rate Chart 2The Savings-Investment Balance Determines The Neutral Rate Of Interest
A Two-Stage Fed Tightening Cycle
A Two-Stage Fed Tightening Cycle
One can think of the neutral rate as the interest rate that equates aggregate demand with aggregate supply at full employment. If interest rates are above neutral, the economy will suffer from inadequate demand; if interest rates are below neutral, the economy will overheat. As Box 1 explains, the difference between aggregate demand and aggregate supply can be expressed as the difference between how much investment an economy needs to undertake and the savings it has at its disposal. Savings can be generated domestically by deferring consumption or imported from abroad via a current account deficit. Anything that reduces savings or raises investment will lead to a higher neutral rate of interest (Chart 2). With this little bit of theory under our belts, let us consider the forces shaping savings and investment in the United States. Desired Savings Are Falling in the US There are at least six reasons to expect desired savings to trend lower in the US over the coming years: Households will spend down their accumulated pandemic savings. US households are sitting on $2.3 trillion (10% of GDP) in excess savings, the result of both decreased spending on services during the pandemic and generous government transfer payments (Chart 3). While some of that money will remain sequestered in bank deposits, much of it will eventually be spent. Household wealth has soared. Personal net worth has risen by 128% of GDP since the start of the pandemic, the largest two-year increase on record (Chart 4). Conservatively assuming that households will spend three cents of every additional dollar in wealth, the resulting wealth effect could boost consumption by 3.8% of GDP. Chart 3Plenty Of Pent-Up Demand
Plenty Of Pent-Up Demand
Plenty Of Pent-Up Demand
Chart 4Net Worth Has Soared
Net Worth Has Soared
Net Worth Has Soared
The household deleveraging cycle is over (Chart 5). Household balance sheets are in good shape. After falling during the initial stages of the pandemic, consumer credit has begun to rebound. Banks are easing lending standards on consumer loans across the board. Corporate profit margins are peaking. As a share of GDP, corporate profits are near record-high levels (Chart 6). Despite a tight labor market, wage growth has failed to keep up with inflation over the past two years. Real wages should recover over time. To the extent that households spend more of their income than businesses, a rising labor share should translate into lower overall savings. Chart 5US Household Deleveraging Pressures Have Abated
US Household Deleveraging Pressures Have Abated
US Household Deleveraging Pressures Have Abated
Chart 6Corporate Profits Are Near Record Highs... But Wage Growth Has Failed To Keep Up
Corporate Profits Are Near Record Highs... But Wage Growth Has Failed To Keep Up
Corporate Profits Are Near Record Highs... But Wage Growth Has Failed To Keep Up
Baby boomers are retiring. Baby boomers are leaving the labor force en masse. They hold over half of US household wealth, considerably more than younger generations (Chart 7). As baby boomers transition from net savers to net dissavers, national savings will decline. Government budget deficits will stay elevated. Fiscal deficits subtract from national savings. While the US budget deficit will come down over the next few years, the IMF estimates that the structural budget deficit will still average 4.9% of GDP between 2022 and 2026 compared to 2.0% of GDP between 2014 and 2019 (Chart 8). Chart 7Baby Boomers Have Amassed A Lot Of Wealth
A Two-Stage Fed Tightening Cycle
A Two-Stage Fed Tightening Cycle
Chart 8Fiscal Policy: Tighter But Not Tight
A Two-Stage Fed Tightening Cycle
A Two-Stage Fed Tightening Cycle
Investment Will Not Decline to Offset the Reduction in Savings A favorite talking point among those who espouse the secular stagnation thesis is that slower trend growth will curb investment demand, leading to an ever-larger savings glut. There are a number of problems with this argument. For one thing, most of the decline in US potential GDP growth has already occurred, implying less need for incremental cuts to investment spending in the future. According to the Congressional Budget Office, real potential GDP growth fell from over 3% in the early 1980s to about 1.9% today, mainly due to slower labor force growth. The CBO expects potential growth to edge down to 1.7% over the next few decades (Chart 9). Moreover, US investment spending has been weaker over the past two decades than one would have expected based on the evolution of trend GDP growth. As a consequence, the average age of both the residential and nonresidential capital stock has risen to the highest level in over 50 years (Chart 10). Chart 9Most Of The Deceleration In US Potential Real GDP Growth Has Already Taken Place
Most Of The Deceleration In US Potential Real GDP Growth Has Already Taken Place
Most Of The Deceleration In US Potential Real GDP Growth Has Already Taken Place
Chart 10The Aging Capital Stock
The Aging Capital Stock
The Aging Capital Stock
As the labor market continues to tighten, firms will devote greater efforts to automating production. Already, core capital goods orders have broken out to the upside (Chart 11). On the housing front, the NAHB reported this week that despite rising mortgage rates, foot traffic and prospective sales remain at exceptionally strong levels (Chart 12). Building permits also surprised on the upside. Chart 11The Outlook For US Capex Is Bright
The Outlook For US Capex Is Bright
The Outlook For US Capex Is Bright
Chart 12Homebuilder Confidence Remains Strong
Homebuilder Confidence Remains Strong
Homebuilder Confidence Remains Strong
Overseas Appetite for US Assets May Wane A larger current account deficit would allow the US to spend more than it earns without the need for higher interest rates to incentivize additional domestic savings. The problem is that the US current account deficit is already quite large, having averaged 3.1% of GDP over the past four quarters. Furthermore, as a result of the accumulation of past current account deficits, external US liabilities now exceed assets by 69% of GDP (Chart 13). It is far from clear that foreigners will want to maintain the current pace of US asset purchases, let alone increase them from current levels. Chart 13The US Has Become Increasingly Indebted To The Rest Of The World
The US Has Become Increasingly Indebted To The Rest Of The World
The US Has Become Increasingly Indebted To The Rest Of The World
The Two-Stage Path to Neutral Chart 14The Market Thinks The Fed Will Be Unable To Raise Rates Much Above 2%
The Market Thinks The Fed Will Be Unable To Raise Rates Much Above 2%
The Market Thinks The Fed Will Be Unable To Raise Rates Much Above 2%
Investors expect the Fed to raise rates seven times by early next year and then stop hiking (and perhaps even start cutting!) in late 2023 and beyond (Chart 14). However, if we are correct that the neutral rate of interest is higher than widely believed, the Fed will eventually need to lift rates to a higher level than what is currently being discounted. It is impossible to be certain what this level is, but a reasonable estimate is somewhere in the range of 3%-to-4%. This is about 100-to-200 basis points above current market pricing. The path to the “new neutral” will not follow a straight line. As we have argued in the past, inflation is likely to evolve in a “two steps up, one step down” fashion. We are presently at the top of those two steps. Inflation will decline over the next 12 months as goods inflation falls sharply and services inflation rises only modestly, before starting to move up again in the second half of 2023. Falling Goods Inflation in 2022 Chart 15Goods Inflation Should Fade
Goods Inflation Should Fade
Goods Inflation Should Fade
Chart 15 shows that the current inflationary episode has been driven by rising goods prices, particularly durable goods. This is highly unusual since goods prices, adjusting for quality improvements, usually trend sideways-to-down over time. As economies continue to reopen, the composition of consumer spending will shift from goods to services. At the same time, supply bottlenecks should abate. The combination of slowing demand and increasing supply will cause goods inflation to tumble. Investors are underestimating the extent to which goods inflation could recede over the remainder of the year as pandemic-related distortions subside. For example, used vehicle prices have jumped by over 50% during the past 18 months (Chart 16). Assuming automobile chip availability improves, we estimate that vehicle-related prices will go from adding 1.6 percentage points to headline inflation at present to subtracting 0.9 points by the end of the year – a swing of 2.5 percentage points (Chart 17). Chart 16AVehicle, Food, And Energy Prices Could All Retreat From Extended Levels (I)
Vehicle, Food, And Energy Prices Could All Retreat From Extended Levels (I)
Vehicle, Food, And Energy Prices Could All Retreat From Extended Levels (I)
Chart 16BVehicle, Food, And Energy Prices Could All Retreat From Extended Levels (II)
Vehicle, Food, And Energy Prices Could All Retreat From Extended Levels (II)
Vehicle, Food, And Energy Prices Could All Retreat From Extended Levels (II)
Chart 17Even If Underlying Core Inflation Does Not Change, Inflation Will Fall This Year As Goods Prices Come Back Down To Earth
A Two-Stage Fed Tightening Cycle
A Two-Stage Fed Tightening Cycle
Along the same lines, we estimate that energy inflation will go from raising inflation by 1.7 points at present to lowering inflation by 0.3 points by the end of the year. This is based on the WTI forward curve, which sees oil prices retreating to $80/bbl by the end of 2022 from $91/bbl today. A normalization in food prices should also help keep a lid on goods inflation. Service Inflation Will Rise Only Modestly in 2022 Could rising service inflation offset the decline in goods inflation this year? It is possible, but we would bet against it. While certain components of the CPI services basket, such as rents, will continue to trend higher, a major increase in service inflation is unlikely unless wages rise more briskly. As Chart 18 underscores, the bulk of recent wage growth has occurred at the bottom end of the income distribution. That is not especially surprising. Whereas employment among medium-and-high wage workers has returned to pre-pandemic levels, employment among low-wage workers is still 6% below where it was in early 2020 (Chart 19). Chart 18The Bulk Of Recent Wage Growth Has Occurred At The Bottom End Of The Income Distribution
The Bulk Of Recent Wage Growth Has Occurred At The Bottom End Of The Income Distribution
The Bulk Of Recent Wage Growth Has Occurred At The Bottom End Of The Income Distribution
Chart 19Employment Among Low-Wage Workers Still Lagging
Employment Among Low-Wage Workers Still Lagging
Employment Among Low-Wage Workers Still Lagging
Chart 20Workers Are Starting To Return To Their Jobs Following The Omicron Wave
Workers Are Starting To Return To Their Jobs Following The Omicron Wave
Workers Are Starting To Return To Their Jobs Following The Omicron Wave
Looking out, labor participation among lower-paid workers will recover now that enhanced unemployment benefits have expired. A decline in the number of life-threatening Covid cases should also help bring back many lower-paid service workers. According to the Census Bureau’s Household Pulse Survey, a record 8.7 million employees were absent from work in the middle of January either because they were sick or looking after someone with Covid symptoms. Consistent with declining case counts, February data show that fewer employees have been absent from work (Chart 20). Predicting Wage-Price Spirals: The Role of Expectations A classic wage-price spiral is one where self-fulfilling expectations of rising prices prompt workers to demand higher wages. Rising wages, in turn, force firms to lift prices in order to protect profit margins, thus validating workers’ expectations of higher prices. For the time being, such a relentless feedback loop has yet to emerge. Market-based measures of long-term inflation expectations have actually fallen since October and remain below the Fed’s comfort zone (Chart 21). Survey-based measures have moved up, but not by much (Chart 22). To the extent that US households are reluctant to buy a new vehicle, it is because they expect prices to decline (Chart 23). Chart 21Market-Based Expectations Remain Below The Fed's Comfort Zone
Market-Based Expectations Remain Below The Fed's Comfort Zone
Market-Based Expectations Remain Below The Fed's Comfort Zone
Chart 22Survey-Based Measures Of Long-Term Inflation Expectations Have Ticked Up, But Not By Much
Survey-Based Measures Of Long-Term Inflation Expectations Have Ticked Up, But Not By Much
Survey-Based Measures Of Long-Term Inflation Expectations Have Ticked Up, But Not By Much
Still, if it turns out that the neutral rate of interest is higher than widely believed, then monetary policy must also be more stimulative than widely believed. This raises the odds that, at some point, the economy will overheat and a wage-price spiral will develop. It is impossible to definitively say when that point will arrive. Inflationary processes tend to be highly non-linear: The labor market can tighten for a long time without this having much impact on inflation, only for inflation to surge once the unemployment rate has fallen below a critical threshold. The Sixties as a Template for Today? The sudden jump in inflation in the 1960s offers an interesting example. The unemployment rate in the US fell to NAIRU in 1962. However, it was not until 1966, when the unemployment rate had already fallen nearly two percentage points below NAIRU, that inflation finally took off. Within the span of ten months, both wage growth and inflation more than doubled. US inflation would end up finishing the decade at 6%, setting the stage for the stagflationary 1970s (Chart 24). Chart 23The Expectation of Lower Prices Is Keeping Many People From Buying A Car
The Expectation of Lower Prices Is Keeping Many People From Buying A Car
The Expectation of Lower Prices Is Keeping Many People From Buying A Car
Chart 24Inflation Started Accelerating Quickly Only When Unemployment Reached Very Low Levels In The 1960s
Inflation Started Accelerating Quickly Only When Unemployment Reached Very Low Levels In The 1960s
Inflation Started Accelerating Quickly Only When Unemployment Reached Very Low Levels In The 1960s
Our guess is that we are closer to 1964 than 1966, implying that the US economy may still need to overheat for another one or two years before a true wage-price spiral emerges. When the second wave of inflation does begin, however, investors will find themselves in a world of pain. Stay overweight stocks for now but look to reduce equity exposure by the middle of next year. This Week’s Trade Idea Given our expectation that inflation will come down sharply in 2022 before beginning to rise again in late 2023 and into 2024, we recommend shorting the December 2024 3-month SOFR futures contract versus the June 2023 contract. Current market pricing provides an attractive entry point for the trade, with the implied interest rate for the June 2023 contract 8 bps higher than that of the December 2024 contract. We expect the interest rate spread to eventually widen substantially in favor of higher rates (lower futures contract prices) in 2024. Box 1The Neutral Rate Through The Lens Of The Savings-Investment Balance
A Two-Stage Fed Tightening Cycle
A Two-Stage Fed Tightening Cycle
Peter Berezin Chief Global Strategist peterb@bcaresearch.com Global Investment Strategy View Matrix
A Two-Stage Fed Tightening Cycle
A Two-Stage Fed Tightening Cycle
Special Trade Recommendations Current MacroQuant Model Scores
A Two-Stage Fed Tightening Cycle
A Two-Stage Fed Tightening Cycle
Executive Summary The ultimate inflation anchor is unit labor costs. If relative price shocks cause employees to demand higher wages from their employers, and if they are granted wage increases above and beyond their productivity advances, inflation will become broad-based and persistent. US unit labor costs have been rising rapidly, which indicates that US inflation is becoming pervasive and entrenched (Chart of the week). The Fed is facing an acute dilemma that it has not encountered in the last 35 years or so: It either needs to slow growth materially to contain inflation or allow inflation to proliferate. The Fed will make a dovish pivot only after financial conditions tighten substantially, i.e., if the S&P 500 falls by 20% or more (from its peak) and credit spreads widen much more from the current levels. Rapid Rises In Unit Labor Costs Entail High Inflation
Rapid Rises In Unit Labor Costs Entail High Inflation
Rapid Rises In Unit Labor Costs Entail High Inflation
Bottom Line: The Fed and equity markets are on a collision course: The Fed will not make a dovish pivot until markets sell off and markets cannot rally unless the Fed backs off. Feature In a report we published a year ago titled Riding A Tiger, we stated that “the enormous size of US stimulus and overflow of liquidity is creating a thrill akin to riding a tiger… Riding a tiger is fun. The hitch is that no one can safely get off a tiger. Similarly, US authorities are currently enjoying the exuberance from stimulus, but they will not be able to safely and smoothly dismount.” We also contended that “in any system where an explosive money/credit boom persists, the outcome will be one or a combination of the following: inflation, asset bubbles or capital misallocation… Odds are that the US will experience asset bubbles and inflation in the real economy.” Riding a tiger was indeed fun but now it is time for US policymakers to dismount. Yet, exiting the era of super easy monetary and fiscal policies will not be without costs and considerable financial market turbulence. Are the Fed and financial markets heading into a collision in the fog of inflation? Transitory Versus Persistent Inflation Chart 1US Inflation Is Broad Based, As Evidenced By Median And Trimmed-Mean CPIs
US Inflation Is Broad Based, As Evidenced By Median And Trimmed-Mean CPIs
US Inflation Is Broad Based, As Evidenced By Median And Trimmed-Mean CPIs
US inflation has become broad-based.1 Not only is core CPI surging but also trimmed-mean, median and sticky core consumer price inflation have risen substantially (Chart 1). Median and trimmed-mean price indexes would not be rocketing if inflation was limited to select goods or services. Particularly, the aforementioned measures exclude components with extreme price changes. What might have started as a narrow-based relative price shock has evolved into broad-based genuine inflation. The key to the transition from one-off inflation spikes to persistent genuine inflation is wages, more specifically unit labor costs. Unit labor cost are calculated as nominal wages divided by productivity (the latter is output per hour per employee). As long as unit labor costs are not rising considerably, sharp price increases in several types of goods do not entail genuine inflation and central banks should not tighten aggressively. However, when unit labor costs are escalating, odds are that higher inflation could become entrenched and persistent. The importance of wages stems from the fact that labor compensation makes up the largest share of costs for the majority of industries. Consequently, rising unit labor costs squeeze profit margins. When this transpires, businesses try to pass on rising costs to customers. Provided that robust wage growth propels consumer demand, companies often succeed in raising their prices. Chart 2US Wages Are Rising Rapidly
US Wages Are Rising Rapidly
US Wages Are Rising Rapidly
In turn, inflation erodes the purchasing power of wages, and employees demand substantial pay raises. When revenues are strong, employers typically accommodate employees’ claims for higher compensation, and a wage-price spiral emerges. These dynamics are presently unfolding in the US. US wage growth has reached multi-decade highs of 4.5-5.5% (Chart 2). Plus, the high and climbing quit rate points to further wage acceleration (Chart 3). As US productivity cannot rise as fast as the current wage growth of 4.5-5.5% (Chart 4), the ratio of wages to productivity (unit labor costs) is escalating. Unit labor costs are rising faster than they have in the past 38-40 years. Historically, an acceleration in unit labor costs has often heralded higher inflation (Chart 5). Chart 3US Wages Will Continue Accelerating
US Wages Will Continue Accelerating
US Wages Will Continue Accelerating
Chart 4Wage Growth Is Outpacing Productivity Gains
Wage Growth Is Outpacing Productivity Gains
Wage Growth Is Outpacing Productivity Gains
Chart 5Rapid Rises In Unit Labor Costs Entail High Inflation
Rapid Rises In Unit Labor Costs Entail High Inflation
Rapid Rises In Unit Labor Costs Entail High Inflation
The only period when US core inflation fell despite rising unit labor costs was during the second half of the 1990s (Chart 5). During this period, EM currency devaluations from China to Mexico and then to Asia unleashed the deflation tsunami in goods prices. US imports prices from Asia collapsed allowing US inflation to drift lower despite rising unit labor costs. The current backdrop is different: US import prices from Asia, including China, are rising (Chart 6). Importantly, US wage growth is presently below headline and core CPI, i.e., real wages are contracting (Chart 7). Provided US employees have experienced a decline in their purchasing power in the past 12 months, they are keen to secure substantial pay raises in the coming months. Chart 6Unlike The Late 1990s, US Import Prices From Asia Are Rising
Unlike The Late 1990s, US Import Prices From Asia Are Rising
Unlike The Late 1990s, US Import Prices From Asia Are Rising
Chart 7US Real Wages Are Shrinking
US Real Wages Are Shrinking
US Real Wages Are Shrinking
Employers facing strong demand cannot afford an employee exodus. Businesses will raise salaries and hike selling prices to preserve their profit margins, thereby giving rise to a wage-price spiral. Bottom Line: The ultimate inflation anchor is unit labor costs. This is why wages, more specifically unit labor costs, are the most important variable to monitor. If relative price shocks lead employees to demand higher wages from their employers, and if they are granted wage increases above and beyond their productivity advances, inflation will become broad-based and persistent. The Fed’s Dilemma When inflation becomes pervasive and entrenched, as it is now in the US, the only way to bring it down is to slow the economy. Unless demand decelerates meaningfully, US inflation will not go away because it has already spilled over into consumer and business expectations. Even though US headline and core CPI will likely drop in the coming months, core inflation will remain well above the Fed’s target of 2% (Chart 1 above). To maintain its credibility, the Fed should hike rates continually despite the potential rollover in headline and core CPI measures. Chart 8High Probability Of US Core Inflation Exceeding 4% In The Next 12 Months
High Probability Of US Core Inflation Exceeding 4% In The Next 12 Months
High Probability Of US Core Inflation Exceeding 4% In The Next 12 Months
My colleague, Jonathan Laberge, Managing Editor of the Bank Credit Analyst, has quantitatively estimated that there is a almost 100% probability that in next 12 months core PCE inflation will be above 3%, and a 70% probability that it will be above 4% (Chart 8). All this means that if the Federal Reserve is serious about bringing core inflation closer to 2%, it will have to slow down the economy meaningfully. In short, the Fed cannot both achieve decent growth and bring inflation down to its 2% target in the next 1-2 years. The Fed seemed omnipotent over the past 35 years because inflation was falling or was very low. That allowed US monetary authorities during financial crises/deflationary shocks to cut rates aggressively and flood the system with liquidity. That playbook worked well in a disinflation context and the US central bank has prevented protracted debt deflation. When inflation – rather than deflation – is the problem, authorities can do little without slowing growth. In short, an inflation redux has made US policymakers’ jobs much more difficult. If the Fed tightens too much, the economy will slump. If policymakers drag their feet and do not raise interest rates rapidly and significantly, inflation will hover well above its target and inflation expectations will escalate with negative ramifications for the economy (more on this below). Bottom Line: The Fed is facing an acute dilemma. The Fed will not publicly acknowledge it, but financial markets are gradually waking up to the new reality that the era of an omnipotent Fed might be over, at least for a period of time. Why Not Allow Inflation To Proliferate? Why should authorities tighten policy and slow growth to reduce inflation? Why can’t the US operate with inflation in a range of 3.5-5%? First, there is no guarantee that core inflation will stabilize at 3.5-5% and not rise further. When higher consumer and business inflation expectations set in, they are not easily dislodged. Second, persistent inflation can damage growth itself. High price volatility increases business uncertainty as producers cannot properly plan their costs and selling prices. Higher uncertainty leads companies to abandon expansion projects and new investments. Consequently, economic growth, employment and ultimately productivity suffer. Lower productivity growth creates fertile ground for inflation to thrive. This can lead to stagflation whereby growth slows but inflation remains high. Finally, from a political perspective, inflation can be more damaging to a government’s popularity than modestly high unemployment. For example, if the unemployment rate is at 6-7%, there would be some unhappy voters, but the majority of the population would be employed and their real purchasing power would be rising. Hence, the majority of voters might be content about the incumbent government’s policies. In an inflation scenario, however, everyone would be unhappy because inflation erodes the purchasing power of household income and wealth. The point is that moderately high unemployment affects a few families who do not have jobs while inflation affects everyone. US politicians and policymakers have forgotten the perils of inflation because rapidly rising prices have not been a problem for decades. Therefore, they have erred on the side of helicopter money assuming that deflationary pressures and higher unemployment are worse than inflation. They have forgotten that inflation is not only worse for the wider population but that it could cause growth to slump resulting in stagflation: a combination of high inflation and high unemployment. Inflation has already become a political problem in the US. With income growth lagging behind inflation, household purchasing power has declined, which has fueled dissatisfaction with the current government. Biden’s popularity has tanked in the past nine months along with the rise of inflation. If inflation is not quelled by this fall, chances are that the Democrats will lose Congress to the Republicans in the midterm elections. Further, if high inflation persists in the next two years, odds of a Republican candidate winning the 2024 presidential elections will be considerable. Recognizing this, the Biden administration will not oppose the Fed’s hawkish policy for now. While we are sympathetic to the view that the Fed will ultimately not raise rates too aggressively, they have no reason not to hike and cannot afford to appear dovish at the current juncture. Even as headline and core inflation measures start falling (which is very likely in the months ahead), the Fed has no excuse to turn dovish. The rationale is that the US core inflation rate, while dropping from 5.5-6%, will still be well above the central bank’s target of 2%. In our opinion, the Fed will make a dovish pivot only after financial conditions tighten substantially, i.e., if the S&P 500 falls by 20% or more (from its peak) and credit spreads widen much more from current levels. Bottom Line: Until panic selling occurs in the equity and credit markets or the economy is materially weaker, the Fed will hike interest rates at every meeting and will start quantitative tightening soon. Thus, US bond yields and the US dollar have more upside for the time being. Overall, the Fed and equity markets are on a collision course: the Fed will not make a dovish pivot until markets sell off and markets cannot rally unless the Fed backs off. Implications For Financial Markets Chart 9Second Half Of The 1960s: The S&P 500 And US Bond Yields Became Negatively Correlated
Second Half Of The 1960s: The S&P 500 And US Bond Yields Became Negatively Correlated
Second Half Of The 1960s: The S&P 500 And US Bond Yields Became Negatively Correlated
As long as the Fed maintains its hawkish bias (which is very likely in the coming months), US bond yields will rise and/or the yield curve will flatten, the greenback will be firm, and stocks will struggle. The current environment will be more reminiscent of what occurred in the late 1960s than any other period of the past 40 years. In the second half of the 1960s, when US core CPI spiked, US share prices became negatively correlated with US bond yields (Chart 9). We discussed this topic at great length in a report from a year ago. Hawkish monetary policy amid the inflation overshoot means that the Fed appears to be credible, and this stance is positive for the US dollar. As soon as the Fed makes a dovish pivot however, the US dollar will tank. The basis is that by turning dovish earlier than warranted, odds are that inflation would remain well above its target, i.e., the Fed would fall behind the inflation curve. When a central bank is behind the inflation curve, the currency depreciates. Our US Equity Capitulation Indicator has fallen quite a bit but has not yet reached its 2018, 2016, 2011 and 2010 lows (Chart 10). We believe the macro backdrop is poor enough to justify a pullback on par with those selloffs (17-20% from the peak). In such an environment, EM stocks will outperform DM only if the US dollar weakens (Chart 11). Chart 10More Downside In The S&P 500?
More Downside in The S&P 500?
More Downside in The S&P 500?
Chart 11EM Relative Equity Performance Moves With The US Dollar
EM Relative Equity Performance Moves With The US Dollar
EM Relative Equity Performance Moves With The US Dollar
Chart 12Will The Current Episode Play Out Like Q4 2018?
Will The Current Episode Play Out Like Q4 2018?
Will The Current Episode Play Out Like Q4 2018?
Alternatively, we might be witnessing a replay of Q4 2018 when the S&P 500 sold off hard led by tech stocks, but having underperformed earlier that year EM outperformed (Chart 12). While such a scenario is quite possible, we need to downgrade our view on the US dollar in order to upgrade EM stocks from underweight. We are not ready to do so because we believe the Fed’s hawkish bias will for now support the greenback. On the whole, we continue to recommend underweight allocations to EM equities and credit markets within their respective global portfolios. Absolute-return investors should stay cautious on EM risk assets. Arthur Budaghyan Chief Emerging Markets Strategist arthurb@bcaresearch.com Footnotes 1 Please note this is the view of Emerging Markets Strategy team and does not reflect the view of other BCA services. Equities Recommendations Currencies, Credit And Fixed-Income Recommendations
Executive Summary Oil-Price Risk Skewed Upward
Scenarios For Oil Prices
Scenarios For Oil Prices
The $10-$15/bbl risk premium in Brent prices will dissipate over the next month. Russia's best outcome is to follow the off-ramp offered by the US. President Biden's call to KSA's King Salman last week will result in higher oil output from the Kingdom, the UAE and Kuwait, in return for deeper US defense commitments. The Biden administration and Iran are in a hurry to get a deal done: The US wants lower oil prices, and Iran needs the revenue. Our Brent forecasts for 2022 and 2023 are revised slightly to $81.50 and $79.75/bbl, respectively, reflecting supply-demand adjustments. Price risks are tilted to the upside: A miss on any of the above assumptions will keep prices above $90/bbl, and push them higher. Bottom Line: Oil demand will remain robust this year and next. To keep prices from surging from current levels into demand-destruction territory, additional supply is needed. Most of this will come from KSA, the UAE and the US shale-oil producers. We expect prices to fall from current prompt levels this year and next. This will support sovereign budgets and oil producers' free cashflow goals. We remain long the XOP ETF. Feature The $10-$15/bbl risk premium in Brent crude oil prices will dissipate, as the following supply-side events are ticked off: 1) Russia gets on the off-ramp offered by the US last week to de-escalate the threat of another invasion of Ukraine by withdrawing its troops from the border;1 2) OPEC 2.0's core producers – the Kingdom of Saudi Arabia (KSA), the United Arab Emirates (UAE), and Kuwait – increase supply in return for deeper US security commitments; 3) Iran restores its remaining 1.0 – 1.2mm b/d of production to the market, following the restoration of its nuclear deal with Western powers; and 4) US shale-oil producers step up production in response to higher WTI prices. Politics, Then Economics The first three assumptions above are political in nature, requiring a bargain be struck among contending interests to resolve. We do not believe Russia's endgame is to jeopardize its future oil and gas exports to the West, particularly to the EU (Chart 1). The US is warning that another invasion of Ukraine will put the use of the Nord Stream 2 pipeline to deliver gas to Germany at risk.2 It also is worthwhile noting NATO is aligned with the US on this stance. Russia derived 40-50% of its budget revenues from oil and gas production, and ~ 67% of its export revenue from oil and gas over the decade ended in 2020.3 Of course, only President Putin can determine whether oil and gas sales can be diversified enough – e.g., via higher shipments to China – to offset whatever penalties the West imposes. But, in a game-theoretic sense, the stakes are very high, and taking the US off-ramp is rational. Chart 1Russia's Critical Exports: Oil + Gas
Lower Oil Prices On The Way
Lower Oil Prices On The Way
We expect the second assumption to play out in the near term, following US President Joe Biden's call to KSA's King Salman last week. The outreach stressed the US commitment to defend KSA and, presumably, its close allies in the Gulf (the UAE and Kuwait).4 KSA already has increased its production to 10.15mm b/d under the OPEC 2.0 agreement to restore 400k b/d beginning in August 2021. We estimate the coalition had fallen behind on this effort by ~ 1mm b/d, as only KSA, the UAE and Kuwait presently have the capacity to lift production and sustain it (Table 1). KSA's reference production level agreed at OPEC 2.0's July 2021 meeting will rise to 11.5mm b/d in June, up 500k b/d from its current level (Table 2). This means KSA could flex into another 850k b/d between now and the end of May; and another 500k b/d after that. The UAE's and Kuwait's reference production levels will rise 330k and 150k b/d in June to 3.5mm b/d and 3.0mm b/d, respectively. Markets will need these incremental volumes as demand continues to recover and non-core OPEC 2.0 production continues to fall (Chart 2). Table 1BCA Global Oil Supply - Demand Balances (MMb/d, Base Case Balances) To Dec23
Lower Oil Prices On The Way
Lower Oil Prices On The Way
Table 2Baseline Increases For Core OPEC 2.0
Lower Oil Prices On The Way
Lower Oil Prices On The Way
Our third assumption reflects our reading of the signaling by Iran over the past few weeks, which indicate growing confidence a deal with the US to restore the Joint Comprehensive Plan of Action (JCPOA) is in the offing.5 The politics here converge with the economics: the Biden Administration wants to increase oil supply ahead of mid-term elections in the US to keep gasoline prices under control; Iran needs to increase its revenues. Both sides get an immediate need satisfied. However, the risks to KSA and its Gulf allies will increase as Iran's revenues grow, because it will be able to fund proxy-war operations against the Gulf states. This is why deepening the US defense commitment to the region is critical to KSA and its allies. The last assumption reflects our view US E+P companies are being incentivized to lift production by high prompt and deferred prices. We continue to expect these companies – particularly those in the US shales, where the majority of the production increase will occur – to husband their capital resources closely, and to continue to prioritize shareholder interests. As capital availability declines – primarily due to reduced investor interest in investing in hydrocarbon production – these firms will have to focus on reducing operating costs and increasing productivity over the next decade to fund growth. Relative to 2021, we expect US oil production to increase 0.85mm b/d this year and by 0.53mm b/d in 2023 relative to this year, as producers respond to higher prices (Chart 3). Chart 2Increased Core OPEC 2.0 Production Becoming Critical
Lower Oil Prices On The Way
Lower Oil Prices On The Way
Chart 3US Oil Production Will See Another Up Leg
US Oil Production Will See Another Up Leg
US Oil Production Will See Another Up Leg
Supply-Demand Balances Are Tight Global oil demand growth this year is reduced slightly in our balances – going to 4.5mm b/d from 4.8mm b/d, mostly reflecting our assessment of slowing growth as central banks remove monetary accommodation. We lifted next year's growth estimate slightly, to 1.7mm b/d. These estimates still leave our growth expectations above the major data providers, the highest of which is OPEC's 4.2mm b/d estimate. We continue to expect DM demand to level off this year and next, and EM demand to retake its position as the global demand growth engine (Chart 4). The supply side remains tight, with average global crude oil and liquid fuels production estimated at 101.5mm b/d for 2022 and 102.8mm b/d for next year. With demand expected to average 101.5mm b/d this year and 103.2mm b/d next year, markets will remain balanced but tight (Chart 5). This means inventories will continue to be strained, leaving little in the way of a cushion to absorb unexpected supply losses (Chart 6). Chart 4EM Demand Retakes Growth-Engine Role
EM Demand Retakes Growth-Engine Role
EM Demand Retakes Growth-Engine Role
Chart 5Markets Remain Balanced But Tight...
Markets Remain Balanced But Tight...
Markets Remain Balanced But Tight...
Chart 6...Keeping Pressure On Inventories
...Keeping Pressure On Inventories
...Keeping Pressure On Inventories
Markets Remain Balanced But Tight Our supply-demand analysis indicates markets will remain balanced but tight, with inventories under pressure until supply increases. This will predispose markets to higher price volatility, as low inventories force prices to ration supply. This will increase the backwardation in the Brent and WTI curves, which will bolster the convenience yield in both of these markets (Chart 7).6 We expect implied volatility to remain elevated, as a result (Chart 8). Chart 7Backwardation Will Keep Convenience Yield Elevated
Lower Oil Prices On The Way
Lower Oil Prices On The Way
Chart 8High Volatility Will Persist
High Volatility Will Persist
High Volatility Will Persist
Because of these low inventory values, Brent prices for 2022 are higher than our previous estimate. By 2023, the effects of increased supply from KSA, UAE, Kuwait – albeit a marginal increase – and the US kick in to reduce prices. As supply increases, the risk premium currently embedded in Brent prices will decline, pushing them to our forecasted levels for 2022 and 2023 of $81.50/bbl and $79.75/bbl, respectively. For 1H22, we expect Brent prices to average $87.20/bbl, and in 2H22 we're forecasting a price of $75.80/bbl on the back of increased production. Next year, higher output will keep prices close to $80/bbl, with 1H23 Brent averaging $79.85 and 2H23 averaging $79.70/bbl. Word Of Caution Our analysis is predicated on strong assumptions regarding the incentives of oil producers taking a rational view of the need for stability and supply in markets. The bottom panel of Chart 9 provides an indication of how tenuous markets are if our assumptions are mistaken, and core OPEC 2.0 does not increase production, Iranian barrels are not returned to the market, or the US shale supply response is less vigorous than we expect. The highest price trajectory occurs when all of our assumptions prove wrong, which takes Brent prices above $140/bbl by the end of 2023. It goes without saying this is non-trivial. But we'll say it anyway: This is non-trivial. We can reasonably expect feedback loops in such a case – e.g., US and Canadian production kicks into high gear, and once-idled North Sea are brought back into service. However, this takes time, and will cause demand destruction on a global scale. Chart 9Scenarios For Oil Prices
Scenarios For Oil Prices
Scenarios For Oil Prices
Investment Implications Oil markets will remain tight and volatile until additional supplies are forthcoming. We are expecting core OPEC 2.0 to lift output by 3.2mm b/d this year, and for the US Lower 48 production to average 9.8mm b/d. The US production increase will be led by higher shale-oil output, which we expect to average 7.4mm b/d this year and 7.8mm b/d in 2023. Given the tight markets we expect, we remain long the XOP ETF, and commodity index exposure in the form of the S&P GSCI and the COMT ETF, an optimized version of the S&P GSCI. Robert P. Ryan Chief Commodity & Energy Strategist rryan@bcaresearch.com Ashwin Shyam Research Associate Commodity & Energy Strategy ashwin.shyam@bcaresearch.com Commodities Round-Up Energy: Bullish Marketed volumes of US natural gas are expected to hit a record high of just under 107 Bcf/d next year as prices stabilize close to $4/MMBtu, in the EIA's latest estimate. This is up from just over 104 Bcf/d of marketed production this year, which itself was a 3 Bcf/d increase over 2021 levels. Almost all of this will come from the Lower 48 (97%). We expect US LNG exports to increase on the back of rising production and further investment in export terminals. Most of this will be shipped to Europe, in our estimation, as EU states seek to diversify LNG sources in the wake of the Russia-Ukraine standoff currently underway. LNG imports accounted for roughly one-fifth of all natural gas supplied to the UK and EU-27 in 2020, according to the EIA, which notes, "Growing volumes of flexible LNG supplies, primarily from the United States, contributed to the notable increases in LNG imports to Europe from 2019 to 2021." Wide price differentials can be expected to support the flow of LNG to Europe from the US (Chart 10). Base Metals: Bullish Iron ore prices took a hit after China’s National Development and Reform Commission (NDRC) stated its intentions to stabilize iron ore markets, crack down on speculation and false price disclosures after prices in 2022 rallied sharply last week. Authorities believe price strength is coming from speculation and hoarding, which is adding to inflationary pressures. However, fundamental factors have been, and likely will keep iron ore prices buoyed. Based on past steel inventory levels and seasonal patterns, steel production will increase and more than double current inventory levels by end-March. Monetary policy easing, and the push by China’s steel industry to become carbon-neutral over the next five years are additional fundamental factors supporting iron ore prices. Precious Metals: Bullish The January print for US CPI jumped 7.5% year-on-year, beating estimates as headline inflation rose to a 40-year high. Markets are expecting around five interest increases this year (Chart 11). BCA’s US Bond Strategy expects rate hikes will be around 100 – 125 bps this year. Gold prices initially fell on the possibility of increasing rate hikes and a hawkish Fed, but in the second half of last week settled at subsequently higher prices on each day. Apart from increased inflation demand, this was likely due to markets’ fear of the possibility of an ultra-hawkish Fed, which could tighten US financial conditions and see a rotation out of US equity markets into safe-haven assets or into other markets ex-US, both of which will be bullish for gold. Chart 10
Lower Oil Prices On The Way
Lower Oil Prices On The Way
Chart 11
US Policy Rate Expectations Going Up
US Policy Rate Expectations Going Up
Footnotes 1 Please see Background Press Call by a Senior Administration Official on the President’s Call with Russian President Vladimir Putin, released by the US White House on February 12, 2022. 2 Please see Long-Term EU Gas Volatility Will Increase, which we published on February 3, 2022 for further discussion. The EU is a huge market for Russia supplies Germany with 65% of its gas. Approximately 78% of total natural gas exports (pipeline + LNG) from Russia went to the EU in 2020. 3 Please see Russia’s Unsustainable Business Model: Going All In on Oil and Gas, published on January 19, 2021 by the Hague Centre for Strategic Studies (HCSS). 4 Please see Readout of President Joseph R. Biden, Jr.’s Call with King Salman bin Abdulaziz Al-Saud of Saudi Arabia, released on February 7, 2022. The readout noted, " issues of mutual concern, including Iranian-enabled attacks by the Houthis against civilian targets in Saudi Arabia." Energy security also was discussed, which we read as code for a deal to increase production in return for a deepening of US defense commitments. This line is followed closely by Gulf media – e.g., It took Biden a year to realize Saudi Arabia’s vital regional role, published by arabnews.com on February 13, 2022, which notes: "If Putin decides to invade Ukraine, the Saudis are the only ones who could help relieve the unsteady oil markets by pumping more crude, being the largest crude exporter in the OPEC oil production group. The White House emphasized that both leaders further reiterated the commitment of the US and Saudi Arabia in ensuring the stability of global energy supplies. 5 Please see Iran 'is in a hurry' to revive nuclear deal if its interests secured -foreign minister, published by reuters.com on February 14, 2022. 6 Please see our November 4, 2021 report entitled Despite Weaker Prices Crude Oil Backwardation Will Persist for additional discussion of convenience yields and volatility. Investment Views and Themes Strategic Recommendations Trades Closed in 2021
Image
Executive Summary The recent 26 percent overspend on durable goods constitutes one of the greatest imbalances in economic history. An overspend on goods is corrected by a subsequent underspend; but an underspend on services is not corrected by a subsequent overspend. This unfortunate asymmetry means that the recent overspend on goods at the expense of services makes the economy vulnerable to a downturn. And the risk is exacerbated by central banks’ intentions to hike rates in response to inflation. As the spending on durable goods wanes, so too will monthly core inflation and the 30-year T-bond yield. As the 30-year T-bond rallies, so too will other long-duration bonds, long-duration stocks, long-duration sectors, and long-duration stock markets such as the S&P 500 versus short-duration stock markets such as the FTSE 100. Fractal trading watchlist: We focus on emerging markets, add financials versus industrials, and review tobacco versus cannabis, CAD/SEK, and biotech. If A 26 Percent Overspend On Goods Is Not A Massive Economic Imbalance, Then What Is?
If A 26 Percent Overspend On Goods Is Not A Massive Economic Imbalance, Then What Is?
If A 26 Percent Overspend On Goods Is Not A Massive Economic Imbalance, Then What Is?
Bottom Line: As the spending on durable goods wanes, so too will monthly core inflation and the 30-year T-bond yield. Go overweight long-duration bonds, long-duration stocks, and long-duration stock markets such as the US versus non-US. Feature My colleague Peter Berezin recently wrote that recessions tend to happen when: “1) the build-up of imbalances makes the economy vulnerable to downturn; 2) a catalyst exposes these imbalances; and 3) amplifiers exacerbate the slump.” Peter is spot on. Using this checklist, I would argue that right now: There is a massive imbalance that makes the economy vulnerable to a downturn. Specifically, a 26 percent overspend on durable goods constitutes one of the greatest imbalances in economic history – the 26 percent overspend on durables refers to the US, but other advanced economies have experienced similar binges on goods. The catalyst that exposes this massive imbalance is the realisation that durables are, well, durable. They last a long time. So, if you front-end loaded many of this year’s purchases into last year, then you will not buy them this year. If you overspent by 26 percent in 2021, then the risk is that you symmetrically underspend by 26 percent in 2022. If central banks hike rates into this demand downturn, they will amplify and exacerbate the slump. A Massive Imbalance In Spending Makes The Economy Vulnerable To A Downturn Much of the recent overspend on goods was spending displaced from the underspend on services which became unavailable in the pandemic – such as eating out, going to the movies, and going to in-person doctor’s appointments. Raising the obvious question, can a future underspend on goods be countered by a future overspend on services? The answer is no. The consumption of services is constrained by time, opportunity, and biology. For example, there is a limit on how often you can eat out, go to the movies, or go to the doctor. If you are used to eating out and going to the movies once a week, and the pandemic prevented you from doing so for a year, that does not mean you will eat out and go to the movies an extra 52 times for the 52 times you missed! Rather, you will quickly revert to your previous pattern of going out once a week. This constraint on services spending means that the underspend will not become a symmetric overspend. In fact, the underspend on certain services will persist. This is because we have made some permanent changes to our lifestyles – for example, hybrid office/home working and more online shopping and online medical care. Additionally, a small but significant minority of people have changed their behaviour, shunning services that require close contact with strangers. To repeat the crucial asymmetry, an overspend on goods is corrected by a subsequent underspend; but an underspend on services is not corrected by a subsequent overspend (Chart I-1 and Chart I-2). Therefore, the recent massive overspend on goods at the expense of services makes the economy vulnerable to a downturn, and the risk is exacerbated by central banks’ intentions to hike rates in response to inflation. These hikes will prove to be overkill, because inflation is set to cool of its own accord. Chart I-1An Overspend On Goods Can Be Corrected By A Subsequent Underspend...
An Overspend On Goods Can Be Corrected By A Subsequent Underspend...
An Overspend On Goods Can Be Corrected By A Subsequent Underspend...
Chart I-2...But An Underspend On Services Cannot Be Corrected By A Subsequent Overspend
...But An Underspend On Services Cannot Be Corrected By A Subsequent Overspend
...But An Underspend On Services Cannot Be Corrected By A Subsequent Overspend
Durables Are Driving Inflation, And Inflation Is Driving The 30-Year T-Bond The recent binge on goods really comprises three mini-binges, which peaked in May 2020, January-March 2021, and October 2021. With a couple of months lag, these three mini-binges have caused three mini-waves in core inflation. To see the cause and effect, it is best to examine the evolution of inflation granularly – on a month-on-month basis – which removes the distorting ‘base effects.’ The mini-binges in goods lifted the core monthly inflation rate to an (annualised) 7 percent in July 2020, 10 percent in April-June 2021, and 7 percent in January 2022 (Chart I-3). Chart I-3Spending On Durables Is Driving Inflation
Spending On Durables Is Driving Inflation
Spending On Durables Is Driving Inflation
Worryingly, the sensitivity of inflation has increased in each new mini-binge in goods spending, possibly reflecting more pressure on already-creaking supply chains as well as more secondary effects. Nevertheless, the key driver of the mini-waves in core inflation is the demand for durables, and as that demand wanes, so will core inflation. As monthly core inflation eases back, so too will the 30-year T-bond yield. What about the 30-year T-bond yield? Although it is a long-duration asset, its yield has recently been tracking the short-term contours of core inflation. So, when monthly inflation reached an (annualised) 10 percent last year, the 30-year T-bond yield reached 2.5 percent. At the more recent 7 percent inflation rate, the yield has reached 2.35 percent. It follows that as monthly core inflation eases back, so too will the 30-year T-bond yield (Chart I-4). Chart I-4Inflation Is Driving The 30-Year T-Bond
Inflation Is Driving The 30-Year T-Bond
Inflation Is Driving The 30-Year T-Bond
Get The 30-Year T-Bond Right, And You’ll Get Most Things Right For the past year, the story of stocks has been the story of bonds. Or to be more precise, the story of long-duration stocks has been the story of the 30-year T-bond. Through this period, the worry du jour has changed – from the Omicron mutation of SARS-CoV-2 to an Evergrande default to Facebook subscriber losses and now to Russia/Ukraine tensions. Yet the overarching story through all of this is that the long-duration Nasdaq index has tracked the 30-year T-bond price one-for-one (Chart I-5). And the connection between S&P 500 and the 30-year T-bond price is almost as good (Chart I-6). Chart I-5Get The 30-Year T-Bond Right, And You'll Get The Nasdaq Right
Get The 30-Year T-Bond Right, And You'll Get The Nasdaq Right
Get The 30-Year T-Bond Right, And You'll Get The Nasdaq Right
Chart I-6Get The 30-Year T-Bond Right, And You'll Get The S&P 500 Right
Get The 30-Year T-Bond Right, And You'll Get The S&P 500 Right
Get The 30-Year T-Bond Right, And You'll Get The S&P 500 Right
The tight short-term connection between long-duration stocks and the 30-year T-bond makes perfect sense. The cashflows of any investment can be simplified into a ‘lump-sum’ payment in the future, and the ‘present value’ of this payment will move in line with the present value of an equal-duration bond. So, all else being equal, a long-duration stock will move one-for-one in line with a long-duration bond. The story of long-duration stocks has been the story of the 30-year T-bond. ‘Value’ stocks and non-US stock markets which are over-weighted to value have a shorter-duration. Therefore, they have a much weaker connection with the 30-year T-bond. It follows that if you get the 30-year T-bond right, you’ll get most things right: The performance of other long-duration bonds (Chart I-7). The performance of long-duration growth stocks (Chart I-8). The performance of ‘growth’ versus ‘value’ (Chart I-9). The performance of growth-heavy stock markets like the S&P 500 versus value-heavy stock markets like the FTSE100 (Chart I-10). Of course, the corollary is that if you get the 30-year T-bond wrong, you’ll get most things wrong. Observe that the 1-year charts of long-duration bonds, growth stocks, growth versus value, and S&P 500 versus FTSE100 are indistinguishable. Proving once again that investment is complex, but it is not complicated! Chart I-7Get The 30-Year T-Bond Right, And You'll Get The 30-Year German Bund Right
Get The 30-Year T-Bond Right, And You'll Get The 30-Year German Bund Right
Get The 30-Year T-Bond Right, And You'll Get The 30-Year German Bund Right
Chart I-8Get The 30-Year T-Bond Right, And You'll Get Growth Stocks Right
Get The 30-Year T-Bond Right, And You'll Get Growth Stocks Right
Get The 30-Year T-Bond Right, And You'll Get Growth Stocks Right
Chart I-9Get The 30-Year T-Bond Right, And You'll Get Growth Versus Value Right
Get The 30-Year T-Bond Right, And You'll Get Growth Versus Value Right
Get The 30-Year T-Bond Right, And You'll Get Growth Versus Value Right
Chart I-10Get The 30-Year T-Bond Right, And You'll Get S&P 500 Versus FTSE100 Right
Get The 30-Year T-Bond Right, And You'll Get S&P 500 Versus FTSE100 Right
Get The 30-Year T-Bond Right, And You'll Get S&P 500 Versus FTSE100 Right
Our expectation is that as the spending on durable goods wanes, so too will monthly core inflation and the 30-year T-bond yield. Go overweight long-duration bonds, long-duration stocks, long-duration sectors, and long-duration stock markets such as the US versus non-US. Fractal Trading Watchlist This week we focus on emerging markets, add financials versus industrials, and review tobacco versus cannabis, CAD/SEK, and biotech. Emerging markets (EM) have been a big underperformer through the past year, but it may be time to dip in again, at least relative to value-heavy developed market (DM) indexes. Specifically, MSCI Emerging Markets versus MSCI UK has reached the point of fractal fragility that signalled previous major turning-points in 2014, 2018, and 2020 (Chart I-11). Accordingly, this week’s recommended trade is to go long MSCI EM versus UK (dollar indexes), setting the profit-target and symmetrical stop-loss at 10 percent. Chart I-11Time To Dip Into EM Again, Selectively
Time To Dip Into EM Again, Selectively
Time To Dip Into EM Again, Selectively
Financials Versus Industrials Is Approaching A Turning-Point
Financials Versus Industrials Is Approaching A Turning-Point
Financials Versus Industrials Is Approaching A Turning-Point
Image
CAD/SEK At A Top
CAD/SEK At A Top
CAD/SEK At A Top
Awaiting A Major Entry-Point Into Biotech
Awaiting A Major Entry-Point Into Biotech
Awaiting A Major Entry-Point Into Biotech
Dhaval Joshi Chief Strategist dhaval@bcaresearch.com Fractal Trading System
A Massive Economic Imbalance, Staring Us In The Face
A Massive Economic Imbalance, Staring Us In The Face
A Massive Economic Imbalance, Staring Us In The Face
A Massive Economic Imbalance, Staring Us In The Face
6-Month Recommendations Structural Recommendations Closed Fractal Trades Indicators To Watch - Bond Yields Indicators To Watch - Bond Yields - Euro Area
Indicators To Watch - Bond Yields - Euro Area
Indicators To Watch - Bond Yields - Euro Area
Indicators To Watch - Bond Yields - Europe Ex Euro Area
Indicators To Watch - Bond Yields - Europe Ex Euro Area
Indicators To Watch - Bond Yields - Europe Ex Euro Area
Indicators To Watch - Bond Yields - Asia
Indicators To Watch - Bond Yields - Asia
Indicators To Watch - Bond Yields - Asia
Indicators To Watch - Bond Yields - Other Developed
Indicators To Watch - Bond Yields - Other Developed
Indicators To Watch - Bond Yields - Other Developed
Indicators To Watch - Interest Rate Expectations Indicators To Watch - Interest Rate Expectations I
Indicators To Watch - Interest Rate Expectations
Indicators To Watch - Interest Rate Expectations
Image
Indicators To Watch - Interest Rate Expectations III
A Massive Economic Imbalance, Staring Us In The Face
A Massive Economic Imbalance, Staring Us In The Face
Image
Executive Summary Foreign And Domestic Politics Won't Stop The Fed
Foreign And Domestic Politics Won't Stop The Fed
Foreign And Domestic Politics Won't Stop The Fed
Investors woke up to the Ukraine risk this week. It is not yet resolved. Stay defensive. Market reactions to Ukraine suggest investors will favor defensive sectors and growth stocks in the short term, with the notable exception of the energy sector. External risks will not dissuade the Fed from hiking rates in the face of 6% core inflation. Later the Fed might adjust to foreign crises but the stock market faces more downside in the interim. Polarization is reviving ahead of the midterm elections, which will usher in gridlock. Gridlock is disinflationary, reinforcing a tactically defensive market positioning despite our cyclical House View. Bottom Line: Biden’s external risks are not yet subsiding. The Fed will hike rates even in the face of external supply shocks. Stay tactically defensive. Feature Our three key views for the year are: gridlock, executive power, and foreign policy. First, Congress will become gridlocked even prior to the midterm elections. Second, President Biden will have to shift to executive power to achieve policy objectives. Third, Biden’s focus will be forced to engage in foreign policy more than he would prefer due to rising external risks. The Ukraine crisis – covered extensively in our Geopolitical Strategy – is the most pressing external risk but it is not the only one that we think will trouble markets this year. We expect politically induced volatility to persist all year. The cyclical investment view should be driven by the underlying macroeconomic reality. But that macro reality will change if external risks materialize and cause greater supply disruptions or if they alter the US midterm election outlook. We maintain our tactically defensive positioning for now. Mr. Market Wakes Up To Ukraine Risk The reason for the crisis is the historic Russian military buildup on all sides of Ukraine, in the face of US defense cooperation with Ukraine, not the “hysterical” American propaganda over the risk of war. When and if Russian forces withdraw, the crisis will melt away. But for now, Russia’s reported withdrawal of some troops is contradicted by movements of other troops as well as the fact that the Russian navy has effectively blocked off the Black Sea. Investors must judge by capabilities, not intentions, and Russia still has the capability to stage a limited attack at present so investors should maintain a defensive or cautious approach. In this context investors are rightly bidding up the US dollar and bidding down US equities in absolute terms (albeit not relative to European equities). Bond yields have not responded much to the external risk due to the high rate of inflation, which is pushing yields up (Chart 1). If Russia re-invades, stocks and bond yields will fall at least temporarily and the dollar will rise higher. When Russia initially invaded Ukraine eight years ago, in February 2014, the US stock-to-bond ratio moved sideways for several months but cyclicals outperformed defensives. Energy stocks rallied, until the oil crash in summer 2014. Small caps underperformed large caps, yet value outperformed growth stocks (Chart 2). Small caps likely suffered from risk-off sentiment and expectations of a drag on global growth, while value benefited from gently rising interest rates at that time. Chart 1Ukraine Crisis Escalates
Ukraine Crisis Escalates
Ukraine Crisis Escalates
Chart 2Market Response To Crimea Invasion, 2014
Market Response To Crimea Invasion, 2014
Market Response To Crimea Invasion, 2014
Comparing the situation today, the difference is that cyclicals are trailing defensives and small caps are trailing large caps even more than they were in 2014. Yet value stocks have performed far better against growth now than then, in accordance with higher inflation and bond yields (Chart 3). Further escalation of the Ukraine crisis should drive investors to favor defensives, large caps, and growth stocks on a tactical time frame, even though this decision runs against our BCA House View on a cyclical time frame. The past week’s market moves reinforce the 2014 experience in general, with the stock-to-bond ratio faltering and cyclicals falling back (Chart 4). Small caps and value have benefited but these charts suggest that a negative hit to global growth will hurt small caps, while value is overextended relative to growth in the short term. The market only really began to discount the risk of a new war in Europe this past week, specifically on Friday, February 11 and Monday, February 14. Chart 3Market Response 2022 Versus 2014
Market Response 2022 Versus 2014
Market Response 2022 Versus 2014
Chart 4US Equities Just Woke Up To Ukraine
US Equities Just Woke Up To Ukraine
US Equities Just Woke Up To Ukraine
There is not yet a solid diplomatic solution as we go to press on Tuesday, February 15, but some positive signs are fueling a rebound in risk assets. Fade these improvements in risk appetite until Russia makes its decision on whether to use military force and, if so, until Europe makes its decision on whether to impose crippling sanctions. Bottom Line: Tactically stay long growth stocks versus value, but prepare to switch back to overweighting value if the Ukraine crisis abates. The Energy Sector Response To Ukraine So Far Commodity prices and the energy sector are naturally benefitting from rising supply risks. But there is a risk that they will suffer later if a war breaks out and generates a supply shock and energy price shock that weigh on European and global growth. Russia will likely maintain energy production to help pay for its military adventures. The Saudis could increase production to prevent demand destruction. It is also possible that a US-Iran nuclear deal could release Iranian oil to the market. The global economy can handle gradually rising energy prices but maybe not a sharp supply shock. Oil prices are rising on signs of escalating tensions and energy sector equities are generally outperforming the broad market and other cyclical sectors. Domestically oriented small cap energy stocks are rising relative to large caps, suggesting that the market does not believe that global growth will suffer greatly from any conflict. Apparently investors do believe that US energy companies will benefit from shipping more fossil fuels abroad (Chart 5). Bottom Line: Cyclically stay long small cap energy stocks versus their large cap brethren. Chart 5US Energy Sector Just Woke Up To Ukraine
US Energy Sector Just Woke Up To Ukraine
US Energy Sector Just Woke Up To Ukraine
Peak-To-Trough Drawdowns Amid Geopolitical Crises The peak-to-trough equity drawdown amid major geopolitical crises ranges from 11%-15%, depending on the magnitude and nature of the crisis (Chart 6). In this case, the US will not be directly involved in any war in Ukraine, but US NATO allies will be right next door and providing aid to Ukraine. For “limited incursion” scenarios we looked at over a dozen crises, from the Berlin Blockade of 1949 to the Russian invasion of Crimea in 2014. The peak-to-trough drawdown averages 10%. For an unlimited or “full-scale” invasion, we looked at the S&P500 reaction to major invasions at the dawn of World War II as well as significant wars in the twentieth century, down to the US invasion of Iraq and NATO’s intervention in Libya in 2011. The peak-to-trough equity drawdown averaged 13%. Chart 6Range Of US Equity Peak-To-Trough Drawdowns Amid Geopolitical Crisis
Biden, The Fed, And External Risks
Biden, The Fed, And External Risks
Given that the S&P500 has fallen by 8% since its peak on January 3, 2022, investors should be prepared for more downside. Health care stocks and consumer staples are outperforming the broad market this year so far, though they are underperforming energy where the supply squeeze is happening (Chart 7). The magnitude of war and sanctions will determine whether energy ultimately falls in expectation of demand destruction. Bottom Line: It is too soon to buy the dip in the S&P 500. Stay long health stocks relative to the broad market. Chart 7Health Care And Consumer Staples
Health Care And Consumer Staples
Health Care And Consumer Staples
Will The Fed Respond To External Risks? No. Over the past year, we have argued with investors who tried to differentiate the current bout of inflation from the inflation of the 1970s by arguing that there is no energy supply shock. We argued that an energy shock could transpire by pointing to external risks such as Russia and Iran. While the Biden administration will likely prove risk-averse, for fear that higher prices at the pump will weigh on the Democratic Party in the midterm elections, what about the Federal Reserve? During the Arab oil embargo of late 1973, and the Iranian revolution of 1979, the Federal Reserve continued to hike interest rates, responding to domestic inflation and rising bond yields. Foreign supply shocks threatened to push up inflation, so the Fed was not deterred from hiking rates (Chart 8). When the US itself engages in war, the Fed might react differently (Chart 9). Chart 8The Fed Responds to Oil Shocks by Hiking Rates But...
The Fed Responds to Oil Shocks by Hiking Rates But...
The Fed Responds to Oil Shocks by Hiking Rates But...
Chart 9... US At War Could Trigger Looser Monetary Policy
... US At War Could Trigger Looser Monetary Policy
... US At War Could Trigger Looser Monetary Policy
In 1990, the Fed cut the policy rate once after the US entered the Iraq war, then kept rates flat for a few months before cutting more at the end of the year. Bond yields were falling due to recession. In 2001, the Fed was already cutting rates due to the business cycle and the September 11 terrorist attacks reinforced that process. In 2003, the Fed cut rates after the beginning of the Iraq war and did not start hiking rates until mid-2004 when the initial phase of the war ended. The implication is that Fed Chair Alan Greenspan accommodated both the war and the 2004 presidential election. Most external risks will not prevent the Fed from hiking rates, especially during an inflation bout when the nature of the external risk may be an energy supply disruption that pushes up prices. However, while we do not doubt that the Fed could hike by 50bps in March, we doubt that the consensus of 175bps in hikes in 2022 will pan out. The combination of initial hikes, fiscal drag, and foreign growth shocks would temper the Fed’s enthusiasm. Bottom Line: Stocks face more downside risk in this environment. Bipartisanship And The Return Of Gridlock Polarization and partisanship are recovering. The Philadelphia Fed “Partisan Conflict Index” is now only 0.6% below its 2020 peaks as the midterm election approaches (Chart 10). Interestingly, one of our key views from last year – bipartisan reform – is still taking place beneath the surface. Our 2022 view of gridlock has not yet fully set in. Congress is stealthily cooperating on fiscal spending, the US Postal Service, women’s issues, public servants’ stock trading, and an attempt to revise the Electoral Count Act. Congress is also passing a bipartisan bill to make the US more economically competitive with China and impose sanctions against Russia. Chart 10Foreign And Domestic Politics Won't Stop The Fed
Foreign And Domestic Politics Won't Stop The Fed
Foreign And Domestic Politics Won't Stop The Fed
The only area where bipartisanship is not happening is Biden’s “Build Back Better” reconciliation bill, which even lacks sufficient support from moderate Democratic senators due to high inflation. Passage is still possible in a partisan, watered-down, and deficit-neutral form. These developments show that Republican lawmakers are demonstrating some pragmatic governing ability and will use their voting records to make a case in the midterms, while pinning the blame for inflation, crime, immigration, and any foreign crises on Democrats. As such they reinforce the market consensus that Republicans are likely to take back Congress this fall. Thus while last year’s bipartisanship is spilling into the current legislative session, gridlock is rapidly approaching. When investors look to the second half of the year and beyond, they should expect to see legislative cooperation dry up, especially if Republicans only take the House and not the Senate. Bottom Line: Gridlock will freeze fiscal policy, which is non-inflationary or disinflationary for 2022-24. As such the midterm election is not fully priced. Midterm dynamics will support an overweight or at least neutral stance toward defensives and growth stocks. Investment Takeaways Tactically stay long defensives, notably health care, and growth stocks. Cyclically remain invested in the bull market – and stay long energy small caps. The chief risks to these views would be a speedy diplomatic resolution to the Ukraine and Iran conflicts or a dramatic revival of the Democratic Party’s popular support ahead of the midterm election. Diplomacy would remove risks to global growth, whereas a Democratic comeback would boost inflation expectations. Matt Gertken Senior Vice President Chief US Political Strategist mattg@bcaresearch.com Jesse Anak Kuri Associate Editor jesse.kuri@bcaresearch.com Strategic View Open Tactical Positions (0-6 Months) Open Cyclical Recommendations (6-18 Months) Table A2Political Risk Matrix
Biden, The Fed, And External Risks
Biden, The Fed, And External Risks
Table A3US Political Capital Index
Biden, The Fed, And External Risks
Biden, The Fed, And External Risks
Chart A1Presidential Election Model
Biden’s Floor, Republican Cracks
Biden’s Floor, Republican Cracks
Chart A2Senate Election Model
Biden’s Floor, Republican Cracks
Biden’s Floor, Republican Cracks
Table A4APolitical Capital: White House And Congress
Biden, The Fed, And External Risks
Biden, The Fed, And External Risks
Table A4BPolitical Capital: Household And Business Sentiment
Biden, The Fed, And External Risks
Biden, The Fed, And External Risks
Table A4CPolitical Capital: The Economy And Markets
Biden, The Fed, And External Risks
Biden, The Fed, And External Risks
Footnotes
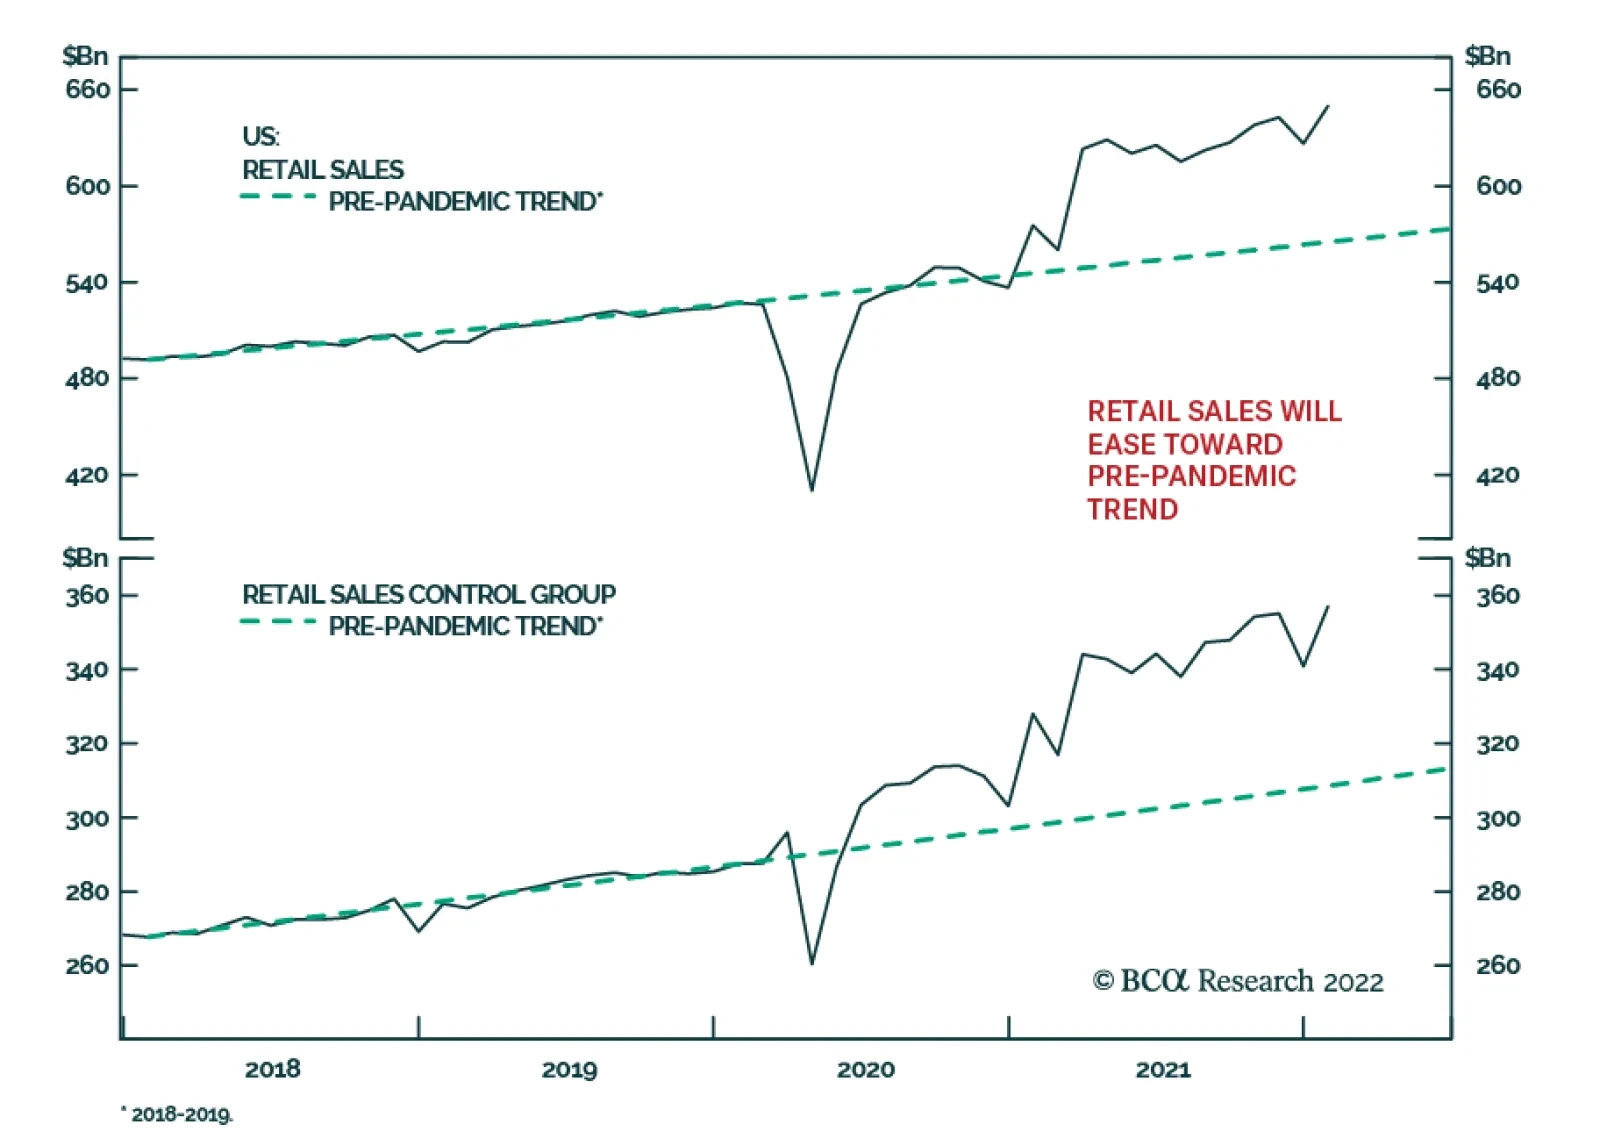
US retail sales jumped 3.8% m/m in January, easily beating expectations of a more muted 2.0% m/m increase. The retail sales control group jumped by 4.8% m/m versus expectations of a 1.3% m/m increase. However, the release also includes a relatively large…
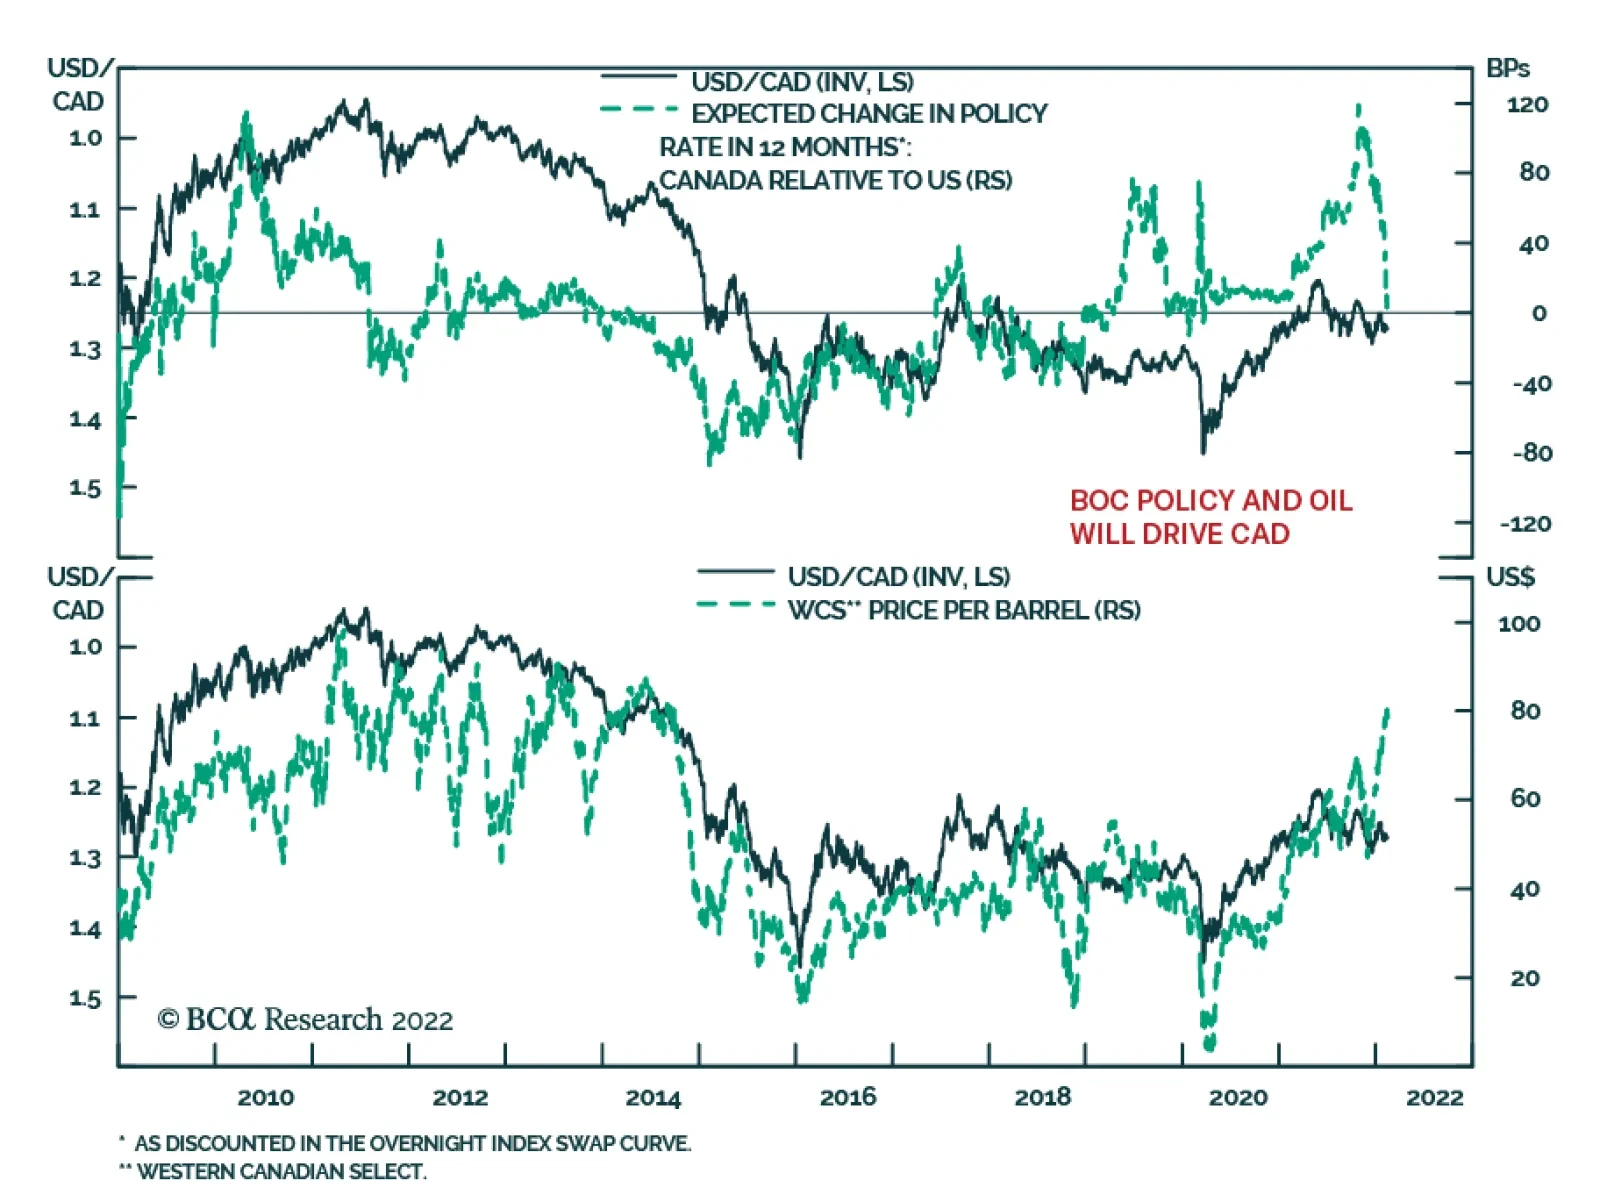
Canada’s CPI inflation rate increased in January, reinforcing the case for the Bank of Canada to start hiking interest rates at its March 2 meeting. Headline CPI inflation rose to 5.1% y/y from 4.8%, while the three core inflation measures all accelerated and…
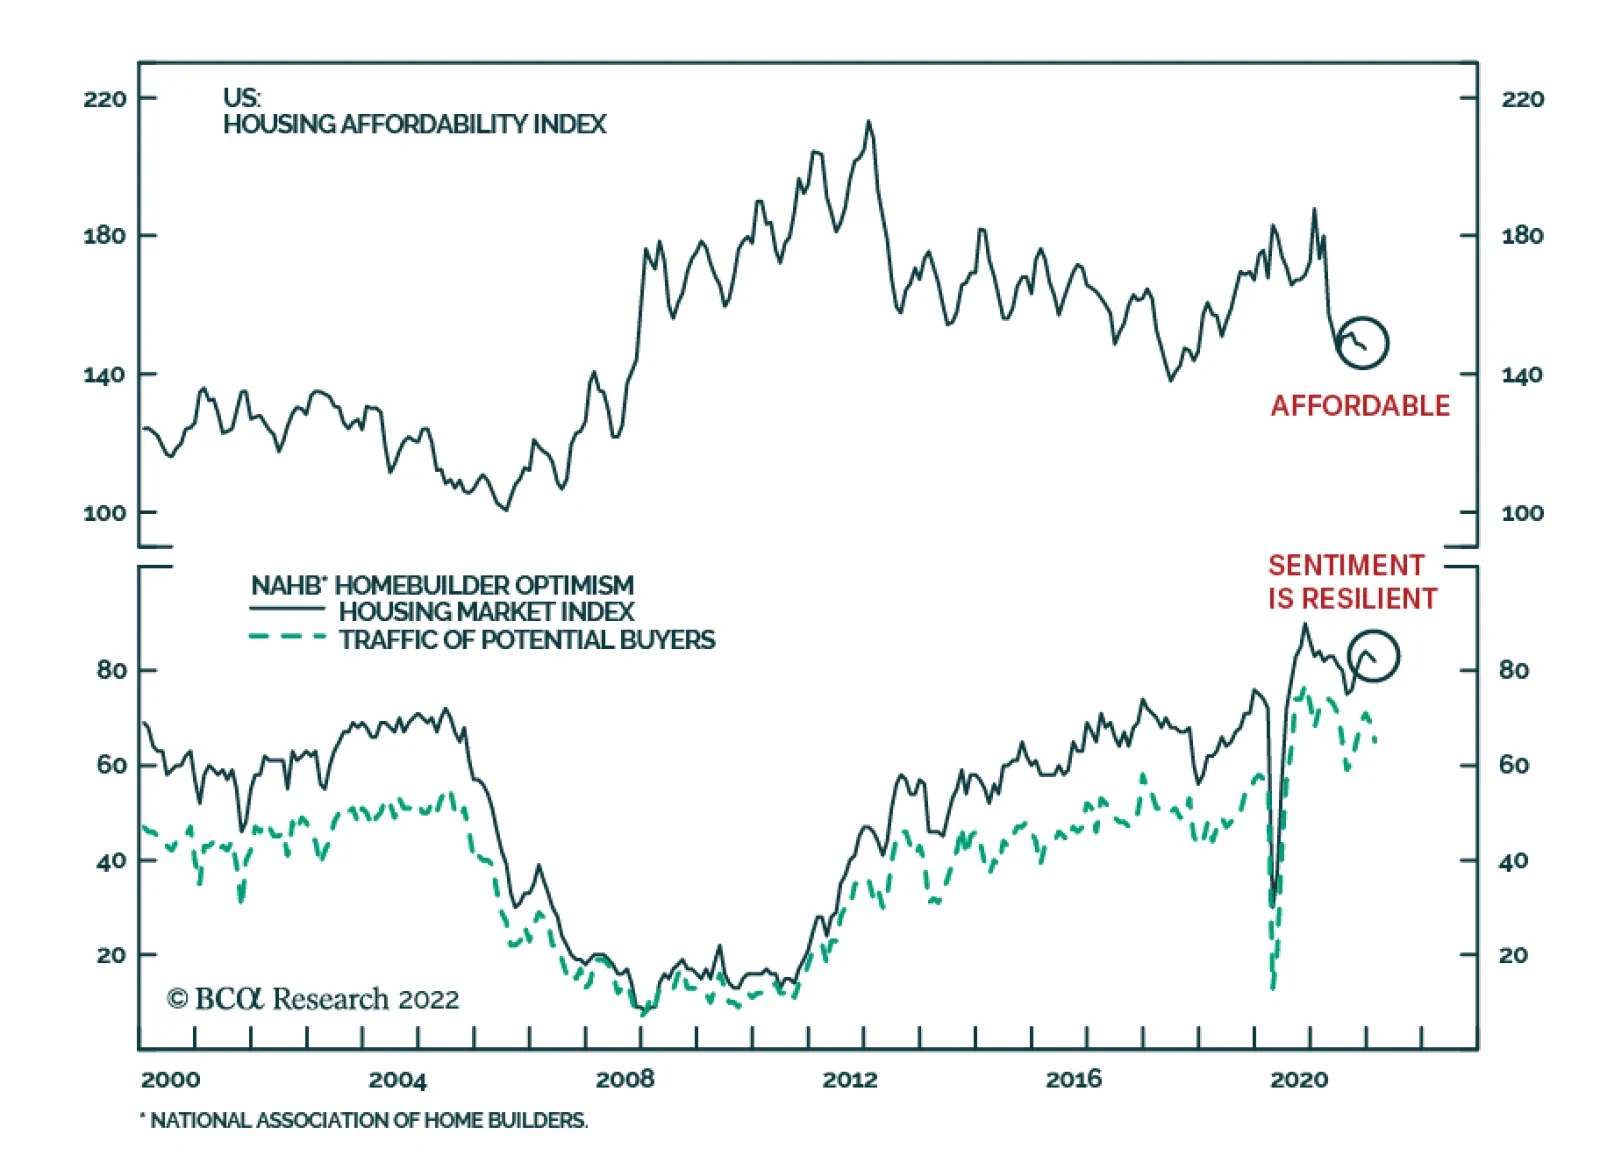
The NAHB housing market index reveals that despite rising mortgage rates, the US housing market is resilient. Homebuilder sentiment ticked down from 83 to 82 in February, but ultimately remains well supported. Present single family home sales firmed while…
Chart 1
Chart 1
Chart 1
Today, we are downgrading the overall Consumer Discretionary index to underweight by reducing our allocation in two key industry groups: Retailing and Consumer Durables & Apparel. We remain constructive on Consumer Services, i.e., the Travel Complex (Hotels & Cruises, Restaurants, and Airlines). Consumer spending is shifting from goods to services, for which there is still strong pent-up demand (Chart 1). While consumers still sit on $2.2 trillion in excess savings, their sentiment is in a downward trend. High inflation and negative real wage growth are cutting into middle-class Americans’ disposable income: For many high costs of food and gas crowd out discretionary spending. Empirical analysis supports our reasoning. Performance of the S&P Retailing and the S&P Consumer Durables & Apparel industry groups has been strongly inversely correlated with consumer sentiment and inflation (Charts 2 and 3). With inflation high and intransigent, stimulus checks in a rear-view window, and consumers worried about their finances, these industries have been underperforming, and will continue doing so. Chart 2
Chart 2
Chart 2
Chart 3
Chart 3
Chart 3
Even if inflation abates, thanks to unclogging of supply chain bottlenecks and tighter monetary policy, we will need to see an inflection in consumer sentiment and positive real wage growth to change our stance. Bottom Line: We downgrade the S&P Retailing and the S&P Consumer Durables & Apparel indexes to below benchmark. Those downgrades also push the overall S&P Consumer Discretionary into an underweight basket. Appendix Table 1
Inflation Bites Discretionary Spending
Inflation Bites Discretionary Spending
Table 2
Inflation Bites Discretionary Spending
Inflation Bites Discretionary Spending