United States
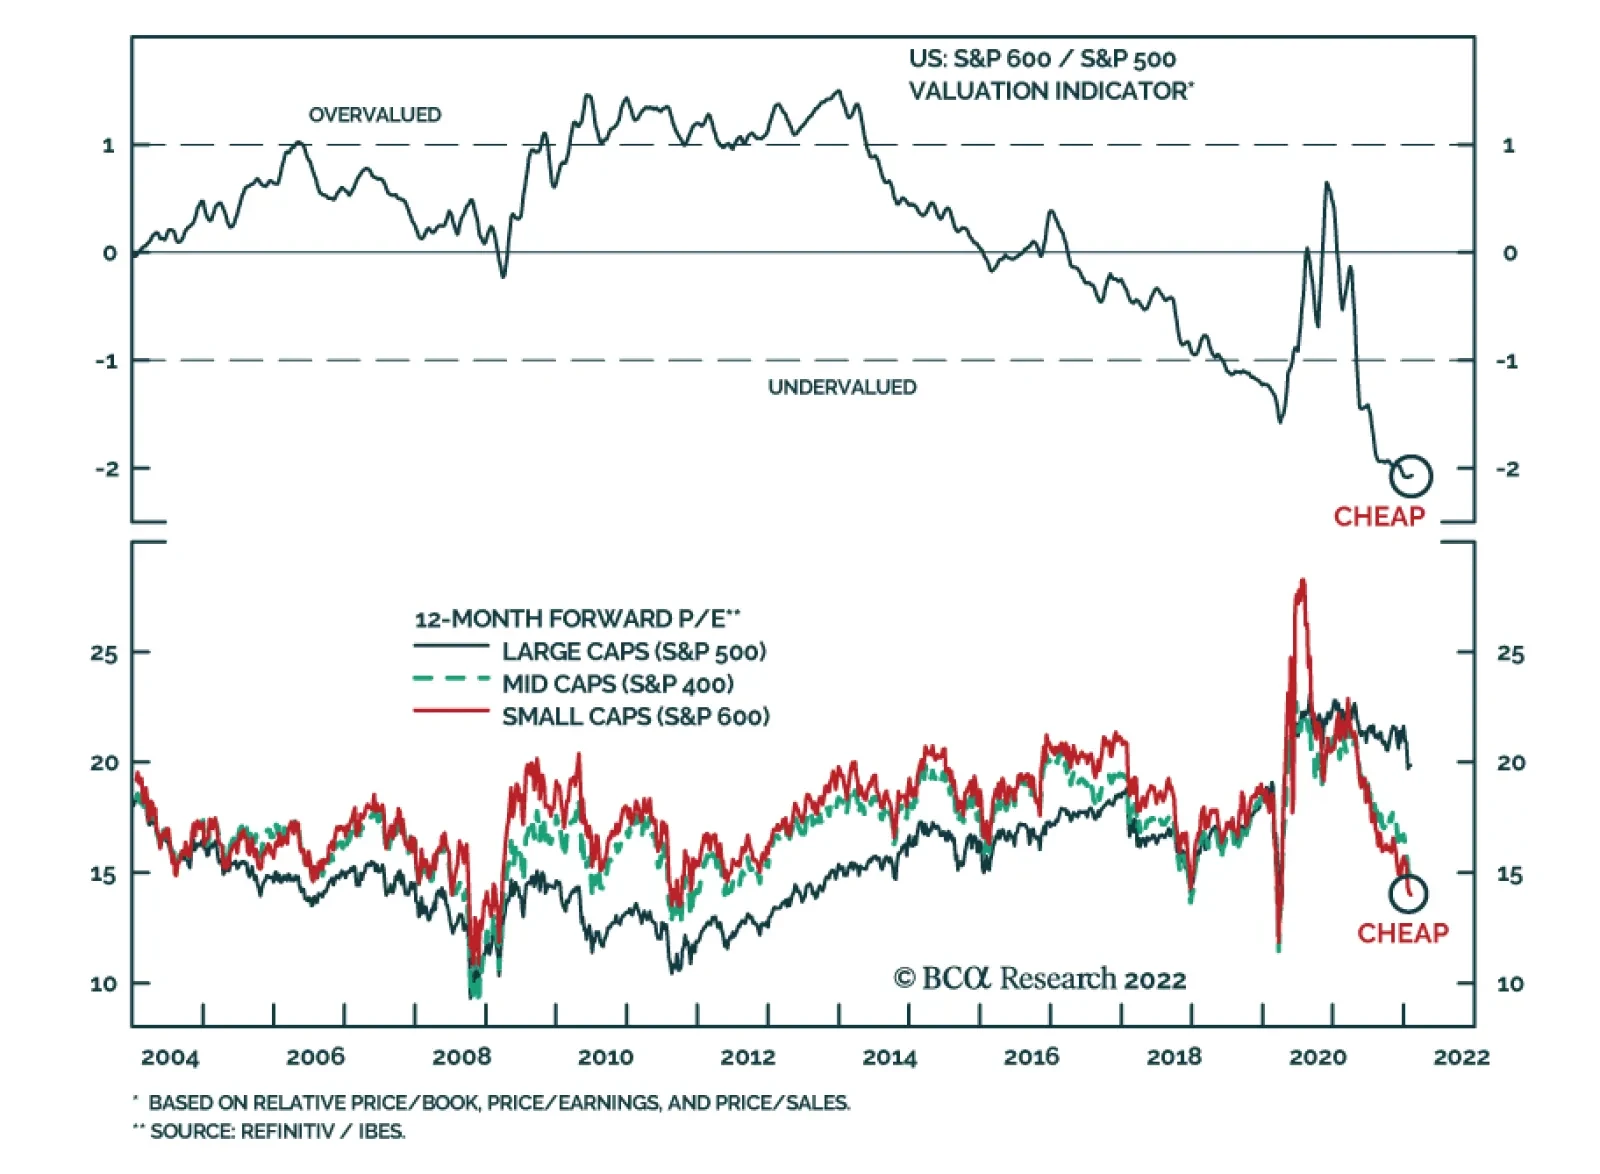
Even though a slowdown in M&A activity will remove one of the tailwinds to small cap equities (see Country Focus), we nevertheless expect small caps to outperform large caps this year. The S&P 600 is attractive on valuation grounds. At 14.5%, small…
The rate of increase in producer prices in January corroborates the signal from the CPI release that price pressures remain intense in the US. PPI final demand inflation was broadly unchanged at 9.7% y/y, versus expectations of a deceleration to 9.1% y/y.…
The M&A Boom Is Likely Over
The…
According to our composite technical indicator, the selloff in US Treasurys is getting stretched. The 63-basis point increase in the 10-year yield since early December has pushed Treasurys into oversold territory. This indicator is flagging that it is…

Dear Client, This week, the US Bond Strategy service is hosting its Quarterly Webcast (February 15 at 10:00 AM EST, 15:00 PM GMT, 16:00 PM CET). In addition, we are sending this Quarterly Chartpack that provides a recap of our key recommendations and some charts related to those recommendations and other areas of interest for US bond investors. Please tune in to the Webcast and browse the Chartpack at your leisure, and do let us know if you have any questions or other feedback. To view the Quarterly Chartpack PDF please click here. Best regards, Ryan Swift, US Bond Strategist
Feature This week, we present the third edition of the BCA Research Global Fixed Income Strategy (GFIS) Global Credit Conditions Chartbook – a review of central bank surveys of bank lending standards and loan demand. The data from lending surveys during the last quarter of 2021 were mixed, with business credit standards easing in the US, Japan, Canada, and New Zealand while remaining mostly unchanged in the euro area and UK (Chart 1). Supply chain disruptions have had a two-pronged effect on borrowing. While they have hurt business confidence and prospects, they have also created loan demand as firms look to replenish depleted inventory stocks. The overall picture is one of solid economic fundamentals that are nonetheless perturbed by inflation concerns and lingering uncertainty regarding Covid-19 infections. Chart 1Credit Standards Eased In Most Developed Markets In Q4/2021
Credit Standards Eased In Most Developed Markets In Q4/2021
Credit Standards Eased In Most Developed Markets In Q4/2021
An Overview Of Global Credit Conditions Surveys Chart 2Credit Standards And Spreads Are Correlated
Credit Standards And Spreads Are Correlated
Credit Standards And Spreads Are Correlated
After every quarter, major central banks compile surveys to assess prevailing credit conditions. The purpose is to obtain from banks an assessment of how their lending standards and demand for loans, for both firms and consumers, changed over the previous quarter. Most surveys also ask questions about the key factors driving these changes and expectations for the next quarter.1 For fixed income investors, these surveys are valuable for a few reasons. Firstly, data on consumer lending is a window into consumer health while business loan demand sheds light on the investment picture. These help derive a view on the path of future economic growth and interest rates and thus, the appropriate duration stance of a bond portfolio. Also, credit standards can tell us about the pass-through from fiscal and monetary policy measures to realized financial conditions (i.e. corporate borrowing rates). Most importantly, credit standards exhibit a direct correlation with corporate bond spreads (Chart 2). As they have access to detailed, non-public information on a large number of borrowers, loan officers are uniquely positioned to evaluate corporate health. When banks are tightening standards, they see an issue with the credit quality of either current or future loans, which impacts borrowing costs in the corporate bond market. Tightening standards indicate a worsening borrowing backdrop and weaker growth, which then pushes up corporate spreads. Vice-versa, easing standards imply a favorable backdrop and plentiful liquidity—both bullish signs for spread product. US In the US, a net percentage of domestic respondents to the Fed’s Senior Loan Officer Survey, reported easing standards for commercial and industrial (C&I) loans to firms of all sizes over Q4/2021 (Chart 3). This marks the fourth consecutive quarter of easing standards. However, banks did report a slower pace of easing, which correlates with tighter financial conditions on the margin (top panel). While we are still in a period of easy financial conditions in absolute terms, this could soon start to change as hot inflation prints and booming economic data cause the Fed to turn increasingly hawkish. Despite this, banks expect to ease standards further over 2022, indicating confidence that underlying economic fundamentals and corporate health will be able to weather monetary tightening. US banks also reported stronger C&I loan demand from all firms in Q4, marking three consecutive quarters of improvement (middle panel). The picture was optimistic, with banks attributing increased loan demand to inventory financing, mergers & acquisitions, and fixed investment. Meanwhile, only 4.2% and 12.5% of banks saw a decrease in internal funds and increasing precautionary demand, respectively, as somewhat important. Inventories accounted for all but 2% of the 6.9% annualized GDP growth in Q4. With inventory stocks still depressed in absolute terms, we expect inventory restocking will continue to buoy demand over 2022. Chart 3US Credit Conditions
US Credit Conditions
US Credit Conditions
Chart 4US Loan Demand Outlook For 2022
Q1/2022 Credit Conditions Chartbook: Tightening Cometh?
Q1/2022 Credit Conditions Chartbook: Tightening Cometh?
On the consumer side, banks reported easier standards across the board, with standards easing for credit card, auto, and other consumer loans (bottom panel). However, the pace of easing, which has historically been good at calling turning points in consumer confidence (on a rate-of-change basis), appears to have peaked. Consumer sentiment has already been battered by rampant inflation and falling real wage expectations; tighter credit standards down the road could prove to be a further headwind. As part of the one-off special questions in this edition of the survey, respondents were asked about the reasoning behind their outlook for loan demand over 2022 (Chart 4). Of those that expected higher demand, 70% cited higher spending and investment demand from borrowers as their income prospects improved. Meanwhile, only 33% thought that precautionary demand for liquidity would be a factor. Lenders thought that both, a worsening or an improvement in supply chain disruptions, could contribute to increased demand. 53% expected that continued disruption would create greater inventory financing needs. Meanwhile, 55% expected that easing supply chain troubles would boost demand as product availability concerns faded. Of those that expected weaker loan demand, interest rates were by-and-large the biggest factor, with an overwhelming 96% believing that rising rates would quell loan demand. This was followed by concerns that supply chain disruptions would keep prices high and product availability scarce (70%). On the whole, the responses capture a US economy that is at a tipping point, with market participants watching to see how it weathers an aggressive rate hiking cycle from the Fed. While underlying economic variables such as growth and employment remain strong, it still remains to be seen how much of a tightening in financial conditions the markets can bear. Euro Area In the euro area, banks on net reported a very slight tightening of standards to enterprises for the second consecutive quarter in Q4/2021 (Chart 5). Effectively, standards were unchanged as 96 of the 100 respondents to the survey reported no change from Q3. Slightly lower risk tolerance from banks contributed to tightening while lower risk perceptions related to the general economic outlook and the value of collateral had an easing effect. As in the US, standards in the euro area do show a correlation to overall financial conditions. Those have already tightened noticeably since the February 3rd meeting of the European Central Bank (ECB) Governing Council where President Lagarde set a more hawkish tone. While banks do expect a slight easing of standards over Q1/2022, that is unlikely given high inflation and geopolitical uncertainties which will negatively impact risk perceptions. Chart 5Euro Area Credit Conditions
Euro Area Credit Conditions
Euro Area Credit Conditions
Chart 6Credit Demand In Major Euro Area Economies
Credit Demand In Major Euro Area Economies
Credit Demand In Major Euro Area Economies
Loan demand growth from enterprises was remarkably strong in Q4, with 18% of firms reporting increased demand for loans (middle panel). The main driver was increased demand for inventories, followed closely by fixed investment and merger & acquisition needs. Loan demand leads realized growth in inventories, which has been already been picking up. In Q1, banks expect continued growth in loan demand, albeit at a slower pace. On the consumer side, however, loan demand only increased slightly, with the pace of growth slowing from the previous quarter (bottom panel). This was in line with consumer confidence taking a hit from rising inflation and the Omicron variant in the fourth quarter. The generally low level of interest rates had a small positive impact, while durable goods spending had a slight negative impact on consumer credit demand. Lenders expect moderate growth in consumer credit demand in Q1. Moving to the four major euro area economies, demand for loans to enterprises picked up in Germany, France, and Italy, while remaining unchanged in Spain (Chart 6). Fixed investment needs made a positive contribution across the board. This is corroborated by data on total lending, which is still growing on a year-on-year basis, even though the pace of growth is slowing in all the major euro area economies except Spain. UK In the UK, overall corporate credit standards eased slightly in Q4/2021, marking the fourth straight quarter of easing (Chart 7). However, there was dispersion along firm size. Large private non-financials accounted for all the easing and standards for small and medium firms actually tightened slightly. Going forward, lenders expect a further easing in standards in Q1, about on par with the easing seen in Q4. Chart 7UK Credit Conditions
UK Credit Conditions
UK Credit Conditions
Chart 8UK Lenders Expect A Robust Growth To Ease Credit Availability
Q1/2022 Credit Conditions Chartbook: Tightening Cometh?
Q1/2022 Credit Conditions Chartbook: Tightening Cometh?
On the demand side, lenders reported slightly weaker corporate demand for lending in Q4. Again, the results were uneven across firm size – loan demand from large firms strengthened moderately, while demand from small and medium firms weakened. On average, lenders expect a slight pickup in corporate demand over Q1. Moving to the UK consumer, demand for unsecured lending continued to rise at a brisk pace, hovering around the highest levels since Q4/2014 (bottom panel). Going forward, lenders expect a continued increase in demand, but at a much slower pace. The strong developments in loan growth are seemingly at odds with the GfK consumer confidence index which has declined a total of 12 points since its July peak. Although the Bank of England does not survey respondents on the factors driving household unsecured lending demand, the divergence between confidence and loan demand suggests that precautionary demand for liquidity is playing a role. This lines up with the GfK survey, where expectations for the general economic situation over the next year are in freefall with consumers bracing for high inflation and further Bank Rate increases. Pivoting back to the drivers of corporate lending, the leading factor behind increased credit availability was an improvement in the overall economic outlook, followed by market share objectives (Chart 8). In contrast to the UK consumer, lenders are bullish on the economic outlook and believe it will continue to drive further easing over Q1/2022. On the demand side, investment in commercial real estate, which has seen steady improvement since Q3/2020, was the leading factor. This was followed by merger & acquisition and inventory financing needs. Capital investment needs, meanwhile, were a drag on demand. Moving forward, real estate investment and inventory restocking needs are expected to drive demand. Japan In Japan, credit standards to firms and households continued to ease in Q4/2021 (Chart 9). However, more than 90% of respondents in each case reported that standards were basically unchanged, and there were no reported instances of tightening among the sample of 50 lenders. Those that did report easier standards cited aggressive competition from other banks and strengthened efforts to grow the business. The vast majority of lenders expect standards to remain unchanged over Q1, but there is a slight easing expected on a net percentage basis. Chart 9Japan Credit Conditions
Japan Credit Conditions
Japan Credit Conditions
Business loan demand on the whole was unchanged in Q4 although small and medium firms did increase demand slightly (middle panel). In contrast to other regions, business loan demand tends to behave counter-cyclically in Japan, with businesses borrowing more on a precautionary basis when they are pessimistic and vice-versa. Those dynamics were at play in Q4, with lenders attributing increased demand to a fall in firms’ internally generated funds. Banks expect a slight net pickup in demand next quarter, in line with business confidence which has fallen from its September peak on the back of concerns about Covid-19 infections, supply chain disruptions, and rising input prices. On the consumer side, loan demand was basically unchanged, with a very small net percentage of banks reporting weaker demand (bottom panel). The key reason for decreased demand was a decrease in household consumption, which is in line with retail sales, where the pace of growth has been falling. Even though core inflation in Japan is low, consumers are still exposed to rising energy prices, which might cause them to tighten other parts of their budgets. Canada Chart 10Canada Credit Conditions
Canada Credit Conditions
Canada Credit Conditions
In Canada, business lending standards continued to ease at a slightly slower pace in Q4/2021 (Chart 10). This marks the fourth consecutive quarter of easing conditions, coming amid booming economic activity, high capacity utilization, and buoyant sentiment. Both, price and non-price lending conditions eased at roughly the same pace. On the consumer side, non-mortgage lending conditions continued to ease, but at a slower pace (middle panel). 1-year ahead consumer spending growth expectations, sourced from the Bank of Canada’s (BoC) Survey Of Consumer Expectations, and non-mortgage lending conditions typically display an inverse correlation, with expected spending growth increasing when standards are getting easier on the margin and vice-versa. The divergence in Q4 is explained in part by excess savings accumulated during the pandemic that have yet to be spent down, and in part by expected price increases over the coming year. In either case, it demonstrates that nominal spending has room to grow even in an environment where consumer credit availability is worsening. We also saw mortgage standards ease at a slightly slower pace in Q4, with both price and non-price lending conditions easing (bottom panel). While the BoC has made a hawkish pivot, underlying conditions are still easy – the conventional 5-year mortgage rate is still flat at 4.79%, the same level as Q3/2020. However, house price growth has peaked, and rate hikes this year will help prices moderate further. New Zealand Chart 11New Zealand Credit Conditions
New Zealand Credit Conditions
New Zealand Credit Conditions
In New Zealand, business credit standards eased in the six month period ended September 2021 (Chart 11). However, the real impact of the Reserve Bank of New Zealand’s (RBNZ) tightening is being felt in the housing market, where actual standards entered tightening territory. More importantly, a net 23.1% of respondents expect mortgage credit availability to erode by the end of March; if realized, this figure would be a series high. Banks reporting less credit availability cited regulatory changes and risk perceptions. On the mortgage loan demand side, banks continued to see increased demand even after the record spike in March 2021 (middle panel). Going forward, demand is expected to moderate and fall from current levels. These dynamics have already made their mark on house prices which have already peaked, indicating that the RBNZ’s push is working as intended. Business loan demand does not appear to have been much affected by higher rates, with demand picking up slightly and expected to increase going forward (bottom panel). However, confidence has been falling since September 2021, with businesses feeling the twin bite of supply chain disruptions and labor shortages. Shakti Sharma Senior Analyst ShaktiS@bcaresearch.com Appendix: Where To Find The Bank Lending Surveys A number of central banks publish regular surveys of bank lending conditions in their domestic economies. The surveys, and the details on how they are conducted, can be found on the websites of the central banks: US Federal Reserve: https://www.federalreserve.gov/data/sloos.htm European Central Bank: https://www.ecb.europa.eu/stats/ecb_surveys/bank_lending_survey/ Bank of England: https://www.bankofengland.co.uk/credit-conditions-survey/2021/2021-q4 Bank of Japan: https://www.boj.or.jp/en/statistics/dl/loan/loos/index.htm/ Bank of Canada: https://www.bankofcanada.ca/publications/slos/ Reserve Bank of New Zealand: https://www.rbnz.govt.nz/statistics/c60-credit-conditions-survey Footnotes 1 The weblinks to each individual survey for the US, euro area, UK, Japan, Canada and New Zealand can be found in the Appendix on page 12. GFIS Model Bond Portfolio Recommended Positioning Active Duration Contribution: GFIS Recommended Portfolio Vs. Custom Performance Benchmark
Q1/2022 Credit Conditions Chartbook: Tightening Cometh?
Q1/2022 Credit Conditions Chartbook: Tightening Cometh?
The GFIS Recommended Portfolio Vs. The Custom Benchmark Index
Q1/2022 Credit Conditions Chartbook: Tightening Cometh?
Q1/2022 Credit Conditions Chartbook: Tightening Cometh?
Global Fixed Income - Strategic Recommendations* Duration Regional Allocation Spread Product Tactical Overlay Trades
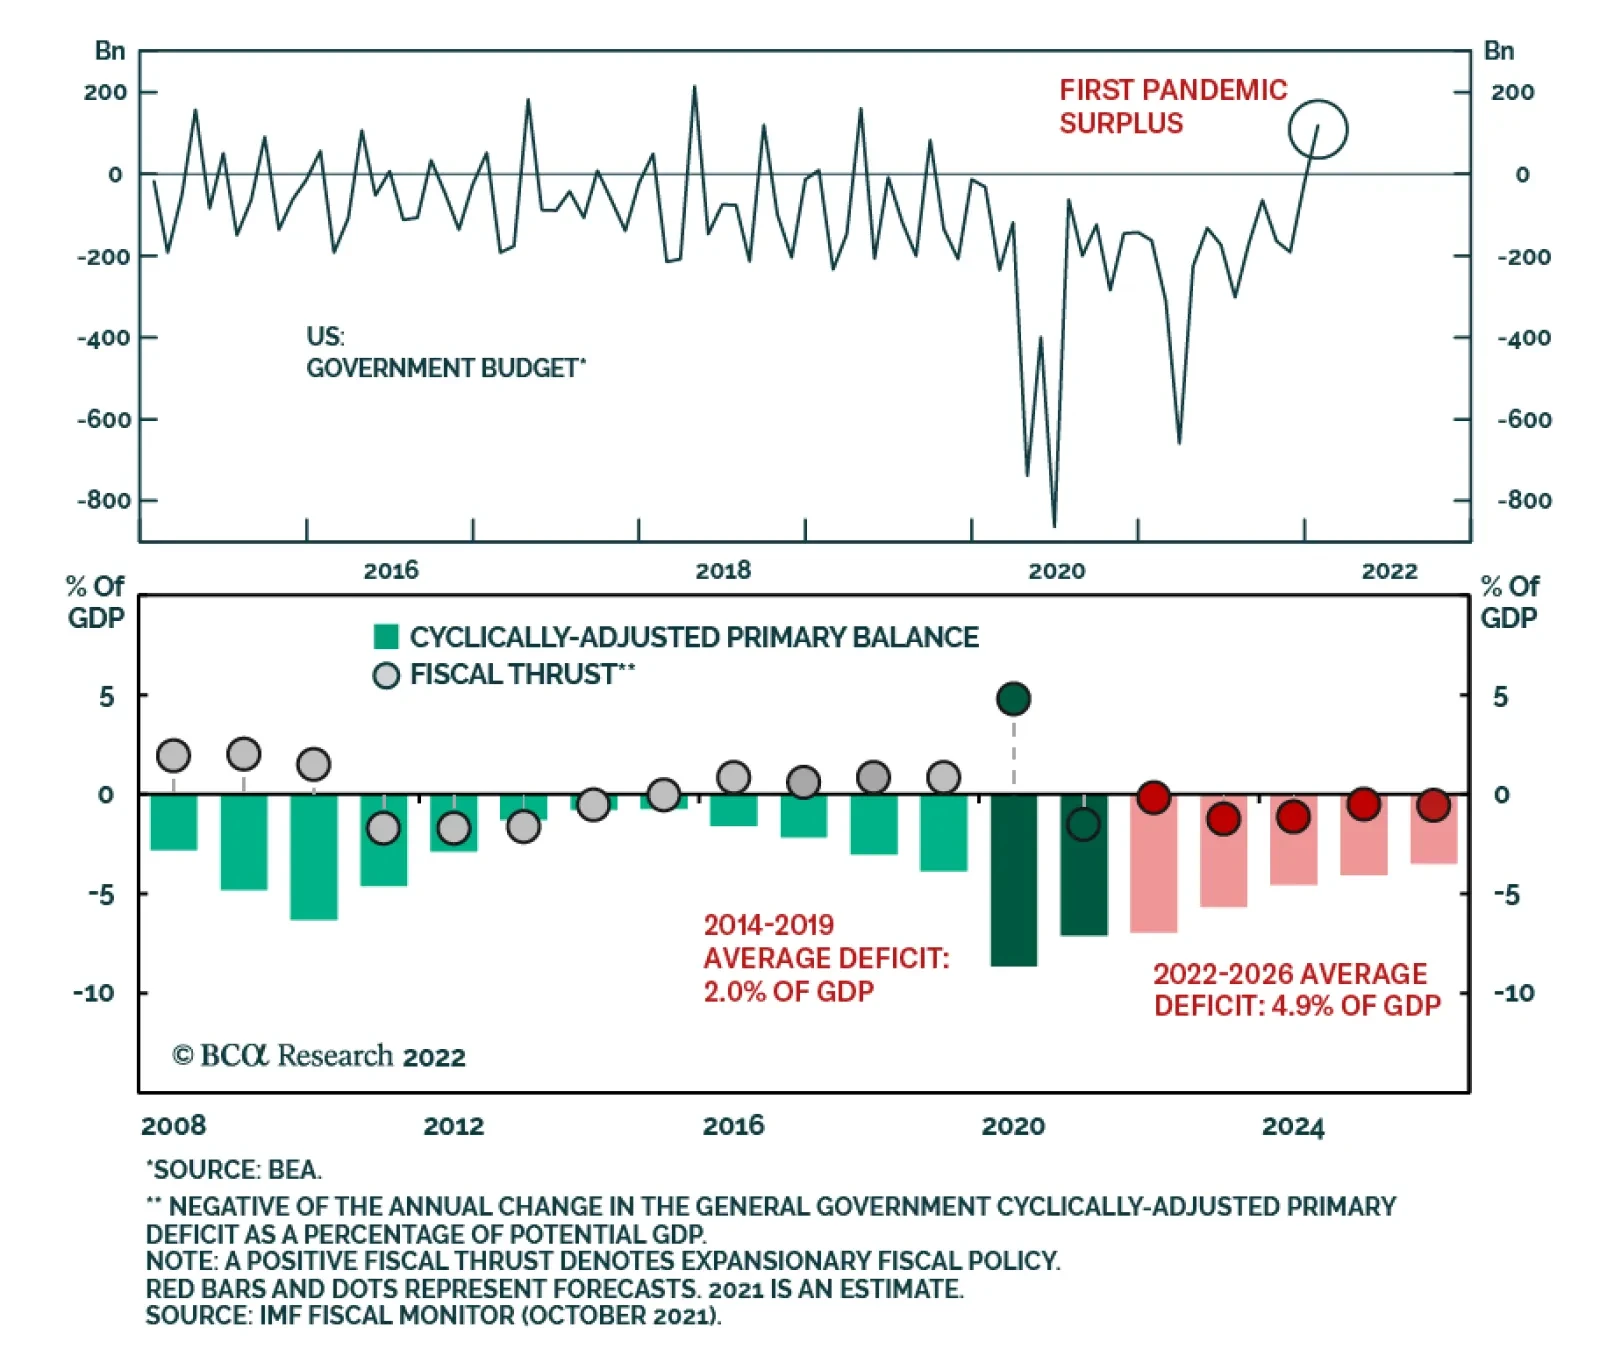
In January, the US federal government posted its first monthly budget surplus since September 2019. The budget balance rose to a $118.7 billion surplus following December’s $162.8 billion deficit, and was above expectations of a smaller $23.0 billion surplus.…
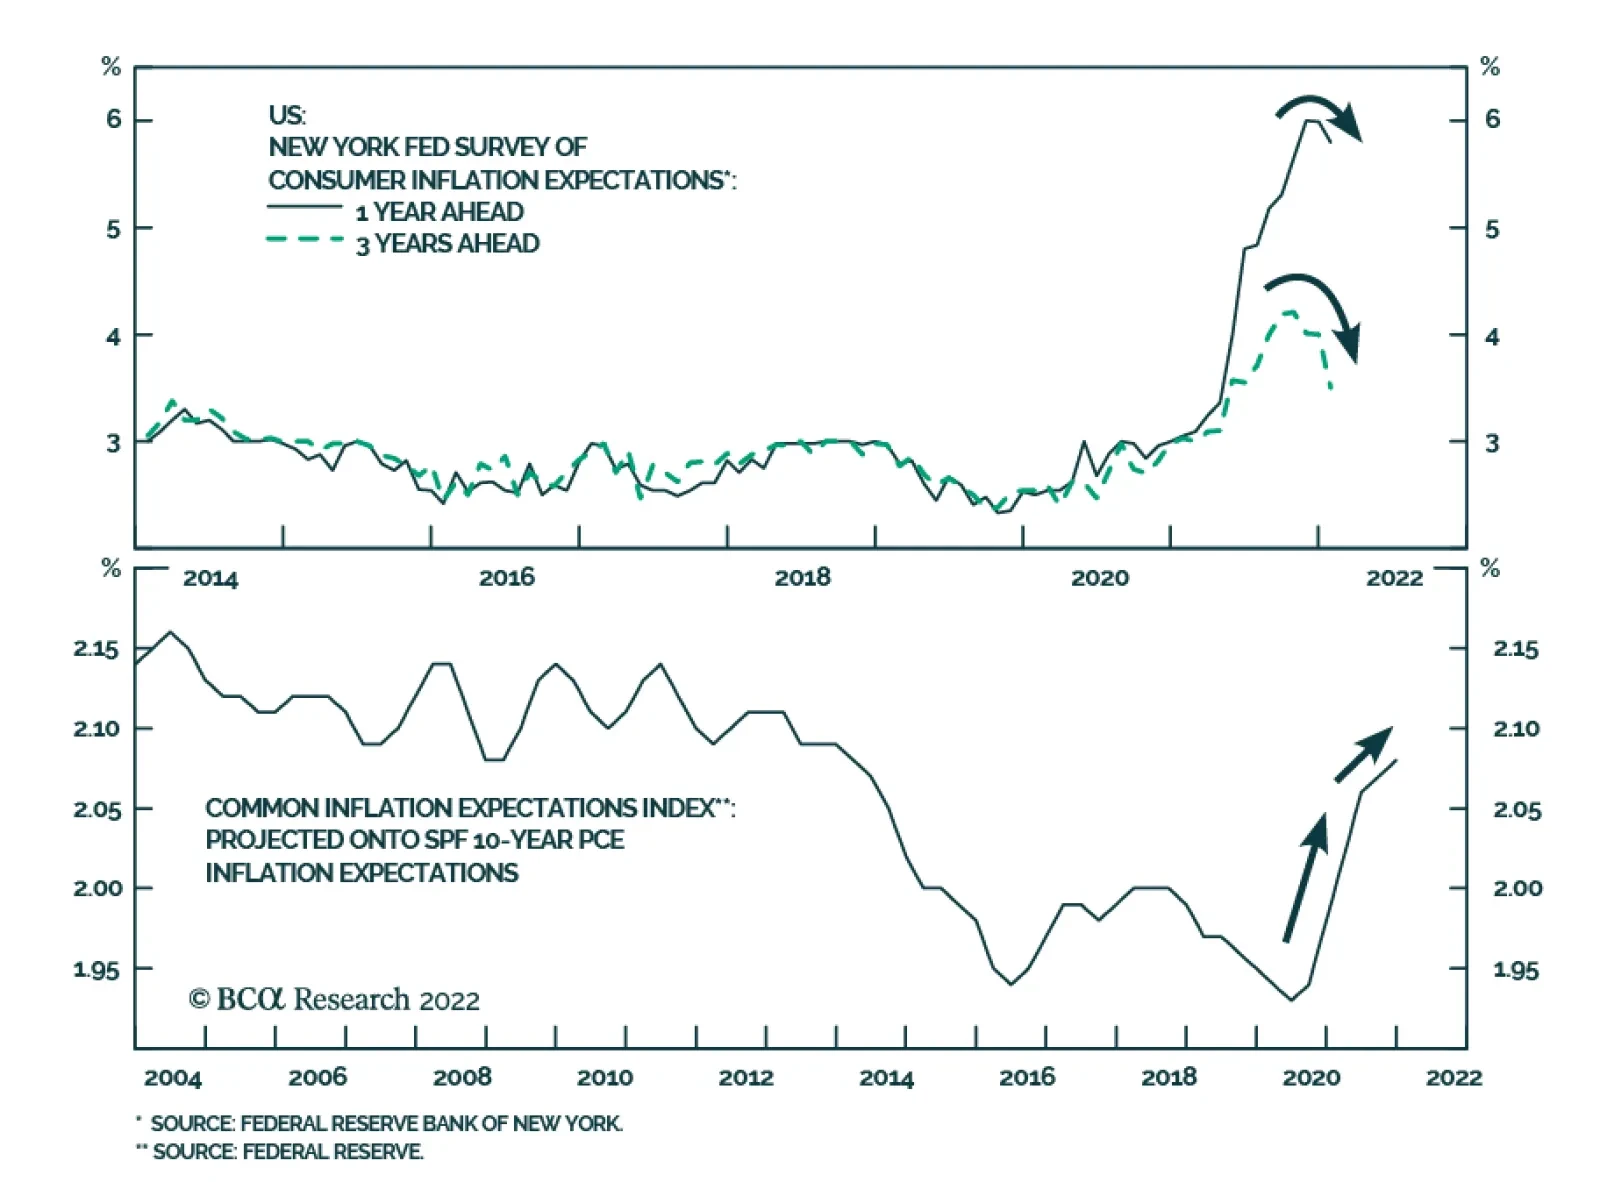
Monday’s release of the New York Fed’s January Survey of Consumer Expectations is sending a more sanguine signal about the direction of consumer inflation expectations than the University of Michigan’s measure. Although at 5.8% y/y median one-year-ahead…

Executive Summary Energy Industry Is Driven By Multi-year Capex Cycles
Energy Industry Is Driven By Multi-year Capex Cycles
Energy Industry Is Driven By Multi-year Capex Cycles
Demand: Crude oil demand is expected to return to trend driven by strong economic growth and the receding pandemic. Supply: Production remains suppressed because of curtailments by OPEC 2.0 members, investment restraint from US producers, and multiple supply disruptions. To meet the increasing oil demand, the US shale oil producers are now perfectly positioned to pick up slack in supply. New Capex Cycle: The industry’s Capex is inherently cyclical – there are early signs of the new “up” leg. Geopolitics: Sizzling tensions with Iran, Russia, and a possible new market share war with the Saudis may lead to volatility in crude oil prices. Bottom Line: The US Energy sector is in the early innings of the new Capex and production cycle on the back of growing demand for oil and gas, and faltering supply from OPEC 2.0 members. Stay tuned for an upcoming Part II of the report where we will provide investment recommendations for the Energy sub-sectors. Feature This week, we start a “deep dive” into the Energy sector, aiming to make an educated decision regarding Energy sector allocations – is it time to take profits after a strong run, or does the rally still have legs? We are currently overweight Energy, with the position outperforming the S&P 500 by 32% since we initiated it in December 2021. This is a two-part report. In today’s publication, we will overview the industry landscape, and analyze global supply and demand for oil, price forecasts, and geopolitical undercurrents. Next week, we will cover the Energy sector’s macroeconomic backdrop, fundamentals, and valuations. We will use the analysis to provide investment recommendations for the sector, as well as offer a granular view on the prospects of each Energy industry group. Stay tuned! Performance All of a sudden, the Energy sector, a humble chronic underperformer, the weight of which in the S&P 500 has melted from 15% to 5% over the past 15 years, is hot again and is a focal point of investor attention. Indeed, Energy was the best performing sector in 2021 and is the only sector with positive absolute returns YTD, outperforming the S&P 500 by 30%. Despite a strong recent run, Energy is still 18% behind the S&P 500 since January 2020, and 72% since 2008 (Chart 1). Chart 1Energy Has Lagged The S&P 500 Since 2020
Energy Has Lagged The S&P 500 Since 2020
Energy Has Lagged The S&P 500 Since 2020
Table 1
Energy: After Seven Lean Years (Part I)
Energy: After Seven Lean Years (Part I)
The Early Innings Of A New Capex Cycle The energy industry is inherently cyclical, driven by multi-year Capex cycles. Supply shortages and high oil prices beget years of elevated capital spending, which boosts production to unsustainable levels. Once the market is flooded with oil, prices collapse, and “seven lean years” of underinvestment commence (Chart 2). Case in point: Energy industry Capex has been in a downcycle since 2014 when Saudi Arabia flooded the market with oil to protect its market share and confront Iran. Recent supply shortages have been further exacerbated by a broad push towards “green” energy, fortified by government incentives, regulations, and shareholder activism directed against fossil fuels. Just last year, a hedge fund called Engine No. 1, backed up by BlackRock, Vanguard, and State Street, installed three new directors on Exxon’s board with a declared effort to force the company to reduce its carbon footprint. Politicians’ and investors’ aversion to the “dirty sources of energy” translates into a higher cost of capital for oil producers and reluctance to invest despite rising prices. Ironically, “greenification” has led to a higher price of oil and constrained output – producing a profit windfall for the oil and gas producers. Chart 2Energy Industry Is Driven By Multi-year Capex Cycles
Energy Industry Is Driven By Multi-year Capex Cycles
Energy Industry Is Driven By Multi-year Capex Cycles
Further, not only were oil producers overly cautious and concerned about the sustainability of higher oil prices but also, once compelled to go ahead with multi-million-dollar investments, they could not react fast enough – it takes six to eight months to ramp up production. This explains the recent dichotomy between the WTI and the Energy sector return (Chart 3). Chart 3Dichotomy Between WTI And Energy Sector Returns
Dichotomy Between WTI And Energy Sector Returns
Dichotomy Between WTI And Energy Sector Returns
Chart 4Rig Count Is Rising Again
Rig Count Is Rising Again
Rig Count Is Rising Again
Now that the industry is flush with cash and gaining confidence in the sustainability of higher prices, it is cautiously increasing production and adding rigs. Capex is expected to rise by 25% year-over-year in 2022, and by 7% in 2023. Rig count increased by 11% in 2021 (Chart 4). Industry Structure Energy Sector Composition The energy sector consists of four distinct segments, with each segment corresponding to a section of the oil production value chain (Figure 1). The GICS sector classification classifies them as Oil & Gas Exploration and Production (aka E&P or Upstream segment), Oil & Gas Equipment and Services Companies, Storage and Transportation (Midstream), and Refining and Marketing (Downstream). Integrated Oil & Gas companies straddle the entire supply chain. Integrated Oil Companies constitute almost half of the S&P 500 Energy sector, with E&P at just over a quarter (Chart 5). The Energy sector is not as top heavy as some of its “new technology” brethren in the overall market index. Of all the segments, Midstream has the highest margins, as its fees are a function of output as opposed to the price of oil (Chart 6). Energy Services is most challenged as its revenue is a function of E&P Capex and is highly leveraged to the oil price. Figure 1The Energy Industry Supply Chain
Energy: After Seven Lean Years (Part I)
Energy: After Seven Lean Years (Part I)
Chart 5The Sector Is Dominated By E&P And Integrated Oil Companies
Energy: After Seven Lean Years (Part I)
Energy: After Seven Lean Years (Part I)
Chart 6Profitability Varies Across Segments
Energy: After Seven Lean Years (Part I)
Energy: After Seven Lean Years (Part I)
Upstream: E&P Segment This segment is the first step in the production process. E&P companies focus on exploration, discovery, and managing the production of new and established wells. The success of these companies is largely a function of their ability to find new profitable oil and gas deposit sites. Development of new rigs is a sophisticated technological process that requires hundreds of millions of dollars in capital outlays without much guarantee of success. In addition, tight oil (aka shale) wells have steep declines in the early years of their production, requiring continuous drilling of new wells to maintain production rates. The E&P companies also have to constantly look for and develop new extraction sites. This is the riskiest energy segment – the E&P companies must manage the dual uncertainty of the exploration process and of the price of crude, for which they are perfect price-takers. As a result, E&P stocks have the highest beta of all segments to the price of oil. In this business, economies of scale and diversification certainly help profitability – larger companies in the sector tend to have a higher RoE (Chart 7). The largest and most well-known upstream companies are ConocoPhilips (COP), EOG Resources (EOG), and Pioneer Natural Resources (PXD). The E&P ETF is XOP. Chart 7Larger Companies Tend To Have A Higher RoE
Energy: After Seven Lean Years (Part I)
Energy: After Seven Lean Years (Part I)
Energy Equipment And Services (E&S) Segment This segment supplies equipment and services, such as drilling, to the E&P companies. Once a new oil or gas discovery is vetted and gets the go-ahead, upstream companies allocate resources for the development of a new site. To put it simply, upstream companies’ Capex is E&S firms’ revenue. In addition, the E&S companies maintain existing wells, retire depleted ones, and complete unfinished wells (as is happening now). Consequently, this sub-sector is tightly linked to the well-being of exploration companies, and through them, to the crude oil and gas prices. Over the past seven “lean years”, upstream companies’ newly-found Capex discipline, and a push to return cash to shareholders, was quite a blow for the E&S companies. To survive, many had to look for new sources of revenue, such as servicing green energy projects. Recent oil and gas shortages and a rising rig count are a notable change of fortune for these companies. However, the E&P companies are still in a frugal and cautious mindset and are focusing on the completion of drilled-but-uncompleted wells (DUCs), whose number has decreased by 29% in 2021.1 This work is less lucrative for the E&S companies than drilling new wells. Some of the largest players in the industry are Baker Hughes (BKR), Halliburton (HAL), and Schlumberger (SLB). The ETF is XES. Midstream: Storage And Transportation (S&T) Segment S&T companies are involved in the transportation, storage, and trading of unrefined oil after it has been taken out of the ground by the upstream firms. There are several modes of oil transportation: Marine vessels, trucks, and pipes. While the first two modes are straightforward, it is pipelines that put the overall energy industry into political crosshairs. Since pipelines must go through someone’s land, midstream companies often get caught in land rights or related environmental battles. As a result, the industry is heavily regulated, and many projects are blocked and dropped after multi-year delays and millions in legal fees. But all in all, this segment faces less uncertainty than other segments as its sales are a function of production volume as opposed to the price of oil. It also requires more moderate capital outlays than the upstream segment. Kinder Morgan (KMI), ONEOK (OKE), and Williams (WMB) are the key players in this space. Downstream: Refining And Marketing (R&M) Segment Refining and marketing crude oil completes the energy industry value chain. Refining is a complex process that transforms raw crude that has little use into end-user products such as motor fuel, heating oil, or plastics. These products are then marketed for distribution on a wholesale basis to be sold to the consumer, business, and government sectors. Refiners run mostly high fixed cost operations and benefit from higher volumes. These companies are less sensitive to the price of crude as they make money on the crack spread, or the difference between the price of raw and refined oil. In 2021, utilization rates of refiners got back to 90% of pre-pandemic levels. Marathon Petroleum (MPC), Valero Energy (VLO), and Phillips 66 (PSX) are the three R&M companies in the S&P 500 Energy benchmark. Integrated Oil And Gas (Integrated) While most players in the industry typically specialize within their segment, Chevron (CVX), ExxonMobil (XOM), and Occidental Petroleum (OXY) are exceptions. These are vertically integrated companies that operate in every segment of the value chain, from upstream to downstream. These are the largest and most diversified industry players, less dependent on the price of oil or Capex cycle than companies in the other segments. Oil And Gas Consumption For many laymen, like myself, oil and gas stand for driving and cooking. However, the uses of energy products are diverse and touch nearly every sector of the global economy. According to EIA (Figure 2), in 2020, motor gasoline stood for 44%, jet fuel for 6%, and hydrocarbons for 18% of overall oil and gas output. In terms of sectors, 66% went to the Transportation sector, and 28% to the Industrial sector for example as plastics. In 2022, we expect a further pick-up in demand for fuel from the aviation industry, and from car drivers – as COVID-19 gradually morphs from a pandemic into an endemic illness, and demand for travel increases. Figure 2US Petroleum Products Consumption By Source And Sector, 2020
Energy: After Seven Lean Years (Part I)
Energy: After Seven Lean Years (Part I)
Supply And Demand Oil Demand Recovery To Continue EIA reports that “global oil consumption outpaced oil production for the six consecutive quarters, ending with the fourth quarter of 2021 (4Q21), which has led to persistent withdrawals from global oil inventories and significant increases in crude oil prices”.2 According to BCA Research’s Chief Commodity and Energy Strategist Bob Ryan, demand will continue to return to trend (Chart 8), barring too-high prices or another full-scale COVID-induced lockdown in a key market like China. He also emphasizes that increase in oil demand is being driven by economic growth, and consumers are likely to withstand higher prices, as long they don’t become entrenched at over $90/bbl. We concur. Chart 8Global Oil Demand Expected To Get Back On Track
Global Oil Demand Expected To Get Back On Track
Global Oil Demand Expected To Get Back On Track
Supply From OPEC 2.0 Is Faltering – US Shale To The Rescue! Crude oil production remained suppressed because of curtailments by OPEC 2.0 members, investment restraint from US oil producers, and other supply disruptions. To meet the increasing oil demand, the core OPEC 2.0 member states ex-Russia, i.e., Saudi Arabia, Iraq, the UAE, and Kuwait, need to restore production taken off the market in the wake of the pandemic. According to the Oxford Institute of Energy Studies (OIES), this year OPEC 2.0 "will struggle to return more than 2 mb/d of withheld supplies in 2022, compared to the headline target of 3.76 mb/d."3 In the face of ongoing downgrades in the inability of OPEC 2.0 member states, including Russia, to increase output, the US shale oil producers need to pick up slack in supply. BCA’s Commodity & Energy Strategy (CES) projects that, in 2023, US crude oil production will return to the pre-pandemic high (Chart 9). Chart 9US Oil Production Has To Increase
US Oil Production Has To Increase
US Oil Production Has To Increase
So far the increase in US output has been slow, mostly because it takes six to eight months after an oil price increase to assemble rigs and crews to significantly lift production from current levels.4 Supply And Demand – Mostly Balanced With oil demand normalizing, and US shale producers gearing up to make up shortfalls from OPEC 2.0 producers, markets are likely to remain balanced (Chart 10). The implication is price stability barring geopolitical shocks (which may be many). Chart 10Market Remains Tight But Mostly Balanced
Market Remains Tight But Mostly Balanced
Market Remains Tight But Mostly Balanced
Chart 11Brent Forecasts Center Around /bbl For 2022
Brent Forecasts Center Around $80/bbl For 2022
Brent Forecasts Center Around $80/bbl For 2022
Price Forecasts On the back of faltering oil supply from OPEC 2.0 and steady demand recovery, BCA’s CES forecasts the Brent oil price to average $80/bbl this year, and $81/bbl in 2023. This call is in line with market consensus, with most estimates clustered around the $80-$85/bbl range. EIS forecasts are more conservative – WTI is set to decline from the current price of $90 to $75 in 2022, and $68 in 2023 (Chart 11). To put these prices into context: $46/barrel is a breakeven cost of a well in the Permian Midland, and $64 is an average WTI price used by executives for planning their Capex in 2022.5 Geopolitical Tensions: Uncertainty Will Lead To Oil Price Volatility Supply shortages, due to OPEC 2.0’s inability to raise output, coupled with a time lag in restarting US shale rigs, are exacerbated by geopolitical tensions involving Iran and Russia. According to BCA Research’s Geopolitical Strategist Matt Gertken, we are to expect significant volatility in oil and gas prices due to uncertainty associated with Iran and Russia. The US is seeking to rejoin the 2015 nuclear deal, which would be a stop-gap solution to tensions with Iran. The Biden Administration wishes to avoid an energy shock in 2022 ahead of the midterm elections and may be willing to lift sanctions on Iran to that end. Iran may be willing to agree to the original deal to reduce sanctions, knowing that the deal begins to expire as early as 2025. However, the Iranian government does not have an incentive to halt progress on its nuclear and missile program, and it also fears another US change of ruling party in 2024-25. Therefore, any removal of US sanctions will be a temporary solution: It will boost oil supply in the short run but may not have a lasting impact as regional military threats to oil production will revive sooner than expected. However, Gertken thinks that the likelihood of a deal with Iran is less than 50/50. In that case, sanctions will stay in effect, Iran will achieve breakout uranium enrichment capacity, Israel will dial-up military threats, and the price of oil will see a rising risk premium, with higher odds of a major supply disruption. Russia invading Ukraine will also trigger sanctions and a cut-off of natural gas that flows through Ukraine to Europe, which will lead to a further supply squeeze and a potential shock that would weigh on European and global growth. In that case, from a geopolitical perspective, the Saudis and Americans will increase production to prevent demand destruction. Thus, the most likely outcome is heightened oil price volatility. However, in a way, this outcome is somewhat favorable to US producers as prices would be loosely anchored around the current level. This said, a key opposing geopolitical risk is a drastic move by OPEC, i.e., by the Saudis, who are capable of flooding the market with oil. This move would be aimed both at Iran and the US shale producers, to preempt loss of market share by lowering the price of oil and removing incentives for the other oil producers to ramp up production in response to growing global demand. The Saudis might do this if the US and Iran strike a new deal and the US is about to lift sanctions on Iran. The effect of such a potential move by OPEC will have a much more severe effect on the oil prices than if the US lifts sanctions on Iran. BCA’s Commodity & Energy Strategy argues that it is highly likely that OPEC 2.0 will increase output in response to strong global growth, but that the Saudis will not initiate a full-fledged market-share war as they did in 2014. Bottom Line The US Energy sector is in the early innings of the new Capex and production cycle. Strong and growing demand for oil and gas, and faltering supply from OPEC 2.0, exacerbated by the geopolitical tensions with Iran and Russia, put the US Energy sector into the driver’s seat to ramp up production and pick up slack in global supply. Irene Tunkel Chief Strategist, US Equity Strategy irene.tunkel@bcaresearch.com Footnotes 1 CFRA, Upstream & Downstream Energy Survey, January 2022. 2 https://www.eia.gov/outlooks/steo/ 3 Please see Key Themes for the Global Energy Economy in 2022 published by the Oxford Institute for Energy Studies on January 18, 2022. 4 Today, operators develop their acreage in a “manufacturing-style” process: First, 6-12 horizontal wells are drilled in succession on the same drilling pad, each well radiating out on a different path; then, after all the wells are drilled, the completion equipment is brought to the pad and the wells are fracked and put online in a similar assembly-line fashion. While this process is far more efficient in terms of both time and capital, allowing each active rig to drill more wells per year, it does mean that the average time lag between drilling a well and realizing production from that well takes six to eight months. 5 Federal Reserve Bank of Dallas, Survey of Executives of 122 oil and gas firms, December 8-16, 2021. Recommended Allocation
Highlights A feedback loop has emerged in European markets. Tightening financial conditions will preempt the European Central Bank from hiking rates as much as the money market is pricing in. The widening in peripheral and credit spreads is overdone. Investors already long should maintain their positions. Investors without exposure will soon find an attractive entry point. Despite these near-term gyrations, the ECB is still on track to hike interest rates once in Q4 2022 and lift them aggressively in 2023. Feature Last week’s hawkish pivot by the European Central Bank (ECB) continues to affect markets. We take the words of the ECB at their face value; we anticipate the Governing Council (GC) to begin lifting interest rates at the end of 2022 and to continue to do so steadily over 2023 and 2024. However, as the shock filters through financial asset prices, we become more confident that the ECB will not lift rates five times in 2022 as the Euro Short Term Rate (ESTR) curve currently anticipates. Chart 1Growing Tensions In The Periphery...
Growing Tensions In The Periphery...
Growing Tensions In The Periphery...
First, the behavior of Italian and Greek bond markets constitutes a major support to our view. Italian and Greek 10-year spreads have widened by respectively 46 and 65 basis points over the past six trading days (Chart 1). This tension highlights that investors still view these economies as continental trouble spots. Meanwhile, the ECB’s communication continues to highlight the need for flexibility to maintain order in the sovereign debt market. The GC does not want inadvertently to engineer a severe tightening in financial conditions in the already fragile periphery. In this context, it is highly unlikely that the ECB will rush to terminate the Asset Purchase Program (APP), an end on which rate hikes depend. Second, the corporate bond market is also going through a significant period of ruction. Both investment grade and high-yield bond yields have risen rapidly in recent days, and they are now retesting their late-2018 levels (Chart 2, top two panels). Spreads too are widening meaningfully, even though they remain further away from their 2018 highs (Chart 2, bottom two panels) The ECB is unwilling to let a liquidity shock morph into a solvency problem for European firms. For now, the behavior of the European credit market remains consistent with a liquidity shock. Funding markets are experiencing a violent adjustment, which is bleeding into the overall level of spreads. However, investors are not differentiating based on credit risk. Chart 3 shows that CCC credit (the lowest rated HY bonds) is not selling off relative to the overall high-yield index, which we would anticipate if investors were worried about underlying default risk. Chart 3No Distinction On Credit Risk
No Distinction On Credit Risk
No Distinction On Credit Risk
Chart 2...And In European Corporates
...And In European Corporates
...And In European Corporates
If the liquidity shock were to deepen further and last long enough, the resilience of the corporate sector would fritter away. However, the GC has tried to resist a deflationary shock for more than ten years now, and a solvency problem would undo all the progress made toward escaping the European liquidity trap, especially because wages have yet to recover. Third, members of the ECB’s GC are already trying to talk down the market. President Christine Lagarde displayed a more dovish tone when she spoke in front of the EU Parliament on February 7, 2022. ECB Chief Economist Philippe Lane remains steadfast that wages are not yet a problem. The Governor of the Bank of France, François Villeroy de Galhau still sees an imminent peak in CPI, and Olli Rehn, Governor of the Bank of Finland, recently lectured about the need for a gradual normalization of policy. Even hawks like the Bundesbank’s Joachim Nagel or the DNB’s Klaas Knot have gestured toward higher rates, but only toward the end of the year. In this context, we expect credit spreads to begin to narrow again; however, it will likely first require an easing in funding pressures. This is unlikely to happen until US yields form an interim peak. However, as Chart 4 highlights, the Treasury market is becoming extremely oversold. Moreover, a JP Morgan survey shows that its clients are massively short duration. The risk of a pullback in Treasury yields is growing, even if rising inflation and fears of a tighter Fed prevail for now. If US yields were to decline Bunds would likely follow the Treasury market because the ECB is becoming louder that it does not want to tighten financial conditions abruptly. Hence, a pullback in global risk-free yields will be the key to a period of calm in credit spreads, since valuations have improved materially, with the breakeven spreads on investment grade and high-yield bonds moving back to their 43rd and 44th percentiles, respectively (Chart 5). A stabilization in global yields and European spreads should also percolate to the peripheral sovereign bond market and limit the upside to Italian and Greek spreads. Chart 4Oversold Treasurys
Oversold Treasurys
Oversold Treasurys
Chart 5Restoring Value In Corporates
Restoring Value In Corporates
Restoring Value In Corporates
Bottom Line: The tightening in financial conditions taking place in Europe indicates that money market curves are pricing in the path for European policy rates too aggressively. The ECB has changed since 2011. It will not let peripheral borrowing costs threaten the recovery in Southern European economies, nor will it allow a liquidity shock in the corporate bond market to become a solvency issue that will damage growth prospects. European peripheral and corporate spreads will narrow once global risk-free rates peak. Mathieu Savary, Chief European Strategist Mathieu@bcaresearch.com