United States

Executive Summary The Pandemic-Led Surge In E-Commerce Spending Is Reverting Back To Trend
The Pandemic-Led Surge In E-Commerce Spending Is Reverting Back To Trend
The Pandemic-Led Surge In E-Commerce Spending Is Reverting Back To Trend
Rising interest rates and a cooling in pandemic-related tech spending will cap the upside for technology shares over the remainder of 2022. Looking further out, US big tech companies are likely to suffer from heightened competition in increasingly saturated markets. Concerns about big tech’s excessive market power, cavalier attitudes towards personal data, proclivity for censoring non-establishment opinions, and the deleterious impact of social media on teenage mental health are all fueling a public backlash. Investors should expect increased regulation and antitrust enforcement of big tech companies in the years ahead. Bottom Line: The hegemony of today’s US-based big tech companies is coming to an end. While we do not expect tech stocks to decline in absolute terms in 2022, they will lag the S&P 500. Given tech’s heavy representation in the US, investors should underweight the US in a global equity portfolio. Sinking Ark Tech stocks have had a tough ride since the start of the year. So far in 2022, the NASDAQ Composite has fallen 9.3% compared to 5.5% for the S&P 500. The ARK Innovation ETF, Cathie Wood’s collection of “disruptor” companies, has dropped -22%, and is now down -53% from its peak last year (Chart 1). We expect tech shares to lag the market during the remainder of 2022. The pandemic was a boon for many tech companies. Generous stimulus payments and stay-at-home policies led to a surge in e-commerce spending (Chart 2). As economies continue to reopen, many tech companies could face an air pocket in demand for their goods and services. Chart 1Tech Stocks: Rough Start to 2022
Tech Stocks: Rough Start to 2022
Tech Stocks: Rough Start to 2022
Chart 2The Pandemic-Led Surge In E-Commerce Spending Is Reverting Back To Trend
The Pandemic-Led Surge In E-Commerce Spending Is Reverting Back To Trend
The Pandemic-Led Surge In E-Commerce Spending Is Reverting Back To Trend
Despite some softening of late, retail sales remain well above their pre-pandemic trendline (Chart 3). If Amazon’s still-rosy projections are any guide, a further slowdown in goods spending is something that the analyst community is not fully discounting (Chart 4). Chart 3US Retail Spending Is Above Trend
US Retail Spending Is Above Trend
US Retail Spending Is Above Trend
Chart 4Amazon Sales Estimates May Be Too Optimistic
Amazon Sales Estimates May Be Too Optimistic
Amazon Sales Estimates May Be Too Optimistic
Rate Hikes Will Disproportionately Hit Tech Chart 5Long Rates Anticipate The Movements In Short Rates
Long Rates Anticipate The Movements In Short Rates
Long Rates Anticipate The Movements In Short Rates
US rate expectations continued to move up this week, egged on by St. Louis Fed President James Bullard’s statement earlier today declaring that he favors raising interest rates by a full percentage point by the start of July. The market is now pricing in six rate hikes by the end of the year. Historically, bond yields have increased starting about four months before the first rate hike and over the period in which the Fed is raising rates (Chart 5). While we do not think the Fed will need to deliver more tightening this year than what is already discounted, we do think that investors will eventually be forced to revise up their expectations of the neutral rate to between 3%-and-4%. As Chart 6 shows, the market expects the Fed to stop raising rates when they reach 2%, which we regard as unrealistic. Chart 6The Market Thinks The Fed Will Not Be Able To Lift Rates Above 2%
The Disruptor Delusion
The Disruptor Delusion
An increase in the market’s estimate of the neutral rate will push up bond yields. Unlike banks, tech tends to underperform in a rising yield environment (Chart 7). Priced For Perfection? Higher bond yields and a reversion-to-trend in tech spending would be less of a problem for technology shares if valuations were cheap. They are not, however. The Nasdaq Composite still trades at 29-times forward earnings compared to 20-times forward earnings for the broader S&P 500 (Chart 8). Chart 8Tech Shares Are No Bargain
Tech Shares Are No Bargain
Tech Shares Are No Bargain
Chart 7Rising Bond Yields Will Help Bank Stocks But Hurt Tech Shares
Rising Bond Yields Will Help Bank Stocks But Hurt Tech Shares
Rising Bond Yields Will Help Bank Stocks But Hurt Tech Shares
Tech investors would argue that such a hefty valuation premium is warranted given the tech sector’s superior growth prospects. Underlying this argument is the assumption that just because tech spending will grow more quickly than the rest of the economy, this will necessarily translate into above-average earnings growth and outsized returns for publicly-listed tech companies. But is that really the case? Over short horizons of a few years, there is a decent correlation between relative industry growth and relative equity returns (Chart 9). However, that relationship evaporates over very long-term horizons (Chart 10). In fact, since 1970, the best-performing equity sector has been tobacco, hardly a paragon of technological innovation (Chart 11). Chart 9Stocks In Industries That Experience A Burst Of Output Growth Do Tend To Outperform Other Stocks …
The Disruptor Delusion
The Disruptor Delusion
Chart 10… But Over The Long Haul, Companies In Fast- Growing Industries Do Not Outperform Their Peers
The Disruptor Delusion
The Disruptor Delusion
Chart 11Tobacco Industry Returns Have Smoked All Others
The Disruptor Delusion
The Disruptor Delusion
What Goes Around Comes Around Table 1History Shows Leaders Can Become Laggards
The Disruptor Delusion
The Disruptor Delusion
Tech stock enthusiasts tend to forget that the disruptors themselves can be disrupted. History is littered with tech companies that failed to keep up with a changing world: RCA, Kodak, Polaroid, Atari, Commodore, Novell, Digital, Sinclair, Wang, Iomega, Corel, Netscape, AltaVista, AOL, Myspace, Compaq, Sun, Lucent, 3Com, Nokia, Palm, and RIM were all major players in their respective industries, only to fade into oblivion. Table 1 shows that all but one of the ten biggest tech names in the S&P 500 IT index in 2000 underperformed the broader market by a substantial degree over the subsequent ten years. Today, the incentive for startups to emerge has never been stronger. Venture capital funds are flush with cash. Tech profit margins are near record highs, making challenging the incumbents an increasingly enticing goal. About one-third of the outperformance of US tech stocks since 1996 can be explained by rising relative profit margins, with faster sales growth and relative P/E multiple expansion explaining 45% and 23% of the remainder, respectively (Chart 12). Chart 12Decomposing Tech Outperformance
The Disruptor Delusion
The Disruptor Delusion
Meta’s Malaise Chart 13Unlike Economists, Facebook Just Ain't Cool No More
The Disruptor Delusion
The Disruptor Delusion
Which of today’s tech titans could join the “has been club”? As we flagged in August, Meta is certainly a possibility. In its disastrous quarterly earnings report, the company revealed that globally, the number of Facebook users is shrinking for the first time ever. While this came as a surprise to many investors, the writing has been on the wall for a long time. According to Piper Sandler’s survey of teen preferences conducted late last year, only 27% of teenagers used Facebook, down from 94% in 2012 (Chart 13). Meta has been fortunate in that many Facebook users have migrated to Instagram, a social media platform it acquired in 2012. Unfortunately, the latest data suggests that even Instagram usage is starting to slow as more young people flock to TikTok. Google Also Vulnerable Unlike Meta, Alphabet crushed earnings estimates. However, the similarities between the two companies may be greater than most investors are willing to admit. Like Facebook, Google’s profits almost entirely come from ad spending. According to eMarketer, Google garnered 44% of digital ad spending in 2021 while Facebook took in 23%. Digital advertising accounted for 63% of all ad spending in 2021, up from 58% in 2020 and 51% in 2019. While there may be scope for digital ads to take further market share, eventually, growth in digital ad spending will converge with overall consumption growth, which in the US is likely to average no more than 2% in real terms over time. Monopoly Power Another important similarity between Meta and Alphabet is that both companies are increasingly coming under scrutiny from politicians and regulators. The antitrust case brought against Alphabet by 14 US states contains a litany of allegations of unfair practices. After an initial failed attempt, the Federal Trade Commission’s antitrust suit against Meta is also moving forward. Privacy Matters In addition, the way big tech companies handle private data is raising some hackles. In its annual report filed earlier this month, Meta warned that it would need to shut down Facebook and Instagram in Europe unless regulators drew up new privacy regulations. This came on top of Meta’s disclosure that it will lose $10 billion this year after Apple introduced pop-ups on the iPhone’s operating system asking users if they wanted to be tracked by apps. Turn Off That Phone! Another looming worry revolves around the corrosive impact of excessive social media usage on mental health. Academic studies have shown that adolescents who use Facebook and Instagram frequently feel greater anxiety and unease than those who do not. The share of students reporting high levels of loneliness more than doubled in both the US and abroad over the past decade, a trend that predates the pandemic (Chart 14). In 2020, the last year for which comprehensive data is available, one-quarter of US girls between the ages of 12 and 17 reported experiencing a major depressive episode, up from 12% in 2011 (Chart 15). Chart 15The Rise In Depression Rates Coincided With Increased Social Media Usage
The Disruptor Delusion
The Disruptor Delusion
Chart 14Alone In The Crowd
The Disruptor Delusion
The Disruptor Delusion
Backlash Public contempt for tech companies is fueling a political backlash. According to a Gallup poll conducted last year, only 34% of Americans held a favorable view of tech companies such as Amazon, Facebook, and Google, down from 46% in 2019; 45% had an unfavorable opinion, up from 33% in 2019 (Chart 16). Chart 16Americans Do Not Hold Tech Companies In High Regard
The Disruptor Delusion
The Disruptor Delusion
The shift in public sentiment over the past two years has been entirely driven by Independent and Republican voters, many of whom feel that tech companies are unfairly censoring their opinions (Table 2). The same poll revealed that the majority of Americans – including the majority of Republicans – now favor increased regulation of tech companies. Table 2American Views On Big Tech
The Disruptor Delusion
The Disruptor Delusion
Investment Conclusions Chart 17Value Stocks Are Cheap
Value Stocks Are Cheap
Value Stocks Are Cheap
Considering that global growth is likely to remain above-trend this year, we do not expect tech stocks to decline in absolute terms. A flattish, though volatile, trajectory is the most plausible outcome. In relative terms, however, tech stocks will underperform. Despite having outperformed tech-heavy growth stocks by 14% since last November, value stocks remain exceptionally cheap by historic standards (Chart 17). Tech stocks are overrepresented in the US. Thus, if tech continues to underperform, it stands to reason that non-US equities will outperform their US peers over the coming years. Peter Berezin Chief Global Strategist peterb@bcaresearch.com Global Investment Strategy View Matrix
The Disruptor Delusion
The Disruptor Delusion
Special Trade Recommendations Current MacroQuant Model Scores
The Disruptor Delusion
The Disruptor Delusion

Executive Summary Inflation Expectations Likely Too Low
Inflation Expectations Likely Too Low
Inflation Expectations Likely Too Low
Inverted term structures for industrial commodities likely are being interpreted as forecasts of lower prices. This leads investors to assume the real economy will not be a source of persistent inflationary pressure. This is misguided: Backwardations (i.e., inverted forward curves) are evidence of tight markets facing severe upside price pressures, not lower prices ahead. Oil and base metals prices share a stronger relationship with US 5-year/5-year inflation expectations than gold, which is more correlated with short-term inflation expectations. Increases in US permanent unemployment are positively correlated with 5y5y inflation expectations. This suggests markets price in a more accommodative Fed as permanent unemployment increases, and vice versa. US PCEPI realized core inflation is negatively correlated with permanent unemployment levels, suggesting markets are pricing lower inflation as permanent unemployment rises, and vice versa. Bottom Line: Markets generally exhibit well-anchored inflation expectations. We believe these will be undone by profound backwardations in industrial commodities, which point to steadily increasing inflation pressures from the real economy to end-2023. Thereafter, oil and metals demand will continue to grow faster than supply, as the renewable-energy transition picks up steam. We remain long commodity-index exposure, and industrial-commodity producers' equity via ETFs. Feature Backwardated forward curves for industrial commodities – oil and base metals, in particular – are clear evidence these markets are pricing to severe physical supply deficits, which presently are being covered by drawing down inventories.1 These inverted term structures for industrial commodities likely are being interpreted as forecasts of lower prices, which leads investors to assume the real economy will not be a source of more permanent inflationary pressure. This is misguided, in our view: Profound inversions in the term structure of commodities (i.e., backwardations) are evidence of tight markets facing severe upside price pressures. Persistently tight supply-demand balances are keeping the forward curves of industrial commodities backwardated, as inventories are drawn down to cover physical supply deficits. These deficits are dramatically evident in oil markets (Chart 1) and copper markets (Chart 2), both of which are widely followed by investors and corporates alike. Chart 1Tight Oil Markets
Tight Oil Markets
Tight Oil Markets
Chart 2Coppers Physical Deficits Will Persist...
Coppers Physical Deficits Will Persist...
Coppers Physical Deficits Will Persist...
Higher Commodity Prices, Higher Inflation In Chart 3, we show the difference between the forecast outcome of US 5-year/5-year (US5y5y) CPI inflation expectations drawn from the CPI swap markets as a function of our internal oil-price forecasts and commodity forwards reflecting futures-contract settlements. These curves show the model based on the futures curve understates the expected path of inflation expectations versus our oil-price forecasts. When we used our higher oil price forecasts – based on the scenario where OPEC 2.0 and the US fail to increase oil supply in 2022 and 2023 – US5y5y rates tracked the increase in oil prices. The results of these forecasts show that oil prices, and more broadly, the real economy, feeds directly into inflation expectations. We modelled the US5y5y rates as a function of additional commodity prices as well – namely, copper and gold (Chart 4). The coefficients for commodity prices associated with the levels equation was always positive, irrespective of the commodity, implying that commodity prices and inflation expectations share a long-run equilibrium. We ran these regressions with nearer term forward inflation expectation rates as well, and found the direction of the relationship held.2 Chart 3Inflation Expectations Likely Too Low
Inflation Expectations Likely Too Low
Inflation Expectations Likely Too Low
Chart 4Consistent Relationships Between Commodities and Inflation Expectations
Consistent Relationships Between Commodities and Inflation Expectations
Consistent Relationships Between Commodities and Inflation Expectations
Gold Hedges Shorter-Term Inflation Expectations Gold prices had a stronger relationship to nearer-term forward inflation expectation rates than WTI and COMEX copper prices, in our modeling. On the other hand, WTI and COMEX copper prices had stronger relationships with longer-term forward inflation expectation rates than gold prices. These results suggest different commodities can be used to hedge different segments of the inflation-expectations term structure, which is a novel outcome to our modeling. This strongly suggests a portfolio of gold, copper and crude oil – using futures, commodity indices or physical assets – can hedge the inflation-expectations term structure. Labor Markets And Inflation Expectations We also modelled realized monthly inflation and US5y5y inflation expectations as a function of permanent job losses, a series maintained by the US Bureau of Labor Statistics (BLS). The coefficient associated with permanent job losses was positive (Chart 5). Increases in US permanent job losses are positively correlated with 5y5y inflation expectations. This suggests markets price in a more accommodative Fed in the future as permanent unemployment increases, and vice versa. This positive relationship holds even when WTI and copper prices are added as regressors to the equation. We also find that realized US PCEPI core inflation – the Fed's preferred gauge – is negatively correlated with permanent unemployment levels, suggesting markets are pricing lower inflation as permanent job losses increase (Chart 6). This also is intuitively appealing in the model, as it points toward the markets' assessments of Fed policy functions. Chart 5Labor Markets Also Effect Inflation Expectations
Labor Markets Also Effect Inflation Expectations
Labor Markets Also Effect Inflation Expectations
Chart 6Lower Inflation When Permanent Job Losses Rises
Lower Inflation When Permanent Job Losses Rises
Lower Inflation When Permanent Job Losses Rises
Investment Implications In earlier research, we showed commodity prices generally feed directly into realized inflation and inflation expectations (Chart 7).3 In the current report, we also showed that different commodities are better suited for hedging inflation expectations at different points along the inflation forward curve, which is a novel finding. We continue to expect the global energy transition to keep industrial commodities well bid for at least the next decade, as markets are forced to reconcile increasing demand for hydrocarbons and base metals with flat to declining supplies. On top of this, as we have noted in the past, there is a growing list of exogenous threats to the supply side. Among them are the election of left-of-center governments in important commodity-producing states, which have campaigned on redistributionist agendas; climate activism at the board level at major energy suppliers and in the courtroom, and mounting calls for still-undefined ESG compliance. Chart 7Commodity Indices Move Closely With Inflation Expectations
Commodity Indices Move Closely With Inflation Expectations
Commodity Indices Move Closely With Inflation Expectations
All of these threats – not to mention increasing geopolitical threats globally – add uncertainty to the evolution of commodity markets and increase the costs of producing commodities. As supply curves become more inelastic, higher prices for these commodities will be required to allocate capital and ration demand. We remain long commodity-index exposure, and industrial-commodity producers' equity via ETFs. Robert P. Ryan Chief Commodity & Energy Strategist rryan@bcaresearch.com Ashwin Shyam Research Associate Commodity & Energy Strategy ashwin.shyam@bcaresearch.com Commodities Round-Up Energy: Bullish US liquified natural gas (LNG) exports surged to an average of 11.2 Bcf/d last month, an 8% increase from the 10.4 Bcf/d shipped ex-US in 4Q21, according to the US EIA. Continued strength in Asia and Europe were responsible for the increase. The EIA cited the low level of European inventories for the sharp move higher. We have been expecting European demand to remain strong coming out of winter, as inventories are rebuilt (Chart 8). Exports are expected to average 11.3 Bcf/d this year, or 16% above 2021 levels. Base Metals: Bullish LME aluminum prices hit their highest since 2008, on the back of low inventory levels and supply disruptions (Chart 9). Industrial metals generally are facing tight markets, with nickel hitting a decade high earlier this year. Towards the end of last year, Zinc prices started rising and are now closing in on the decade high seen in October 2021. Low inventories of these metals in different parts of the world are backwardating forward curves and causing prices to rise. For example, according to data from World Bureau of Metal Statistics, Zinc LME stocks were only at 1,650 tons in December in Europe. Reduced supply and refining activity in Europe and China, have contributed to these markets’ tightness. In Europe, high power prices have caused smelters to stop production, while in China, refining activity has fallen due to the country’s zero-COVID tolerance policy. Precious Metals: Bullish According to the Australian Department of Industry, Science, Energy and Resources, the semiconductor chip shortage is expected to result in 7.7 million fewer vehicles being made in 2021. According to data from SFA Oxford via Heraeus, in 2021, automotive demand is forecast to constitute 80% of total palladium demand. The underperforming automotive sector, which makes up a significant chunk of palladium demand, led to Palladium being one of the worst performing commodities in 2021. The chip shortage will persist into 2022, pressuring automotive demand for platinum and palladium. Weak auto production will affect platinum to a lesser extent, since demand from automotive manufacturing constitutes just ~30% of total demand. Recently, however, palladium prices rose on geopolitical uncertainty arising from the escalating Russia-Ukraine conflict. Russia constitutes ~ 43% of global palladium production. Chart 8
Commodities Unmoor Inflation Expectations
Commodities Unmoor Inflation Expectations
Chart 9
Aluminum Hitting Highs
Aluminum Hitting Highs
Footnotes 1 Chart on p. 1 (Chart 3 below) shows the impact the backwardation in crude oil has on forecasted US 5-year/5-year inflation expectations in Model Output 2. The backwardation in Model Output 3 lowers the US5y5y estimate, while our forecast for higher prices raises the inflation expectation. We have written at length on this topic, most recently in our reports of on January 27, 2022, Short Squeezes In Copper, Nickel Highlight Tight Metals Markets, on January 6, 2022, Persistent Inflation Pressures From Commodities and on November 4, 2021, in a report entitled Despite Weaker Prices Crude Oil Backwardation Will Persist. These reports are available at ces.bcaresearch.com. 2 COMEX copper and WTI oil futures are stronger regressors in explaining US5y5y – i.e., their shared long-term trend (i.e., cointegration) is stronger (statistically speaking) than gold futures. This is particularly evident in the regressions of US5y5y employing realized CPI monthly inflation and US real exchange rates as additional explanatory variables in the equations using the industrial-commodity prices. It is worthwhile noting that the 3-year forward WTI futures contract as a lone regressor for US5y5y inflation expectations continues to produce some of the strongest results in our modelling exercise. Indeed, as a sole regressor, it dominates the other models. 3 Please see More Commodity-Led Inflation On The Way and Persistent Inflation Pressures From Commodities published on December 9, 2021 and on January 6, 2022, respectively. Both are available at ces.bcaresearch.com. Investment Views and Themes Strategic Recommendations Trades Closed in 2021
Image
Executive Summary A Floor In Biden’s Approval?
Biden’s Floor, Republican Cracks
Biden’s Floor, Republican Cracks
Biden’s approval rating is forming a bottom. Democrats will pivot away from Covid-19 to boost the economy and consumer sentiment. While Democrats face a dismal midterm election, Republican infighting could conceivably cost the GOP control of the Senate. Policy uncertainty will rise as the election approaches. Republican infighting is unlikely to affect the outcome in the House of Representatives, although Republicans could lose three-to-nine seats that they might otherwise hold if the party establishment fails to coordinate effectively with former President Trump as we expect. Our tactical trades hinge on Biden’s near-term external risks: the risk of an energy shock that weighs on Treasury yields and pushes up the dollar. Defensives like health care should benefit. Our cyclical recommendations continue to favor cyclical equities such as small cap energy stocks. Bottom Line: Investors should be tactically prepared for geopolitical risks to push up the dollar and push down Treasury yields in the short run, contrary to the cyclical BCA House View. Feature Has Biden’s Approval Hit The Floor? Probably. President Biden’s net approval rating is still under water at -9%, only slightly better than President Trump’s at this stage in the approach to the 2018 midterm elections. Biden’s handling of the economy receives a lower approval rating, which is dangerous for his party because the economy is likely to be the most important issue in the midterm election, given that the Covid-19 pandemic is waning. If Biden follows the path of his predecessors then his approval rating will trend upward as the midterm approaches. That will not prevent a Republican victory in the House but it could affect the Senate and the size of the Republican majority (Chart of the Week). The latest jobs report saw 467, 000 new jobs created. The labor participation rate grew from 81.9% to 82%, while women’s participation rose from 56.5% to 56.8%. The unemployment rate ticked up from 3.9% to 4%, with the broader U6 measure rising from 7.2% to 7.9%, but the reason was that more workers joined the workforce, which is a good thing for the economy (Chart 1). The Omicron variant of the Covid-19 virus is having little impact so the labor market is continuing to heal, a positive for the Biden administration, which is otherwise struggling. Chart 1A Solid Jobs Report
A Solid Jobs Report
A Solid Jobs Report
American sentiment about the economy will hinge on inflation. If inflation abates along with the virus then the Democratic Party will be able to pare some losses in the midterms. At the moment the polarization of economic sentiment – divergence based on partisan affiliation – is declining, but for reasons that will give the administration a headache. Democratic sentiment is falling while Republican sentiment is improving (Chart 2). If inflation stays high, Republican sentiment will tick back down and the public will be increasingly united in a negative view of the president’s economic management. If inflation peaks and rolls over, Democratic sentiment will recover as the election approaches and Republican sentiment will at least not get much worse. Chart 2Economic Sentiment Polarization In Decline
Economic Sentiment Polarization In Decline
Economic Sentiment Polarization In Decline
For this reason Biden and the Democrats are rapidly pivoting away from Covid-19 and social restrictions and trying to create the “return to normalcy” that failed last year. While they were in the opposition they had an interest in hyping the virus but now they are the incumbents and it is important to show that the pandemic is in the rear-view mirror. With 64% of Americans now vaccinated, and 40% having received booster shots, government social restrictions are likely to become less stringent (Chart 3). The latest data from the service sector will motivate this policy pivot away from the virus. The manufacturing sector improved again last month but the non-manufacturing sector was less upbeat in January. Services activity declined by a whopping 12% in January. It is still above its November 2020 level, when Biden got elected, but only by around 2.2%. The non-manufacturing employment index declined by 4.3% and only stands 0.8% above its November 2020 level. The ratio of new orders to inventories declined by 0.6% in January (Chart 4). Chart 3Democrats To Pivot Away From Covid-19
Democrats To Pivot Away From Covid-19
Democrats To Pivot Away From Covid-19
These statistics suggest that the non-manufacturing sector slowed down sharply in January, probably due to omicron and post-Christmas belt tightening. But employers did not let go of a lot of workers, as seen by the discrepancies between business activity and employment. The mostly positive jobs report reinforces this point. The weakness is seen as temporary and employers expect higher demand in coming months. Now that consumer durable spending is running out of steam (at least, excluding cars), consumers are likely to switch to consuming services, as long as services are open for them to consume. There is little reason to think restrictions will stay tight, given the political points cited above. Even in Europe the Covid “hawks” are loosening controls. Chart 4Democrats Want To Boost Service Sector
Democrats Want To Boost Service Sector
Democrats Want To Boost Service Sector
All that being said, the Biden administration has limited ability to control inflation that emanates from foreign supply shocks (e.g. Asia, Russia, Iran). Also voter perceptions of inflation will lag, even if inflation starts to abate. Crime and immigration will also weigh on the administration this fall. And the political clockwork favoring the opposition in midterm elections is remorseless. Bottom Line: Biden and the Democrats are likely to shift policy focus away from emphasis on the pandemic, which weighs on the service sector and employment, and instead pursue other policy options in preparation for the midterm election. The outlook is not positive but if Biden’s approval rating bottoms then Democrats’ chances of performing better in the midterm elections will rise and policy uncertainty will also rise. Will GOP Infighting Affect The Midterms? Maybe In The Senate Former President Trump clashed with former Vice President Mike Pence and others in the Republican Party over whether Pence had the right “to change the Presidential Election results” in 2020 by refusing to validate electoral college votes from states in which electoral fraud was alleged. Pence called the idea “un-American” and reiterated his position that the vice president has no “unilateral authority” to discard a state’s electoral votes while certifying the electoral count.1 Trump lashed out because moderate Republicans are flirting with Democrats over how to pass a bipartisan revision to the Electoral Count Act of 1887, which left a number of ambiguities in the US electoral process, including about the vice president’s role in election certification. It is conceivable that the law will be revised in time for the 2024 election but odds are against a quick solution: the original law took 10 years to pass. Throughout the 2022-24 election cycle, Trump will continue to clash with his party, which raises the single greatest risk to Republicans: that they will be too divided to capitalize fully on the Democrats’ weaknesses. We do not expect Trump to coordinate effectively with Republicans. His interest in revolutionizing the political establishment and winning a second term in 2024 diverges from the interest of the traditional Republicans, who want to preserve the political establishment with themselves on top, and want a fresh face to contend for eight years in the White House in 2024. However, Trump controls a plurality of the party’s grassroots voters (about 54%2 according to opinion polls) so that the Republican Party cannot afford to spurn him. If Trump were willing to cooperate with party leaders, then he would have cooperated when it mattered most: ahead of the Georgia special elections on January 5, 2020. If he had recognized the constitutional supremacy of the electoral college vote, he might have saved Republican control of the Senate. He did not, so the burden of proof falls on those who say that Trump can coordinate effectively with the Republican Party at critical junctures. Most likely the party will continue to play both sides, keeping Trump in the party but seeking a post-Trump future. Trump will continue to pursue the Republican nomination in 2024 and the party will have to acquiesce to him as long as he retains the support of a majority of the party’s grassroots. Trump’s conflict with the party will flare up in the primary elections this spring because Trump will endorse his own favorite candidates regardless of whether the Republican establishment agrees and views them as the most likely to win. Any success of Trump-backed populists in the primaries may become a liability for Republicans in the general election if the seat is competitive and the Democrats put up a moderate candidate. This point is primarily relevant in the Senate: Five Senate Republicans are stepping down, leaving an open competition in Alabama, Missouri, North Carolina, Ohio, and Pennsylvania (Table 1). The last three of these (NC, OH, PA) are competitive seats, especially if the Republican candidate is weak and Biden’s approval revives by the time of the vote. Trump has only made an endorsement in North Carolina, where his candidate is far from assured to win. Given that control of the Senate could hang on a single seat, it is at least possible that Trump’s split with the GOP could affect the Senate balance of power in 2023-24. Table 1Senate Incumbents Not Seeking Re-Election, 2022
Biden’s Floor, Republican Cracks
Biden’s Floor, Republican Cracks
Trump will also have an impact on the House of Representatives but he is less likely to affect the outcome of the midterm there, given that Republicans are likely to win 40 seats when they only need five to take control. There are a lot more Democrats retiring from the House than Republicans in this cycle, a positive indication for Republicans (Chart 5). In total there are 48 competitive seats (13 Republican-leaning, 22 Democrat-leaning, and 13 toss-up).3 Of these 48 competitive seats, 12 seats are “open” (no incumbent), divided evenly among Republicans and Democrats. In most of these competitive seats, but especially in Democrat-leaning seats and toss-up seats, a Trump-backed Republican will have a harder time winning than a traditional Republican. All ten Republicans who voted to impeach President Trump after the January 6 rebellion are vulnerable to Trump challengers (Table 2). Three are already retiring. Given that Wyoming Representative Liz Cheney won her seat by a 44% margin, and yet is polling poorly relative to her Trump-backed challenger, it is fair to say that all seven of the remaining Republican impeachers are vulnerable to a Trumpist challenge. Of these, the general election could be competitive in five seats, i.e. those held by John Katko (R, NY-24), David Valadao (R, CA-21), Peter Meijer (R, MI-3), Fred Upton (R, MI-6), and Jaime Herrera Beutler (R, WA-3). However, given that the national tide does not favor the Democrats, five seats is the maximum that Democrats could poach from this group of lawmakers due to Republican infighting (three is a more likely number). Chart 5House Members Not Seeking Re-Election, 2022
Biden’s Floor, Republican Cracks
Biden’s Floor, Republican Cracks
Table 2House Republicans Who Voted To Impeach President Trump
Biden’s Floor, Republican Cracks
Biden’s Floor, Republican Cracks
More broadly there are 21 moderate Republicans in the House whose seats could be vulnerable to intra-party struggle (Table 3): So far President Trump has only endorsed candidates in seats which Republicans are highly likely to win anyway: namely Beth Van Duyne (R, TX-24), Mario Diaz-Balart (R, FL-25), and Carlos Gimenez (R, FL-26). But as the primary heats up, Trump’s endorsements could cause more tension with the Republican Party machinery. The following six moderate Republicans’ seats could be at risk: Maria Elvira Salazar (R, FL-27), Rodney Davis (R, IL-13), Jeff Van Drew (R, NJ-2), Andrew Garbarino (R, NY-2), Mike Turner (R, OH-10), and Brian Fitzpatrick (R, PA-1). Of these, Fitzpatrick and Garbarino do not face any challengers yet, and only Davis faces a Trump-backed challenger. So six is the maximum Democrats could steal while one-to-three vulnerable seats is more likely. Table 3Republican Moderates Vulnerable To Populist Challengers
Biden’s Floor, Republican Cracks
Biden’s Floor, Republican Cracks
Summing up, the Republican Party could fail to retain three-to-nine Republican seats that they might otherwise win in this cycle. Previously we put the number at five-to-nine seats. These numbers do not include any Democratic-leaning seats that Republicans could fail to poach if they choose a populist candidate who is not competitive in a “purple” state or district. In conclusion, Republican infighting will not prevent Republicans from retaking the House of Representatives this fall. Cyclical factors in favor of Republicans will overwhelm their internal differences. But infighting could leave them with a smaller majority than consensus expects. In 2024 Republican internal divisions will become much more important than in 2022. A competitive Republican primary election for president will reduce Republican odds in the general election. If President Trump fails to win the nomination, he could defect and form his party. If he wins the nomination, Liz Cheney or another traditional Republican could defect and run as a third party, acting as a spoiler. Given the tight margins of victory in presidential elections, even a splinter group could steal enough votes to determine the outcome. The midterms will shed light on the depth of GOP divisions but in general these divisions reinforce our view that while Democrats will perform poorly in the midterms, they are still favored to retain the White House in 2024. Bottom Line: While the odds are stacked against Democrats in the midterms, Republican infighting could affect several Senate seats and will subtract anywhere from three-to-nine seats from expected seat gains in the House. While control of the House will not be affected, it is conceivable that control of the Senate could hang in the balance. Policy uncertainty will rise if Republican infighting makes Senate races more competitive later this year. Housekeeping To conclude we offer a few remarks on our outstanding investment recommendations: Cyclically Long Energy Small Caps: US energy production is rising in keeping with global oil and commodity prices. West Texas Intermediate crude sells for $89 per barrel on the spot market, inventories are drawing, OPEC 2.0 is intact, and there are plenty of supply risks on the horizon. American natural gas exports are picking up but not enough to meet demand if conflict in Ukraine causes a European shortage, while US oil exports are falling (Chart 6). Chart 6US Energy Production Picking Up
US Energy Production Picking Up
US Energy Production Picking Up
Evidence from initial unemployment claims in O&G-dependent states like North Dakota and Wyoming suggests that shale producers need more time to ramp up production (Chart 7), as highlighted by our Commodity Strategist Bob Ryan. Small cap energy stocks have not benefited much from the sharp spike in energy prices this year. We see this as an opportunity, given that US small caps are insulated from geopolitical troubles and will become key players if shortages occur (Chart 8). The risk comes if the supply response overwhelms the supply disruptions, as occurred in 2014 – but oil companies were in a much better position to surge production at that time. The 2015 nuclear deal with Iran also appeared more durable at that time than it will this year if it is rejoined, and there is no guarantee it will be rejoined. Cyclically Long Infrastructure Stocks: Infrastructure stocks peaked along with the equity market and in the wake of the Biden administration’s $550 billion Infrastructure Investment and Jobs Act, which is now being implemented. Indicators of infrastructure construction peaked in late 2020 and early 2021 and are slipping of late. But as long as the economy does not relapse into recession they should stabilize, especially as the virus wanes and global demand recovers (Chart 9). Cyclically Long Cyber-Security Stocks: Global threats, proxied by the Canadian dollar’s exchange rate with the Russian ruble, suggest that cyber security stocks will rebound after getting caught up in the current tech selloff (Chart 10). Tech stocks are also likely to bounce if inflation expectations peak as the Federal Reserve kicks into action. Chart 7It Takes Time To Boost Shale Output
It Takes Time To Boost Shale Output
It Takes Time To Boost Shale Output
Chart 8US Small Caps Yet To Benefit From Oil Price
US Small Caps Yet To Benefit From Oil Price
US Small Caps Yet To Benefit From Oil Price
Chart 9Buy The Dip In Infrastructure Stocks
Buy The Dip In Infrastructure Stocks
Buy The Dip In Infrastructure Stocks
Chart 10Cyber Stocks A 'Buy' In Tech Selloff
Cyber Stocks A 'Buy' In Tech Selloff
Cyber Stocks A 'Buy' In Tech Selloff
Investment Takeaways Chart 11A Floor In Biden’s Approval?
Biden’s Floor, Republican Cracks
Biden’s Floor, Republican Cracks
US financial markets do not care about the midterm elections in the near term but that will change as policy uncertainty will rise over the course of the year. A bottom in Biden’s approval rating (Chart 11) and Republican primary election infighting both suggest that the Democratic Party’s odds in the midterms will improve going forward, raising policy uncertainty, especially over the Senate. Midterm uncertainty typically works in favor of the US dollar, Treasuries, defensive equity sectors, and growth stocks. As such it poses a risk to current market trends. The recent selloff in Big Tech confirms what we have argued since we launched the US Political Strategy: the tech sector faces a slow boil from inflation and rising interest, which are more immediate threats than government regulation. Having said that, we favor growth versus value on a tactical basis as we expect the dollar to rise and Treasury yields to fall on the back of geopolitical risks in the near term (Chart 12). Chart 12A Tactical Bounce For Tech Stocks?
A Tactical Bounce For Tech Stocks?
A Tactical Bounce For Tech Stocks?
Matt Gertken Senior Vice President Chief US Political Strategist mattg@bcaresearch.com Jesse Anak Kuri Associate Editor jesse.kuri@bcaresearch.com Footnotes 1 See Vice President Michael R. Pence’s letter, dated January 6, 2021, available at “Read Pence’s full letter saying he can’t claim ‘unilateral authority’ to reject electoral votes,” PBS, pbs.org. See also Mychael Schnell, “Trump says he wanted Pence to overturn election, eyes effort to reform law,” January 31, 2022, and Brett Samuels, “Pence breaks with Trump: ‘I had no right to overturn the election,’” February 4, 2022, thehill.com. 2 Please see “Over half of Americans believe the country's economy is headed in the wrong direction,” Ipsos, December 29, 2021, Ipsos.com 3 See Cook Political Report, “2022 House Race Ratings,” February 8, 2022, cookpolitical.com. Strategic View Open Tactical Positions (0-6 Months) Open Cyclical Recommendations (6-18 Months) Table A2Political Risk Matrix
Biden’s Floor, Republican Cracks
Biden’s Floor, Republican Cracks
Table A3US Political Capital Index
Biden’s Floor, Republican Cracks
Biden’s Floor, Republican Cracks
Chart A1Presidential Election Model
Biden’s Floor, Republican Cracks
Biden’s Floor, Republican Cracks
Chart A2Senate Election Model
Biden’s Floor, Republican Cracks
Biden’s Floor, Republican Cracks
Table A4APolitical Capital: White House And Congress
Biden’s Floor, Republican Cracks
Biden’s Floor, Republican Cracks
Table A4BPolitical Capital: Household And Business Sentiment
Biden’s Floor, Republican Cracks
Biden’s Floor, Republican Cracks
Table A4CPolitical Capital: The Economy And Markets
Biden’s Floor, Republican Cracks
Biden’s Floor, Republican Cracks
Feature
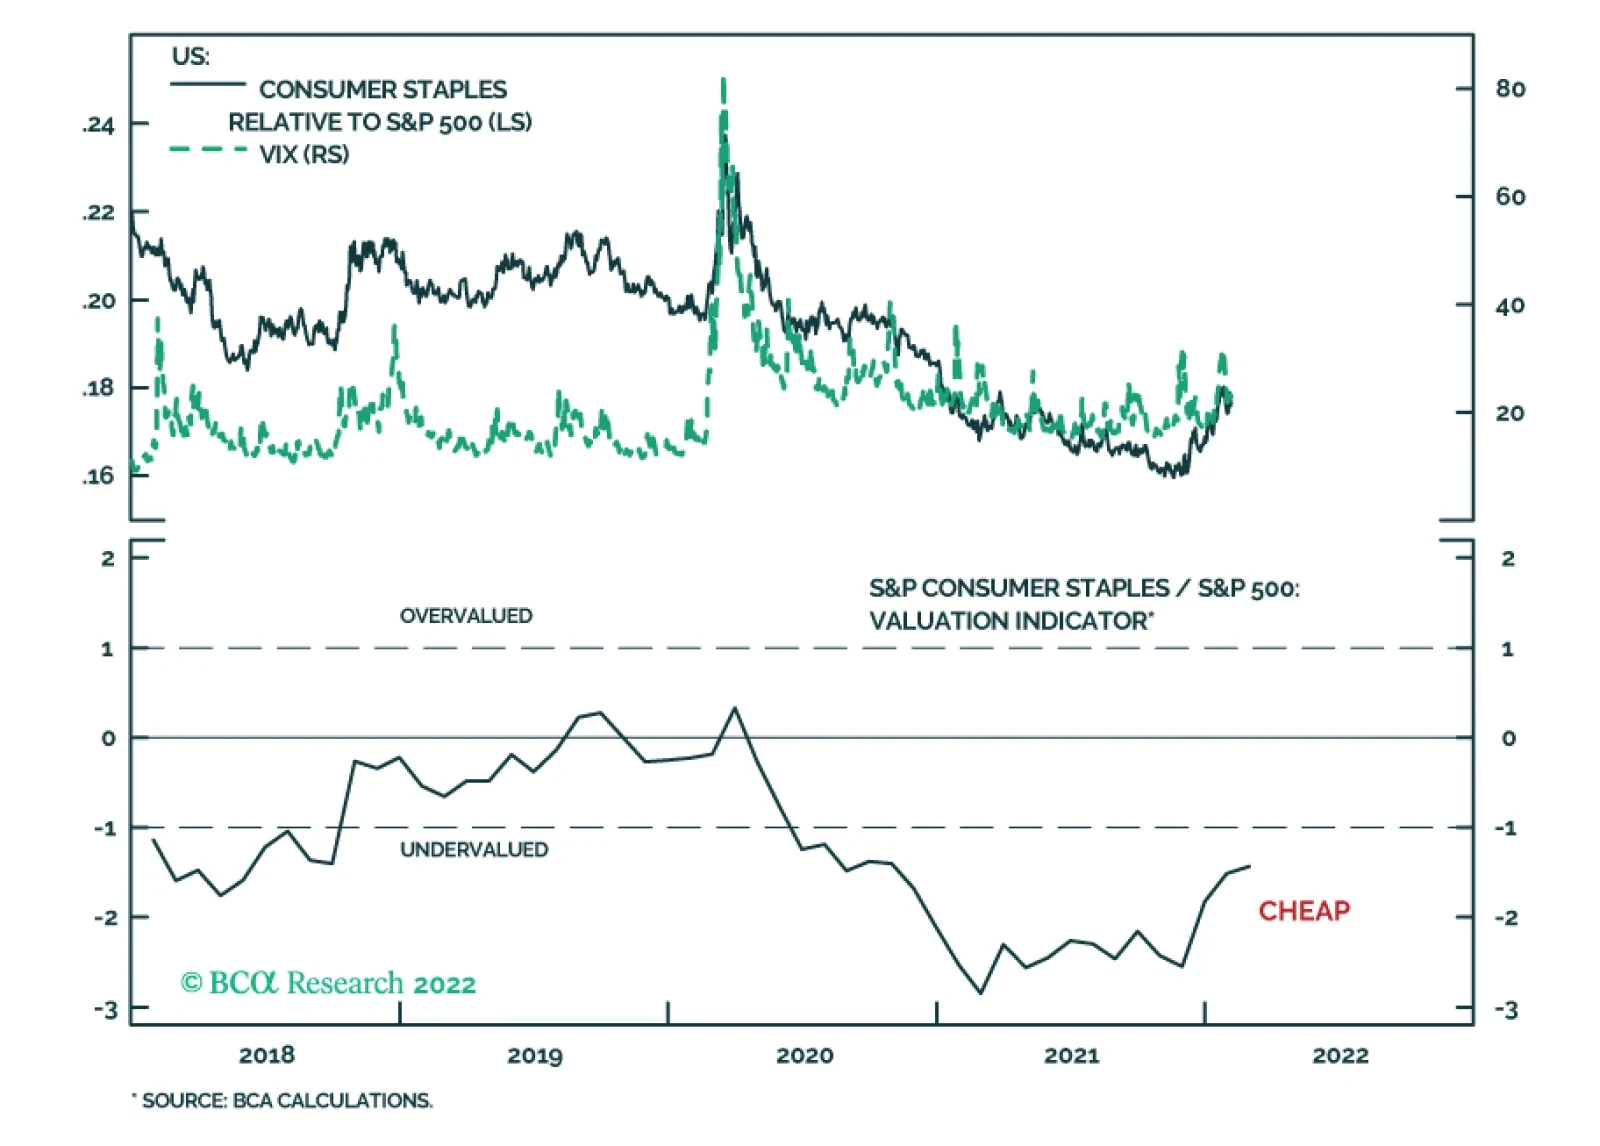
Upgrading Consumer Staples
Upgrading Consumer Staples
In our latest Sector Chart Pack, we initiated a new overweight position in the S&P Consumer Staples index. Staples outperformed the S&P 500 by 4% YTD. Staples stocks are a “deep” defensive industry that offers downside protection in an environment of heightened volatility, slowing economic growth (top panel), and the hawkish Fed. Consumer confidence has also been deteriorating for a while (bottom panel) as Americans are disheartened by prices in the supermarket and at the gas station. However, demand for consumer staples is inelastic and should be inflation-proof. The sector is trading at 21x forward multiples and is expected to grow earnings at 6% over the next 12 months, slightly trailing the 8% growth number for the S&P 500. Bottom Line: Overweight the S&P Consumer Staples index to reduce portfolio volatility.
Executive Summary The End Of The Negative Bond Yield Era
Europe Joins The Global Bond Bear Market
Europe Joins The Global Bond Bear Market
Recent price action in developed market government bond markets confirms a backdrop that has been in place for the past several years - movements in US Treasuries define the trend in global yields, but Europe sets the effective floor. Higher core European bond yields are also pushing up non-European yields, in the context of the current global monetary policy tightening cycle. The hawkish market pricing for the ECB this year has gone a bit too far, as the start of European rate hikes this year is more likely in Q4 than in the summer – and only after ECB asset purchases begin to formally wind down. In the UK, the Bank of England appears to be trying to front load policy tightening, both rate hikes and balance sheet runoff, in response to overshooting UK inflation. A shorter, sharper policy tightening cycle means that the UK Gilt curve will continue to bear-flatten. Bottom Line: Within the “Big 3” developed market central banks, the Fed and Bank of England are more likely to deliver discounted rate hikes than the ECB over the next 6-12 months. Remain underweight US Treasuries and UK Gilts versus German Bunds in global bond portfolios. Feature Chart 1A Global Repricing Of Interest Rate Expectations
A Global Repricing Of Interest Rate Expectations
A Global Repricing Of Interest Rate Expectations
Persistent elevated inflation readings are forcing policymakers to move up the timetable of expected cyclical interest rate increases, but without signaling any change to longer-term interest rate expectations. The result has been an upward move in bond yields led by a repricing of shorter-term yields, leading to bearish yield curve flattening pressure across the developed markets (Chart 1). As the global bond bear market has intensified and broadened across countries and fixed income sectors, the amount of bonds worldwide with negative yields has been slashed by $9 trillion since December (Chart 2). Some notable examples: the 10-year German Bund yield is now up to +0.26%, the 30-year US real TIPS yield is now at +0.04% and even the 5-year Japanese government bond yield climbed to +0.02% for the first time since 2016. Last week, bond markets had to digest both a 25bp Bank of England (BoE) rate hike - that was almost a 50bp move - and a huge upside surprise in the January US employment report. However, it was the more hawkish-than-expected messaging from the European Central Bank (ECB) that really rattled fixed income markets. At the February monetary policy meeting, ECB President Christine Lagarde opened the door to potential ECB rate hikes this year, a notable change from the previous forward guidance that rates would stay unchanged in 2022. This not only triggered a major decline in European government bond prices, but also notable jumps in bond volatility for both longer-term and, especially, shorter-term yields. Implied volatilities for swaptions on 2-year European swap rates now sit at the highest levels since the depths of the European Debt Crisis in 2011 (Chart 3). Chart 2The End Of The Negative Bond Yield Era
The End Of The Negative Bond Yield Era
The End Of The Negative Bond Yield Era
Chart 3The Front-Ends Of Yield Curves Awaken
The Front-Ends Of Yield Curves Awaken
The Front-Ends Of Yield Curves Awaken
Overnight index swap (OIS) curves are now discounting multiple rate hikes from the Fed (+127bps), BoE (+125bps) and ECB (+46bps) this year. Tighter monetary policy is the inevitable consequence of the current combination of steady above-trend growth, tight labor markets and very high inflation in those countries. This mix will continue to put upward pressure on global bond yields through a blend of steady inflation expectations and higher real yields as pandemic era monetary stimulus is removed – a process that is already underway in the US and Europe (Chart 4). Our Central Bank Monitors – designed to measure the cyclical pressure to change monetary policy – are all indicating the need for tightening in the US, UK and euro area. However, the risk is that tightening perceived to be too aggressive or too rapid will be received poorly by financial markets that have grown accustomed to easy money policies during the pandemic. Given the current starting point of high equity valuations and relatively tight corporate credit spreads in the US, financial conditions are no impediment to additional Fed rate hikes in 2022 (Chart 5). The same cannot be said in the UK, where the steady appreciation of the trade-weighted pound is tightening financial conditions, on the margin. In the euro area, financial conditions remain relatively stimulative, as the euro is undervalued on a trade-weighted basis. Chart 4A Recipe For Even Higher Bond Yields
A Recipe For Even Higher Bond Yields
A Recipe For Even Higher Bond Yields
Given high realized inflation, financial stability concerns are playing a secondary role in the policy deliberations of central banks facing an inflation-fighting credibility crisis. In the absence of a big fall in inflation, it will take much larger selloffs in equity and corporate credit markets than what has occurred so far in 2022 before policymakers would step back from interest rate increases over the next year. Chart 5Financial Conditions Are No Impediment To Rate Hikes
Financial Conditions Are No Impediment To Rate Hikes
Financial Conditions Are No Impediment To Rate Hikes
The ECB Will Lag The Fed On Rate Hikes Chart 6Faster Growth & Slower Inflation Expected In 2022
Faster Growth & Slower Inflation Expected In 2022
Faster Growth & Slower Inflation Expected In 2022
One of our highest conviction bond market views to begin 2022 called for US Treasuries to underperform German Bunds. Our view was based on the likelihood that the Fed would lift the fed funds rate multiple times this year and the ECB was likely to hold off on rate hikes until the first half of 2023 at the earliest. Last week’s shift in the ECB’s tone does not change that relative call. The Fed is still under far greater pressure to hike rates than the ECB, even if there is now a greater chance that the ECB could begin to tighten by the end of 2022. From an economic growth perspective, both central banks have good reasons to consider withdrawing monetary accommodation. The economic expectations in both the US and euro area have started to recover, according to the ZEW survey of financial market professionals, with a bigger bounce seen in the latter since the trough of last October (Chart 6). The fading Omicron wave is likely playing a large role in lifting economic expectations, as the variant has proven to be less lethal than previous waves of the virus. The ZEW survey also asks respondents about their views on future inflation and interest rate changes. The ZEW Inflation Expectations index has fallen back to pre-pandemic lows in both the US and euro area, indicating that a majority expect lower inflation in the US and Europe over the next year. Both the Fed and ECB also expect inflation to fall from current elevated levels this year. However, there is still a much stronger case for tightening in the US given the tight labor market that is pushing up wages. Last week’s January US payrolls data was a shocker, with employment rising +476,000 on the month when some forecasters were calling for an outright contraction in jobs due to the impact of the Omicron variant. Wage growth accelerated smartly, with average hourly earnings up 0.7% on the month and 5.7% on a year-over-year basis (Chart 7). This continues the trend of wage acceleration seen in other data series like the Employment Cost Index, confirming that the US labor market is tight enough to elicit a strong policy response from the Fed. In the euro area, the recent economic data has been a bit more mixed. The Markit manufacturing PMI rose to a five-month high of 59.0 in January, beating expectations. However, the services PMI fell to a nine-month low of 51.2 as renewed COVID lockdowns weighed on consumer confidence and spending (Chart 8). With Omicron numbers now slowing, some recovery in consumer spending is likely over the next few months as euro area governments reduce restrictions. However, the manufacturing recovery will struggle to gain significant upside momentum without stronger demand for European exports – an outcome that is not currently heralded by an upturn in reliable indicators like the global leading economic indicator or the China credit impulse (Chart 9). Chart 7Persistent US Labor Market Strength
Persistent US Labor Market Strength
Persistent US Labor Market Strength
Chart 8A Mixed Picture On European Growth
A Mixed Picture On European Growth
A Mixed Picture On European Growth
Even within the euro area inflation data, there are mixed trends that make it less clear that a major tightening cycle is necessary. Headline euro area HICP inflation hit a 37-year high of 5.1% in January, which was heavily influenced by a 28.6% rise in the energy component of the index (Chart 10). Goods price inflation reached 6.8%, its highest level since 1991, fueled by global supply chain disruptions and greater consumer demand for goods versus services during the pandemic. For the latter, services inflation reached a much more subdued 2.4% in January, in line with core HICP inflation of 2.3%. We expect goods price inflation to slow substantially, on a global basis and not just in Europe, as supply chain disruptions ease over the course of 2022 and consumers shift spending back towards services from durable goods as economies reopen post-Omicron. Chart 9A Gloomy Picture For European Exports
A Gloomy Picture For European Exports
A Gloomy Picture For European Exports
Chart 10European Inflation Surge Focused On Energy & Goods
European Inflation Surge Focused On Energy & Goods
European Inflation Surge Focused On Energy & Goods
Surging oil and natural gas prices will keep the energy component elevated over the next few months, particularly if geopolitical tensions over Ukraine result in Russia withholding natural gas supplies to Europe. Yet it is not clear how much of this will pass through to core inflation, which actually decelerated in January from the 2.6% pace seen in December 2021 despite surging energy prices. What does a typical ECB liftoff look like? Should the ECB focus more on the headline or core inflation numbers when deciding if rate hikes are necessary later this year? The answer may lie more in the breadth across countries, rather than depth across sectors, of euro area inflation pressures. In the relatively short history of the ECB, dating back to the inception of the euro in 1998, there have been only three monetary tightening episodes that involved interest rate increases: 1999-00, 2006-08 and 2011. In Chart 11, we show the percentage share of individual euro area countries that have accelerating growth momentum (measured as a leading economic indicator above the level of a year earlier), and with headline/core inflation above the ECB’s 2% target. In all three of those past ECB tightening episodes, essentially all euro area countries had to see strong growth or inflation at or above the ECB target before the ECB would hike rates. Chart 11The Growth & Inflation Conditions For An ECB Rate Hike Are In Place
The Growth & Inflation Conditions For An ECB Rate Hike Are In Place
The Growth & Inflation Conditions For An ECB Rate Hike Are In Place
Chart 12Watch European Wages To Determine The ECB's Next Move(s)
Watch European Wages To Determine The ECB's Next Move(s)
Watch European Wages To Determine The ECB's Next Move(s)
A similar story can be told looking at the state of the euro area labor market. The 1999-00 and 2006-08 tightening cycles occurred when nearly all euro area countries had an unemployment rate below the OECD’s estimate of the full employment NAIRU (Chart 12). Only in 2011, which was widely regarded as a major policy error, did the ECB hike rates without widespread labor market strength across the euro area. Right now, the breadth of the growth and inflation data across the euro area would indicate that the ECB will soon begin to tighten policy, if history is any guide. The one missing piece of the puzzle is faster wage growth. Euro area wage growth is severely lagging compared to other developed economies. For the last known data point in Q3/2021, wages were only growing at a 1.5% year-over-year rate. Wage growth has very likely accelerated since then, with the overall euro area unemployment rate now down to an all-time low of 7.0%, well below the OECD NAIRU estimate of 7.7%. The ECB will need to see confirmation of that faster wage growth in the data, however, before embarking on a path of rate hikes. Since last week’s ECB meeting, numerous ECB officials – including President Lagarde - have stated that asset purchases must stop before rate hikes can begin. While the ECB’s pandemic emergency bond buying program is set to end next month, the existing Asset Purchase Program is set to continue with no expiry date. If the ECB officials are to be taken at their word, it is very difficult to imagine a scenario where asset purchases would be fully wound down (i.e. net purchases of zero, with buying only to replace maturing bonds held by the ECB) before the July liftoff date now priced into the Euro OIS curve. Such a rapid removal of the ECB bid would be very disruptive to the riskier parts of European fixed income markets, like Italian and Greek sovereign debt, that have benefited from heavy ECB buying under the pandemic bond buying program. European bond strategy implications While an ECB rate hike in 2022 is now a more probable scenario, it is not yet a done deal. The European growth picture remains mixed, and inflation readings outside of supply-constrained energy and durable goods – including wages - are far less threatening than headline inflation. At the moment, underlying inflation pressures are far more intense in the US. Durable goods inflation in the US reached 16.8% on a year-over-year basis last month, but climbed to “only” 3.8% in Europe (Chart 13). The Cleveland Fed’s trimmed mean CPI index accelerated to 4.8% in January, compared to 3.0% for the euro area trimmed mean CPI inflation gauge constructed by our colleagues at BCA Research European Investment Strategy. Chart 13Stay Positioned For A Wider UST-Bund Spread
Stay Positioned For A Wider UST-Bund Spread
Stay Positioned For A Wider UST-Bund Spread
The Fed has a lot more work ahead of it in terms of tightening monetary policy to rein in inflation pressures (and inflation expectations) than the ECB. This will lead to a faster pace of rate hikes in the US than in Europe and renewed widening of the US Treasury-German Bund yield spread. Financial conditions in Europe will also play a role in limiting when, and how much, the ECB can eventually tighten monetary policy. Yields and spreads on the riskier parts of the European fixed income markets like Italian government bonds have already widened substantially in response to the more hawkish guidance from the ECB (Chart 14). The euro has also stabilized after the steady depreciation seen since the May 2021 peak. Markets are obviously pricing in an end to ECB asset purchases – the precursor to rate hikes – which would force the private sector to absorb a greater share of Italian bond issuance than has been the case over the past few years. It will likely take higher yields to entice those buyers compared to the price-insensitive ECB that has been buying Italian debt as a monetary policy tool. The speed of the adjustment in Italian bond yields has no doubt alerted the ECB Governing Council to the financial stability risks of moving too fast on tightening monetary conditions. We must acknowledge that most the recent trends in the Treasury-Bund spread (narrower) and Italian bond yields/spreads (higher) go against our current strategic recommendations to overweight European fixed income. Markets have moved to price in a far more aggressive move from the ECB than we had envisioned for 2022. However, as highlighted above, it is not clear that the ECB needs to dial back monetary accommodation as rapidly as markets now expect. Thus, we are sticking with our strategic recommendations to overweight euro area government bonds, both in the core and periphery, in global bond portfolios. At the same time, we continue to recommend a below-benchmark duration stance within dedicated European portfolios, even with the 10-year German Bund yield having already reached our end-2022 yield target of 0.25% (Chart 15). European bond yields will remain under upward pressure until euro area inflation finally peaks and the ECB will be under less pressure to tighten. Chart 14ECB Facing An "Italy-vs-Inflation" Tradeoff
ECB Facing An "Italy-vs-Inflation" Tradeoff
ECB Facing An "Italy-vs-Inflation" Tradeoff
Chart 15Too Much, Too Soon Priced Into Bund Yields
Too Much, Too Soon Priced Into Bund Yields
Too Much, Too Soon Priced Into Bund Yields
Bottom Line: Markets are overestimating how quickly the ECB can begin to tighten European monetary policy. An initial rate hike can occur in Q4 of this year, at the earliest, which is later than the current mid-summer liftoff date discounted in interest rate forwards. Ride out the current European rates volatility and stay overweight European government debt versus the US. UK Update: The BoE Wants To Tighten Fast At last week's policy meeting, the BoE Monetary Policy Committee (MPC) voted 5-4 to raise Bank Rate by 25bps to 0.5%. That close vote is less dovish than it appears, though, as the four “dissenting” MPC members wanted to raise rates by 50bps instead! This was a hawkish surprise that resulted in bearish flattening of the UK Gilt yield curve. Chart 16UK Gilts: Volatile, But Underperforming
UK Gilts: Volatile, But Underperforming
UK Gilts: Volatile, But Underperforming
We have maintained a below-benchmark strategic recommendation on Gilts since August of last year. The relative performance of Gilts versus the Bloomberg Global Treasury benchmark index has seen tremendous volatility since then, particular after the BoE delayed the expected initial rate hike last November (Chart 16) Gilts began to underperform again after the BoE hiked in December and have continued to be one of the worst performing G10 bond markets, validating our bearish call. After last week’s BoE hike, we still see value in betting on additional Gilt underperformance, as markets may still be underestimating how high the BoE will have to raise rates in the current tightening cycle. In the new set of economic projections from the BoE’s Monetary Policy Report published last week, the central bank raised its expectation for the April peak in UK inflation to 7.25% (Chart 17). This compares to the latest inflation rate of 5.4%. Higher energy and goods prices account for three-quarters of that expected inflation increase, according to the BoE. UK inflation is projected to fall rapidly from that April peak, in response to an expected deceleration of energy and goods prices and slower UK economic growth. However, the Monetary Policy Report also highlighted that domestic UK cost pressures are intensifying in response to a very tight UK labor market. The BoE’s Agents’ survey of UK businesses reported that UK firms continue to have difficulty filling job openings, while also having success in passing on rising labor costs into selling prices. Thus, the UK labor market is now the critical variable to watch to determine how many more rate hikes the BoE will need to deliver in the current cycle. On that note, the BoE expects UK wage growth to accelerate to just under 5% over the next year, which is well above the central bank’s estimate of “underlying” pre-pandemic wage growth around 3.5%. Inflation expectations in the UK remain elevated. The YouGov/Citigroup survey shows that UK consumers expect inflation to be 4.8% on year from now and 3.8% 5-10 years ahead (Chart 18, top panel). Market-based inflation expectations have been more volatile of late but CPI swaps are pricing in inflation of 5.0% in two years and 4.2% in ten years.1 Thus, by any measure – realized inflation, expected inflation or wage growth – UK inflation is too high, which justifies tighter monetary policy. The UK OIS curve now discounts a peak in Bank Rate of 1.85% in April 2023, but this is immediately followed by rate cuts that take Bank Rate to 1.5% by the end of 2024. That path over the next year is a bit more hawkish than the results from the BoE’s new Market Participants Survey of bond investors, which showed an expected peak in Bank Rate of 1.5% sometime in the latter half of 2023. In both cases, Bank Rate is expected to settle below the BoE’s 2% inflation target, or below current inflation expectations. Suggesting an implied belief that the BoE will not be able to raise real interest rates into positive territory. In terms of forward guidance, several BoE officials have noted that they expect that only a few more hikes will be needed to help bring UK inflation back down to the 2% target. Yet the OIS curve is pricing in a “policy error” scenario where the BoE pushes up rates too rapidly and is then forced to cut rates soon afterward. We see both the BoE guidance and the OIS pricing as far too cautious on the eventual peak in Bank Rate, which leads us to maintain our underweight recommendation on UK Gilt exposure, both in terms of duration and country allocation in global bond portfolios. Chart 17BoE Sees A Short, Sharp Shock From Inflation & Rates
BoE Sees A Short, Sharp Shock From Inflation & Rates
BoE Sees A Short, Sharp Shock From Inflation & Rates
We have also been recommending a Gilt curve steepening trade in our Tactical Overlay portfolio on page 20 since last October. This trade went long a 10-year Gilt bullet versus a barbell combination of a 7-year and 30-year Gilt. Chart 18Stay Underweight UK Gilts
Stay Underweight UK Gilts
Stay Underweight UK Gilts
Our view at the time of trade inception was that a Gilt steepener would benefit from a scenario where the market would be forced to reassess how high rates would go in the next BoE tightening cycle. However, the BoE now appears to be “front loading” the tightening cycle by moving rates sooner and more aggressively, as evidenced by the near 50bp rate hike last week, while also moving to an accelerated runoff of bonds accumulated during quantitative easing operations. The Gilt yield curve has flattened considerably in response to increasing BoE hawkishness, with the yield spread between the 10-year and 2-yield Gilt now down to a mere +17bps. While we still see the potential for the longer-end of the Gilt curve to rise in response to an eventual repricing of terminal rate expectations that appear too low, the BoE’s acceleration of its hiking timetable will make it difficult for the curve to bearishly steepen in the near term. Thus, we are closing out our tactical Gilt curve steepener at a small gain of +23bps. Robert Robis, CFA Chief Fixed Income Strategist rrobis@bcaresearch.com Footnotes 1 UK CPI swaps, and inflation breakevens on index-linked Gilts, reference the UK Retail Price Index (RPI) which typically runs higher than the UK Consumer Price Index (CPI). This imparts an upward bias to UK inflation expectations when compared to CPI swaps and breakevens in other countries. Currently, RPI inflation is running at 7.5% compared to CPI inflation of 5.4%. GFIS Model Bond Portfolio Recommended Positioning Active Duration Contribution: GFIS Recommended Portfolio Vs. Custom Performance Benchmark
Europe Joins The Global Bond Bear Market
Europe Joins The Global Bond Bear Market
The GFIS Recommended Portfolio Vs. The Custom Benchmark Index Cyclical Recommendations (6-18 Months)
Europe Joins The Global Bond Bear Market
Europe Joins The Global Bond Bear Market
Tactical Overlay Trades
Equity markets had a hard time digesting the recent increase in interest rates. The 27 basis point rise in the 10-year Treasury yield in January caused the S&P 500 to selloff by 5.3%. Going forward, we expect the pace of increase in bond yields to…
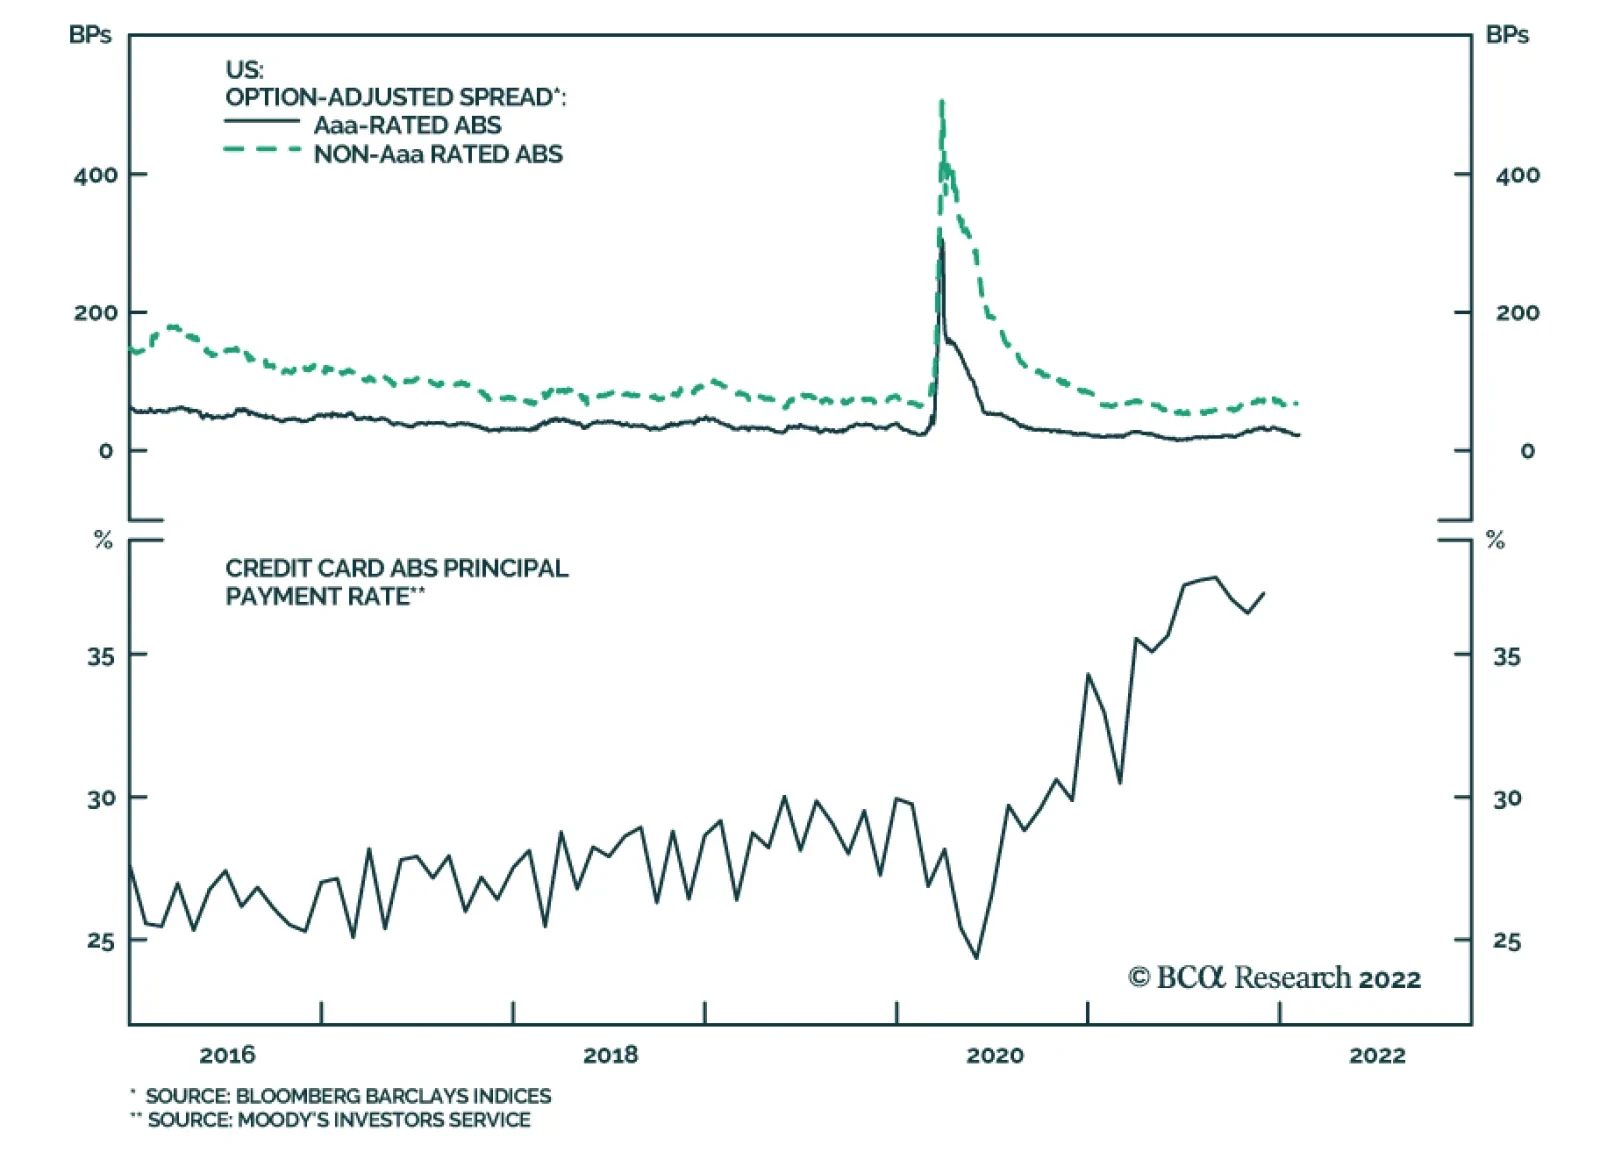
BCA Research’s US Bond Strategy service remains overweight Asset-Backed Securities (ABS) within a US bond portfolio. Asset-Backed Securities outperformed the duration-equivalent Treasury index by 20 basis points in January. Aaa-rated ABS outperformed by…
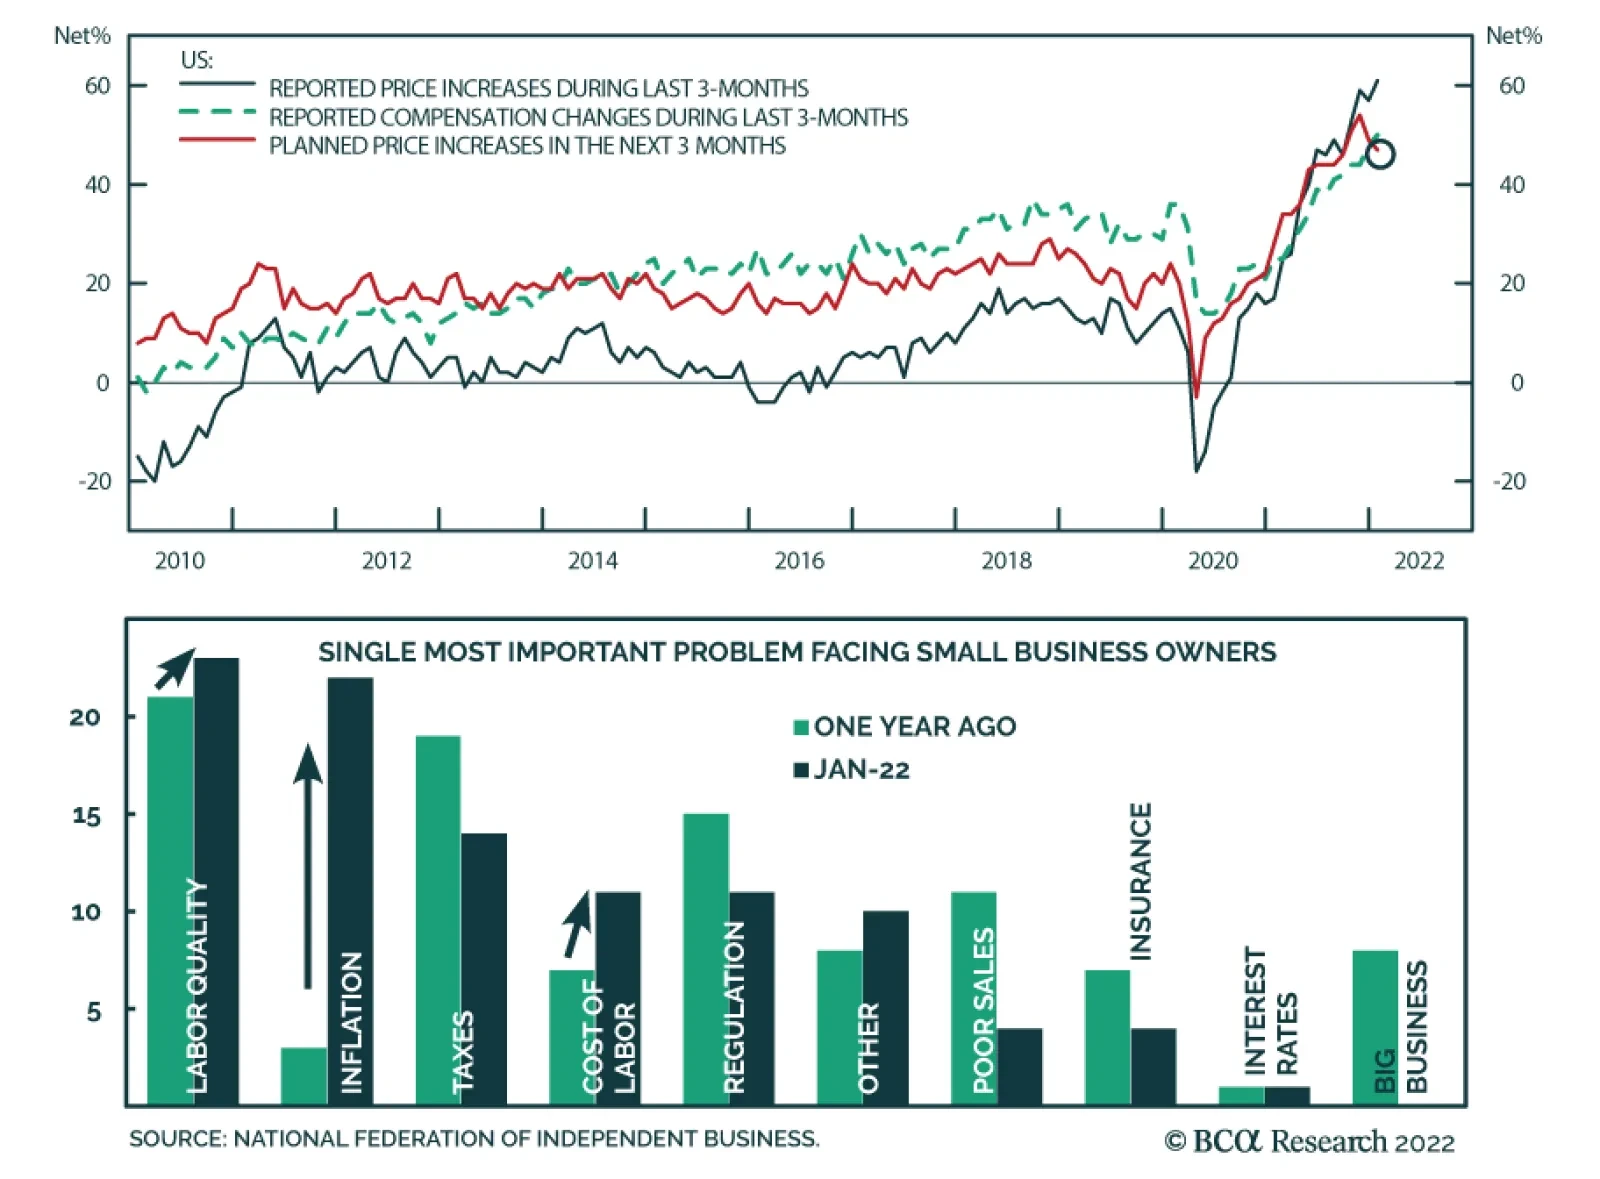
The NFIB survey continues to highlight that price pressures and tight labor market conditions are the top challenges facing small business owners in the US. 23% of the survey respondents indicated that labor quality is the most important problem they face.…
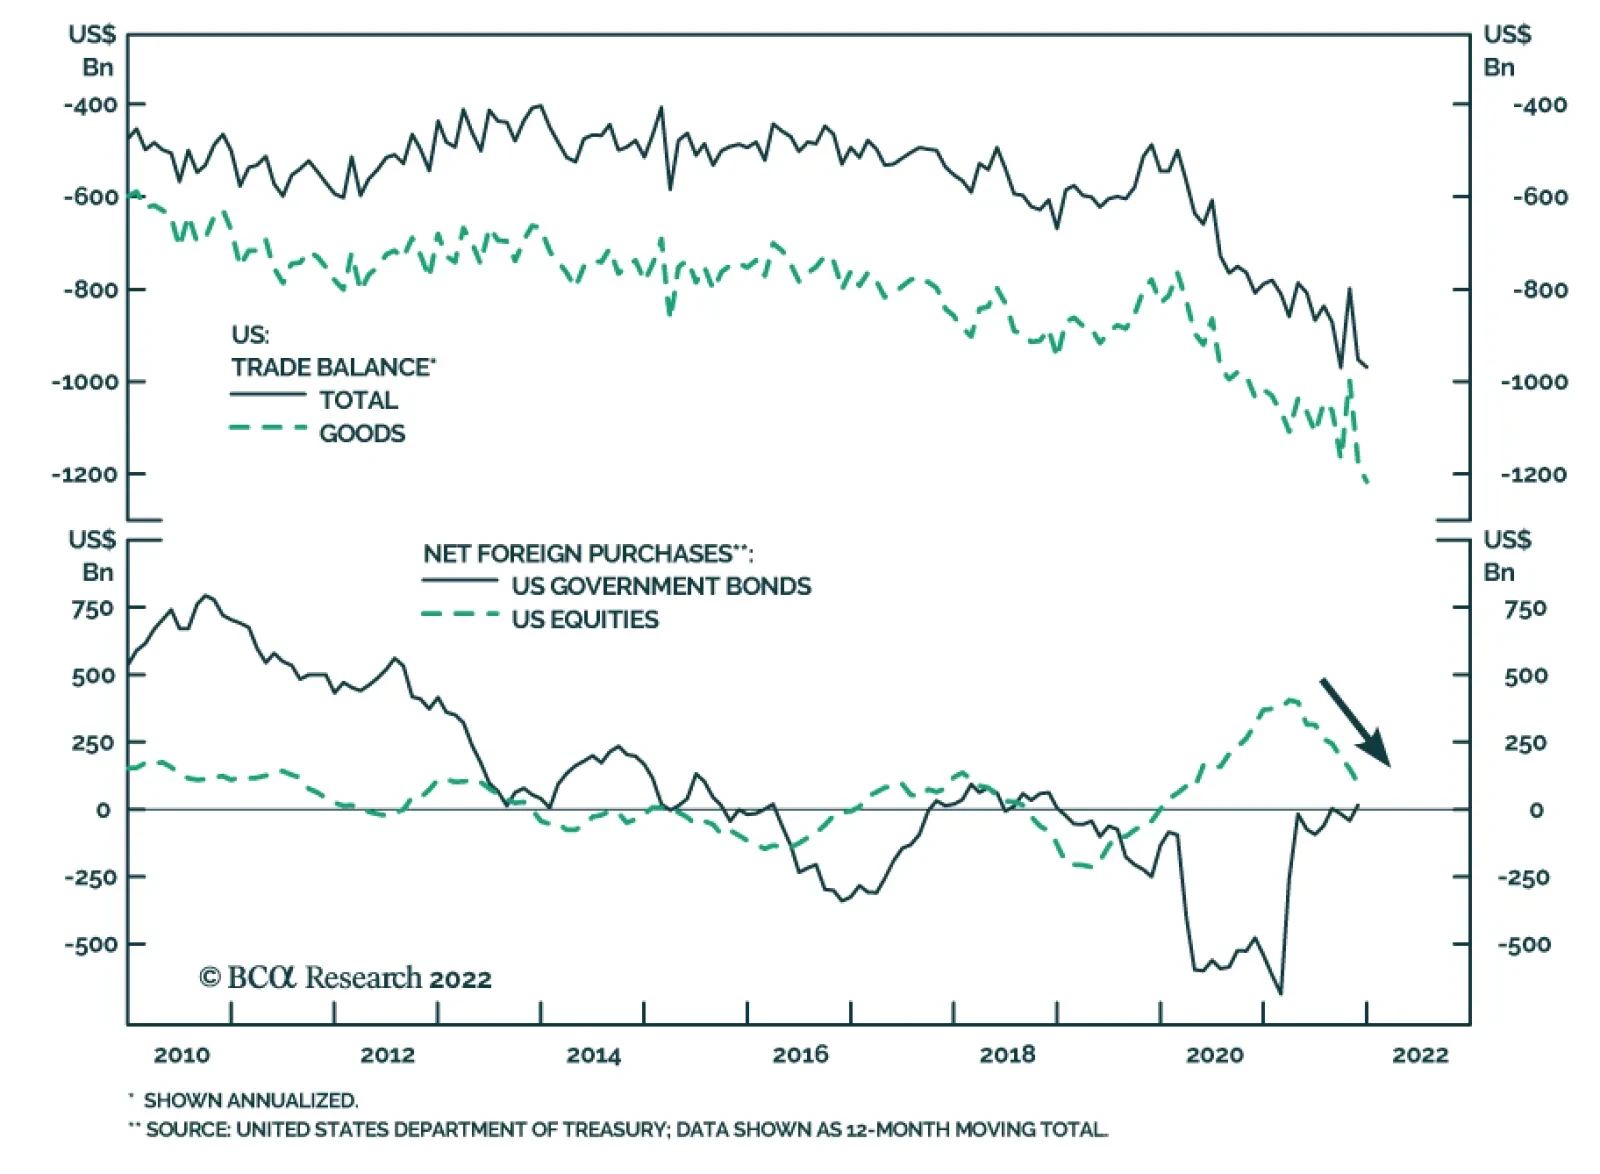
The US trade deficit widened from November’s $79.3 billion to $80.7 billion in December – slightly below the anticipated $83 billion gap. This brings the trade deficit for the full 2021 calendar year to a record $859.1 billion, which is a 27% increase from…
Highlights Chart 1Most Sectors Have Fully Recovered
Most Sectors Have Fully Recovered
Most Sectors Have Fully Recovered
Last week’s January employment report shocked markets by showing much greater job gains than had been anticipated. More important than the headline number, however, were the revisions to prior months that reveal a much different picture of the post-COVID labor market. In overall terms, the revised data show that employment is still significantly below where it was prior to the pandemic. Specifically, the economy is still missing about 2.9 million jobs. However, the data now reveal that more than 60% of the missing jobs come from the Leisure & Hospitality sector and that the Health Care and State & Local Government sectors account for the rest. In other words, except for the few sectors that have been most impacted by the pandemic, the US labor market has made a full recovery (Chart 1). The new data justify the Fed’s recent push toward tightening. This is because there is no longer any evidence of labor market slack beyond what we see in the select few close-contact service industries that have been most impacted by COVID. Investors should maintain below-benchmark portfolio duration as the Fed moves toward rate hikes. Feature Table 1Recommended Portfolio Specification
The COVID Labor Market
The COVID Labor Market
Table 2Fixed Income Sector Performance
The COVID Labor Market
The COVID Labor Market
Investment Grade: Neutral Chart 2Investment Grade Market Overview
Investment Grade Market Overview
Investment Grade Market Overview
Investment grade corporate bonds underperformed the duration-equivalent Treasury index by 115 basis points in January. The index option-adjusted spread widened 14 bps on the month to reach 108 bps, and our quality-adjusted 12-month breakeven spread moved up to its 15th percentile since 1995 (Chart 2). This indicates that, despite the recent selloff, corporate bonds remain expensive. We discussed the intermediate-term outlook for corporate bonds in a recent report.1 Specifically, we analyzed the performance of both investment grade and high-yield corporate bonds during previous Fed tightening cycles. Our conclusion is that it will soon be appropriate to reduce our cyclical exposure to corporate credit. For investment grade corporates, this will mean reducing our recommended allocation from neutral (3 out of 5) to underweight (2 out of 5). Our analysis of past cycles suggests that the slope of the yield curve is a critical indicator of corporate bond performance. Excess corporate bond returns are generally strong when the 3-year/10-year Treasury slope is above 50 bps but take a step down when the slope shifts into a range of 0 – 50 bps. The 3/10 slope has just recently dipped below 50 bps (bottom panel). Though our fair value estimates can’t rule out a near-term bounce back above 50 bps, this will become less and less likely as Fed rate hikes approach. We maintain our current recommended allocation for now but expect to downgrade within the next few weeks. Table 3ACorporate Sector Relative Valuation And Recommended Allocation*
The COVID Labor Market
The COVID Labor Market
Table 3BCorporate Sector Risk Vs. Reward*
The COVID Labor Market
The COVID Labor Market
High-Yield: Overweight Chart 3High-Yield Market Overview
High-Yield Market Overview
High-Yield Market Overview
High-Yield underperformed the duration-equivalent Treasury index by 158 basis points in January. The index option-adjusted spread widened 59 bps in January to reach 342 bps. The 12-month spread-implied default rate – the default rate that is priced into the junk index assuming a 40% recovery rate on defaulted debt and an excess spread of 100 bps – also moved up to 4% (Chart 3). The odds are good that defaults will come in below 4% during the next 12 months, which should coincide with the outperformance of high-yield bonds versus Treasuries. For context, the high-yield default rate came in at 1.24% in 2021 and we showed in a recent report that corporate balance sheets are in excellent shape.2 Specifically, we noted that the ratio of total debt to net worth for the nonfinancial corporate sector has fallen to 41%, the lowest ratio since 2010 (bottom panel). While high-yield valuations are more favorable than for investment grade, the bonds will still have to contend with a more challenging monetary environment this year as the Fed lifts rates and the yield curve flattens. For this reason, we expect to reduce our recommended allocation to high-yield corporates in the coming weeks – from overweight (4 out of 5) to neutral (3 out of 5) – though we will retain our preference for high-yield over investment grade. MBS: Underweight Chart 4MBS Market Overview
MBS Market Overview
MBS Market Overview
Mortgage-Backed Securities underperformed the duration-equivalent Treasury index by 12 basis points in January. The zero-volatility spread for conventional 30-year agency MBS tightened 7 bps on the month, split between a 17 bps tightening of the option-adjusted spread (OAS) and a 10 bps increase in the compensation for prepayment risk (option cost) (Chart 4). We wrote in a recent report that MBS’ poor performance in 2021 was attributable to an option cost that was too low relative to the pace of mortgage refinancings, noting that the MBA Refinance Index was slow to fall in 2021 despite the back-up in yields.3 This valuation picture is starting to change. The option cost is now up to 36 bps, its highest level since March 2020, and refi activity is slowing as the Fed moves toward rate hikes. At 23 bps, the index OAS remains unattractive. However, the elevated option cost raises the possibility that the OAS may be over-estimating the pace of mortgage refinancings for the first time in a while. If these trends continue, it may soon make sense to increase exposure to agency MBS. We continue to recommend an up-in-coupon bias within an overall underweight allocation to MBS. Higher coupon MBS exhibit more attractive option-adjusted spreads and higher convexity than lower coupon MBS. This makes high-coupon MBS (4%, 4.5%) more likely to outperform low-coupon MBS (2%, 2.5%, 3%) in an environment where bond yields are flat or rising (bottom panel). Emerging Market Bonds (USD): Overweight Chart 5Emerging Markets Overview
Emerging Markets Overview
Emerging Markets Overview
This week we officially initiate coverage of USD-denominated Emerging Market (EM) bonds. To start, we will focus on investment grade rated Sovereigns, Corporates and Quasi-Sovereigns. We plan to expand our coverage to include high-yield in the coming months. This EM section replaces the previous Government-Related section in our monthly summary. We will continue to cover Government-Related securities from time to time, but that sub-index will no longer be regularly included in our recommended portfolio allocation. Emerging Market bonds underperformed the duration-equivalent Treasury index by 88 basis points in January. EM Sovereigns underperformed the Treasury benchmark by 134 bps on the month and the EM Corporate & Quasi-Sovereign Index underperformed by 58 bps. After strong relative performance in the back-half of 2021, the EM Sovereign index eked out just 4 bps of outperformance versus the duration-equivalent US corporate bond index in January (Chart 5). Meanwhile, the EM Corporate & Quasi-Sovereign index outperformed the duration-matched US corporate index by 24 bps on the month. Yield differentials for EM sovereigns and corporates remain attractive relative to US corporates (panel 4). Additionally, EM currencies are hanging in there versus the dollar even as the Fed moves toward tightening (bottom panel). We recommend an overweight allocation to USD-denominated EM bonds in US bond portfolios, and we maintain our preference for EM sovereign and corporate bonds relative to US corporates with the same credit rating and duration. Municipal Bonds: Maximum Overweight Chart 6Municipal Market Overview
Municipal Market Overview
Municipal Market Overview
Municipal bonds underperformed the duration-equivalent Treasury index by 121 basis points in January (before adjusting for the tax advantage). The economic and policy back-drop remains favorable for municipal bond performance. Trailing 4-quarter net state & local government savings are incredibly high (Chart 6) and 2021’s federal spending splurge will support state & local government coffers for some time. A recent report showed that the average duration of municipal bond indexes has fallen significantly during the past few decades, a trend that has implications for how we should perceive municipal bond valuations.4 Specifically, the trend makes municipal bonds more attractive relative to both Treasury securities and investment grade corporates. Long-maturity bonds are especially compelling. We calculate that 12-17 year maturity Revenue munis offer a breakeven tax rate of 14% relative to credit rating and duration matched US corporate bonds. 12-17 year General Obligation Munis offer a breakeven tax rate of 19% versus corporates (panel 2). High-yield muni spreads are reasonably attractive compared to high-yield corporates (panel 4), but we recommend only a neutral allocation to high-yield munis versus high-yield corporates. The deep negative convexity of high-yield munis makes them susceptible to extension risk as bond yields rise. Treasury Curve: Buy 2-Year Bullet Versus Cash/10 Barbell Chart 7Treasury Yield Curve Overview
Treasury Yield Curve Overview
Treasury Yield Curve Overview
The Treasury curve bear-flattened dramatically in January, and yields continued their sharp rise through the first week of February – though in a more parallel fashion. All in all, the 2-year/10-year Treasury slope has flattened 17 bps since the end of December, bringing it to 62 bps. The 5-year/30-year slope has flattened 19 bps since the end of December, bringing it to 45 bps. The aggressive flattening of the curve has occurred alongside the Fed’s increased near-term hawkishness. Our 12-month discounter has risen from 77 bps at the end of last year to 149 bps today (Chart 7). In other words, the market has gone from anticipating just over three 25 basis point rate hikes during the next 12 months to nearly six! Last week’s report argued that the most recent move to discount more than four 25 basis point rate hikes in 2022 is overdone.5 We contend that tightening financial conditions and falling inflation expectations will cause the Fed to moderate its pace of rate hikes in the second half of this year. We still see the Fed lifting rates three or four times in 2022, but this is now significantly below what’s priced in the market. Given our view, we recommend a position long the 2-year Treasury note versus a barbell consisting of cash and the 10-year note. This trade will profit as a more moderate expected pace of near-term rate hikes limits the upward pressure on the 2-year yield. TIPS: Neutral Chart 8TIPS Market Overview
TIPS Market Overview
TIPS Market Overview
TIPS underperformed the duration-equivalent nominal Treasury index by 23 basis points in January. The 10-year TIPS breakeven inflation rate has declined by 16 bps since the end of December while the 2-year TIPS breakeven inflation rate has fallen by 1 bp. The 10-year and 2-year rates currently sit at 2.43% and 3.21%, respectively. The Fed’s preferred 5-year/5-year forward TIPS breakeven inflation rate is down 22 bps since the end of December. It currently sits at 2.05%, below the Fed’s 2.3% - 2.5% target range. Our valuation indicator shows that 10-year TIPS are slightly expensive compared to 10-year nominal Treasuries (Chart 8), and we retain a neutral allocation to TIPS versus nominals at the long-end of the curve. We acknowledge the risk that a prolonged period of high inflation could lead to a break-out in long-dated TIPS breakevens, but this now looks less likely given how the market has reacted to the Fed’s increasing hawkishness. We see better trading opportunities at the front-end of the TIPS curve where the 2-year TIPS breakeven inflation rate remains well above the Fed’s target range (panel 4). Short-maturity breakevens are more sensitive to swings in CPI than those at the long end. Therefore, the 2-year TIPS breakeven inflation rate has considerable downside during the next 6-12 months, assuming inflation moderates as we expect. We recommend an underweight allocation to TIPS versus nominals at the front-end of the curve. Given our view that CPI inflation will be lower in 6-12 months, we recommend shorting 2-year TIPS outright, positioning in 2/10 TIPS breakeven inflation curve steepeners (bottom panel) and 2/10 TIPS (real) yield curve flatteners. ABS: Overweight Chart 9ABS Market Overview
ABS Market Overview
ABS Market Overview
Asset-Backed Securities outperformed the duration-equivalent Treasury index by 20 basis points in January. Aaa-rated ABS outperformed by 19 bps on the month and non-Aaa ABS outperformed by 20 bps. During the past two years, substantial federal government support for household incomes has caused US households to build up an extremely large buffer of excess savings. During this period, many households have used their windfalls to pay down consumer debt and credit card debt levels have fallen to well below pre-COVID levels (Chart 9). Though consumer credit growth has rebounded, debt levels are still low. This indicates that the collateral quality backing consumer ABS remains exceptionally strong. Investors should remain overweight consumer ABS and should take advantage of the high quality of household balance sheets by moving down the quality spectrum, favoring non-Aaa rated securities over Aaa-rated ones. Non-Agency CMBS: Neutral Chart 10CMBS Market Overview
CMBS Market Overview
CMBS Market Overview
Non-Agency Commercial Mortgage-Backed Securities underperformed the duration-equivalent Treasury index by 3 basis points in January. Aaa Non-Agency CMBS underperformed Treasuries by 3 bps in January, but non-Aaa Non-Agency CMBS outperformed by 2 bps (Chart 10). Though returns have been strong and spreads remain relatively wide, particularly for lower-rated CMBS, we continue to recommend only a neutral allocation to the sector because of the structurally challenging environment for commercial real estate. Agency CMBS: Overweight Agency CMBS outperformed the duration-equivalent Treasury index by 3 basis points in January. The average index option-adjusted spread tightened 1 bp on the month. It currently sits at 36 bps (bottom panel). Though Agency CMBS spreads have recovered to well below their pre-COVID levels, they still look attractive compared to other similarly risky spread products. Stay overweight. Appendix A: Butterfly Strategy Valuations The following tables present the current read-outs from our butterfly spread models. We use these models to identify opportunities to take duration-neutral positions across the Treasury curve. The following two Special Reports explain the models in more detail: US Bond Strategy Special Report, “Bullets, Barbells And Butterflies”, dated July 25, 2017, available at usbs.bcaresearch.com US Bond Strategy Special Report, “More Bullets, Barbells And Butterflies”, dated May 15, 2018, available at usbs.bcaresearch.com Table 4 shows the raw residuals from each model. A positive value indicates that the bullet is cheap relative to the duration-matched barbell. A negative value indicates that the barbell is cheap relative to the bullet. Table 4Butterfly Strategy Valuation: Raw Residuals In Basis Points (As Of January 31, 2022)
The COVID Labor Market
The COVID Labor Market
Table 5 scales the raw residuals in Table 4 by their historical means and standard deviations. This facilitates comparison between the different butterfly spreads. Table 5Butterfly Strategy Valuation: Standardized Residuals (As Of January 31, 2022)
The COVID Labor Market
The COVID Labor Market
Table 6 flips the models on their heads. It shows the change in the slope between the two barbell maturities that must be realized during the next six months to make returns between the bullet and barbell equal. For example, a reading of -53 bps in the 5 over 2/10 cell means that we would expect the 5-year to outperform the 2/10 if the 2/10 slope flattens by less than 53 bps during the next six months. Otherwise, we would expect the 2/10 barbell to outperform the 5-year bullet. Table 6Discounted Slope Change During Next 6 Months (BPs)
The COVID Labor Market
The COVID Labor Market
Appendix B: Excess Return Bond Map The Excess Return Bond Map is used to assess the relative risk/reward trade-off between different sectors of the US bond market. It is a purely computational exercise and does not impose any macroeconomic view. The Map’s vertical axis shows 12-month expected excess returns. These are proxied by each sector’s option-adjusted spread. Sectors plotting further toward the top of the Map have higher expected returns and vice-versa. Our novel risk measure called the “Risk Of Losing 100 bps” is shown on the Map’s horizontal axis. To calculate it, we first compute the spread widening required on a 12-month horizon for each sector to lose 100 bps or more relative to a duration-matched position in Treasury securities. Then, we divide that amount of spread widening by each sector’s historical spread volatility. The end result is the number of standard deviations of 12-month spread widening required for each sector to lose 100 bps or more versus a position in Treasuries. Lower risk sectors plot further to the right of the Map, and higher risk sectors plot further to the left. Chart 11Excess Return Bond Map (As Of January 31, 2022)
The COVID Labor Market
The COVID Labor Market
Recommended Portfolio Specification
The COVID Labor Market
The COVID Labor Market
Other Recommendations
The COVID Labor Market
The COVID Labor Market
Ryan Swift US Bond Strategist rswift@bcaresearch.com Footnotes 1 Please see US Bond Strategy Weekly Report, “Positioning For Rate Hikes In The Corporate Bond Market”, dated January 25, 2022. 2 Please see US Bond Strategy Weekly Report, “The Fed’s Inflation Problem”, dated November 23, 2021. 3 Please see US Bond Strategy Weekly Report, “The Omicron Impact”, dated November 30, 2021. 4 Please see US Bond Strategy Weekly Report, “The Best & Worst Spots On The Yield Curve”, dated October 26, 2021. 5 Please see US Bond Strategy Weekly Report, “The Best Laid Plans”, dated February 1, 2022.