United States
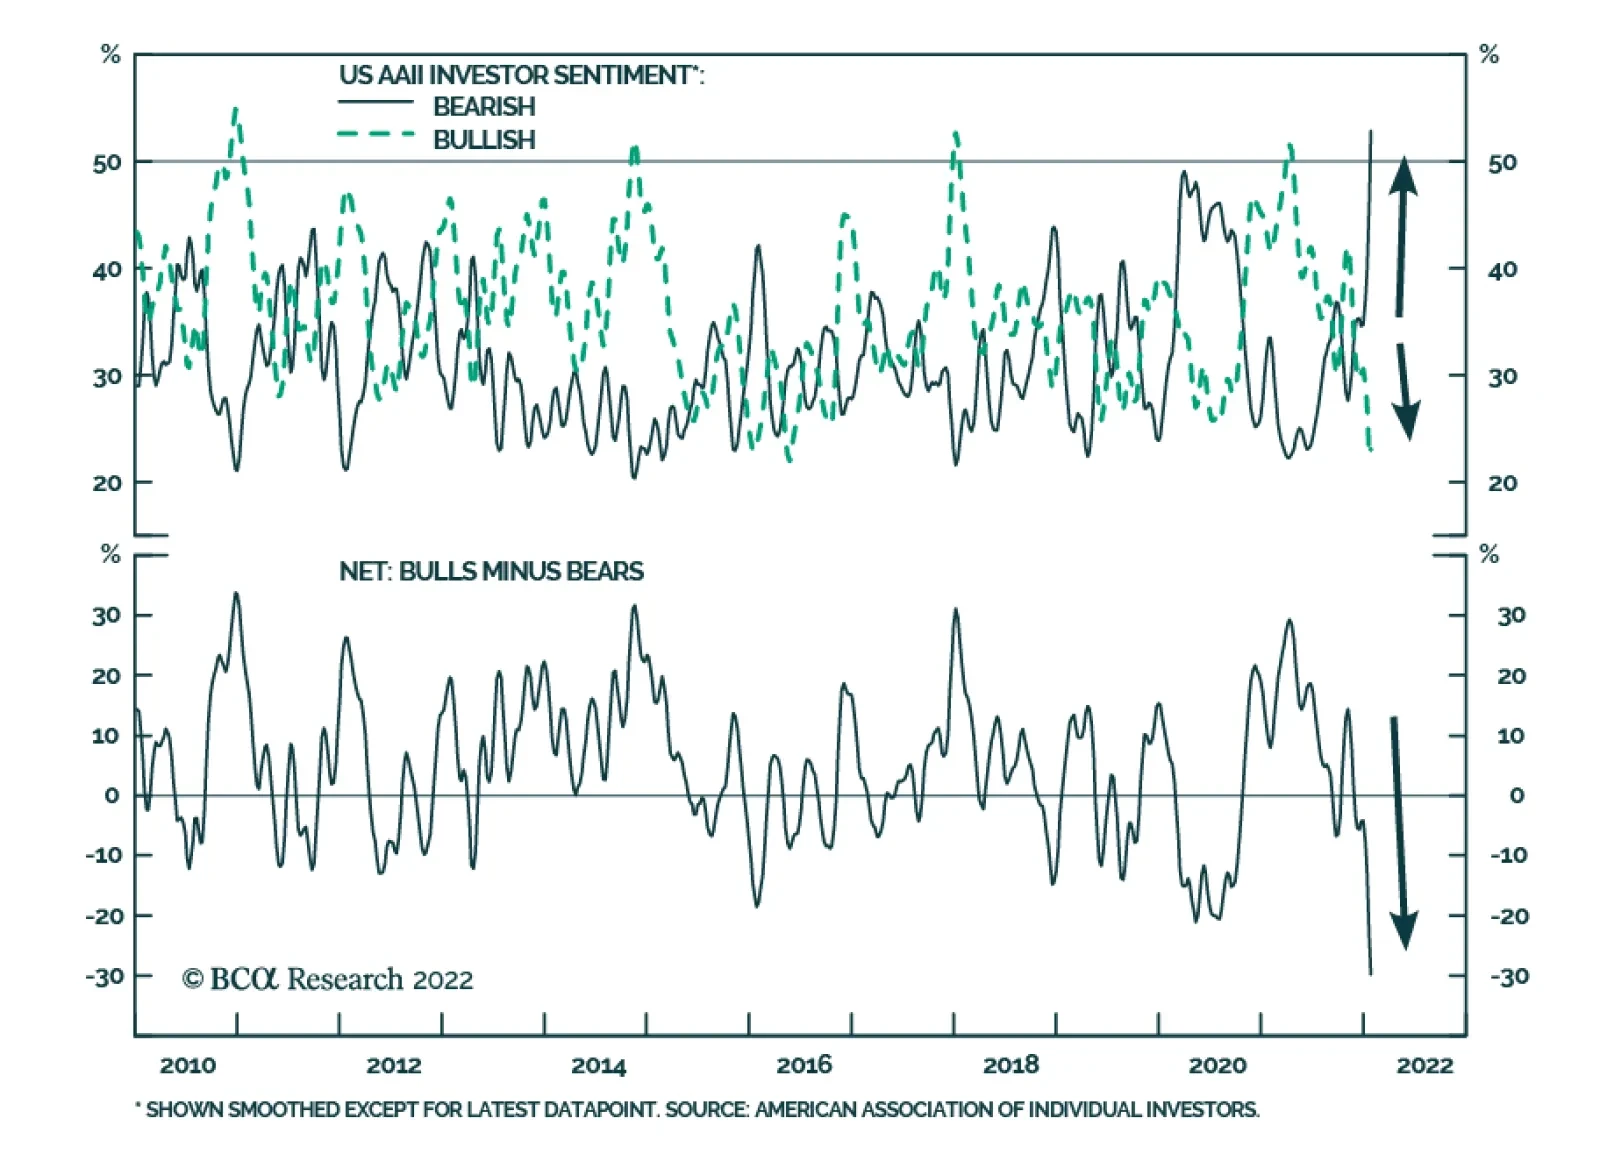
Investor sentiment has deteriorated sharply in recent weeks. At 53%, the share of respondents with a bearish outlook in the latest AAII survey far exceeds the 23% with a bullish outlook. Net bullish investor sentiment has collapsed from bullish to bearish…
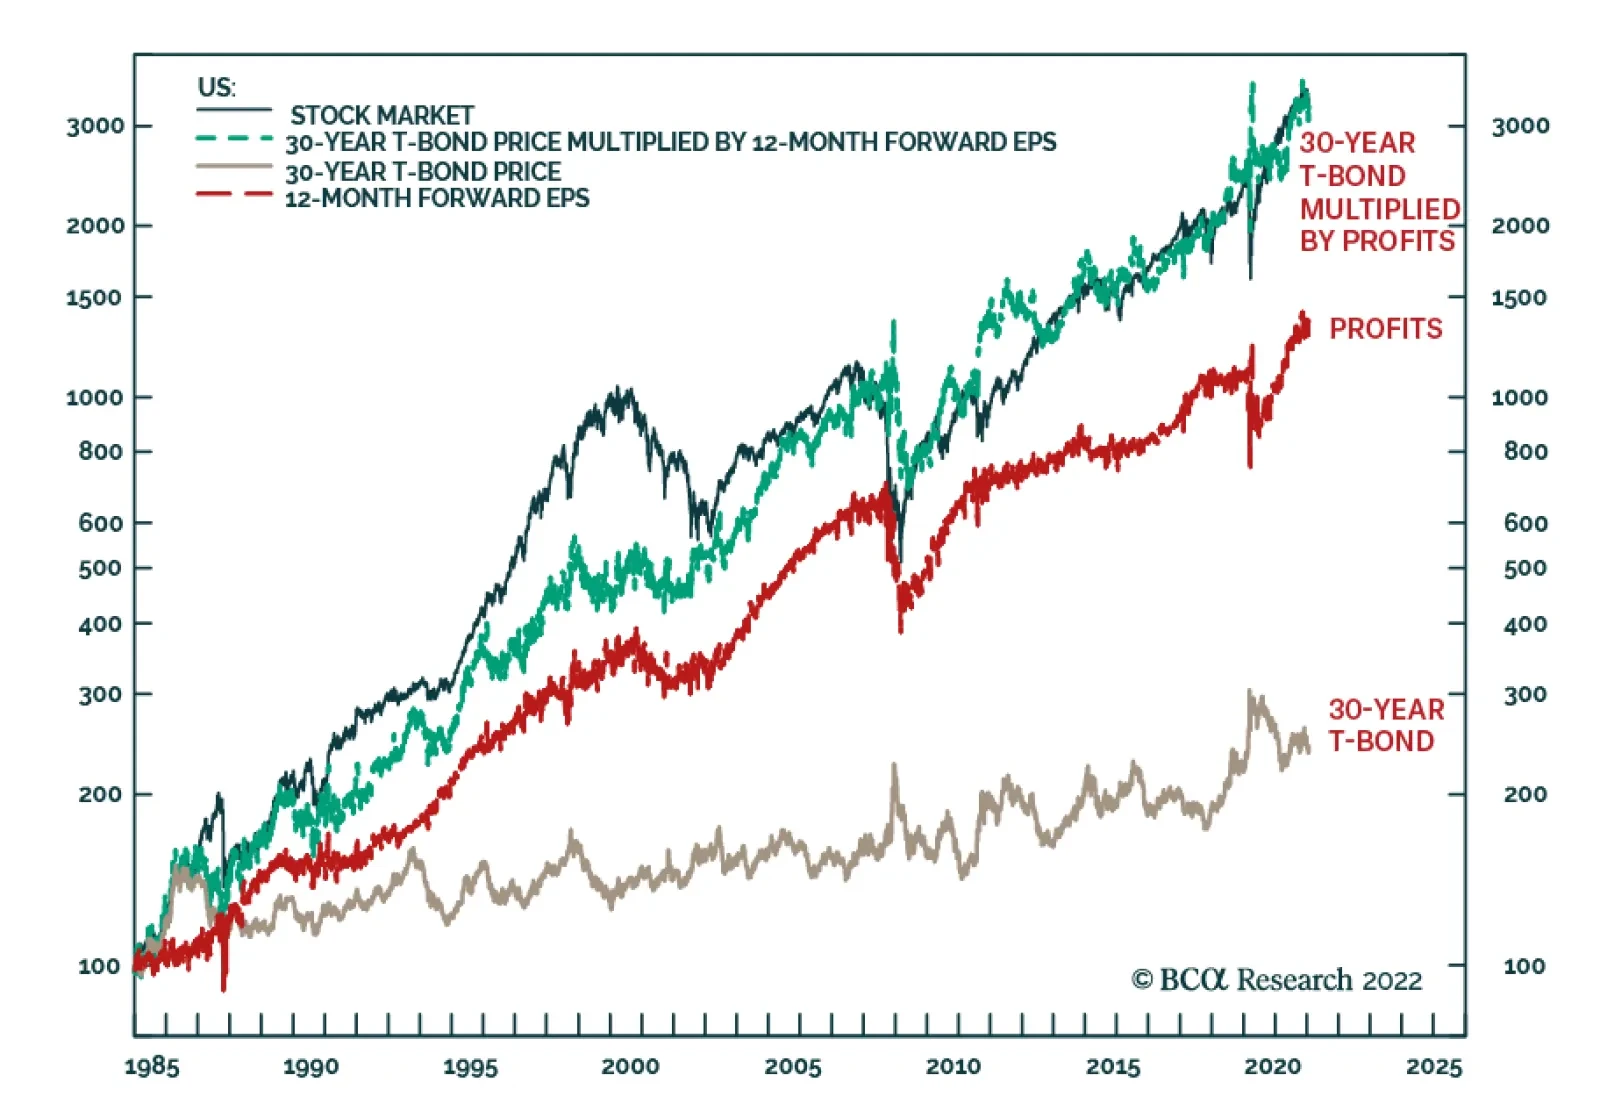
BCA Research’s Counterpoint service concludes that we are quite close to an entry-point for both stocks and long-duration bonds. The duration of the US stock market is the same as that of the 30-year T-bond, at around 25 years. Therefore, if all else were…

Highlights The faster-than-expected oil-demand recovery from the COVID-19 omicron variant points to higher EM trade volumes this year and next, which, along with a weaker USD, will boost base-metals demand and prices (Chart of the Week). The recovery in iron-ore prices on the back of China stimulus and omicron-induced labor shortages at miners will lift copper prices, the base-metals' bellwether. Supply-demand balances in refined copper showed a physical deficit of 438K MT for the January-October 2021 period, indicating the market extended its years-long deficit in 2021. Despite the IMF's mark-down in global growth due to slowdowns in the US and China this year, metals demand will continue to exceed supply, which will support prices. Short squeezes – most recently in nickel, following a headline-grabbing copper squeeze in October – will keep base metals' inventories under pressure and forward curves backwardated. We remain long the S&P GSCI and the COMT ETF, as well as the PICK ETF, to remain exposed to backwardation. At tonight's close, we are getting long the SPDR S&P Metals and Mining ETF (XME) ETF, following its recent sell-off. We are raising our 2022 copper target to $5.00/lb on COMEX, and keeping our 2023 expectation at $6.00/lb. Feature Inadequate development in new base metals supply, which has been apparent for years, means economic recovery and expansion will continue to tax existing supplies over the short run (to end-2023).1 Chart of the WeekExpected Global Trade Pick-Up Will Boost Base Metals Demand
Expected Global Trade Pick-Up Will Boost Base Metals Demand
Expected Global Trade Pick-Up Will Boost Base Metals Demand
Chart 2Physical Deficits Will Persists In Copper...
Physical Deficits Will Persists In Copper...
Physical Deficits Will Persists In Copper...
At a global level, prolonged supply-demand imbalances mean inventories will continue to be drawn hard to cover for prompt supply shortfalls. This can be seen in the principal base metals we cover: copper (Chart 2), aluminum (Chart 3), nickel (Chart 4), and zinc (Chart 5). As a result, short squeezes in base metals markets will continue to grab headlines, as persistent physical deficits periodically drain inventories.2 Longer term, the global effort to decarbonize energy supply could be stretched out well beyond 2050, when most policymakers assume the task of replacing fossil-fuel energy sources will largely be completed. The longer it takes to mobilize capex, the more expensive the energy transition becomes, as markets are continually forced to adjust to short-term shortages leading to price spikes and squeezes in an effort to meet demand. Chart 3...Aluminum...
...Aluminum...
...Aluminum...
Chart 4...Nickel...
...Nickel...
...Nickel...
Chart 5...And Zinc.
...And Zinc.
...And Zinc.
Faster Demand Recovery In Metals Faster-than-expected oil-demand recovery will translate to higher trade volumes globally this year and next. This is particularly important for EM markets, given oil and metals prices – particularly copper, the base metals bellwether – share a common long-term equilibrium (i.e., they're cointegrated, as seen in the Chart of the Week).3 A pick-up in EM trade volumes, along with a weakening USD this year, will help lift copper prices. Most trade is in manufactured goods, which will translate into a pick-up in cyclical stocks vs. defensive stocks as well, which also is supportive of copper prices (Chart 6). Copper prices also will be supported by the recovery in iron-ore prices, which have been bid up on the back of increasing stimulus in China and global growth ex-China, as well as omicron-induced labor shortages among miners. As is typical, copper demand will follow in the wake of steel demand, as construction and infrastructure projects are finished off (i.e., plumbing and wiring are installed) (Chart 7). Chart 6Global Trade Recovery Will Boost Copper
Global Trade Recovery Will Boost Copper
Global Trade Recovery Will Boost Copper
Chart 7Iron Ore Rally Will Boost Copper
Iron Ore Rally Will Boost Copper
Iron Ore Rally Will Boost Copper
Supply Side Remains Challenged Impressive gains put up on the supply side last year in Indonesia – which, according to the International Copper Study Group, posted a 51% increase in copper output at the Grasberg mine over the first 10 months of 2021, – and other smaller producers notwithstanding, geopolitical uncertainty continues to dominate the supply-side risks to base metals generally, copper in particular.4 Economic and political uncertainty in Chile and Peru, which account for 30% and 10% of global copper output, respectively, will continue to keep miners hesitant in their capex allocations, in our view. Both states have elected left-of-center governments, which still are working through how they will deliver on their election mandates, including revenue re-distribution, taxation and royalties.5 The combination of stronger demand and tepid supply growth will keep base metals inventories under pressure, which will translate into continued backwardation. This is particularly apparent in the copper (Chart 8) and nickel (Chart 9). Both of these squeezes resulted from buyers treating the London Metal Exchange as a supplier of last resort – which is an extremely rare occurrence in futures markets – and both required the intervention of the London Metal Exchange to address.6 Chart 8Copper Backwardation Will Persist
Copper Backwardation Will Persist
Copper Backwardation Will Persist
Chart 9...As Will Nickels
...As Will Nickels
...As Will Nickels
Investment Implications Base metals markets will continue to find it difficult to match supply with demand, as they have for the past several years. This further compounds the global energy transition – largely because the suppliers of the metals needed to pull it off are starting from a deep physical deficit position – and likely delays it considerably. In an environment in which obstacles to developing the supply needed to phase out fossil fuels in favor of renewable generation continue to mount, we remain long commodity index exposure – the S&P GSCI and COMT ETF – and favor exposure to miners and trading companies that are responsible for moving metals around the globe. At tonight's close, we are getting long the SPDR S&P Metals and Mining ETF (XME) ETF, following its recent sell-off of 10% for its highs of $47/share. Our view on base metals is they are a long-term value play, in which miners and the supply side generally, will benefit from the high prices needed to develop the supply the energy transition will require. The big risk here is these companies once again lose the plot and fail to control costs to produce at the expense of the health of their margins. If we see this, we will exit the position. Robert P. Ryan Chief Commodity & Energy Strategist rryan@bcaresearch.com Ashwin Shyam Research Associate Commodity & Energy Strategy ashwin.shyam@bcaresearch.com Paula Struk Research Associate Commodity & Energy Strategy paula.struk@bcaresearch.com Commodities Round-Up Energy: Bullish We expect OPEC 2.0 to announce they'll continue with the return of another 400k b/d at next week's monthly meeting. In reality, the producer coalition most likely will fail to return these volumes to market and will fall short of the mark again. The real news markets are waiting for is whether the four states capable of increasing supply and sustaining higher output – Saudi Arabia, Iraq, the UAE and Kuwait – will step up to cover the growing gap between volumes that were pledged and what's actually been delivered. The coalition agreed in July 2021 to begin returning some of the 5.8mm b/d of output pulled from the market during the COVID-19 pandemic starting in August 2021. To date, the producer group has fallen short by about 800k b/d, based on the IEA's January 2022 estimates. Failure to increase production by the four core OPEC 2.0 states could keep prices above $90/bbl this year and next (Chart 10). Base Metals: Bullish Iron ore prices have rallied ~ 14% since the start of this year, as markets expect China to ease steel production cuts in 2022 and loosen monetary policy. Last week, the People’s Bank of China (PBoC) cut its policy interest rate for the first time in nearly two years. Markets expect more stimulus and policy easing in China as the central bank and government attempt to stimulate an economy mired by COVID-19 lockdowns, a property market slump and high energy prices. Higher stimulus implies more commodity refining and manufacturing activity, including steel production, which will lead to higher iron ore demand. Precious Metals: Bullish In line with market expectations, the Federal Reserve signaled an initial rate hike in March, in its January Federal Open Market Committee (FOMC) meeting. While nominal interest rates will rise, the Fed will remain behind the inflation curve. The US CPI reading for December showed that inflation was 7% higher year-on-year, the highest annual increase in inflation since 1982 (Chart 11). High inflation and the Fed’s slow start to raise nominal interest rates will keep real rates, the opportunity cost of holding gold, low. Chart 10
Brent Forecast Restored To $80/bbl For 2022
Brent Forecast Restored To $80/bbl For 2022
Chart 11
Short Squeezes In Copper, Nickel Highlight Tight Metals Markets
Short Squeezes In Copper, Nickel Highlight Tight Metals Markets
Footnotes 1 Please see 2022 Key Views: Past As Prelude For Commodities, published on December 16, 2021 for additional discussion. 2 Please see Column: Nickel gripped by ferocious squeeze as stocks disappear: Andy Home, published by reuters.com on January 20, 2022; and LME copper spreads backwardated amid stock squeeze, published by argusmedia.com on October 20, 2021. 3 This was flagged most recently in the IEA's January 2022 Oil Market Report, which noted, "While the number of Omicron cases is surging worldwide, oil demand defied expectations in 4Q21, rising by 1.1 mb/d to 99 mb/d. In 1Q22, demand is set for a seasonal decline, exacerbated by more teleworking and less air travel. We have raised our global demand estimates by 200 kb/d for 2021 and 2022 – resulting in growth of 5.5 mb/d and 3.3 mb/d, respectively – due to softer Covid restrictions." Please see Higher Output Needed To Constrain Oil Prices for our latest oil balances and price forecasts. We published this report last week. 4 Please see International Copper Study Group press release of January 2022. 5 Please see Add Local Politics To Copper Supply Risks, which we published on November 25, 2021, for a discussion of these risks. 6 Please see Footnote 2 above. Investment Views and Themes Recommendations Strategic Recommendations Trades Closed In 2021
Image
The BCA house view is that the US Treasury rates will move higher this year. Monetary tightening has been one of our core investment themes, and a reason for overweighing banks back in September 2021, which outperformed the S&P 500 by 7% since we initiated this position. Today, we double down on our bearish outlook for US bonds and upgrade another rate-sensitive industry group – insurance. While insurance only marginally bested the S&P 500 in 2021, it is now up 9% year-to-date in relative terms.
Upgrading Insurance
Upgrading Insurance
Most insurers have struggled over the past decade, as persistently low rates have had an adverse effect on their earnings, capital, reserves, and liquidity. These companies’ priority is asset/liability matching, i.e., investment income needs to match contractual obligations. Higher rates make it easier for the insurers to reach their target rates of returns without wading into riskier asset classes. Also, rising rates are a tailwind for the industry: They enjoy a positive roll return by reinvesting premiums at higher yields (top panel). In addition to rising rates, there are several other factors that support the strong performance of the industry over the next few months. Life Insurance: There is an increased demand for traditional life insurance as, for many, pandemic underlined a need for protection; millennials are coming of age; and lastly, life and health insurance are perks offered by employers to workers in a tight labor market. Premiums are expected to grow at 4% in 2022, a minor slowdown from 5.8% 2021 estimated growth.1 Vaccinations and new COVID treatments have reduced mortality from the virus, potentially boosting profitability. With the rising number of baby boomers, demand for retirement products is increasing. However, challenging conditions of the public capital markets may create headwinds for the asset management side of the life insurers business. P&C Insurance: Insured loss from COVID is beginning to stabilize, although there are some outstanding litigations on coverage terms under business interruption coverage. Ongoing economic recovery drives an increase in demand for commercial lines coverage. The insurance pricing environment remains “hard”, with the demand that is relatively inelastic and economically defensive. CFRA forecasts written premium growth of 6% to 9% in 2021 and 7% to 10% in 2022.2 Cyber insurance will get traction as a result of the frequency and severity of high-profile cyber attacks. Written premiums are expected to grow by 22% in 20223 with an average rate increase of 18%. In terms of fundamentals, the street sales growth estimates are set at 3% vs 7% for the SPX. Relative earnings growth expectations are also low (-5%) and are nearly on par with the GFC levels, setting up insurers for positive earnings surprises (middle panel). Valuations are undemanding, with the relative P/B ratio at a multi-decade low (bottom panel). Bottom Line: Today, we double down on our bearish outlook for the US bonds and upgrade the S&P insurance index to overweight. Ticker symbols in the S&P insurance index are: CB, MMC, AON, MET, PGR, AIG, PRU, TRV, AFL, ALL, AJG, L, WTW, HIG, PFG, BRO, CINF, WRB, RE, GL, LNC, AIZ. Footnotes 1 CFRA Industry Surveys, Life and Health Insurance, December 2021. 2 CFRA Industry Surveys, Property and Casualty Insurance, July 2021. 3 Ibid.
Feature Is the worst over for US and EM equities? Clearly, the risk-reward of stocks has somewhat improved, given they are no longer overbought and some bad news has already been priced in. However, conditions for a durable bottom and a sustainable and lasting rally do not yet exist. In the case of the S&P 500, our capitulation indicator has not yet reached the lows that marked the major bottoms of the past 12 years (Chart 1). Chart 1US Stocks Have Not Reached Their Selling Climax Yet
US Stocks Have Not Reached Their Selling Climax Yet
US Stocks Have Not Reached Their Selling Climax Yet
Chart 2Components Of US Equity Capitulation Indicator
Components Of US Equity Capitulation Indicator
Components Of US Equity Capitulation Indicator
None of its four components – the advance/decline line, momentum, breadth and investor sentiment – are back to their lows of 2010, 2011, 2015-16 and 2018 (Chart 2). In the past three cases, the S&P 500 corrected by 17-20%. A correction of this magnitude is our base case for the S&P 500 at the moment. The S&P drawdown has so far been half of this. US inflation and the Fed’s policy remain the key headwinds to US share prices. Core consumer price inflation is substantially above the Fed’s preferred range (2-2.25%) and wage growth is accelerating. As a result, the Fed will lose credibility if it does not sound ready to hike interest rates materially. The US equity market is vulnerable to such a not-dovish stance from the Fed because it is still very expensive. Inflation has also become a political problem. One reason Biden’s popularity has been sliding in the polls is the rapid pace of consumer price increases. Heading into the mid-term elections in the fall, the White House and the Democrats will not oppose the Fed raising interest rates to fight inflation. Overall, BCA’s Emerging Markets Strategy team believes markets/investors are underestimating inflation risks in the US. Core inflation will not drop below 3% unless the economy slows down and employment/wages slump. High and rising trimmed-mean and median CPI measures suggest inflation is broad-based. Normalization in supply-side factors will not be enough to lower core inflation below 3%. Importantly, the median and trimmed-mean core inflation measures strip out goods and services that post abnormal fluctuations. Their elevated readings corroborate that inflation is genuine and broad-based. Hence, pressure on the Fed to tighten will remain substantial. This is bad news for a still overvalued US stock market. Chart 3EM EPS Is Set To Dissapoint
EM EPS Is Set To Dissapoint
EM EPS Is Set To Dissapoint
Concerning EM equities and currencies, economic growth in EM will disappoint. Chart 3 suggests that EM corporate profits are set to deteriorate materially in the coming six months or so. Besides, investor sentiment on EM equities is not downbeat – it is neutral (Chart 28 below). From a contrarian perspective, there is not yet a case to buy EM stocks in absolute terms. China’s business cycle recovery is still several months away. In other EM countries, monetary policy has tightened substantially, real interest rates remain high, or the banking system is too unhealthy to support growth. Finally, fiscal policy will be slightly tight this year in the majority of EM. As domestic demand in China and in mainstream EMs disappoint and the Fed does not do a dovish pivot soon, EM currencies will resume their depreciation versus the US dollar. Chart 4 shows that China’s credit and fiscal impulse leads EM currency cycles and is presently pointing to more EM currency depreciation. Charts 32 and 33 (below) are pointing to further greenback strength. Finally, EM growth disappointments and a strong greenback will pressure EM fixed income markets. EM high-yield (HY) credit – both sovereign and corporate – has been selling off, but investment-grade (IG) credit has been holding up (Chart 5). This is a sign that investors have been reluctant to offload EM IG credit and points to lingering positive sentiment on EM and lack of capitulation. Sluggish EM growth and an appreciating US dollar are headwinds for EM credit markets. Chart 4EM Currencies Remain At Risk
EM Currencies Remain At Risk
EM Currencies Remain At Risk
Chart 5EM Credit Markets: The Selloff Will Broaden
EM Credit Markets: The Selloff Will Broaden
EM Credit Markets: The Selloff Will Broaden
Bottom Line: We continue to recommend a defensive strategy for absolute return investors. For global equity portfolios, we recommend underweighting EM and the US, and overweighting Europe and Japan. The path of least resistance for the US dollar is up for now. The charts on the following pages are the most important ones for investors today. Arthur Budaghyan Chief Emerging Markets Strategist arthurb@bcaresearch.com US Stocks Have Not Reached Their Selling Climax Yet Even though only 17% of the NASDAQ’s stocks are above their 200-day moving average, the same measure for the NYSE index is 38%, well above its previous lows. Besides, the NYSE’s advance/decline line has broken down, signifying a broadening equity rout. Finally, the US median stock has broken below its 200-day moving average after going sideways for 9-12 months. When such a profile occurs, the sell-off lasts more than a couple of weeks. Chart 6
US Stocks Have Not Reached Their Selling Climax Yet
US Stocks Have Not Reached Their Selling Climax Yet
Chart 7
US Stocks Have Not Reached Their Selling Climax Yet
US Stocks Have Not Reached Their Selling Climax Yet
Chart 8
US Stocks Have Not Reached Their Selling Climax Yet
US Stocks Have Not Reached Their Selling Climax Yet
Chart 9
US Stocks Have Not Reached Their Selling Climax Yet
US Stocks Have Not Reached Their Selling Climax Yet
Non-US Stocks Are Not Oversold Yet Neither global ex-US nor EM stocks are very oversold. Global ex-US and European share prices in SDR terms have been moving sideways for about 9-12 months prior to breaking down recently. Such a breakdown means a weakness in share prices that will likely last for a while. Chart 10
Non-US Stocks Are Not Oversold Yet
Non-US Stocks Are Not Oversold Yet
Chart 11
Non-US Stocks Are Not Oversold Yet
Non-US Stocks Are Not Oversold Yet
Chart 12
Non-US Stocks Are Not Oversold Yet
Non-US Stocks Are Not Oversold Yet
Chart 13
Non-US Stocks Are Not Oversold Yet
Non-US Stocks Are Not Oversold Yet
Growth Stocks Have Broken Down Various indexes of growth/TMT stocks have broken below their moving averages that have served as a support since spring 2020. This along with the fact that US interest rates will likely rise suggests that the bull market in growth stocks is either over or in for a prolonged hibernation. Chart 14
Growth Stocks Have Broken Down
Growth Stocks Have Broken Down
Chart 15
Growth Stocks Have Broken Down
Growth Stocks Have Broken Down
Chart 16
Growth Stocks Have Broken Down
Growth Stocks Have Broken Down
Chart 17
Growth Stocks Have Broken Down
Growth Stocks Have Broken Down
Is FAANGM A Bubble? In the past 12 years, US FAANGM stocks rose as much as the previous bubbles. When those bubbles peaked, their prices did not move sideways but rather collapsed. We do not assert that US FAANGM stocks will drop by more than 35% (we simply do not know). The point we would like to emphasize is that the bull market is over for now. At best, US growth stocks will likely be in a trading range in the coming 12-24 months. Chart 18
Is FAANGM A Bubble?
Is FAANGM A Bubble?
Chart 19
Is FAANGM A Bubble?
Is FAANGM A Bubble?
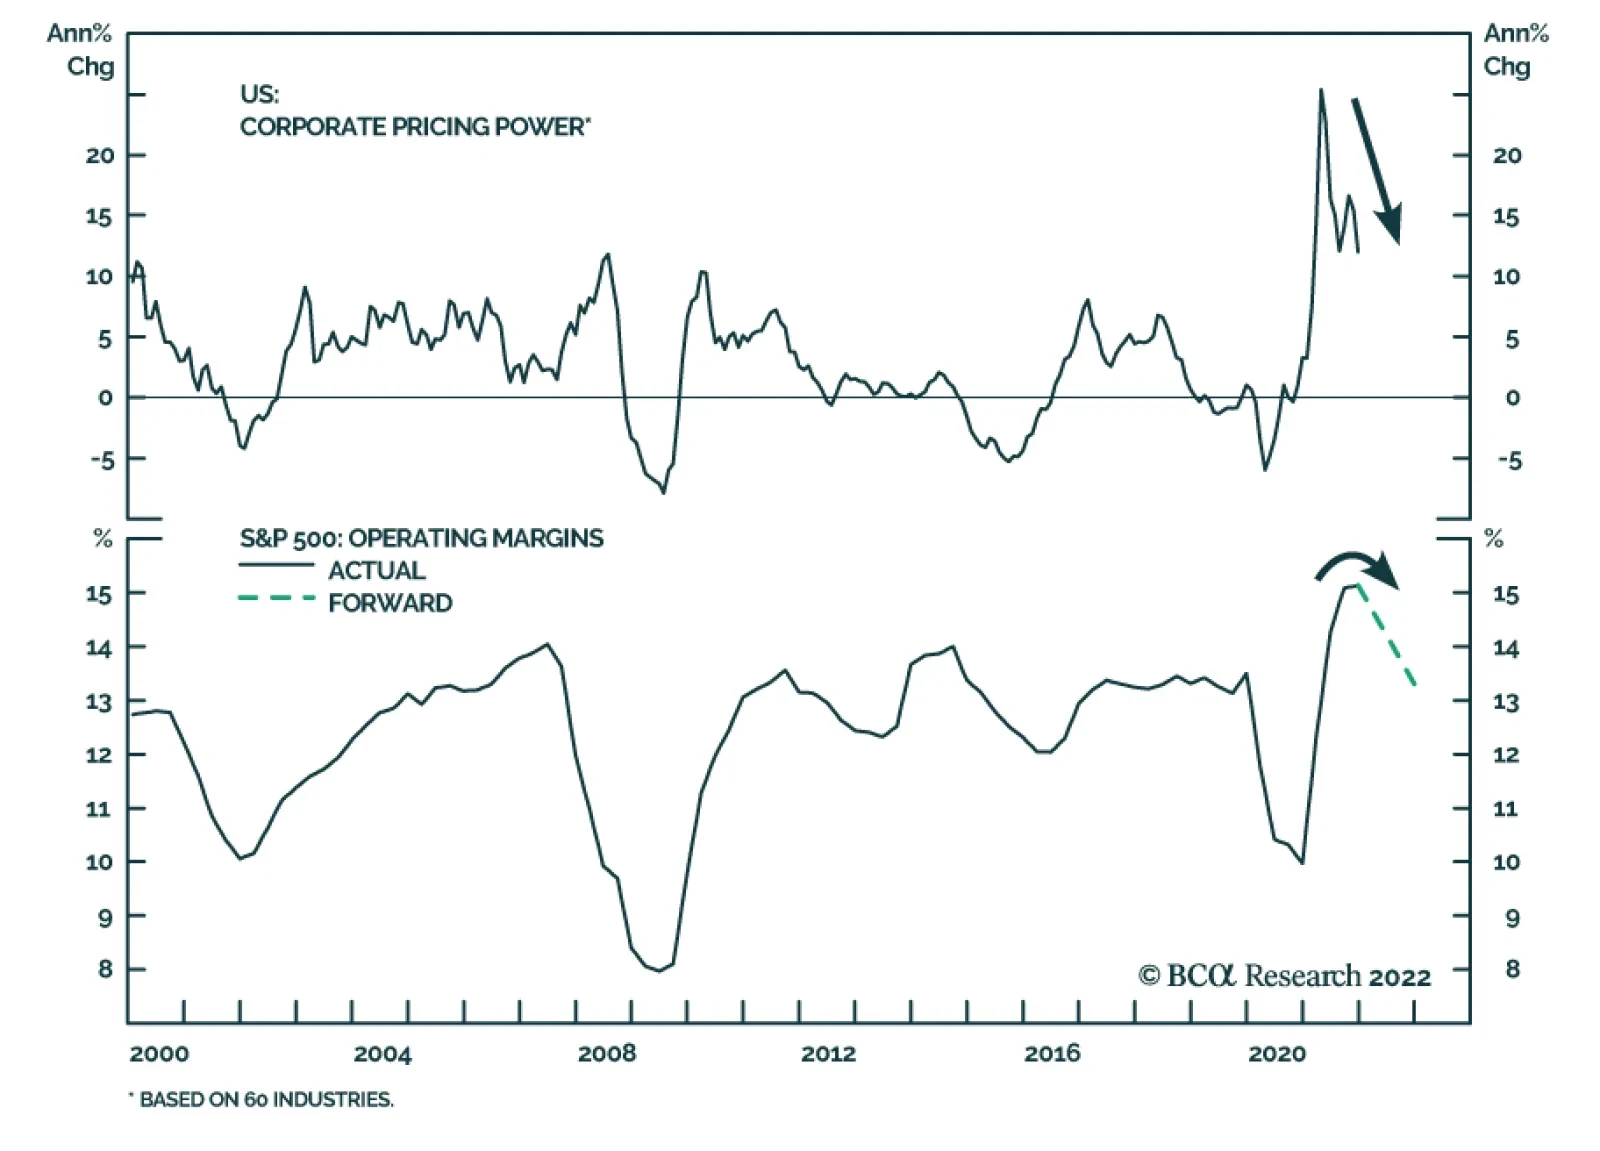
US Share Prices And Corporate Margins: Defying Gravity? From a very long-term perspective, the US equity market is rather overextended. Share prices in real terms are almost two standard deviations above their time trend. Similarly, corporate profits in real terms are also very elevated, not least in their reflection of record-high profit margins. The key questions for US equity investors are: (1) how persistent/sticky core inflation will be; and (2) how low corporate profit margins will drop. Wages are the key to both inflation and corporate margins. We believe wage growth will accelerate materially. That will be bad for the outlook of inflation and corporate profit margins, although it will be good news for corporate top lines. Chart 20
US Share Prices And Corporate Margins: Defying Gravity?
US Share Prices And Corporate Margins: Defying Gravity?
Chart 21
US Share Prices And Corporate Margins: Defying Gravity?
US Share Prices And Corporate Margins: Defying Gravity?
The Levels of EM Share Prices And Corporate Profits Have Been Flat For 12 years Contrary to the US, EM share prices are not overextended – they have been flat in absolute terms for the past 12 years. The reason for such dismal performance has been stagnant corporate profits. The latter have been flat-to-down in real terms for the past 12-14 years. A breakout in EM share prices in absolute terms will require their EPS entering a secular uptrend. While this is not impossible this decade, it is not imminent. Chart 22
The Levels Of EM Share Prices And Corporate Profits Have Been Flat For 12 Years
The Levels Of EM Share Prices And Corporate Profits Have Been Flat For 12 Years
Chart 23
The Levels Of EM Share Prices And Corporate Profits Have Been Flat For 12 Years
The Levels Of EM Share Prices And Corporate Profits Have Been Flat For 12 Years
Long-Term Equity Valuations (Cyclically-Adjusted P/E Ratio) Based on a cyclically-adjusted P/E (CAPE) ratio, EM stocks are close to their fair value. In contrast, based on the same measure, US equities are very overvalued. As a result, the relative CAPE ratio of EM versus the US is at a record low. Hence, on a multi-year horizon, odds are that EM share prices will outperform their US peers. In a nutshell, EM ex-China, Korea, Taiwan currencies are also close to their fair value. We will be looking to upgrade EM in the coming months. Chart 24
Long-Term Equity Valuations (Cyclically-Adjusted P/E Ratio)
Long-Term Equity Valuations (Cyclically-Adjusted P/E Ratio)
Chart 25
Long-Term Equity Valuations (Cyclically-Adjusted P/E Ratio)
Long-Term Equity Valuations (Cyclically-Adjusted P/E Ratio)
Chart 26
Long-Term Equity Valuations (Cyclically-Adjusted P/E Ratio)
Long-Term Equity Valuations (Cyclically-Adjusted P/E Ratio)
Chart 27
Long-Term Equity Valuations (Cyclically-Adjusted P/E Ratio)
Long-Term Equity Valuations (Cyclically-Adjusted P/E Ratio)
Investors Are Not Bearish On EM And Europe One missing factor to upgrade EM (non-US markets in general) is investor sentiment. Sentiment is neutral on EM stocks and is fairly upbeat on Europe. In brief, a capitulation has also not yet occurred in non-US markets. On the whole, the current EM sell-off will likely linger until sentiment becomes downbeat. Chart 28
Investors Are Not Bearish On EM And Europe
Investors Are Not Bearish On EM And Europe
Chart 29
Investors Are Not Bearish On EM And Europe
Investors Are Not Bearish On EM And Europe
Directional Indicators For EM Stocks Points To More Downside The cross rate between SEK (a pro-cyclical currency) and CHF (a defensive one) moves in tandem with EM share prices. The same holds for the NZD versus the USD. The rationale is as follows: all of these currencies correlate with the global business cycle and global risk-on/off trends. Presently, the SEK/CHF cross and the NZD point to lower EM share prices. Chart 30
Directional Indicators For EM Stocks Points To More Downside
Directional Indicators For EM Stocks Points To More Downside
Chart 31
Directional Indicators For EM Stocks Points To More Downside
Directional Indicators For EM Stocks Points To More Downside
The US Dollar Is To Rally Further The Fed’s willingness (for now) to hike rates is positive for the greenback. The trend in relative TIPS yields between the US and Germany heralds further USD strength against the euro. Also, the cross rate between SEK (a pro-cyclical currency) and CHF (a defensive one) entails more upside in the broad trade-weighted US dollar. Chart 32
The US Dollar Is To Rally Further
The US Dollar Is To Rally Further
Chart 33
The US Dollar Is To Rally Further
The US Dollar Is To Rally Further
Worrisome Market Profiles Several markets such as EM non-TMT share prices, Korean tech stocks, the Chinese onshore CSI300 stock index and silver prices have all failed to break above their 200-day moving averages and are now relapsing. Such a profile is often consistent with new cyclical lows in these markets. Chart 34
Worrisome Market Profiles
Worrisome Market Profiles
Chart 35
Worrisome Market Profiles
Worrisome Market Profiles
Chart 36
Worrisome Market Profiles
Worrisome Market Profiles
Chart 37
Worrisome Market Profiles
Worrisome Market Profiles
China’s Liquidity And Credit Cycles Even though China has heightened the pace of monetary easing, it will take several months before its credit impulse rebounds. On average, it takes about six months for reductions in the required reserve ratio (liquidity injections) to produce a meaningful recovery in the credit impulse. So far, the excess reserve ratio has stabilized but not improved. This means the credit impulse will continue stabilizing in the coming months, but a major rise is unlikely in the near term. In turn, the credit cycle leads share prices by several months. All in all, a risk window for China-related plays remains open in the coming months. Chart 38
China's Liquidity And Credit Cycles
China's Liquidity And Credit Cycles
Chart 39
China's Liquidity And Credit Cycles
China's Liquidity And Credit Cycles
Footnotes
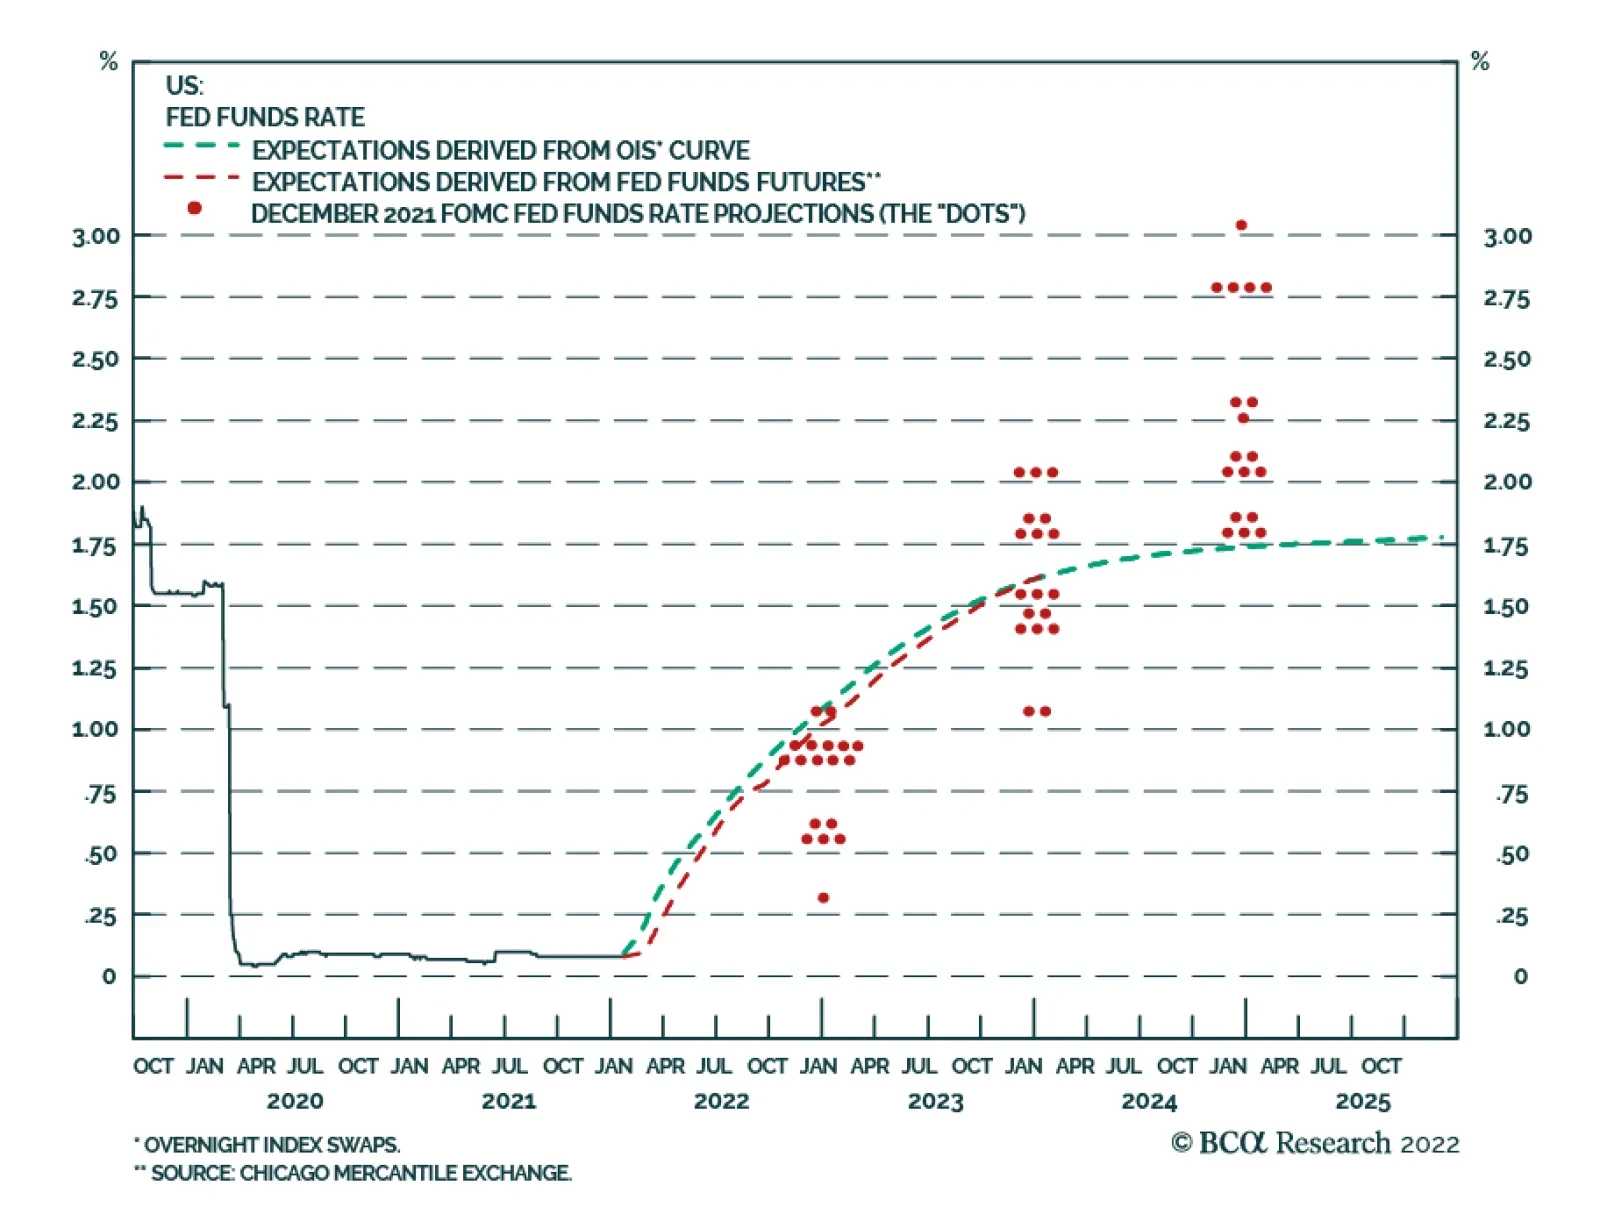
As expected, the Fed maintained the target range for the fed funds rate unchanged at 0 to 0.25% following its meeting on Wednesday. However, the FOMC statement noted that “it will soon be appropriate to raise the target range for the federal funds rate.” At…
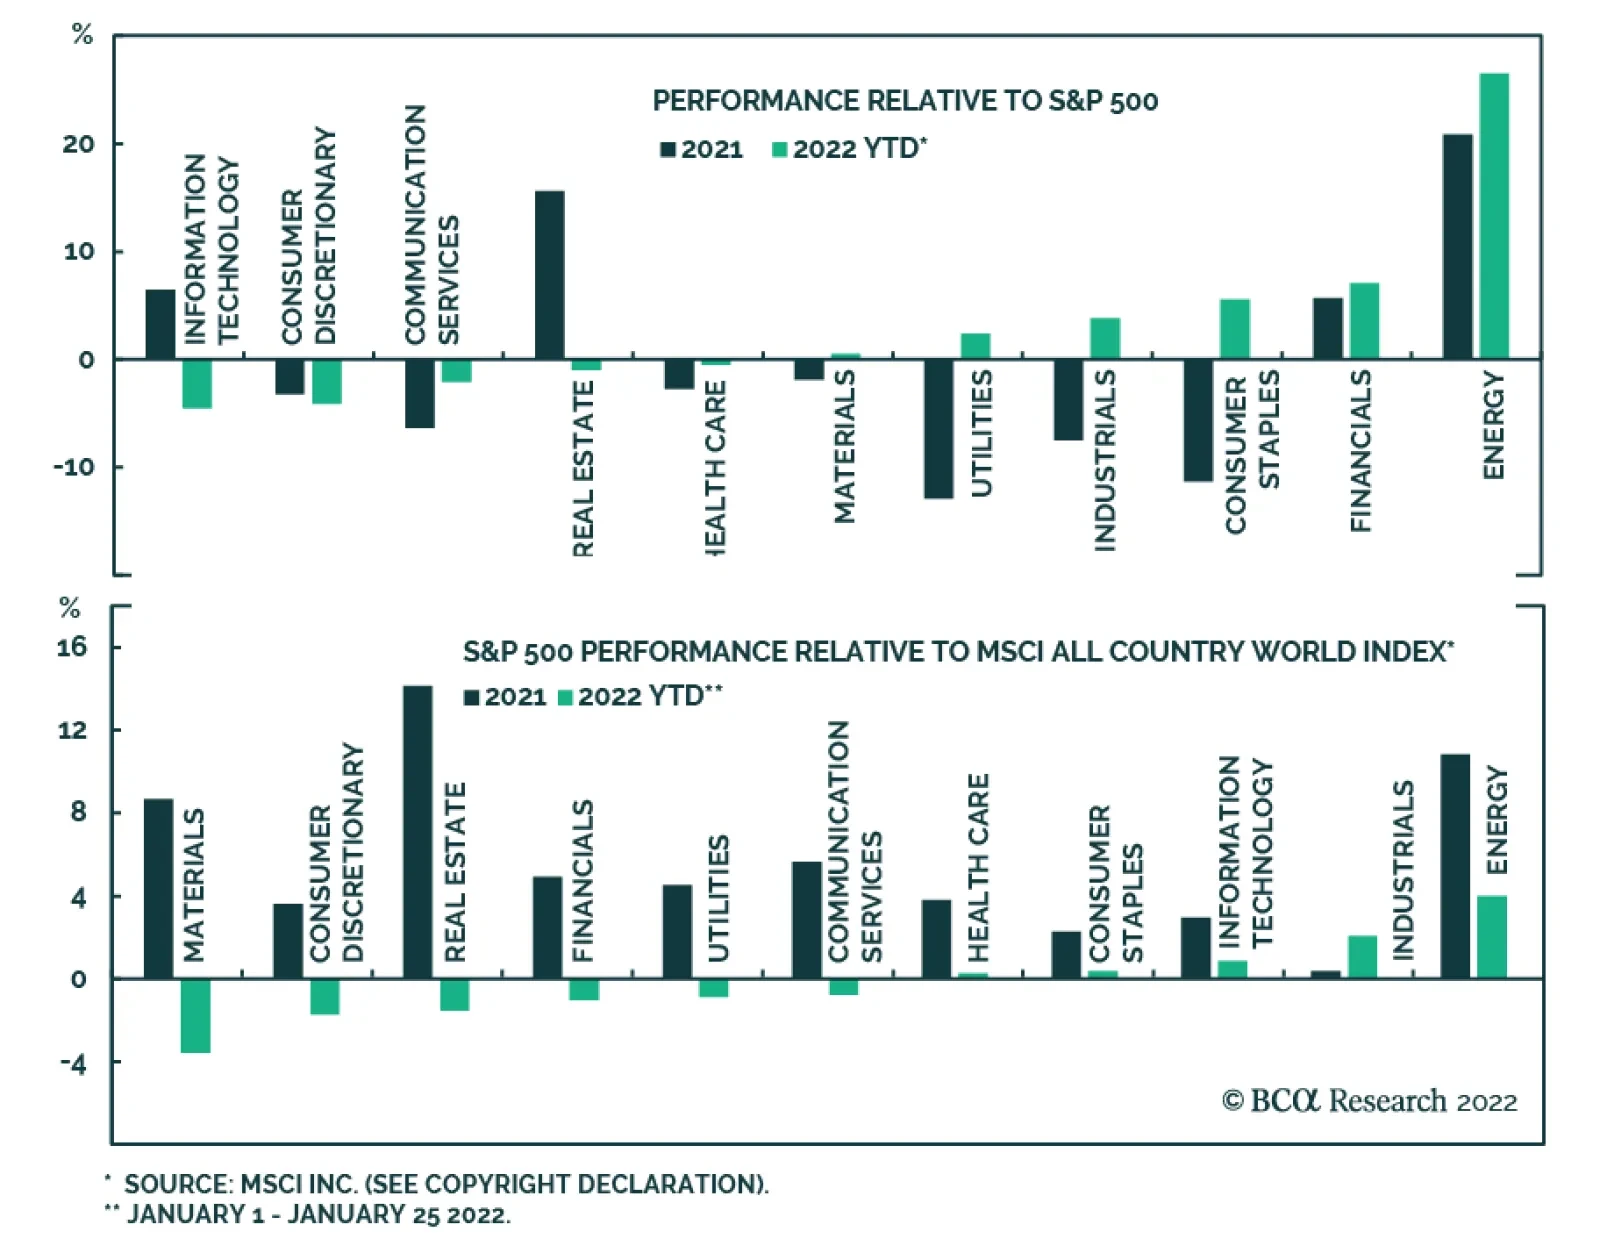
Earlier this week, we showed the performance of major global equity indices so far this year and highlighted that they are a mirror image of last year’s performance. Last year’s outperformers are underperforming so far this year. As we mentioned in that…
Highlights The Biden administration faces significant risks from outside the US economy – our third “key view” for 2022. The Ukraine conflict brings one external risk to the forefront. These external risks would exacerbate the global supply squeeze, potentially pushing up commodity prices until they start to kill demand. Investors should prepare for oil price overshoots. Exogenous risks – such as foreign policy crises – rarely help the president’s party in the midterm election. Any crisis that adds to short-term inflation will hurt the ruling party. Tactically we continue to prefer defensive equities. Close our tactical long industrials / short consumer discretionary trade for a gain of 11.6%. Close long energy stocks for a 15.6% gain and convert to long energy small caps versus large caps. Buy the dip in cyber security stocks. Feature Stock market volatility is back, thanks in no small part to external risks such as Europe’s energy shortage and Russia’s conflict with the West over Ukraine. In our forecast for 2022, we highlighted the Biden administration’s external risks as our third key view. The rapidly deteriorating geopolitical situation was one of several reasons behind this view and it has now clearly moved to the forefront. In this report we highlight the consequences for domestic-oriented US investors. Biden’s immediate external risks, if they materialize, will increase the likelihood that Democrats will lose control of Congress, causing US fiscal policy to freeze and driving policy uncertainty and the dollar upward. For detailed coverage of the Ukraine conflict and its global geopolitical, macro, and market implications please refer to our Geopolitical Strategy reports. Why Is Biden Vulnerable To External Risks The Biden administration and the Democratic Party face serious external risks in 2022. The Omicron variant and global supply constraints are a major factor. Also the US’s domestic political divisions invite challenges from abroad. President Biden is politically weak ahead of midterm elections on November 8. His net approval rating is under water at -10 percentage points. Republicans are now leading the generic congressional ballot with 45.5% support against Democrats’ 41.8%. On a deeper level, Democrats are beset by a socialist fringe on their left wing, making it difficult to pass legislation, and an enthusiastic nationalist opposition movement with a viable challenger for the presidency in 2024 (former President Trump). At best they will pass one more major bill this year before Congress gets gridlocked. Foreign rivals have an advantage in this context. America’s chief rivals face limited political constraints at home (no midterm elections) but they can make low-cost, high-impact threats against the Biden administration through their leverage over the global supply chain and hence voters’ pocketbooks. External Risks Are Inflationary (At Least At First) External risks begin with inflation. The US’s large imbalance of investment over savings is evident in a current account deficit of 3.3% and deteriorating terms of trade. American demand is exceedingly strong due to accumulated household savings, a new capex cycle, and lingering effects of monetary and fiscal stimulus. Yet global supply is impeded. Import prices are rising at a 5.7% rate, the fastest since the BLS started the series in 2010, while imports from China are rising at a 4.7% clip. China’s “zero Covid” policy implies that supply disruptions will keep up the inflationary pressure this year (Chart 1, first panel). The US is also importing inflation from rising commodity prices. West Texas Intermediate crude oil prices have risen to $83 per barrel and average gasoline prices stand at $3.3. With global supply-demand balances tight, WTI prices should average $77 per barrel this year and $78 next year, according to our Commodity & Energy Strategy. In this context, unplanned supply disruptions are likely and will put more pressure on the supply side. Any conflicts with oil producers such as Russia and Iran will backfire in the form of higher prices at the pump (Chart 1, second panel). Yet geopolitical competitors (Russia, Iran, China) have unfinished business with the US stemming from the Trump administration. It is also possible that Biden could negotiate diplomatic solutions, reducing the risk of an oil price spike, but that is not the current trajectory. Chart 1Biden's External Risks Are Inflationary For Now
Biden's External Risks Are Inflationary For Now
Biden's External Risks Are Inflationary For Now
Interest rate hikes from the Federal Reserve will not easily control inflation derived from external sources and supply constraints. They will take time to dampen domestic demand. Yet voters usually solidify their opinions by mid-summer. Inflation may not have come down much by that time. Biden and the Democratic Party are at the mercy of the global supply chain. In this context Russia deliberately forced its way to the top of the US and global agenda by demanding that the West renounce any attempt to threaten its national security via Ukraine or the former Soviet Union. Energy Shock From Russia? The Ukraine crisis threatens an increase in global energy prices. Russia provides 8% of Europe’s commodity imports, 18% of its energy imports, and 16% of its natural gas imports (Chart 2). Russia is already withholding energy supplies from Europe, helping push natural gas prices up by 122% since last August. If war ignites, Russia could reduce energy flows to Ukraine and hence to the rest of Europe. Europe would not be willing to impose as harsh of sanctions as the US because its energy supply depends on it. The US can increase exports to Europe but it cannot replace Russia without depriving its other allies and partners, including India, Japan, and South Korea (Chart 3). The squeeze will cause prices to rise at first but if it is not addressed by higher output from the US and OPEC 2.0, then demand will be destroyed. Note that in 1979, 2008, and 2014, Russian military invasions coincided with a peak in global oil prices. Chart 2Geopolitical Risks Cause Resource Squeeze
Biden’s External Risks
Biden’s External Risks
Chart 3Can US Replace Russia For Europe? Not Really.
Biden’s External Risks
Biden’s External Risks
If other supply problems emerged simultaneously, the slowdown could be especially disruptive. If US-Iran negotiations fail, then another energy supply risk will emerge immediately this spring. The implication is not only a rise in oil prices but also a resilient dollar, which is also the implication of the Fed’s looming rate hikes. Defensive plays would tend to beat cyclical plays, at least in the short run until the crisis abates. But it is important to look at previous examples of Russian aggression to test this hypothesis. US Market Response To Russian Belligerence When Russia invaded Georgia in August 2008, the attack had limited impact on global financial markets, which were focused on the subprime mortgage crisis unfolding on Wall Street. Naturally stocks underperformed bonds, cyclicals underperformed defensives, and value went sideways against growth. Small caps rallied at first versus large caps but then hit a turning point from outperformance to underperformance (Chart 4). Note that the invasion began while President Putin watched the summer Olympics live in Beijing. So one cannot rule out a limited military action against Ukraine in the near term just because Putin is also headed to Beijing for this winter’s Olympics. When Russia invaded Ukraine in February 2014, seizing the Crimean peninsula in the Black Sea, the attack had a greater impact on global financial markets than with Georgia, although Ukraine’s relevance to the global economy was (and is) still limited. Chart 4Market Reaction To Russia Invasion Of Georgia, 2008
Market Reaction To Russia Invasion Of Georgia, 2008
Market Reaction To Russia Invasion Of Georgia, 2008
Chart 5Market Reaction To Russia Invasion Of Ukraine, 2014
Market Reaction To Russia Invasion Of Ukraine, 2014
Market Reaction To Russia Invasion Of Ukraine, 2014
Bonds outperformed stocks, cyclicals were flat-to-up against defensives (energy clearly outperformed defensives), and small caps stumbled but then beat out large caps (Chart 5). Energy stocks theoretically stood to benefit but crashed later that year due to supply glut and China policy tightening. In 2022 the situation is different from these previous Russian invasions in that the world is already in the thrall of an energy supply squeeze brought on by various factors. China’s economy is growing slowly but authorities are easing policy. A comparison of the winter of 2021-22 with that of 2013-14, when Russia invaded Crimea, suggests that energy stocks have already far outpaced growth and defensives (Chart 6). Energy small caps, however, could rally substantially against large cap peers. Tactically US investors should maintain a risk-averse positioning until the Russians make a military decision and the West announces its retaliatory measures. This analysis suggests that cyclicals and small caps face volatility but can ultimately grind higher after the onset of any new war in Ukraine. The magnitude of the war will obviously matter, which is why we maintain a defensive tactical positioning. The next question centers on the medium-term policy impact of Biden’s external risks. Chart 6Market Context: 2022 Versus 2014
Market Context: 2022 Versus 2014
Market Context: 2022 Versus 2014
Implications For US Midterms And Policy It is possible that Biden’s external risks will play a role in the 2022 midterms. It depends on which risks materialize. Most likely a Russian re-invasion of Ukraine would have a negative effect on the Democrats, especially if it adds to voters’ inflation woes. Major foreign policy successes or failures have a substantial impact on a president’s re-election chances but midterms are less obvious. Midterms almost always go against the president’s party because the previous election’s losers turn out in droves while winners sit home in complacency or disillusionment. The midterm electorate tends to be older, whiter, and more educated than the presidential electorate. Chart 7 shows only midterm elections in which external risks – such as foreign policy – played a major role. In the House, the only time the president’s party gained seats was in 2002, though it only lost four seats in 1962. In the Senate, the president’s party gained seats in 1962, 2002, and 2018 and only lost 2 seats in 1954. From these points we can draw the following conclusions: Chart 7US Midterm Elections: Ruling Party Performance Amid Foreign Policy Crises
Biden’s External Risks
Biden’s External Risks
Foreign policy crises do not generally help the president’s party. While major crises like 9/11 helped the Republicans, and the 1962 Cuban Missile Crisis minimized Democrats’ losses, nevertheless the 1942 midterm occurred after Pearl Harbor and the Democrats lost seats. Minor crises like the 1958 “Lebanon Crisis” also do not help. Russia’s invasion of Ukraine in 2014 falls under this category and did not help President Obama’s Democrats. A major threat to the homeland can help the president’s party on the margin. This is the significance of 1962 and 2002. The ruling party either minimized losses or made absolute gains in the House, while gaining seats in the Senate. (The 2018 midterm is the other case in which the president’s party gained Senate seats, amid President Trump’s trade war with China, but Republicans suffered heavily in the House.) Wartime escalation and entanglement hurt the president’s party. President Johnson’s Democrats suffered deep losses in 1966, as did President George W. Bush’s Republicans in 2006. Obama’s troop surge in Afghanistan was not the main issue but did not help his party in 2010. Ceasefires and peace treaties do not help the president’s party, even when the end of the war is seen as a victory. World War I was drawing to a close in 1918 but Democrats suffered for having gotten the US involved. Democrats also lost in 1946, despite US triumph in WWII. The Korean war ended on a far more ambivalent note and Republicans suffered at the ballot box. Vietnam was drawing to an ignominious close in 1974, which also occurred in the aftermath of the Arab oil embargo, recession, and Watergate scandal, so no surprise Republicans lost seats. If there is a foreign policy crisis this year, the “best case” for Biden’s Democrats – in crass political terms – would be one that engenders a patriotic rally, like happened with the Cuban Missile Crisis or 9/11. If Democrats only lose four seats in 2022, like Kennedy in 1962, they will have a one-seat majority in the House. However, this best-case scenario is unlikely. As noted, 1962 and 2002 consisted of direct threats to the US homeland. All other crises either hurt or did not help the president’s party. In 2014, while voters had other things on their minds that year, Russia’s invasion of Crimea reinforced criticisms of Obama’s foreign policy already centered on Libya, Syria, and Iran. Obama responded with sanctions and aid to Ukraine, as Biden threatens to do today. Democrats lost 13 seats in the House and 9 seats in the Senate. A similar negative impact should be expected if Russia re-invades in 2022. Biden is already vulnerable: his approval rating collapsed after his messy withdrawal from Afghanistan (reinforcing the fourth bullet about ending wars above). A new foreign policy crisis could cement the narrative of foreign policy incompetence. It matters a great deal whether an exogenous crisis automatically hurts the voter’s pocketbook. If it does, then any initial rally around the flag will fade over time, leaving the negative material impact behind and angering voters. In 1974, President Ford’s approval rating shot up above 50% as he took over from Nixon, yet his party still suffered from the inflationary economic backdrop and dour foreign policy backdrop. In 1978, President Carter’s approval rating also recovered to nearly 50% in time for the vote but it was not enough to overcome inflationary malaise – and Iranian oil strikes began in September (Chart 8). If we subtract the Misery Index (unemployment plus inflation) from the president’s approval rating, we see that Kennedy had a 70% approval during the Cuban Missile Crisis, and Bush had a 62% approval in 2002. But Johnson and Carter were sinking toward 35% during their first midterms, which is where Biden stands today (Chart 9). Chart 8Different Reactions For Different Crises
Biden’s External Risks
Biden’s External Risks
Chart 9Best And Worst Case Scenarios Of Foreign Policy Crisis For Democrats
Biden’s External Risks
Biden’s External Risks
Thus Biden’s external risks, depending on which ones materialize, suggest that the Democratic Party will face another headwind in November. Democrats are very likely to lose the House and somewhat likely to lose the Senate. Gridlock is already setting in – as will be apparent with the potential government shutdown over the February 18 deadline to pass spending bills. But the midterm will formalize it. Policy uncertainty will continue to creep up and weigh on investor risk appetite this year. In other words, even if cyclicals rally through a Ukraine conflict, they may not outperform defensives later this year. Investment Takeaways Cyclically we are booking an 15.6% gain on our long energy trade and will convert it to a long US energy small caps relative to large caps trade. The external risks highlighted in this report would push up oil prices at least initially (Chart 10). However, volatility will pick up from here. OPEC 2.0 will want to keep Brent crude prices from settling above the $90 per barrel that starts to crimp demand, as our Commodity & Energy Strategy argues. Higher prices will also encourage new production, including from the US shale patch (Chart 11). Note that energy stocks, like other cyclicals, tend to underperform during midterm election years as policy uncertainty affects markets. Chart 10Book Gains On Tactical Long Energy Equities Trade
Book Gains On Tactical Long Energy Equities Trade
Book Gains On Tactical Long Energy Equities Trade
Chart 11US Oil Producers Will Step Up
US Oil Producers Will Step Up
US Oil Producers Will Step Up
Tactically we recommend closing our long industrials / short consumer discretionary for a gain of 11.6%. Normally, consumer discretionary stocks are the best performing sector during midterm election years while industrials are the worst. But because of China’s policy easing, we took a tactical bet that the opposite would occur at the start of the year. However, external risks should now cause this situation to reverse by pushing up the dollar, penalizing industrials, without hurting the American consumer too much (Chart 12). Industrial equities are pricing in strong capex intentions but geopolitical conflicts would weigh on those intentions, while new orders and core durable goods orders could suffer a bit (Chart 13). The midterms will come into focus later this year and weigh on industrials as well. Chart 12Close Long Industrials Trade For Now
Close Long Industrials Trade For Now
Close Long Industrials Trade For Now
Chart 13Industrials Still Attractive On Cyclical Basis
Industrials Still Attractive On Cyclical Basis
Industrials Still Attractive On Cyclical Basis
Cyclically stick with cyber security stocks. They have sold off along with the tech sector as interest rates rise. But long cyber security is a secular investment thesis based on digitization of the economy, rising cyber crime, and geopolitical risk. Tensions with Russia, proxied by the fall in the ruble and rise in aerospace/defense stocks, point to the fact that investors recognize international tensions will remain high (Chart 14). Cyber space will remain an area of conflict even if physical conflict does not materialize. Growth stocks should also revive later as midterm policy uncertainty picks up. Chart 14Cyber Security Is A Secular Trade ... Buy The Dip
Cyber Security Is A Secular Trade ... Buy The Dip
Cyber Security Is A Secular Trade ... Buy The Dip
Chart 15Overweight Health Care Amid Political Risk
Overweight Health Care Amid Political Risk
Overweight Health Care Amid Political Risk
Tactically stick with overweight health care on rising uncertainty and expectations that the dollar will pick up (Chart 15). Defensives, especially health, should also outperform as the year goes on and midterms approach. Pricing power is returning to the sector but the Biden administration only has a little legislative ammunition left and its regulatory focus lies elsewhere for now. Matt Gertken Vice President US Political Strategist mattg@bcaresearch.com Strategic View Open Tactical Positions (0-6 Months) Open Cyclical Recommendations (6-18 Months) Table A2Political Risk Matrix
Biden’s External Risks
Biden’s External Risks
Table A3US Political Capital Index
Biden’s External Risks
Biden’s External Risks
Image
Image
Table A4APolitical Capital: White House And Congress
Biden’s External Risks
Biden’s External Risks
Table A4BPolitical Capital: Household And Business Sentiment
Biden’s External Risks
Biden’s External Risks
Table A4CPolitical Capital: The Economy And Markets
Biden’s External Risks
Biden’s External Risks
Highlights Federal Reserve: Market turbulence will not dissuade the Fed from starting to hike rates in March, with longer-term consumer inflation expectations climbing steadily higher. Given the choice of fighting high inflation or supporting asset prices, the Fed will choose the former as tightening financial conditions are not yet an impediment to above-trend US economic growth. Canada: Canadian growth is set to recover as the intense Omicron wave has peaked, further intensifying inflationary pressures. The Bank of Canada has all the information from its consumer and business surveys to justify hiking rates immediately, particularly with inflation expectations above the central bank’s 1-3% target range. Stay underweight Canadian government bonds in global fixed income portfolios, as markets have not yet discounted the likely cyclical peak in policy interest rates. Feature Chart of the WeekA Less Friendly Policy Backdrop For Risk Assets
A Less Friendly Policy Backdrop For Risk Assets
A Less Friendly Policy Backdrop For Risk Assets
Risk assets have taken a beating over the past week, with major equity indices in the US and Europe suffering the sharpest selloffs seen since the early days of the pandemic. There are many sources of investor angst fueling the risk aversion wave - a potential Russian invasion of Ukraine, some mixed results on Q4/2021 corporate earnings reports, the lingering Omicron wave and most importantly, fears of tighter global monetary policy. The latter is most evident in the US, with a few prominent Wall Street investment banks now calling for the Fed to deliver much more than the 3-4 rate hikes currently discounted for 2022. The Fed is now in a difficult spot. Realized US inflation remains very high, supply chain disruptions are not going away, and wage growth is accelerating amid tight US labor market conditions. Survey-based consumer inflation expectations show little sign of peaking, with longer-term expectations now climbing steadily higher. As a result, the Fed has been forced to rapidly shift its policy guidance in a more hawkish direction. These trends are not unique to the US, however, as similar inflation dynamics are playing out in places like the UK and Canada where central banks are also expected to deliver a lot of monetary tightening this year (Chart of the Week). For inflation targeting central banks, a surge in inflation that becomes increasingly embedded in longer-term inflation expectations is a direct challenge to their credibility. The policy prescription must involve monetary tightening to raise real interest rates in a bid to stabilize inflation expectations. At the same time, given the starting point of near-0% nominal policy rates and high inflation, deeply negative real interest rates have a lot of room to rise before becoming a serious restraint on economic growth. This limits how far bond yields can decline in response to a generalized risk-off move like the one seen over the past week. For financial markets hooked on easy monetary policies, an inflation-induced monetary tightening cycle will lead to even higher bond yields – especially real yields - and more frequent bouts of market volatility this year. The events of the past week will likely not be a one-off. The Fed Cares About Inflation, Not Your Equity Portfolio US equity markets have had a rough start to 2022. The S&P 500 is down -9% so far in January, with the tech-heavy NASDAQ index down a whopping -13% (Chart 2). The VIX index now sits at 31, nearly double the level seen at the end of 2021. The selloff in risk assets has occurred alongside an increase in real US bond yields. TIPS yields for the 2yr, 5yr and 10yr maturities are up +20bps, +36bps and +43bps, respectively since the start of the year - a reflection of increasing Fed rate hike expectations. Yet other financial markets have seen more limited swings so far in 2022. Non-US equities are sharply outperforming the US; the EuroStoxx index of European equities is down -6%, while the MSCI emerging market (EM) equity index is down just -2%. US investment grade and high-yield spreads, using the Bloomberg benchmark indices, are up a relatively modest +9bps and +36bps, respectively, while the DXY US dollar index is up only +0.4%. The risk asset selloff seen year-to-date has been sharp, but has likely not been enough for the Fed to postpone the expected March liftoff of the fed funds rate. US financial conditions have tightened, but not nearly by enough to make the Fed to more concerned about the US economic growth outlook (Chart 3). Also, financial markets appear to be functioning normally, suggesting what is happening is a repricing of risk assets rather than a selloff driven by poor market liquidity conditions. Chart 2A 'Real' Equity Market Correction
A 'Real' Equity Market Correction
A 'Real' Equity Market Correction
Chart 3High Inflation, Not High Asset Values, is The Fed's Biggest Concern
High Inflation, Not High Asset Values, is The Fed's Biggest Concern
High Inflation, Not High Asset Values, is The Fed's Biggest Concern
The bigger risk to US growth may actually come from high inflation, rather than falling asset values. Real US household income growth, derived from responses in the New York Fed’s Survey of Consumer Expectations to individual questions on incomes and inflation, is expected to contract -3% over the next year (bottom panel). Given that decline in perceived spending power, with inflation far exceeding wage growth, it is no surprise that the University of Michigan consumer confidence index is near an 8-year low. US business confidence has also been hit by high inflation. The NFIB survey of small business sentiment and the Conference Board survey of corporate CEO confidence declined in the latter half of 2021, largely in response to inflationary supply chain disruptions and labor shortages. Nearly one-quarter of NFIB survey respondents cite “inflation” as the single most important problem in operating their businesses. Economic sentiment has clearly taken a hit because of elevated US inflation, even with the US unemployment rate at 3.9% and overall real GDP growth remaining solidly above trend. This suggests that slowing inflation could actually provide a more sustainable boost to the US growth through improved confidence – if the Fed can first successfully engineer a “soft landing” for the economy once it begins hiking rates. The problem the Fed now faces is that the high inflation of the past year is starting to leak into longer-term survey-based measures of inflation expectations. 5-10 year ahead consumer inflation expectations from the University of Michigan survey are now at a 10-year high of 3.1%, while the 10-year-ahead inflation forecast from the Philadelphia Fed’s Survey of Professional Forecasters is at a 23-year high of 2.6% (Chart 4). Market-based inflation expectations like TIPS breakevens have stopped rising, as a more hawkish Fed has boosted real TIPS yields, but remain elevated at levels consistent with the Fed achieving, but not exceeding, it's 2% medium-term inflation target (bottom panel). The combination of a tight US labor market and consumers expecting more inflation raises the risk that the US could enter a wage-price spiral, where workers demand wage increases in response to higher inflation and companies are therefore forced to raise prices to maintain profitability. The conditions for a wage-price spiral seem to now be in place in the US (Chart 5): unemployment is low, wages are accelerating and a growing number of US workers are quitting jobs to find better work. Perhaps most importantly, US consumers are more uncertain about where inflation will be in the future. Chart 4US Inflation Expectations Becoming More Entrenched
US Inflation Expectations Becoming More Entrenched
US Inflation Expectations Becoming More Entrenched
Chart 5The Start Of A US Wage/Price Spiral?
The Start Of A US Wage/Price Spiral?
The Start Of A US Wage/Price Spiral?
The New York Fed Survey of Consumer Expectations asks respondents to place probabilities on certain ranges for future US inflation rates one and three years ahead. The probability-weighted average of those inflation rates is dubbed “inflation uncertainty”, and those have doubled over the past year from 2% to 4% (bottom panel). This means that the survey respondents now see higher inflation outcomes as more probable, which will likely result in increased wage demands to “keep up” with the cost of living. With the US labor market looking tight as a drum, amid extensive shortages of quality workers as reported in business confidence surveys, the odds of wage increases because of higher inflation instead of higher productivity – a.k.a. a wage-price spiral – have shot up significantly. Already, the 5-year-annualized growth rate of US unit labor costs has doubled since the start of the pandemic (Chart 6), evidence that wage increases are not being matched by faster productivity. Given the strong historical correlation between unit labor cost growth and core inflation in the US, the rise in the latter will be more persistent if US workers ask for bigger cost-of-living driven wage increases. Chart 6Rising US Labor Costs Provide A Lasting Boost To US Inflation
Rising US Labor Costs Provide A Lasting Boost To US Inflation
Rising US Labor Costs Provide A Lasting Boost To US Inflation
Chart 7
Former Fed Chair Alan Greenspan famously described “price stability” – the Fed’s stated medium-term goal - as a situation where “… households and businesses need not factor expectations of changes in the average level of prices into their decisions.” This is clearly not the situation in the US today, which is why the Fed has no choice but to move ahead with interest rate increases to begin the road back to price stability. Financial market selloffs may actually assist the Fed in achieving that goal through tighter financial conditions, thereby limiting how much interest rates must increase to cool off above-trend US economic growth. Interest rates must still go up first, though – especially in real terms. Already, investors have adjusted to that reality by lifting their medium-term “real rate expectations”. We proxy the latter by taking the difference between the forward path for nominal US interest rates discounted in the US overnight index swap (OIS) curve and the forward path of US inflation discounted in the US CPI swap curve. Over just the past month, that market-implied forward path for the real fed funds rate has shifted from discounting an average level of around -1% over the next decade to something closer to -0.25% (Chart 7). We anticipate that those real rate expectations will move even higher as the Fed begins to hike rates in March and continues its tightening cycle over the next 1-2 years. This will underpin the move higher in US bond yields that we expect this year, for both government and corporate debt, with the benchmark 10-year Treasury yield reaching a high of 2.25% by year-end. Bottom Line: Market turbulence will not dissuade the Fed from starting to hike rates in March. Longer-term consumer inflation expectations are climbing steadily higher, which is starting to feed into higher wage demands in a very tight labor market. Given the choice of fighting high inflation or supporting asset prices, the Fed will choose the former as tightening financial conditions are not yet an impediment to above-trend US economic growth. Stay below-benchmark on US interest rate exposure, both in terms of duration and country allocation, in global bond portfolios. Canada Update: The BoC Has A Lot Of Work To Do The Bank of Canada (BoC) meets this week and we anticipate that the first rate hike of this tightening cycle will be announced. This will just be the beginning of what will likely be an extended cycle. Canadian monetary conditions are far too accommodative given above-trend growth and accelerating inflation. The BoC places a lot of analytical weight on its Business Outlook Survey when assessing the state of the Canadian economy. The Q4/2021 survey signaled very strong business confidence and robust demand (both domestic and foreign), with a growing majority of firms surveyed planning to increase investment and hiring over the next year (Chart 8). Survey respondents also reported significant capacity constraints, especially in industries that have experienced strong demand during the pandemic, like retail, manufacturing and housing. This is related to global supply chain disruptions, but also to intensifying labor shortages. Chart 8A Bright Outlook For The Canadian Economy
A Bright Outlook For The Canadian Economy
A Bright Outlook For The Canadian Economy
The survey was conducted before the Omicron variant began to spread through Canada, which lead to the reimposition of severe economic restrictions. The number of Canadian COVID cases has peaked, however, and some restrictions have already begun to be lifted in Ontario, Canada’s largest province by population. The economic impact of Omicron will therefore be concentrated in the first couple of months of 2022 and should not derail the hiring and investment plans indicated in the Business Outlook Survey. A reacceleration of Canadian economic growth post-Omicron would magnify high Canadian inflation at a time of intense capacity constraints and tight labor markets. The Canadian unemployment rate fell to 5.9% in December, just 0.2 percentage points above the pre-COVID low seen in February 2020. Headline CPI inflation reached a 31-year high of 4.8% in December 2021, with trimmed CPI inflation (which omits the most volatile components) reaching an 30-year high of 3.7% (Chart 9). The rise in inflation has been broad-based, with large increases seen for both goods inflation (6.8%) and services inflation (3.7%). Like the US, high inflation is becoming more embedded in survey-based inflation expectations. Canadian businesses expect inflation to be 3.2% over the next two years, according to the Business Outlook Survey.1 Canadian consumers expect inflation to be 4.9% over the next year and 3.5% over the next five years, according to the BoC’s Canadian Survey Of Consumer Expectations (Chart 10). The latter had been very stable around 3% since the survey began back in 2014, thus the 0.5 percentage point jump seen in the latest quarterly survey is a highly significant move that suggests the 2021 inflation surge is become more embedded in Canadian consumer psychology. Chart 9The BoC Has An Inflation Problem On Its Hands
The BoC Has An Inflation Problem On Its Hands
The BoC Has An Inflation Problem On Its Hands
Chart 10Canadian Consumer Inflation Expectations Are Rising
Canadian Consumer Inflation Expectations Are Rising
Canadian Consumer Inflation Expectations Are Rising
The Canadian inflation backdrop has similarities to the US situation described earlier in this report. Like the US, one-year-ahead Canadian consumer inflation expectations are far above wage expectations (only +2%), which suggests that Canadian consumers expect real wages to contract -2.9%. Also like the US, falling real wage expectations are acting as a drag on Canadian consumer confidence (bottom panel). And also like the US, we expect Canadian workers to increase their wage demands to restore real purchasing power, potentially starting a wage-price spiral. Given widespread Canadian labor market shortages, this process has likely already started. According to the BoC Business Outlook Survey, 43% of firms had to boost wages in Q4/2021 because of “cost of living adjustments”, compared to 29% in Q3/2021 (Chart 11). An even larger share of respondents in the Q4 survey (54%) reported having to raise wages to attract and retain workers, up significantly from Q3 and an indication of how Canadian firms are seeing their wage bill go up trying to find quality labor in a tight job market.
Chart 11
Given the messages on growth and inflation from its surveys, the BoC has all the evidence it needs to begin the rate hiking process as soon as possible. The bigger question is how high will rates have to go to cool off Canadian economic growth and bring inflation back into the BoC’s 1-3% target range. The BoC’s own internal models estimate that the neutral level of the policy interest rate is between 1.75% and 2.75%. Those estimates were last produced back in April 2021, however, and the range may need to be revised higher to reflect the changes seen in the Canadian economy since then – most notably the greater supply constraints and higher inflation. At a minimum, the BoC will likely have to raise the policy rate to the higher end of its last estimated range for the neutral rate. Current market pricing in the Canadian OIS curve discounts the BoC hiking the policy rate from 0.25% today to 1.6% by the end of 2022 (Chart 12). With eight scheduled BoC policy meetings this year, including this week, the 2022 pricing is realistically achievable. However, only another 50bps of hikes are priced for 2023 and no additional hikes after that. Chart 12Markets Are Underestimating The Likely Cyclical Peak In Canadian Rates
Markets Are Underestimating The Likely Cyclical Peak In Canadian Rates
Markets Are Underestimating The Likely Cyclical Peak In Canadian Rates
Chart 13Stay Underweight Canadian Government Bonds
Stay Underweight Canadian Government Bonds
Stay Underweight Canadian Government Bonds
A peak policy rate around 2% would only be in the lower half of the BoC’s range of neutral rate estimates. It would also represent a very low peak real rate of 0% assuming inflation returns to the midpoint of the BoC target range. It is possible that markets are underestimating how high the BoC will have to lift rates, both in nominal and real terms, because of a fear that rate increases will hurt highly indebted Canadian homeowners and trigger a sharp pullback in house prices. This is a legitimate concern given the stretched housing valuations across most major Canadian cities. However, the BoC is facing the same credibility issue that the Fed and other inflation-targeting central banks are facing in the pandemic era. Canadian inflation is too high and becoming more embedded in inflation expectations. Also like the Fed, the BoC will have to fight the inflation battle now and deal with the collateral damage on financial conditions (and the housing market) later. Importantly, with the Fed also likely to deliver several rate hike in 2022. Thus, the BoC has less need to fear a surge in the Canadian dollar, driven by widening interest rate differentials, that could aggressively tighten financial conditions beyond the impact on asset markets and house prices from higher interest rates (Chart 13). Summing it all up, we maintain our negative strategic outlook on Canadian government bonds as markets are underestimating the tightening that will be required from the BoC over the next 1-2 years. Bottom Line: The Bank of Canada has all the information from its consumer and business surveys to justify hiking rates immediately, particularly with medium-term consumer inflation expectations now above the central bank’s 1-3% target range. Stay underweight Canadian government bonds in global fixed income portfolios, as markets have not yet discounted the likely cyclical peak in policy interest rates. Robert Robis, CFA Chief Fixed Income Strategist rrobis@bcaresearch.com Footnotes 1 Business inflation expectations calculated as the share of respondents reporting expected inflation within a certain range multiplied by the midpoint of the range. We assume a value of 0.5 for “less than 1” and a value of 3.5 for “greater than 3”. GFIS Model Bond Portfolio Recommended Positioning Active Duration Contribution: GFIS Recommended Portfolio Vs. Custom Performance Benchmark
Image
The GFIS Recommended Portfolio Vs. The Custom Benchmark Index Global Fixed Income - Strategic Recommendations* Duration Regional Allocation Spread Product Tactical Overlay Trades
The latest Business Conditions Survey from the National Association for Business Economics, which was conducted in the first two weeks of January, indicates that firms expect a profit margin compression. On the one hand, the survey reveals that business…