United States
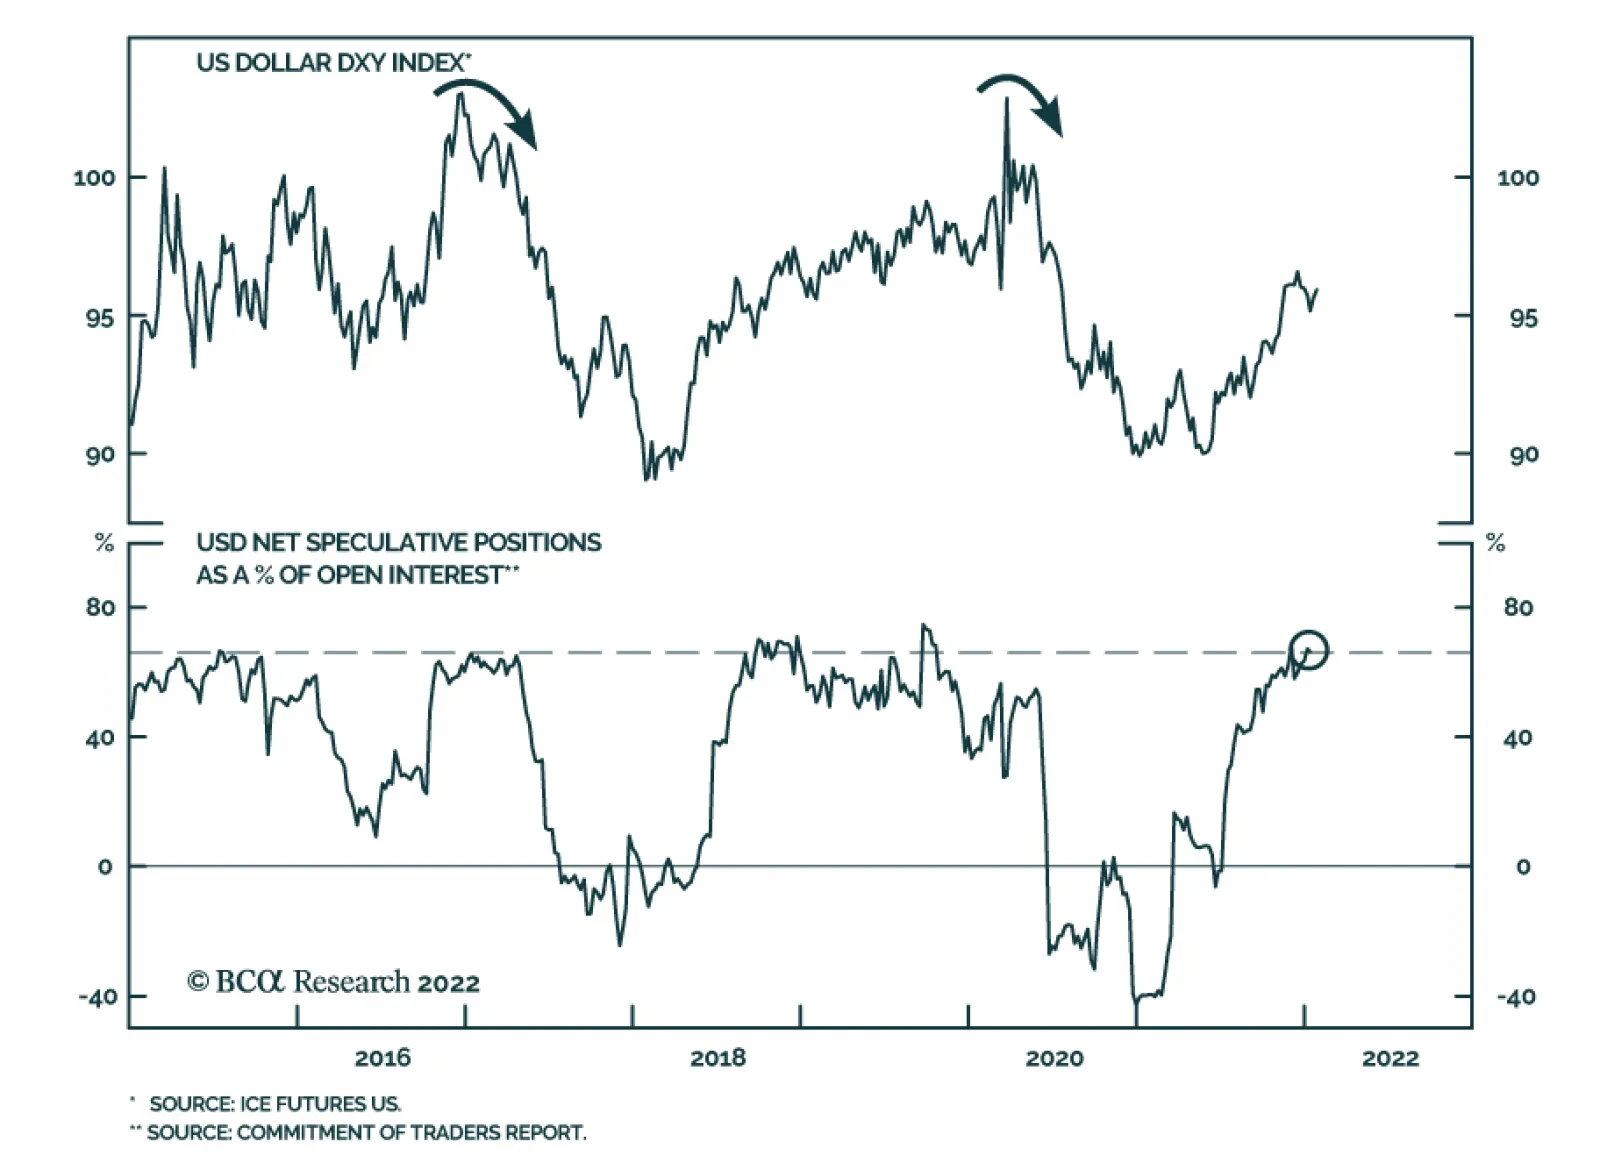
Will dollar strength experienced in the back half of 2021 continue in 2022? The macroeconomic backdrop suggests otherwise. The dollar is typically a counter-cyclical currency which tends to outperform during risk-off periods. We expect global growth to remain…
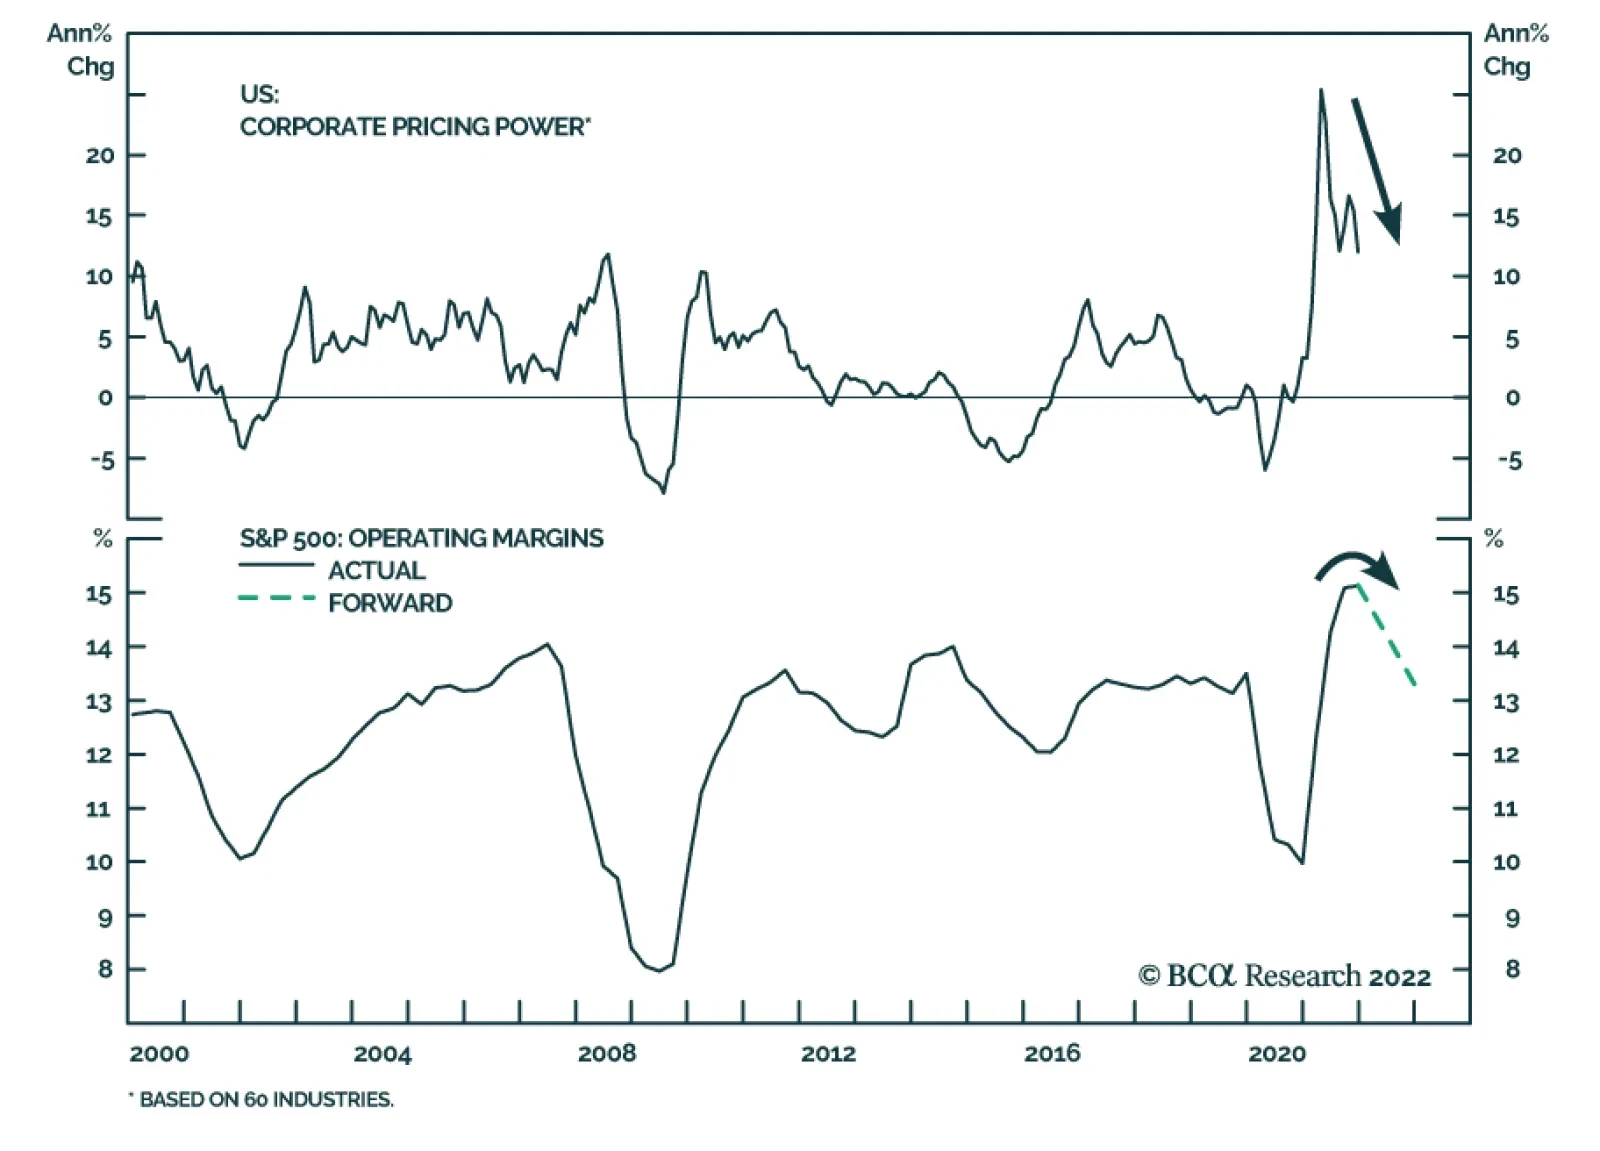
The latest Business Conditions Survey from the National Association for Business Economics, which was conducted in the first two weeks of January, indicates that firms expect a profit margin compression. On the one hand, the survey reveals that business…
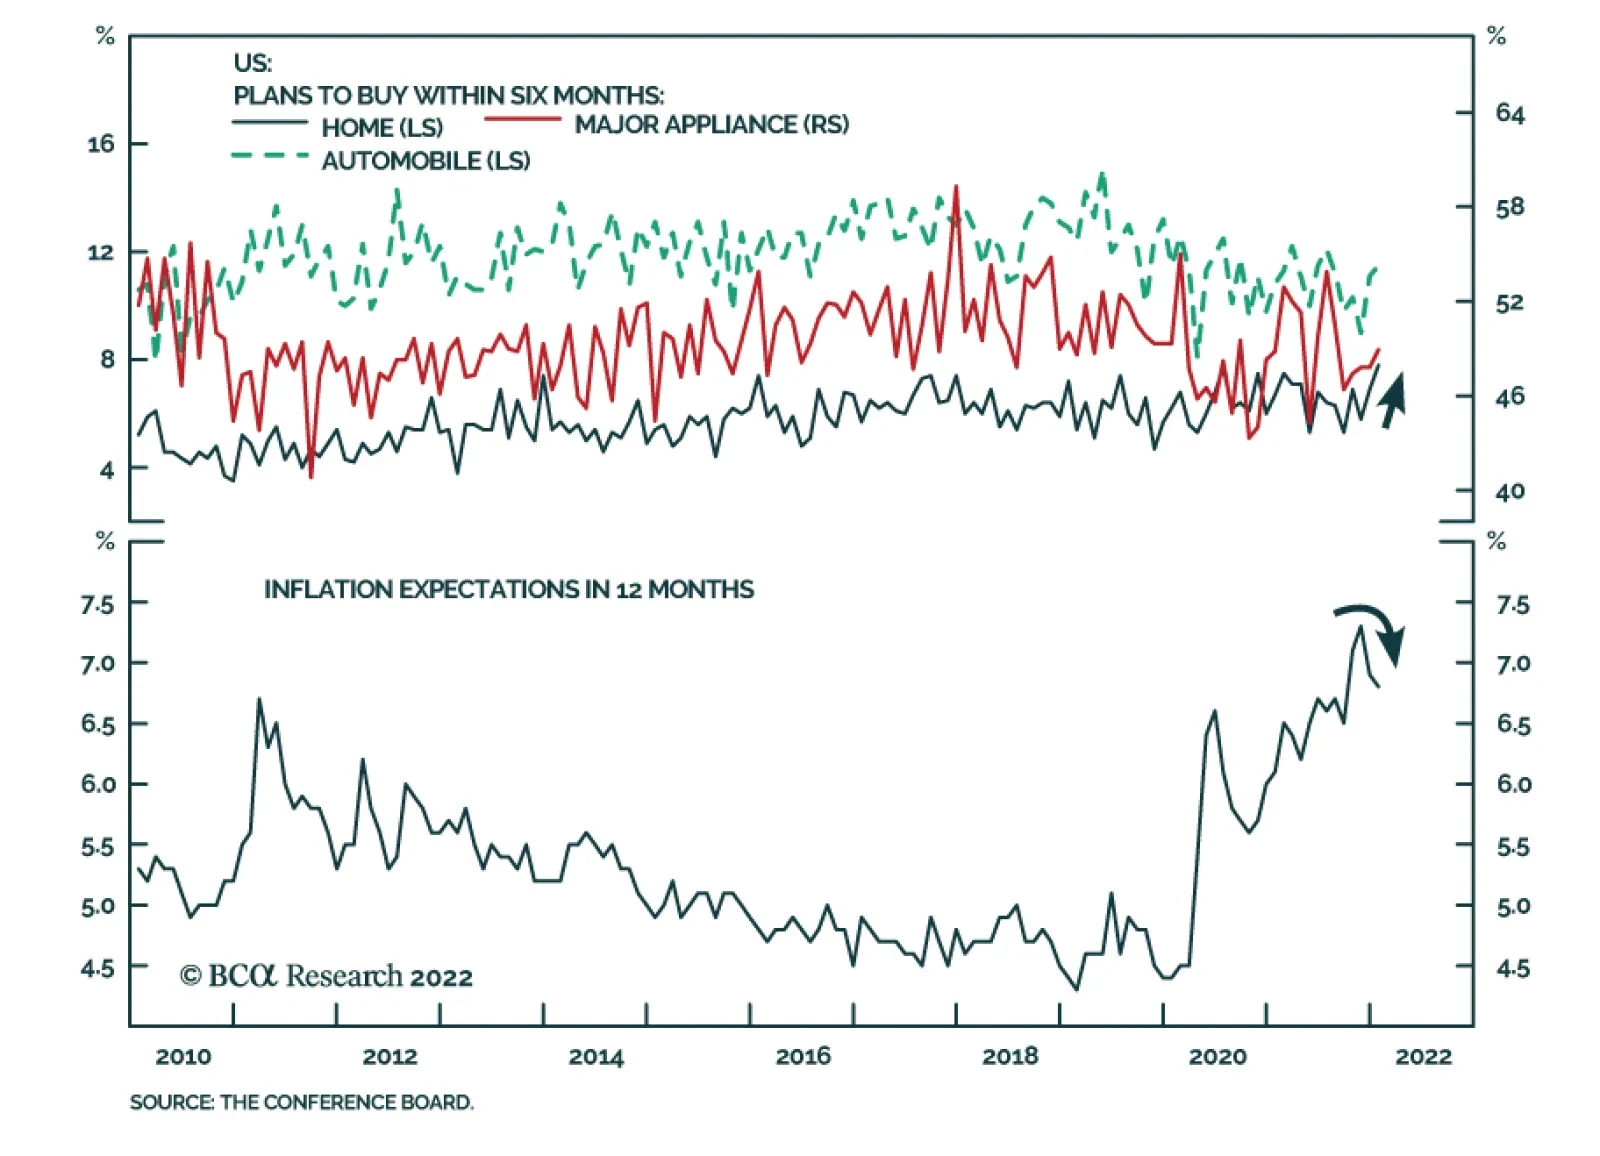
US consumer confidence deteriorated in January. The Conference Board’s headline index fell from 115.2 to 113.8 – which is better than the 111.2 expected. Worsening expectations explain this decline. The forward-looking index, which gauges the near-term…

Highlights Corporate Bond Returns & Fed Tightening: Corporate bond performance varied considerably during the past four Fed tightening cycles. Our analysis of these periods suggests that valuations and the slope of the yield curve are the two most important factors to monitor. Investment Grade Strategy: Given tight valuations, our analysis of past Fed tightening cycles suggests that it will make sense to downgrade our allocation to investment grade corporates from neutral (3 out of 5) to underweight (2 out of 5) once we are confident that the yield curve has shifted into a flatter regime. High-Yield Strategy: De-risking will also be warranted in the high-yield space as the yield curve flattens, but relative valuations dictate that investors should retain a preference for high-yield over investment grade corporates. Feature It is now apparent that the Federal Reserve intends to kick off the next rate hike cycle at the March FOMC meeting. This move has been strongly hinted at in recent Fed speeches and it will be telegraphed more officially when Jay Powell addresses the media tomorrow. In preparation for upcoming rate increases, last week’s report looked at Treasury returns during prior periods of Fed tightening.1 This week, we extend that analysis to the corporate bond market. Specifically, we consider the excess returns that were earned by both investment grade and high-yield corporates during the four most recent rate hike cycles.2 We conclude that a defensive posture toward credit risk will be warranted as Fed tightening gets underway. While we aren’t quite ready to downgrade our recommended allocation to corporate bonds today, we expect to do so within the next couple of months. Corporate Bond Returns During Rate Hike Cycles Table 1 presents excess returns for both the Bloomberg Barclays Investment Grade Corporate Bond Index and the Bloomberg Barclays High-Yield Corporate Bond Index in each of the past four Fed tightening cycles. As was the case last week, we define each tightening cycle as spanning from the first rate hike until the last rate hike. We also exclude periods such as 1997 when the Fed only lifted rates once before reversing course. Table 1Corporate Bond Returns During Fed Rate Hike Cycles
Positioning For Rate Hikes In The Corporate Bond Market
Positioning For Rate Hikes In The Corporate Bond Market
Our first preliminary conclusion is that (unlike with Treasury returns) there is not much commonality between the different cycles. For example, corporate excess returns were quite strong during the 2015-18 cycle and very weak during the 1999-2000 cycle. In other words, it’s even more important to examine each cycle individually to get a sense of how we should position in the corporate bond market today. The 2015-2018 Cycle The most recent Fed tightening cycle started with a 25 basis point rate hike in December 2015. The Fed then went on hold for 12 months before delivering a string of 8 hikes between December 2016 and December 2018. All in all, the tightening cycle lasted 36 months and the Fed raised the target rate by 225 bps. Investment grade corporate bond returns were quite strong during this period (Chart 1A), and there is one major reason why. The start of the tightening cycle happened to coincide with the peak of a default cycle. As a result, corporate spreads were elevated when hiking began and they tightened rapidly throughout 2016 and 2017 (Chart 1A, panel 3). Spread tightening in 2016 and 2017 was helped along by an accommodative policy environment, as evidenced by the fact that the yield curve remained steep (3/10 slope > 50 bps) during those years (Chart 1A, panel 4). It’s notable that returns turned negative in 2018, only after the average index spread moved below 100 bps and the Treasury slope moved below 50 bps. In other words, corporate bond returns were strong early in the cycle but turned negative once value evaporated and the monetary backdrop became less accommodative. High-Yield returns show a similar pattern to investment grade (Chart 1B). Spreads started out very wide in early-2016 and tightened rapidly until monetary conditions turned more restrictive in 2018. Our Default-Adjusted Spread is an additional valuation tool for high-yield bonds (Chart 1B, panel 4). This is calculated as the average index spread less the actual default losses that were experienced during the subsequent 12 months. Our research has shown that high-yield bonds usually outperform Treasuries during 12 month periods in which the Default-Adjusted Spread is above 100 bps (see the Appendix of this report for more details). In this case, the Default-Adjusted Spread was an extremely high 258 bps at the beginning of the tightening cycle and it didn’t dip below 100 bps until after rate hikes ended. Chart 1A2015-2018 Cycle: Investment Grade
2015-2018 Cycle: Investment Grade
2015-2018 Cycle: Investment Grade
Chart 1B2015-2018 Cycle: High-Yield
2015-2018 Cycle: High-Yield
2015-2018 Cycle: High-Yield
The 2004-2006 Cycle During this cycle, which spanned from June 2004 to June 2006, the Fed lifted rates by 400 bps (sixteen 25 basis point rate hikes). The fed funds rate rose from 1% to 5.25% during the two-year span. Excess investment grade corporate bond returns were close to zero during this cycle (Chart 2A). Unlike in 2015, corporate spreads started out at tight levels (below 100 bps), though the accommodative monetary environment – as evidenced by the steep yield curve – allowed them to tighten somewhat during the first year of Fed hiking. However, spreads then reverted closer to 100 bps in 2005 as the yield curve flattened to below 50 bps (Chart 2A, panel 4) and the policy backdrop turned more restrictive. Junk bonds performed extremely well during the 2004-06 cycle (Chart 2B), and once again this is due to very attractive starting valuations. The average High-Yield Index spread was 384 bps on the day of the first hike in 2004, compensation that turned out to be astoundingly high when you consider that monthly default events were in the low single digits throughout the entire period (Chart 2B, bottom panel). As was the case in the 2015-18 cycle, our Default-Adjusted Spread measure never dipped below 100 bps. In fact, it troughed at 145 bps in early 2005 (Chart 2B, panel 4). Chart 2A2004-2006 Cycle: Investment Grade
2004-2006 Cycle: Investment Grade
2004-2006 Cycle: Investment Grade
Chart 2B2004-2006 Cycle: High-Yield
2004-2006 Cycle: High-Yield
2004-2006 Cycle: High-Yield
The 1999-2000 Cycle In this cycle, the Fed lifted rates by 175 bps between June 1999 and May 2000, driving the fed funds rate from 4.75% to 6.5%. Excess investment grade corporate bond returns were poor during this period (Chart 3A), the combination of relatively low starting spreads and a very flat yield curve that even inverted in early 2000 (Chart 3A, panels 3 & 4). High-yield excess returns were even worse than for investment grade (Chart 3B). While, at the onset of Fed tightening, junk spreads were quite elevated in absolute terms (Chart 3B, panel 3), they turned out to be too low compared to the magnitude of default losses that occurred throughout 1999 and 2000 (Chart 3B, bottom panel). Our Default-Adjusted Spread measure started the cycle below 100 bps and then dipped into negative territory in early 2000 (Chart 3B, panel 4). Chart 3A1999-2000 Cycle: Investment Grade
1999-2000 Cycle: Investment Grade
1999-2000 Cycle: Investment Grade
Chart 3B1999-2000 Cycle: High-Yield
1999-2000 Cycle: High-Yield
1999-2000 Cycle: High-Yield
The 1994-1995 Cycle The Fed surprised markets by lifting rates extremely quickly during this cycle. The Fed moved rates from 3% to 6% in the span of only 12 months between February 1994 and February 1995. This cycle coincided with modestly positive excess returns for investment grade corporates (Chart 4A). The average index spread began the cycle at the extraordinarily tight level of 67 bps (Chart 4A, panel 3). However, unappealing valuations were counteracted by the accommodative monetary environment, as evidenced by a yield curve slope that didn’t dip below 50 bps until the Fed was almost done hiking (Chart 4A, panel 4). Junk returns were also modestly positive during this period (Chart 4B). Spreads started the cycle at attractive levels (Chart 4B, panel 3) and the default rate was on the downswing (Chart 4B, bottom panel). Junk spreads, however, were mostly rangebound during the period of Fed tightening. Chart 4A1994-1995 Cycle: Investment Grade
1994-1995 Cycle: Investment Grade
1994-1995 Cycle: Investment Grade
Chart 4B1994-1995 Cycle: High-Yield
1994-1995 Cycle: High-Yield
1994-1995 Cycle: High-Yield
Investment Implications Investment Grade Our analysis of past cycles reveals that valuation and the slope of the yield curve are the two most important factors to consider when assessing the potential for investment grade corporate bond excess returns during a Fed tightening cycle. The 2015-18 period of strong investment grade returns coincided with elevated spreads and a yield curve slope that stayed above 50 bps for the first two years of tightening. In contrast, the 1999-2000 period of negative corporate returns was driven by expensive starting valuations and a very flat curve. Today, investment grade corporate bond valuations are about as expensive as they’ve ever been. The average index option-adjusted spread (OAS) is currently 100 bps, the index OAS has been tighter than this level 40% of the time since 1995 (Chart 5). This does not appear terrible at first blush, but we must also consider that the risk characteristics of the index have changed during the past few decades. Specifically, the index’s average credit rating is lower, and its average duration is higher. If we adjust the index to maintain a constant credit rating through time, we see that the spread falls from its 40th percentile to its 28th percentile (Chart 5, panel 2). If we then adjust for the changing duration of the index by looking at the 12-month breakeven spread instead of the OAS, we see the spread fall to its 7th percentile since 1995 (Chart 5, bottom panel).3 As for the yield curve, the 3-year/10-year Treasury slope is currently very close to 50 bps – the threshold that roughly represents the transition from an accommodative monetary environment to a more neutral one (Chart 6). Given expensive starting valuations, our inclination is to reduce our investment grade corporate bond exposure once we are confident that the 3/10 slope will remain below 50 bps for the remainder of the cycle. We think we are close to reaching that point, but we aren’t quite there yet. Our estimates based on a range of plausible scenarios for Fed tightening suggest that the 3/10 slope will permanently move below 50 bps in the coming months, by July at the very latest. When that occurs, we will reduce our recommended corporate bond exposure from neutral (3 out of 5) to underweight (2 out of 5). Chart 6Watch The Treasury Slope
Watch The Treasury Slope
Watch The Treasury Slope
Chart 5IG Valuation
IG Valuation
IG Valuation
High-Yield The valuation picture for high-yield is somewhat more pleasant than for investment grade. The OAS differential between the high-yield and investment grade indexes is fairly tight, at its 15th percentile since 1995 (Chart 7). However, this differential rises to the 36th percentile when we adjust for the duration differences of the indexes by using the 12-month breakeven spread. Chart 7HY Valuation
HY Valuation
HY Valuation
Applying our Default-Adjusted Spread methodology to today’s junk market, we estimate that the Default-Adjusted Spread will come in above the crucial 100 bps threshold as long as the default rate is 3.5% or lower during the next 12 months (Chart 7, bottom panel). This seems quite likely given the current strong state of corporate balance sheets.4 All that said, the evidence from past cycles suggests that a more defensive posture toward high-yield corporates will also be warranted once we are confident that the 3/10 slope has permanently moved below 50 bps. However, relative valuation dictates that we should still retain a preference for high-yield over investment grade even as we get more defensive overall. Our next move will likely be to downgrade high-yield from overweight (4 out of 5) to neutral (3 out of 5). Some Thoughts On Credit Investment Strategy The above analysis of corporate bond performance shows that it is generally weaker once the yield curve has flattened into a range of 0 – 50 bps. However, that move alone doesn’t guarantee negative excess corporate bond returns. In fact, it is quite plausible that the slope could remain within a 0 – 50 bps range for a long time even as the Fed tightens, and that corporate bonds could still deliver small positive excess returns versus Treasuries. However, we must acknowledge that the risks of Fed overtightening, curve inversion and economic recession increase as the yield curve flattens. We must also acknowledge that current valuations suggest that future excess returns will be small, even if they are positive. For example, if we assume that the average investment grade OAS can’t tighten very much from current levels, then the best we can expect is 100 bps per year of excess return. Meanwhile, 100 bps of spread widening – much less than you would expect in a default cycle – would lead to losses of roughly 850 bps. In other words, it will be profitable to exit investment grade corporate bond positions today as long as the next bout of 100 bps of spread widening occurs within the next 8.5 years (Table 2). The risk/reward trade-off clearly favors a more defensive credit allocation. Table 2The Risk/Reward Trade-off In Corporate Bonds
Positioning For Rate Hikes In The Corporate Bond Market
Positioning For Rate Hikes In The Corporate Bond Market
Interestingly, Table 2 shows that the risk/reward math is more favorable for junk bonds. Depending on our default loss assumptions, the 8.5 years we calculated for investment grade falls to a range of 1.8 to 3 years for high-yield. Bottom Line: Tight valuations and low expected returns suggest that investors should be more cautious on credit risk this cycle. In our view, it is advisable to reduce credit risk allocation earlier than usual this cycle in order to ensure that you aren’t invested during the next big selloff. Appendix
Image
Ryan Swift US Bond Strategist rswift@bcaresearch.com Footnotes 1 Please see US Bond Strategy Weekly Report, “Positioning For Rate Hikes In The Treasury Market”, dated January 18, 2022. 2 We define excess returns as the excess returns earned by the corporate bond index relative to a duration-matched position in US Treasuries. 3 The 12-month breakeven spread can be thought of as the spread widening required for the index to break even with duration-matched Treasuries on a 12-month investment horizon. It can be approximated as OAS divided by duration. 4 Please see US Bond Strategy Weekly Report, “The Fed’s Inflation Problem”, dated November 23, 2021. Recommended Portfolio Specification Other Recommendations Treasury Index Returns Spread Product Returns
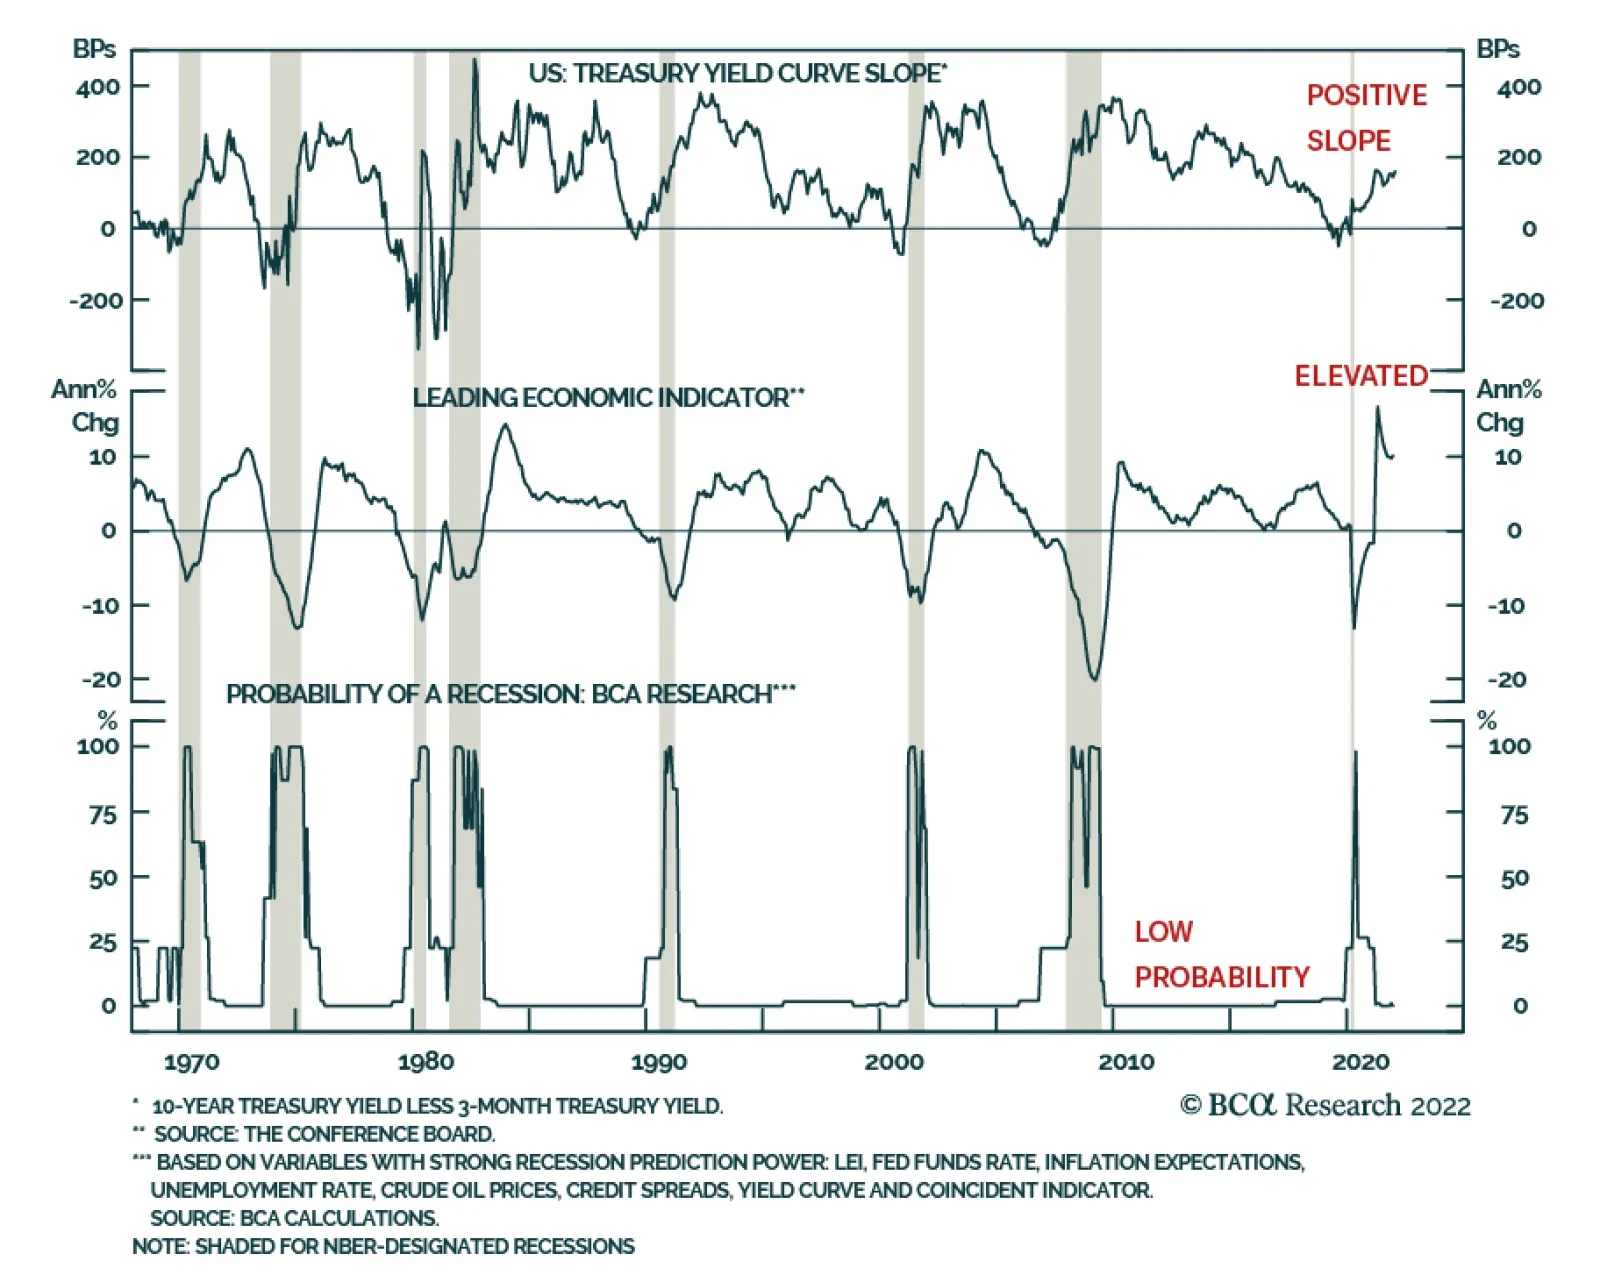
Our Global Investment strategists often highlight that their “golden rule” for investing is to stay bullish on equities as long as a recession isn’t around the corner. This framework is instructive to assess the current environment. The question facing…
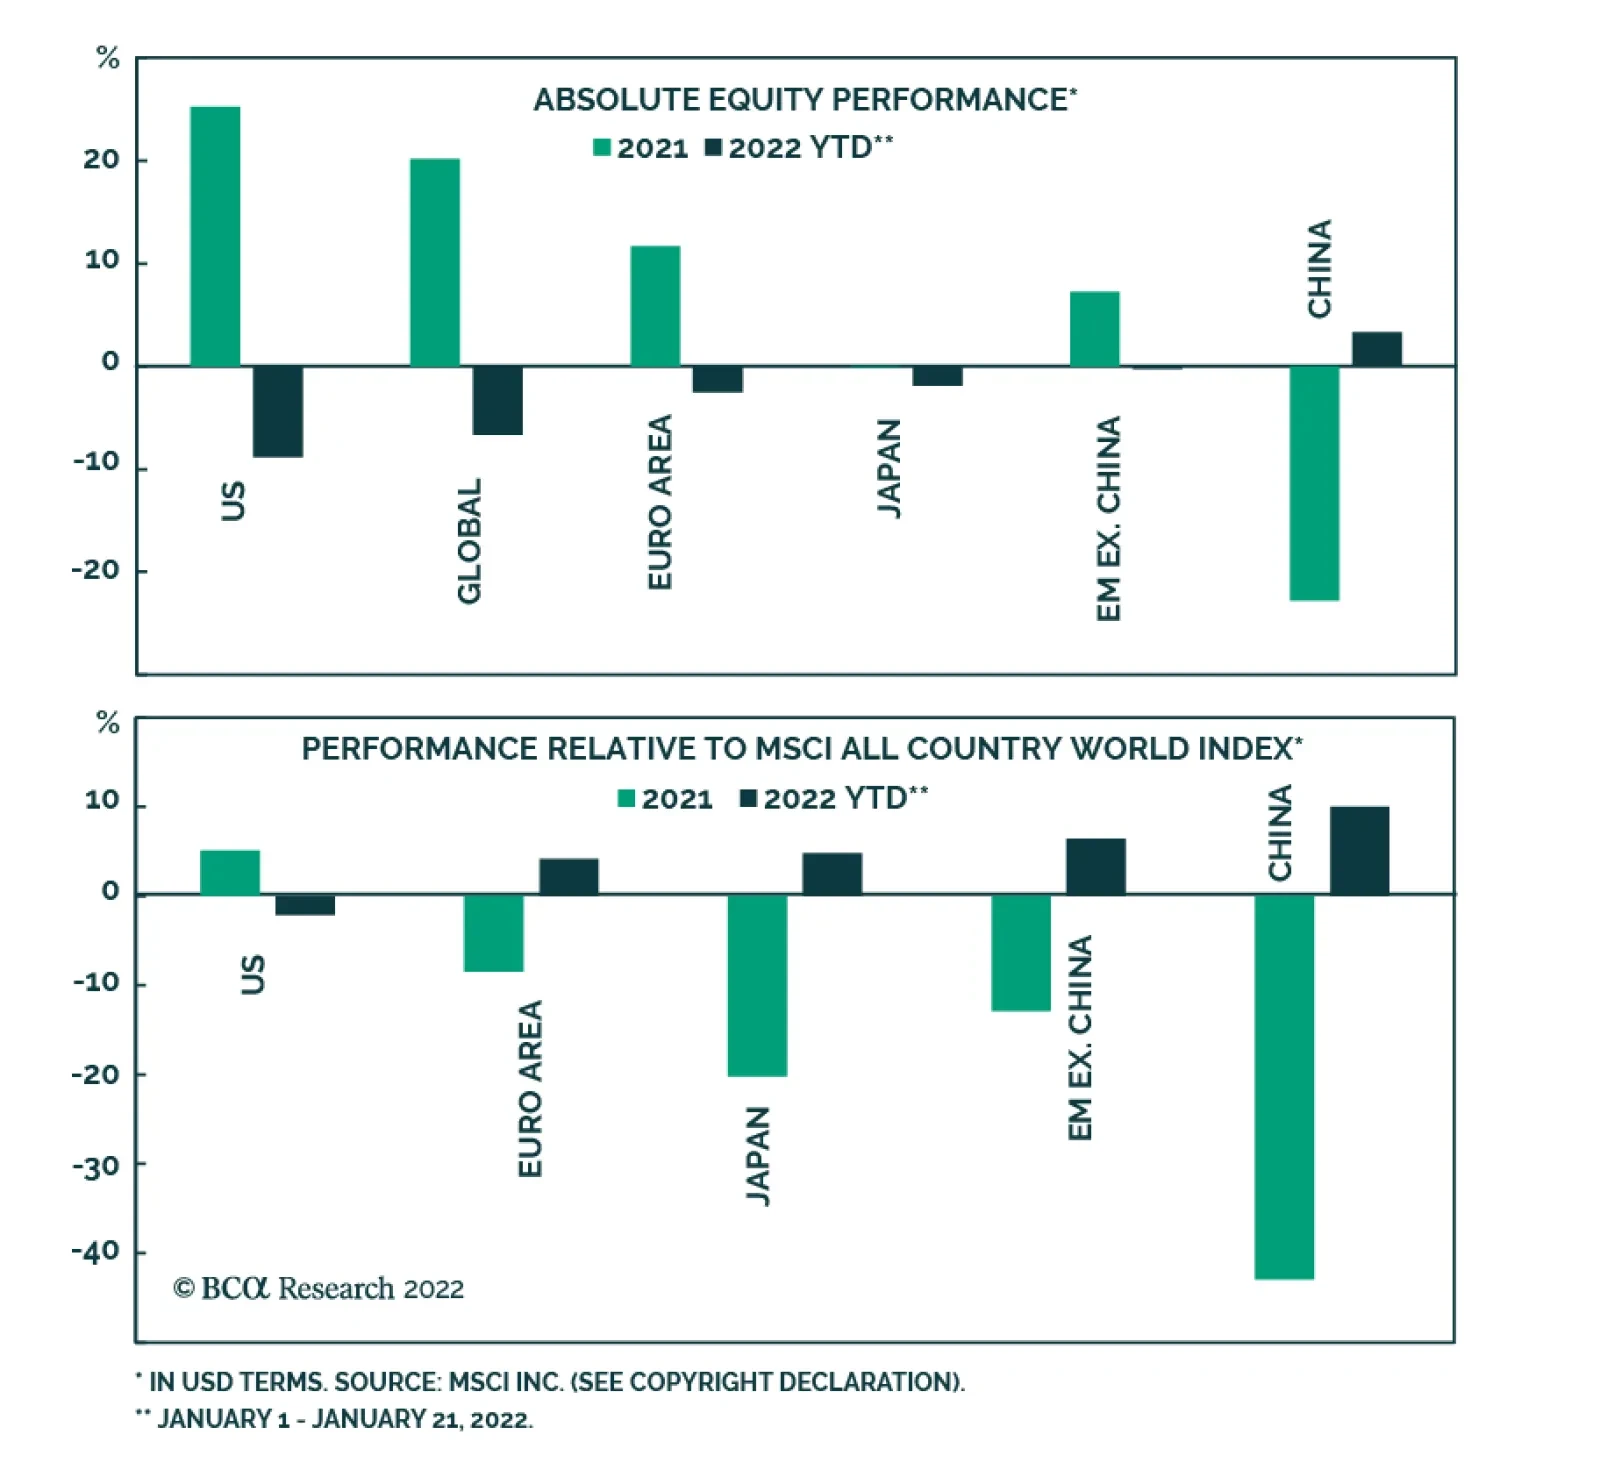
2022 has so far been unwelcoming for equity markets. The sharp climb in bond yields (see Country Focus) is in part to blame: the greatest drawdowns are among interest-rate sensitive sectors such as real estate and technology. Similarly, value stocks are…
BCA Research’s US Equity Strategy service argues that the stars have not yet aligned for beaten-up US Tech stocks. A useful indicator of market breadth is the percentage of stocks making new lows – which currently stands at nearly 75%. Once this metric…
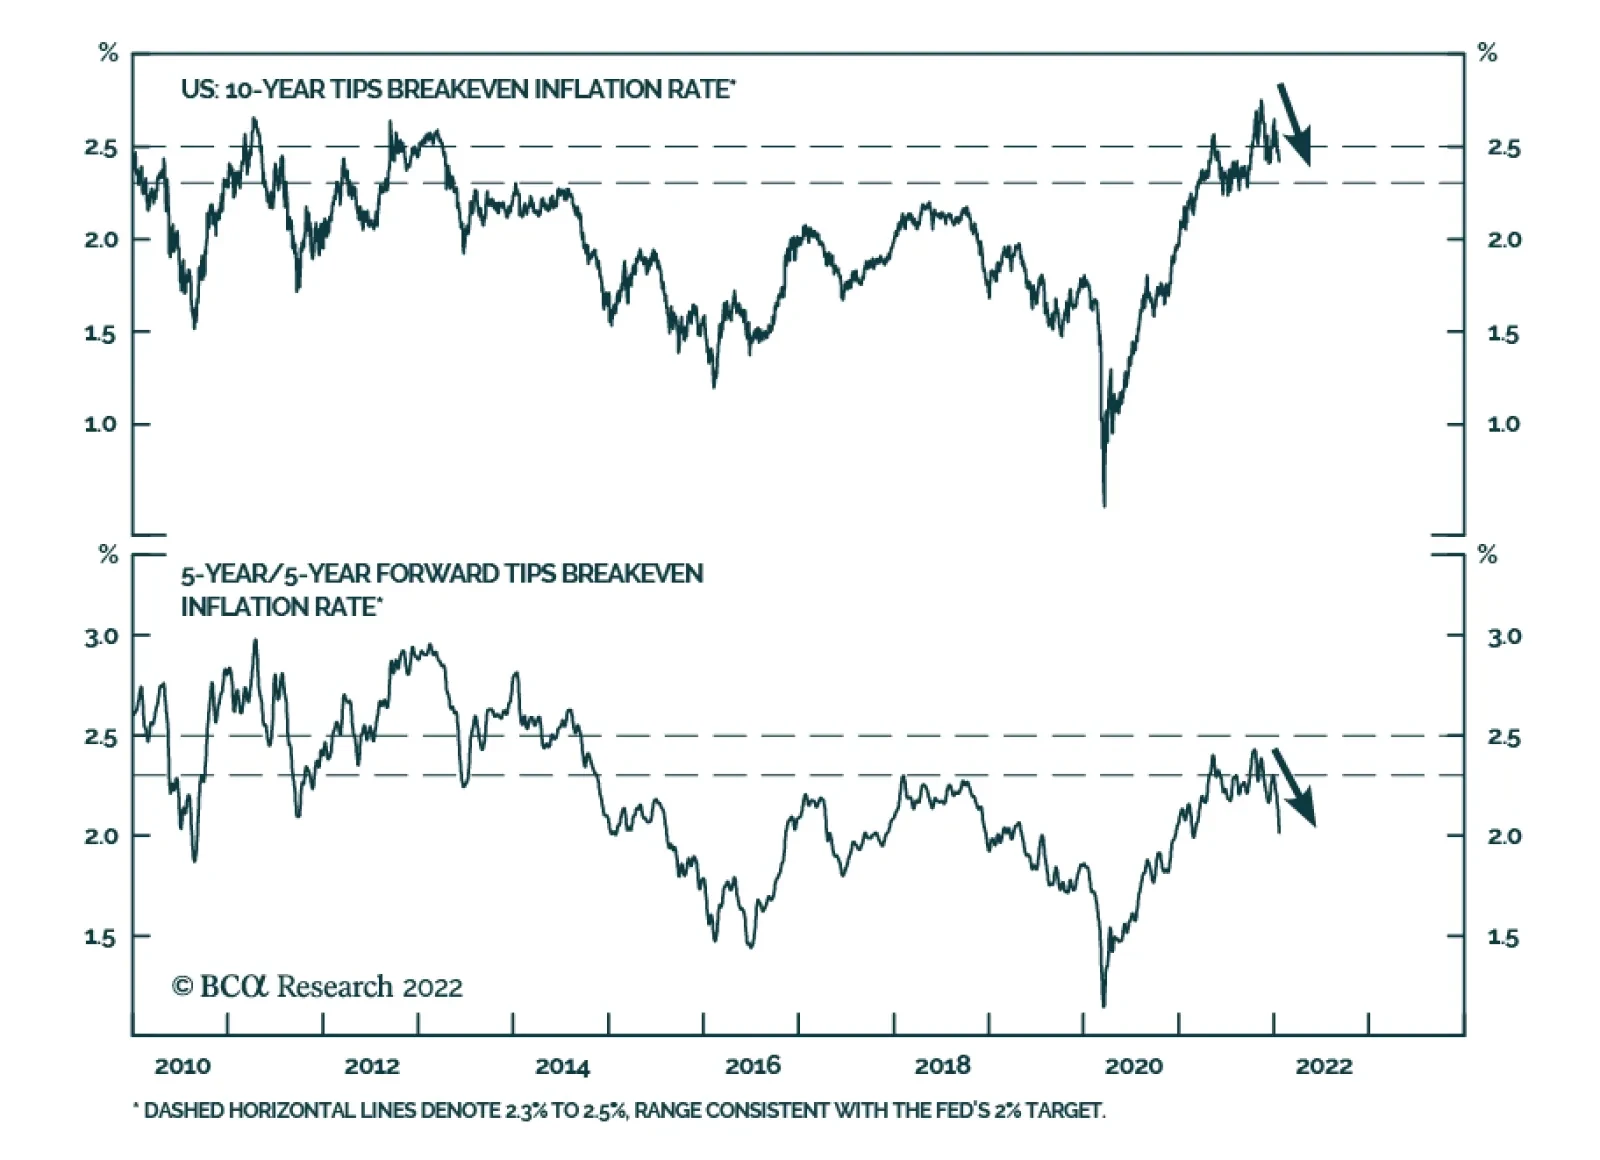
The sharp climb in US Treasury yields so far this year has sent a ripple through equity markets (see Market Focus). Interestingly, real yields are behind this move. The 10-year TIPS yield is 45 basis points higher since the beginning of the year. Meanwhile,…
Highlights 2022 has had a rough start for equity investors: the S&P 500 is now down 8% from its peak, and NASDAQ is officially in correction territory. The question on everyone’s mind is how long this correction will last, and whether it is the right time to start buying beaten-up Tech stocks. Looking “under the hood” of the NASDAQ, we observe that with the technology space being top-heavy and dominated by the likes of Microsoft and Apple, index returns mask the heavy losses of some of the smaller, and less profitable, constituents, with many down 40-50% from their peaks. Analysis of the market breadth shows that three-quarters of NASDAQ names are trading below their one-week highs, which, according to our analysis, indicates that Tech is (almost) ripe for a bounce back.
Chart 0
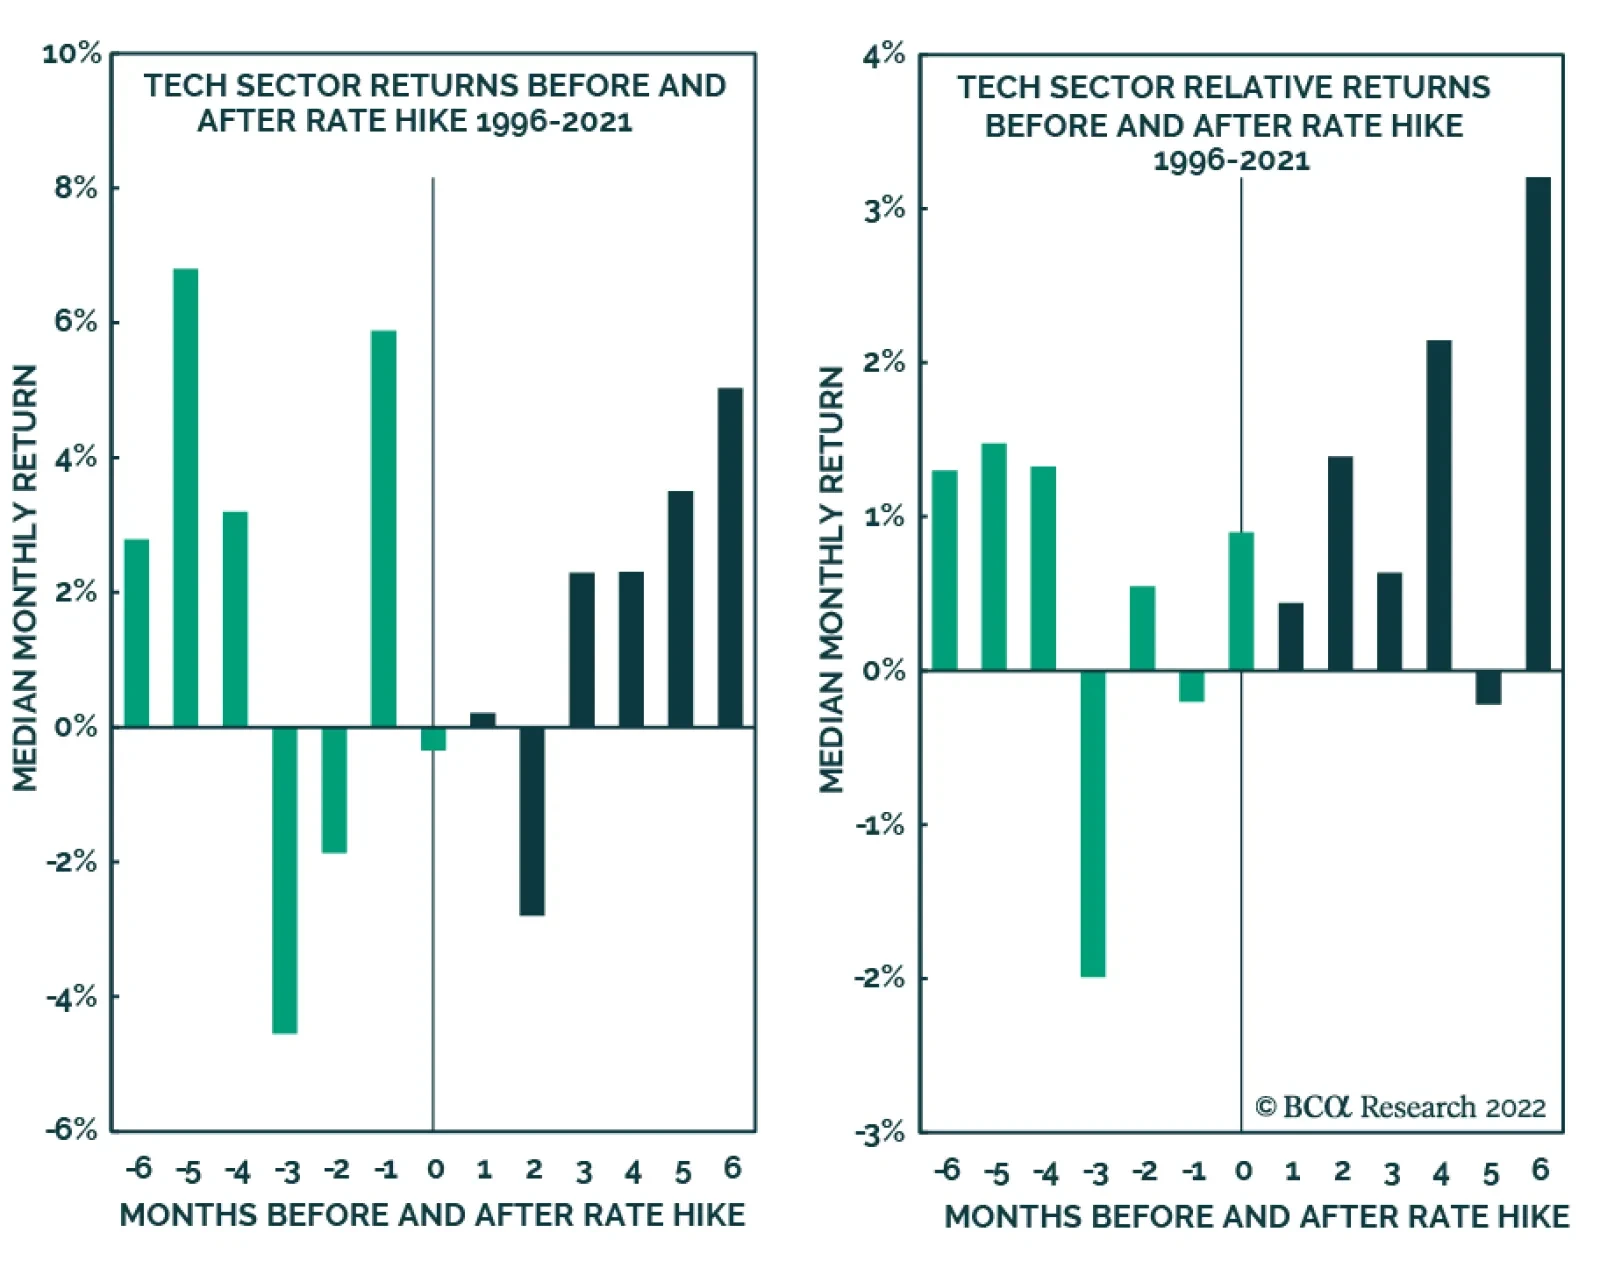
However, the sector is currently under duress from rising rates and imminent monetary tightening. Historically, Tech’s worst performance was two to three months prior to the first rate hike – the current pullback is a “textbook” behavior. It will take another couple of months after the rate hike for a sustainable rebound. In addition to headwinds from rising rates, there is also an ongoing slowdown in demand for tech products and services, which translates into a deceleration of earnings and sales growth. On the valuations front, Technology is trading with a significant premium to the market, while its expected earnings growth is on par with that of the S&P 500. We recommend investors to be patient: While Tech appears oversold, and recent volatility is a function of market panic, the stars have not yet aligned for the sector. We are tactically bearish but structurally bullish. Feature 2022 has had a rough start for equity investors: Since the beginning of January, the S&P 500 has pulled back 8%. Market consensus is that this violent rotation is a repricing of risk, triggered by the Fed’s new hawkish stance aimed at taming the runaway inflation that has surged to a nearly 40-year high. The market expects the first rate hike as soon as March, followed by three more into the year-end. It is also grappling with the timing and degree of quantitative tightening (QT), which will follow on the heels of tapering. Energy and Financials are the only sectors in the green so far this year, with Real Estate, Healthcare, and Tech being hit the hardest (Chart 1). Internet Retail is down almost 20% from its local peak in mid-2021 and Interactive Media, home of Facebook, is down 11%. NASDAQ is officially in correction territory (Chart 2). Rising rates have hit growth and interest-rate-sensitive areas of the market the hardest.
Chart 1
Chart 2
While these negative returns indicate a sharp pullback, they don’t do justice to how painful this correction has been, as much of it was happening under the radar. The S&P 500 and many of its tech-related sectors and industries are top-heavy, being home to FAANG+M, which has proven to be more immune to rising rates. It is the smaller growth companies that have fallen much more than the top-line number indicates, with many down 40-50% from their peaks. However, now with more than 58% of stocks in the NASDAQ trading below their 30-week moving average, the natural question is: “Are we there yet?” or how much longer will this sell-off last? There are early signs of bottom-fishing among the stocks and industries hit hardest. Yet most days, both the S&P 500 and the NASDAQ start in the green, only to finish splattering to a new low (Chart 3). Chart 3Mega-cap Tech Has Fallen But Less Than Small-cap Brethren
Mega-cap Tech Has Fallen But Less Than Small-cap Brethren
Mega-cap Tech Has Fallen But Less Than Small-cap Brethren
In this report, we will aim to gauge when the sell-off in tech names will have run its course by focusing on the S&P 500 Technology sector. Also in today’s publication, we will reverse our usual course of analysis: We will start from the technicals as they are most helpful for timing entry points, and we will follow with macro and fundamentals. Tech Sector Is Top Heavy The S&P 500 Technology sector is top-heavy, with each industry group dominated by one of the tech giants, such as Microsoft in Software and Services, Apple in Hardware and Equipment, and Nvidia in Semiconductors. We call this trio “MAN.” The MAN accounts for 50% of the S&P 500 Technology sector market capitalization (Chart 4). As a result, both sector performance and valuation are heavily affected by index composition.
Chart 4
To unpack what is going on within the Tech sector, we plotted the dispersion of last month’s performance within the sector through a market cap bucket, with the first bucket containing the MANs. The last couple of buckets, 10 and 11, contain some of the smallest stocks in the index. Unsurprisingly, the largest stocks in the sector have not fallen that much. The correction has most affected stocks in buckets 7 through 11, with a market cap of between $8 to $33 billion, and these are the names that may be most tempting for “bottom-fishing.” Technicals It Is A Blood Bath Out There A useful indicator of market breadth, allowing us a look under the hood”, is the percentage of stocks making new lows – which currently stands at nearly 75% (Chart 5). This is a high reading which has happened only 11% of the months since 2000. However, once this metric rises above 85%, it indicates that the market is oversold. When that happens, the Tech sector outperforms the S&P 500 by around 7% over the next six months, and returns are positive every month (Chart 6). Based on this indicator, the NASDAQ in general, and Tech in particular, are close to the oversold conditions and are ready for a bounce. Chart 5Pullback In Tech Stocks Is Broad-based
Pullback In Tech Stocks Is Broad-based
Pullback In Tech Stocks Is Broad-based
Chart 6
However, the BCA Technical Indicator for the sector (Chart 7) is still in neutral territory. It is driven primarily by momentum components: It gauges the trend in equities and determines if the market is at an extreme in terms of momentum or investor psychology. This indicator is highly affected by the performance of the largest index constituents. All in all, we conclude that from a technical standpoint, the Tech sector is getting closer to a rebound. Chart 7The Technical Indicator Is In The Neutral Territory
The Technical Indicator Is In The Neutral Territory
The Technical Indicator Is In The Neutral Territory
Macroeconomic Backdrop New Rate Hiking Cycle Will Take Time Getting Used To Ok, Tech is oversold. Yet there is still the not-so-small matter of a new, tighter monetary regime. How does Tech fare in the environment of rising rates? Clearly, not so good so far. However, the question is, how long will it take for the higher rates to be priced in, and for Tech to rebound. To answer this question, we have run another empirical study, anchoring the performance of the Tech sector to the beginning of each hiking cycle since 1996 (Charts 8 and 9).
Chart 8
Chart 9
According to our analysis, Tech’s worst performance is two to three months prior to the first rate hike – the current pullback in Tech is a perfect illustration. While we may expect a rebound rally “when the second shoe drops” and the Fed announces the first hike, it appears that a sustainable rally may still be a couple of months away. Based on this analysis, we conclude that it will pay off to be patient and wait until the summer. It Is The Economy, Stupid! Apart from the headwind from rising rates, there is also an ongoing slowdown in demand for Tech Business Investment (Chart 10). Moreover, the Tech New Orders Index peaked at a high level at the end of 2021 and has recently turned (Chart 11). So has Private Tech Investment (Chart 12). This indicates that demand is waning following the surge that accompanied the most recent push to digital transformation—which was accelerated by the onset of the pandemic. Chart 10Slowdown In Tech Business Investment
Slowdown In Tech Business Investment
Slowdown In Tech Business Investment
Chart 11Tech New Orders Have Peaked
Tech New Orders Have Peaked
Tech New Orders Have Peaked
Chart 12Private Tech Investment Is Also Slowing
Private Tech Investment Is Also Slowing
Private Tech Investment Is Also Slowing
The macroeconomic backdrop is unfavorable for the Tech Sector Fundamentals Sales And Earnings Growth Are Slowing While the Tech sector enjoyed a fantastic sales recovery in 2021, with sales growth exceeding pre-pandemic levels, this year may be different. Waning demand for tech products and services translates into a sales growth slowdown (Chart 13). Chart 13The Tech Sector Sales Growth Is Slowing...
The Tech Sector Sales Growth Is Slowing...
The Tech Sector Sales Growth Is Slowing...
Chart 14... So Is Earnings Growth
... So Is Earnings Growth
... So Is Earnings Growth
With sales growth slowing, earnings growth is bound to follow (Chart 14), which is no different from the broad market. Technology sector earnings growth for the next 12 months is converging with that of the S&P 500: 10% vs. 9% respectively (Chart 15). Margins are expected to compress in 2022, albeit from the high levels (Chart 16). Chart 15Tech And The S&P 500 Expected Earnings Growth Has Converged
Tech And The S&P 500 Expected Earnings Growth Has Converged
Tech And The S&P 500 Expected Earnings Growth Has Converged
Chart 16Margins Are Expected To Compress
Margins Are Expected To Compress
Margins Are Expected To Compress
Of course, the Q4-2021 earnings results could bring a respite. So far blended the year-on-year earnings growth rate is 15.8%: However, only 5 companies out of 71 have reported, beating expectations by 4.6%. Will these results save the day? Possibly – expectations are a low bar to clear. Time will tell. But to prop up the sector, results from the MAN have got to be stellar. Valuations: Better But Not Good Enough While Tech earnings are expected to grow in line with the S&P 500, the sector is trading with a 28% premium to the market at 27x vs. 21x forward PE (Table 1). Relative PE NTM currently stands at 1.7 standard deviations above the five-year average. Although this may seem high, the froth has come off as, only two months ago, Tech was trading at 2.4 standard deviations. This is a significant change, but the sector is not yet cheap enough for bargain hunting. Adjusting for the growth rate differential between Tech and the S&P 500, we divide PE NTM over EPS Growth NTM, to arrive at PEG: Even so, Tech is still more expensive trading at 2.7 for a percentage of future growth, compared to 2.3 for the S&P 500. However, Tech is a growth sector, and perhaps by looking at only one-year-ahead earnings growth, we are being myopic. Let’s take a look at longer-term growth expectations. Curiously, over the next five years, Tech earnings are expected to grow at about an 18% annualized rate, while the S&P 500 is expected to grow at 21% (Chart 17). As a result, the PE/Long-Term Earnings Growth Rate for Tech is 1.5 vs. 1.0 for the S&P 500. Table 1Tech Valuation Premium Is Still Too High
Are We There Yet?
Are We There Yet?
Chart 17Long-term Earnings Growth Does Not Justify Valuation Premium Either
Long-term Earnings Growth Does Not Justify Valuation Premium Either
Long-term Earnings Growth Does Not Justify Valuation Premium Either
Of course, we need to keep in mind that since this sector is so top-heavy, the forward PE of the MAN affects overall sector valuations. As you can see in the table below (Table 2), MAN is trading with a premium to the sector. However, within the sector, companies with sky-high valuations are easier to find among smaller constituents (Chart 18). Valuations are elevated, while fundamentals are deteriorating Table 2The Largest Tech Companies Are Trading With A Premium To The Sector
Are We There Yet?
Are We There Yet?
Chart 18
Investment Implications While it is tempting to add to Technology on the back of this pullback, we recommend caution. Tech is oversold and recent volatility is a function of market panic, yet the stars have not yet aligned for the sector. Historically, Tech has delivered negative returns several months prior to rate hikes and underperformed the broad market. Economic normalization also brings a slowdown in demand for tech goods and services, which translates into less exciting sales and earnings growth, and margin compression. Although some froth has come off, valuations for the sector remain elevated, and the premium over the S&P 500 is not justified. The scorecard summarizes each of these points, and it is clear that, on balance, the sector has quite a few challenges ahead (Table 3). Table 3Technology Sector Scorecard
Are We There Yet?
Are We There Yet?
On a more optimistic note, this sell-off has been fast and furious, and the worst is most likely behind. We are underweight the Technology sector. Within the sector, we are underweight Semiconductors, and Hardware and Equipment. We are still overweight Software and Services for portfolio diversification purposes. The Software sector will be one of our next “deep dives.” Stay tuned. Are we there yet? No, we still have a few months to go. Structural Positioning While we reiterate our tactical underweighting of the Tech sector, we are bullish on it over the longer investment horizon. This sector is at the heart of US technological innovation, such as cloud computing, artificial intelligence, cybersecurity, chip design that powers EV and AV, and many others. The sector is home to some of the best American companies, which have powered US equities throughout the past decade, and will continue to do so for decades ahead. Bottom Line Despite a sell-off of NASDAQ and the Technology sector, we are not yet recommending increasing cyclical allocation to Tech: While technicals appear attractive, tighter monetary policy, the slowdown in demand for tech goods and services, pressures on profitability, and elevated valuations remain headwinds. We reiterate our underweight to the Technology sector on a tactical basis. We are structurally bullish. Irene Tunkel Chief Strategist, US Equity Strategy irene.tunkel@bcaresearch.com Recommended Allocation
Highlights Banks, households, and businesses are still swimming in cash: Asset purchases and zero rates are ending, but banks, households and businesses have more cash than they know what to do with. It will not be easy for the Fed to mop up enough accommodation to slow the economy in a material way this year. The flood of liquidity may be a headwind for interest rates in 2022, … : The biggest banks have positioned themselves to benefit from rising rates and may limit the backup in yields as they deploy their unused capital hoard into it. … and protect equities from suffering meaningful de-rating: All the money has to go somewhere, and equities may be the default winner if bonds and cash are poised to deliver negative real returns. The rosy near-term outlook implied by the biggest banks’ observations suggests that the bull market in risk assets isn’t over yet: Households have ramped up spending but have barely begun to tap into their excess savings and businesses are confident and well-heeled. Above-trend economic growth should bolster corporate earnings, credit performance and financial asset prices, keeping the bull market going through the end of the year. What The Banks See The SIFI banks (BAC, C, JPM and WFC) and USB kicked off fourth quarter earnings across three days bracketing the Martin Luther King long weekend. Their performance wasn’t bad – the SIFIs squarely beat analysts’ consensus estimates and USB came up about 3% short – but investors apparently wanted more from a group that had burst out of the gate to start 2022. Banks were market darlings in the year’s first nine sessions as investors sought out stocks that could outperform in a rising rate environment, and the SIFIs and USB beat the S&P 500 by 12 percentage points (Chart 1). Over the three sessions that they reported earnings, they gave back more than a third of their relative outperformance, though they still have a 7-point year-to-date advantage. Chart 1Rate Play
Rate Play
Rate Play
Our focus, however, is not on the banks themselves or their stocks’ relative performance. We’re after what the principal financial intermediaries are seeing from their privileged vantage point into activity across the economy. We examine the banks’ earnings releases and listen to their earnings calls for insight into the broad macro backdrop as revealed by borrower performance, lender willingness, the state of the financial system and the actions and intentions of households and businesses. Considering the banks’ calls from that perspective, several growth-friendly themes emerged. Households remain flush with cash, even at the lower end of the wealth distribution, heralding robust 2022 consumption. Deposits from households and businesses continue to pile up, supporting credit performance and likely pushing out the date when net charge-off rates will rise to more normalized levels. The deposit flows are increasing the banks’ capacity to lend, and they are champing at the bit to deploy their cash into new loans. Investment banking pipelines are full and rampant liquidity should see to it that new debt and equity offerings meet with a warm reception once they come to market, as long as the current bout of market turbulence doesn’t lead to a lasting rollback in animal spirits. All in all, the banks’ observations affirmed our constructive take on the economy through at least the end of the year. Households are already spending in a way that validates our time-release view of fiscal transfers and their incomes have apparently risen enough that they have not yet begun to deplete the savings they built up from Congress’ pandemic largess. Businesses remain flush and are looking to replenish depleted inventories to reduce their vulnerability to supply chain disruptions. M&A activity is still hot and underwriting calendars are full. Yields are poised to rise as the Fed dials down monetary accommodation, but it’s possible the banks’ eagerness to put their idle cash to work will help limit how high they can go. Households Have Been Spending (Chart 2), But They Still Have Loads Of Dry Powder (Chart 3) … [F]or the holiday period of November and December, [debit and credit] spending was up 26% over 2019. … And so far this year that strength continues. [S]pending of all types through January 17 … [was] up over 11% versus the start of ’21, which is well up over ’20 and ’19, and that bodes well for the rest of the year and quarter. (Moynihan, BAC CEO) Chart 2You Can't Keep An Avid Consumer Down
You Can't Keep An Avid Consumer Down
You Can't Keep An Avid Consumer Down
Chart 32 Trillion Of Excess Savings ...
2 Trillion Of Excess Savings ...
2 Trillion Of Excess Savings ...
[C]ombined credit and debit [card] spend was up 27% versus the fourth quarter of 2019, with each quarter in 2021 showing sequential growth compared to 2019. Within that, travel and entertainment spend was up 13% versus 4Q19, though we have seen some softening in recent weeks contemporaneously with the Omicron wave. (Barnum, JPM CFO) Consumer credit card spend also continued to be strong, up 28% from the fourth quarter of 2020 and up 27% from the fourth quarter of 2019. All spending categories were up in the fourth quarter compared to a year ago, with the largest increases in travel, fuel, entertainment and dining. (Scharf, WFC CEO) [W]hile there is some softening [from Omicron] in restaurant, travel and entertainment in recent weeks, overall spending remained strong in the first week of January with credit card up 26% and debit card up 29% versus the same week in 2020. (Scharf, WFC) [W]e are seeing increases in [card] spend volume … across the board, [with] branded card spend volumes up 24% and retail services spend volumes up 16%[.] People are using our cards, which is a good thing. (Mason, C CFO) [C]onsumer[s] [are] in really good shape, … spending … 25% more than they spent pre-COVID, 25% more. And that number drives all the order books for everybody else. (Dimon, JPM CEO) We believe there’s lots of potential spending capacity left as average deposit balances (Chart 4) continue to move up … despite … heavy spending[.] We had [only] one cohort of deposits that dipped [in any] month [in] the last part of the year: … customers who had balances of $2,000 or less pre-pandemic [saw their balances] dip by 1% [in November]. Other than that, every cohort from June [through] December [had their balances] grow every month. And what’s striking is that the balances for people who had less than $2,000 average balances before the pandemic [now have] five times [their pre-pandemic] balances. [C]ustomers who had $10,000 in their accounts before the pandemic are now sitting with two times [that] in their accounts. (Moynihan, BAC) Chart 4... Are Sitting In Checking Accounts, Waiting To Be Spent
... Are Sitting In Checking Accounts, Waiting To Be Spent
... Are Sitting In Checking Accounts, Waiting To Be Spent
Chart 5
… Helping Credit Performance (Chart 5) And Keeping A Lid On Card Balances (Chart 6) Chart 6Cash-Rich Consumers Don't Need To Carry Credit Card Balances
Cash-Rich Consumers Don't Need To Carry Credit Card Balances
Cash-Rich Consumers Don't Need To Carry Credit Card Balances
The asset quality of our customers remains very healthy and net charge-offs this quarter fell to a historical low of … 15 basis points of average loans. … Our credit card loss rate was 1.42%, … less than half of the pre-pandemic rate, [and] it improved in every quarter during the year. (Borthwick, BAC CFO) [O]ur 30, … 60 or 90 days past [due consumer loans] are staying at … low levels. … [C]ustomer [checking account] balances, elevated in some cases five times [above] … pre-pandemic levels … probably account for a lot of the consumer credit quality improvement. We’re anticipating at some point it will go back towards more normal historical levels. We just think it’s going to bump around here for a little while. (Borthwick, BAC) [W]e’re exiting the fourth quarter with a card net charge-off rate of … something like 1.2% -- -- Which you’ll never see again (Barnum and Dimon, JPM) [C]redit card [charge-offs] has been a number that we’ve never seen in our lives. Middle market has been lower than ever. … Mortgages have been lower than ever. They’re all low. Eventually, they’re going to normalize. (Dimon, JPM) In terms of [card] losses, … [we are seeing] very low loss levels. [W]hen I look at the delinquency trend, there’s really nothing to focus on there. [Delinquencies] remain quite low and we don’t see any signs or areas of concern. (Mason, C) Payment rates do remain stubbornly high, [negatively] impacting our loan growth … in [our] cards businesses. (Mason, C) Consumer credit performance remains strong with higher collateral values for homes and autos and consumer cash reserves remain[ing] above pre-pandemic levels. (Santomassimo, WFC CFO) Credit quality remains strong. Over the next few quarters, we expect the net charge-off ratio to remain lower than historical levels, but normalize over time as the effects of the pandemic continue to subside. (Dolan, USB CFO) Business Borrowing May Be Turning A Corner (Chart 7) Chart 7Are Middle-Market Corporate Borrowers Really Back?
Are Middle-Market Corporate Borrowers Really Back?
Are Middle-Market Corporate Borrowers Really Back?
[Sequential] growth was broad-based across all commercial lending segments. We saw improvement in new loans as well as improvement in utilization from existing clients. … In the all-important small business segment, lending activity is running consistently above pre-pandemic levels. (Moynihan, BAC) We are seeing an uptick in revolver utilization rates, … and it remains sort of skewed to the smaller clients. But we are starting to see an uptick … even in the bigger clients. … [O]ne driver of that is CEOs and management teams have been burned by low inventory levels as a result of the supply chain problems, wanting to run higher inventories and that is maybe driving higher utilization. … At the same time, we’re hearing quite a bit of confidence in the C suites, and all else equal that should be positive for C[ommercial]&I[ndustrial] loan growth. The levels there are modest still in a world where capital markets have been exceptionally receptive to … [bond] issuance … and so people [have been] well-funded [by the] capital markets. (Barnum, JPM) Commercial loan balances started to increase late in the third quarter and have now grown for four consecutive months with growth accelerating in December. … Increases in middle-market banking were driven by growth from our larger clients, a modest uptick in revolver utilization and strong seasonal borrowing. Growth in asset-based lending and leasing was driven by new client wins as well as increased levels from higher prices and some increase in inventory levels. (Santomassimo, WFC) We are encouraged by the loan growth momentum and we have a positive outlook for 2022, given improving client sentiment and business conditions, and continued strength in certain focused commercial portfolios, such as asset-backed securitization lending and supply chain financing. (Cecere, USB CEO) [W]e’re now starting to see a nice shift with respect to the commercial and the C&I portfolios. … At the end of the fourth quarter, we saw nice expansion of utilization rates, … like 60 basis points on average from the third quarter, but in December it was up almost 2.5%. … [P]eople are rebuilding their inventories on the commercial side. I think … they still have some [supply chain] concerns, so I think they’re being cautious about making sure they have inventory to be able to run their business. And I think they’re starting to make business investment ahead of the consumer spend and the economic growth they see in 2022. (Dolan, USB) [The] number one fourth-quarter trend that looks positive going into 2022 is the increase in utilization rates, which we haven’t seen for a number of quarters. (Cecere, USB) Banks Have Tons Of Dry Powder (Chart 8) And Want To Put It To Work (Chart 9) When The Time Is Right Chart 8Water, Water Everywhere And Not A Drop To Drink
Water, Water Everywhere And Not A Drop To Drink
Water, Water Everywhere And Not A Drop To Drink
Chart 9Banks Are Eager To Lend
Banks Are Eager To Lend
Banks Are Eager To Lend
Given continued deposit growth and low rates, our asset sensitivity to rising rates remains significant. (Borthwick, BAC) [W]e still have significant dry powder to put to work with either client demand [loans] or in an increasing rate environment [securities], which we expect. (Mason, C) [W]e have huge firepower to grow, to expand, to make loans, to extend duration. I’ve never seen a bank with [our level of] liquidity: $1.7 trillion in cash and marketable securities and $1 trillion in loans. There’s $500 or 600 billion of those cash and marketable securities that could be deployed in higher-yielding assets or loans when and if the time comes. (Dimon, JPM) [Our] expectation is that when long-term rates rise, which we’re starting to see now, we’re going to be able to take advantage of the rising rate environment. … We [deployed some cash into securities] in the fourth quarter but employed hedging strategies to keep the duration of those purchases relatively short … to maintain as much asset sensitivity going into 2022 as we possibly could. (Dolan, USB) [W]e want maximum flexibility as long-term rates start to rise. (Dolan, USB) Investment Implications Chart 10Comeback Or Head Fake?
Comeback Or Head Fake?
Comeback Or Head Fake?
The biggest banks told a consistent story about the US economy on their earnings calls. Activity is rising, as evidenced by avid consumption that gathered momentum across 2021, a pickup in business and consumer appetite for borrowing that quickened toward the end of the year (Chart 10), and expressions of confidence from businesses that are directing capital to replenishing inventories and buying equipment. Credit performance is tremendously strong with record-low net charge-off rates and low delinquency rates underpinned by bloated business and consumer deposit balances. Abundant cash reserves provide further fuel for consumption and should keep GDP growth well above its trend level. The growth and credit tailwinds suggest that a recession is not lurking around the corner and therefore offer a green light for investors to overweight equities within multi-asset portfolios. As detailed in the last two reports on rate hikes’ impact, we do not view the recent equity turbulence, triggered by a surge in Treasury yields, as the start of an inflection point for financial markets. We are inclined to see the decline as more of a buying opportunity than a herald of a new shift in the business cycle. The Fed has the means to slow the economy if it sets its mind to it but given the amount of cash that is overwhelming banks, businesses, households and investors, draining enough accommodation to do so by the end of 2022 is an awfully tall order. Doug Peta, CFA Chief US Investment Strategist dougp@bcaresearch.com