United States
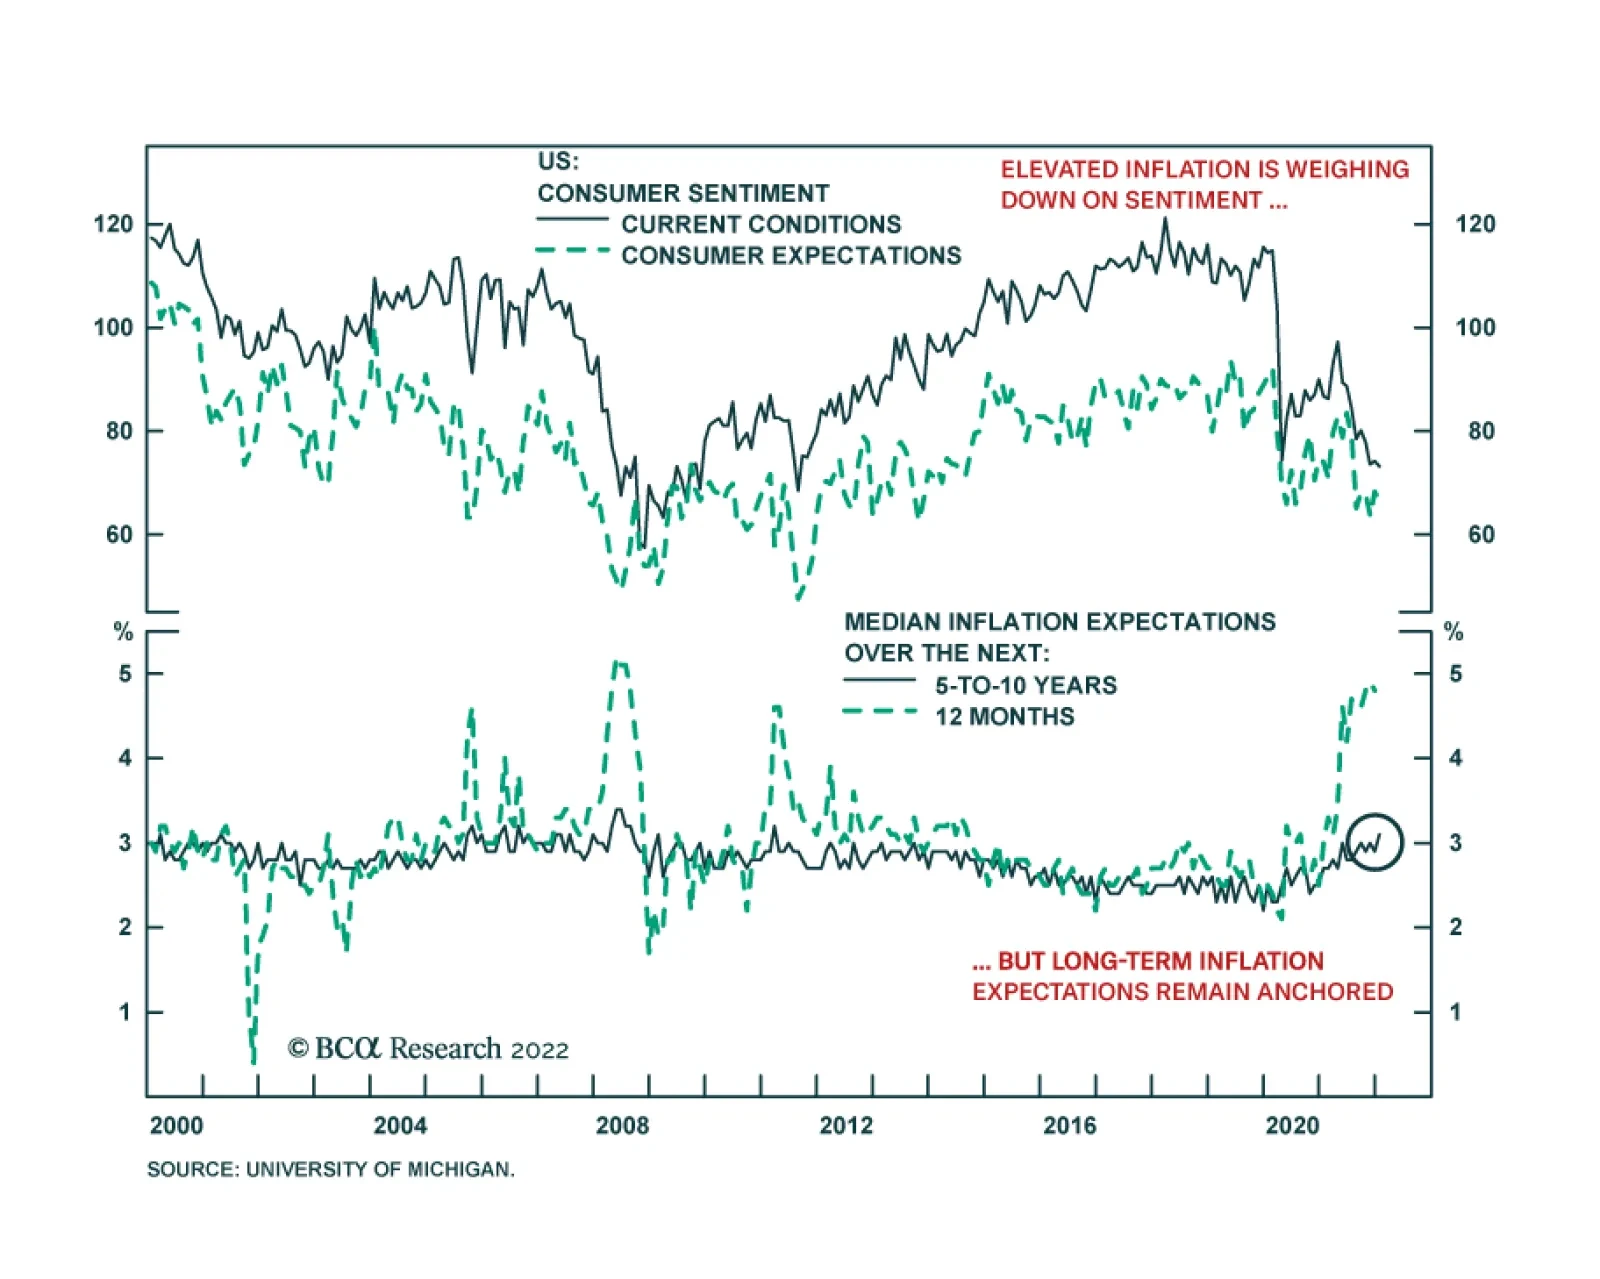
Preliminary results from the University of Michigan Surveys of Consumers suggest that US household sentiment slipped in January. The headline confidence index lost 1.8 points to 68.8 – slightly below expectations of a smaller decline to 70. Both current…
US mortgage rates have been soaring since the beginning of the year alongside Treasury yields. They are now at a pandemic high. In general, rising mortgage rates are a negative development for the US housing market as higher home loan borrowing costs weigh…

Highlights The neutral rate of interest in the US is 3%-to-4% in nominal terms or 1%-to-2% in real terms, which is substantially higher than the Fed believes and the market is discounting. The end of the household deleveraging cycle, rising wealth, stronger capital spending and homebuilding, and a structurally looser fiscal stance have all increased aggregate demand. In addition, deglobalization and population aging are depleting global savings, raising the neutral rate in the process. A higher neutral rate implies that monetary policy is currently more stimulative than widely perceived. This is good news for stocks, as it reduces the near-term odds of a recession. The longer-term risk is that monetary policy will stay too loose for too long, causing the US economy to overheat. This could prompt the Fed to raise rates well above neutral, an outcome that would certainly spell the end of the secular equity bull market. Investors should overweight stocks in 2022 but look to turn more defensive in late 2023. We are taking partial profits on our long December-2022 Brent futures trade, which is up 17.3% since inception. We are also closing our short meme stocks trade. AMC and GME are down 53% and 47%, respectively, since we initiated it. The Neutral Rate Matters At first glance, the neutral rate of interest – the interest rate consistent with full employment and stable inflation – seems like a concept only an egghead economist would care about. After all, unlike actual interest rates, the neutral rate cannot be observed in real time. The best one can do is deduce it after the fact, something that does not seem very relevant for investment decisions. While this perspective is understandable, it is misguided. The yield on a long-term bond is largely a function of what investors expect short-term rates to be over the life of the bond. Today, investors expect the Fed to raise rates to only 1.75% during this tightening cycle, a far cry from previous peaks in interest rates (Chart 1). Chart 2Investor Worries That The Fed Will Tighten Too Much Has Led To A Flattening Of The Yield Curve
Investor Worries That The Fed Will Tighten Too Much Has Led To A Flattening Of The Yield Curve
Investor Worries That The Fed Will Tighten Too Much Has Led To A Flattening Of The Yield Curve
Chart 1Expected Rate Hikes Are A Far Cry From Previous Peaks In Interest Rates
Expected Rate Hikes Are A Far Cry From Previous Peaks In Interest Rates
Expected Rate Hikes Are A Far Cry From Previous Peaks In Interest Rates
Far from worrying that the Fed will keep rates too low for too long in the face of high inflation, investors are worried that the Fed will tighten too much. This is the main reason why the yield curve has flattened over the past three months and the 20-year/30-year portion of the yield curve has inverted (Chart 2). Secular Stagnation Remains The Consensus View Why are so many investors convinced that the Fed will be unable to raise rates all that much over the next few years? The answer is that most investors have bought into the secular stagnation thesis, which posits that the neutral rate of interest has fallen dramatically over time. The secular stagnation thesis comes in two versions: The first or “strong form” describes an economy that needs a deeply negative – and hence unattainable – nominal interest rate to reach full employment. Japan comes to mind as an example. The country has had near-zero interest rates since the mid-1990s; and yet it continues to suffer from deflation. The second or "weak form" describes the case where a country needs a low, but still positive, interest rate to reach full employment. Such an interest rate is attainable by the central bank, and hence creates a goldilocks outlook for investors where profits return to normal, but asset prices continue to get propped up by an ultra-low discount rate. The “weak form” version of the secular stagnation thesis arguably describes the United States. Post-GFC Deleveraging Pushed Down The Neutral Rate
Chart 3
One can think of the neutral rate as the interest rate that equates aggregate demand with aggregate supply at full employment. If something causes the aggregate demand curve to shift inwards, a lower real interest rate would be required to bring demand back up (Chart 3). Like many other countries, the US experienced a prolonged deleveraging cycle following the Global Financial Crisis. The ratio of household debt-to-GDP has declined by 23 percentage points since 2008. The need for households to repair their balance sheets weighed on spending, thus necessitating a lower interest rate. Admittedly, corporate debt has risen over the past decade, with the result that overall private debt has remained broadly stable as a share of GDP (Chart 4). However, the drag on aggregate demand from declining household debt was not offset by the boost to demand from rising corporate debt. Whereas falling household debt curbed consumer spending, rising corporate debt did little to boost investment spending. This is because most of the additional corporate debt went into financial engineering – including share buybacks and M&A activity – rather than capex. In fact, the average age of the private-sector capital stock has increased from 21 years in 2010 to 23.4 years at present (Chart 5). Chart 4Household Debt Has Fallen From Its Highs, While Corporate Debt Has Risen Since The GFC
Household Debt Has Fallen From Its Highs, While Corporate Debt Has Risen Since The GFC
Household Debt Has Fallen From Its Highs, While Corporate Debt Has Risen Since The GFC
Chart 5The Average Age Of Capital Stock Has Been Increasing
The Average Age Of Capital Stock Has Been Increasing
The Average Age Of Capital Stock Has Been Increasing
Buoyant Consumer And Business Spending Will Prop Up The Neutral Rate Today, the US economy finds itself in a far different spot than 12 years ago. Households are borrowing again. Consumer credit rose by $40 billion in November, the largest monthly increase on record, and double the consensus estimate (Chart 6). Banks are easing lending standards across all consumer loan categories (Chart 7). Chart 6Big Jump In Consumer Credit
Big Jump In Consumer Credit
Big Jump In Consumer Credit
Chart 7Banks Are Easing Lending Standards For All Consumer Loans
Banks Are Easing Lending Standards For All Consumer Loans
Banks Are Easing Lending Standards For All Consumer Loans
Chart 8Net Worth Has Soared Over The Past Two Years
Net Worth Has Soared Over The Past Two Years
Net Worth Has Soared Over The Past Two Years
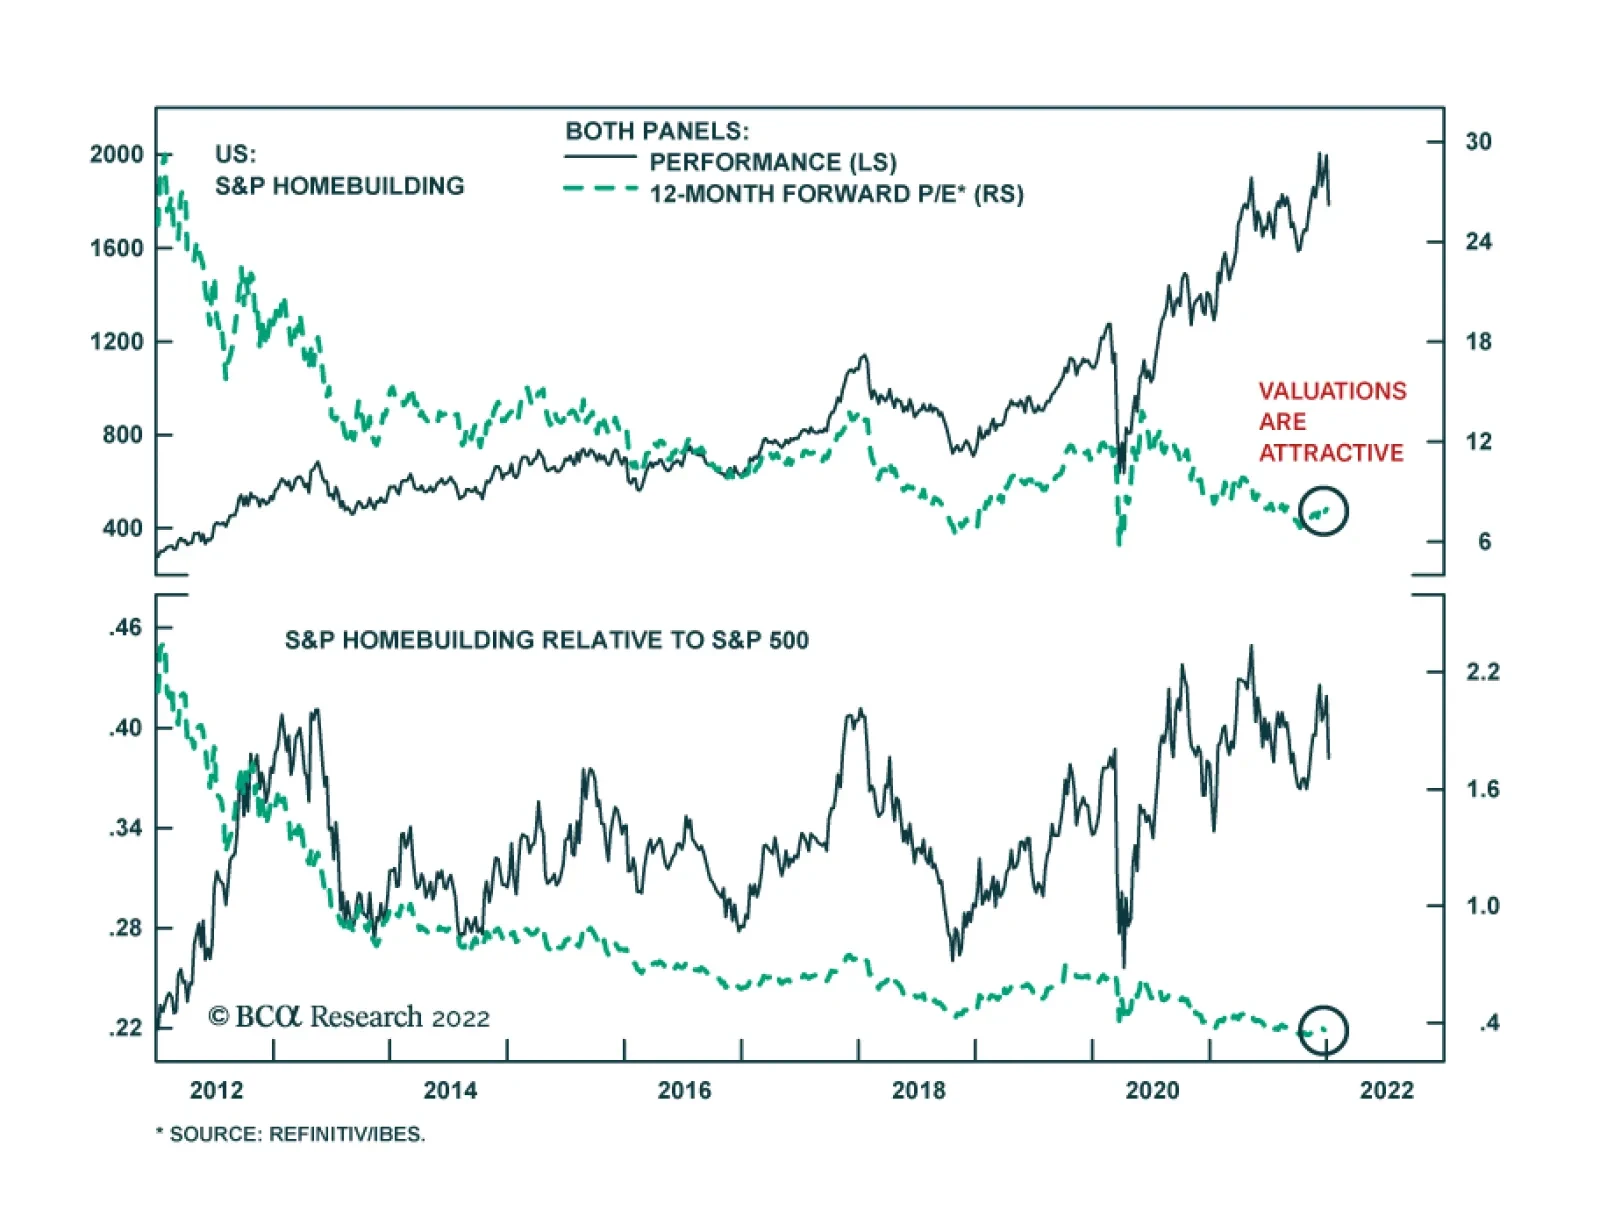
Meanwhile, years of easy money have pushed up asset prices, a dynamic that was only supercharged by the pandemic. We estimate that household wealth rose by 145% of GDP between the end of 2019 and the end of 2021 – the largest two-year increase on record (Chart 8). A back-of-the-envelope calculation suggests that this increase in wealth could boost aggregate demand by 5%.1 Reacting to the prospect of stronger final demand, businesses are ramping up capex (Chart 9). After moving sideways for two decades, capital goods orders have soared. Surveys of capex intentions remain at elevated levels. Against the backdrop of empty shelves and warehouses, inventory investment should also remain robust. Residential investment will increase (Chart 10). The homeowner vacancy rate has dropped to a record low, as have inventories of new and existing homes for sale. Homebuilder sentiment rose to a 10-month high in December. Building permits are 11% above pre-pandemic levels. Amazingly, homebuilders are trading at only 7-times forward earnings. We recommend owning the sector. Chart 9Investment Spending Will Stay Strong
Investment Spending Will Stay Strong
Investment Spending Will Stay Strong
Chart 10US Housing Will Remain Well Supported
US Housing Will Remain Well Supported
US Housing Will Remain Well Supported
Fiscal Policy: Tighter But Not Tight Chart 11Chinese Credit Impulse Seems To Be Bottoming
Chinese Credit Impulse Seems To Be Bottoming
Chinese Credit Impulse Seems To Be Bottoming
As in most other countries, the US budget deficit will decline over the next few years, as pandemic-related measures roll off and tax receipts increase on the back of a strengthening economy. Nevertheless, we expect the structural budget deficit to remain 1%-to-2% of GDP larger in the post-pandemic period, following the passage of the infrastructure bill last November and what is likely to be a slimmed down social spending package focusing on green energy, universal pre-kindergarten, and health insurance subsidies. The shift towards structurally more accommodative fiscal policies will play out in most other major economies. In the euro area, spending under the Next Generation EU recovery fund will accelerate later this year, with southern Europe being the primary beneficiary. In Japan, the government has approved a US$315 billion supplementary budget. Matt Gertken, BCA’s Chief Geopolitical Strategist, expects Prime Minister Kishida to pursue a quasi-populist agenda ahead of the upper house election on July 25th. China is also set to loosen policy. The Ministry of Finance has indicated that it intends to “proactively” support growth in 2022. For its part, the PBoC cut the reserve requirement ratio by 50 basis points on December 6th. The 6-month credit impulse has already turned up (Chart 11). More Than The Sum Of Their Parts Chart 12The Labor Share Typically Rises When Unemployment Falls
The Labor Share Typically Rises When Unemployment Falls
The Labor Share Typically Rises When Unemployment Falls
As discussed above, the end of the deleveraging cycle, rising household wealth, stronger capital spending and homebuilding, and a structurally looser fiscal stance have all increased aggregate demand in the US. While each of these factors have independently raised the neutral rate of interest, taken together, the impact has been even greater. For example, stronger consumption has undoubtedly incentivized greater investment by firms eager to expand capacity. Strong GDP growth, in turn, has pushed up asset prices, leading to even more spending. Furthermore, a tighter labor market has propped up wage growth, especially among low-wage workers. Historically, labor’s share of overall national income has increased when unemployment has fallen (Chart 12). To the extent that workers spend more of their income than capital owners, a higher labor share raises aggregate demand, thus putting upward pressure on the neutral rate. The Retreat From Globalization Will Push Up The Neutral Rate… Chart 13The Ratio Of Global Trade-To-Output Has Been Flat For Over A Decade
The Ratio Of Global Trade-To-Output Has Been Flat For Over A Decade
The Ratio Of Global Trade-To-Output Has Been Flat For Over A Decade
Globalization lowered the neutral rate of interest both because it shifted the balance of power from workers to businesses; and also because it allowed countries such as the US, which run chronic current account deficits, to import foreign capital rather than relying exclusively on domestic savings. The era of hyperglobalization has ended, however. The ratio of global trade-to-manufacturing output has been flat for over a decade (Chart 13). Looking out, the ratio could decline as geopolitical tensions between China and the rest of the world continue to simmer, and more companies shift production back home in order to gain greater control over the supply chains of essential goods. … As Will Population Aging Chart 14Most Of The Deceleration In US Potential Real GDP Growth Has Already Taken Place
Most Of The Deceleration In US Potential Real GDP Growth Has Already Taken Place
Most Of The Deceleration In US Potential Real GDP Growth Has Already Taken Place
Aging populations can affect the neutral rate either by dragging down investment demand or by reducing savings. The former would lead to a lower neutral rate, while the latter would lead to a higher rate. As Chart 14 shows, most of the decline in US potential GDP growth has already occurred. According to the Congressional Budget Office, real potential GDP growth fell from over 3% in the early 1980s to about 1.9% today, mainly due to slower labor force growth. The CBO expects potential growth to edge down to 1.7% over the next few decades. In contrast, the depletion of national savings from an aging population is just beginning. Baby boomers are leaving the labor force en masse. They hold over half of US household wealth, considerably more than younger generations (Chart 15). As baby boomers transition from net savers to net dissavers, national savings will fall, leading to a higher neutral rate. The pandemic has accelerated this trend insomuch as it has caused about 1.2 million workers to retire earlier than they would have otherwise (Chart 16).
Chart 15
Chart 16Number Of Retired People Jumped During The Pandemic
Number Of Retired People Jumped During The Pandemic
Number Of Retired People Jumped During The Pandemic
To What Extent Are Higher Rates Self-Limiting? Some commentators contend that any effort by central banks to bring policy rates towards neutral would reduce aggregate demand by so much that it would undermine the rationale for why the neutral rate had increased in the first place. In particular, they argue that higher rates would drag down asset prices, thus curbing the magnitude of the wealth effect. While there is some truth to this argument, its proponents overstate their case. History suggests that stocks tend to brush off rising bond yields, provided that yields do not rise to prohibitively high levels (Table 1). Table 1As Long As Bond Yields Don’t Rise Into Restrictive Territory, Stocks Will Recover
The New Neutral
The New Neutral
Chart 17The Equity Risk Premium Remains High
The Equity Risk Premium Remains High
The Equity Risk Premium Remains High
The last five weeks are a case in point. Both 10-year and 30-year Treasury yields have risen nearly 40 bps since December 3rd. Yet, the S&P 500 has gained 2.7% since then. Keep in mind that the forward earnings yield for US stocks still exceeds the real bond yield by 552 bps, which is quite high by historic standards. The gap between earnings yields and real bond yields is even greater abroad (Chart 17). Thus, stocks have scope to absorb an increase in bond yields without a significant PE multiple contraction. Investment Implications Our analysis suggests that the neutral rate of interest in the US is substantially higher than widely believed. How much higher is difficult to gauge, but our guess is that in real terms, it is between 1% and 2%. This is substantially higher than survey measures of the neutral rate, which peg it at close to 0% in real terms (Chart 18). It is also significantly higher than 10-year and 30-year TIPS yields, which stand at -0.73% and -0.17%, respectively (Chart 19). The neutral rate has also increased in other economies, although not as much as in the US. Chart 18Both The Fed And Investors Have Lowered Their Estimate Of The Neutral Rate
Both The Fed And Investors Have Lowered Their Estimate Of The Neutral Rate
Both The Fed And Investors Have Lowered Their Estimate Of The Neutral Rate
Chart 19Long-Term Real Rates Remain Depressed
Long-Term Real Rates Remain Depressed
Long-Term Real Rates Remain Depressed
If the neutral rate turns out to be higher than the consensus view, then monetary policy is currently more stimulative than widely perceived. That is good news for stocks, as it would reduce the near-term odds of a recession. Hence, we remain positive on stocks over a 12-month horizon, with a preference for non-US equities. In terms of sector preferences, we maintain our bias for banks over tech. The longer-term risk is that monetary policy will stay too easy, causing the economy to overheat. This could prompt the Fed to raise rates well above neutral, an outcome that would certainly spell the end of the secular equity bull market. Such a day of reckoning could be reached by late 2023. Two Trade Updates We are taking partial profits on our long December-2022 Brent futures trade by cutting our position by 50%. The trade is up 17.3% since inception. Bob Ryan, BCA’s Chief Commodity Strategist, still sees upside for oil prices, so we are keeping the other half of our position for the time being. We are also closing our short meme stocks trade. AMC and GME are down 53% and 47%, respectively, since we initiated it. While the outlook for both companies remains challenging, there is an outside chance that they will find a way to leverage their meme status to create profitable businesses. This makes us inclined to move to the sidelines. Peter Berezin Chief Global Strategist peterb@bcaresearch.com Footnotes 1 In line with published estimates, we assume that households spend 5 cents of every one dollar increase in housing wealth, 2 cents of every dollar increase in equity wealth, 10 cents out of bank deposits, and 2 cents out of other assets. Of the 145% of GDP in increased household net worth between the end of 2019 and the end of 2021, 19% stemmed from higher housing wealth, 52% from higher equity wealth, 12% from higher bank deposits, and 17% from other categories. View Matrix
Image
Special Trade Recommendations Current MacroQuant Model Scores
Image
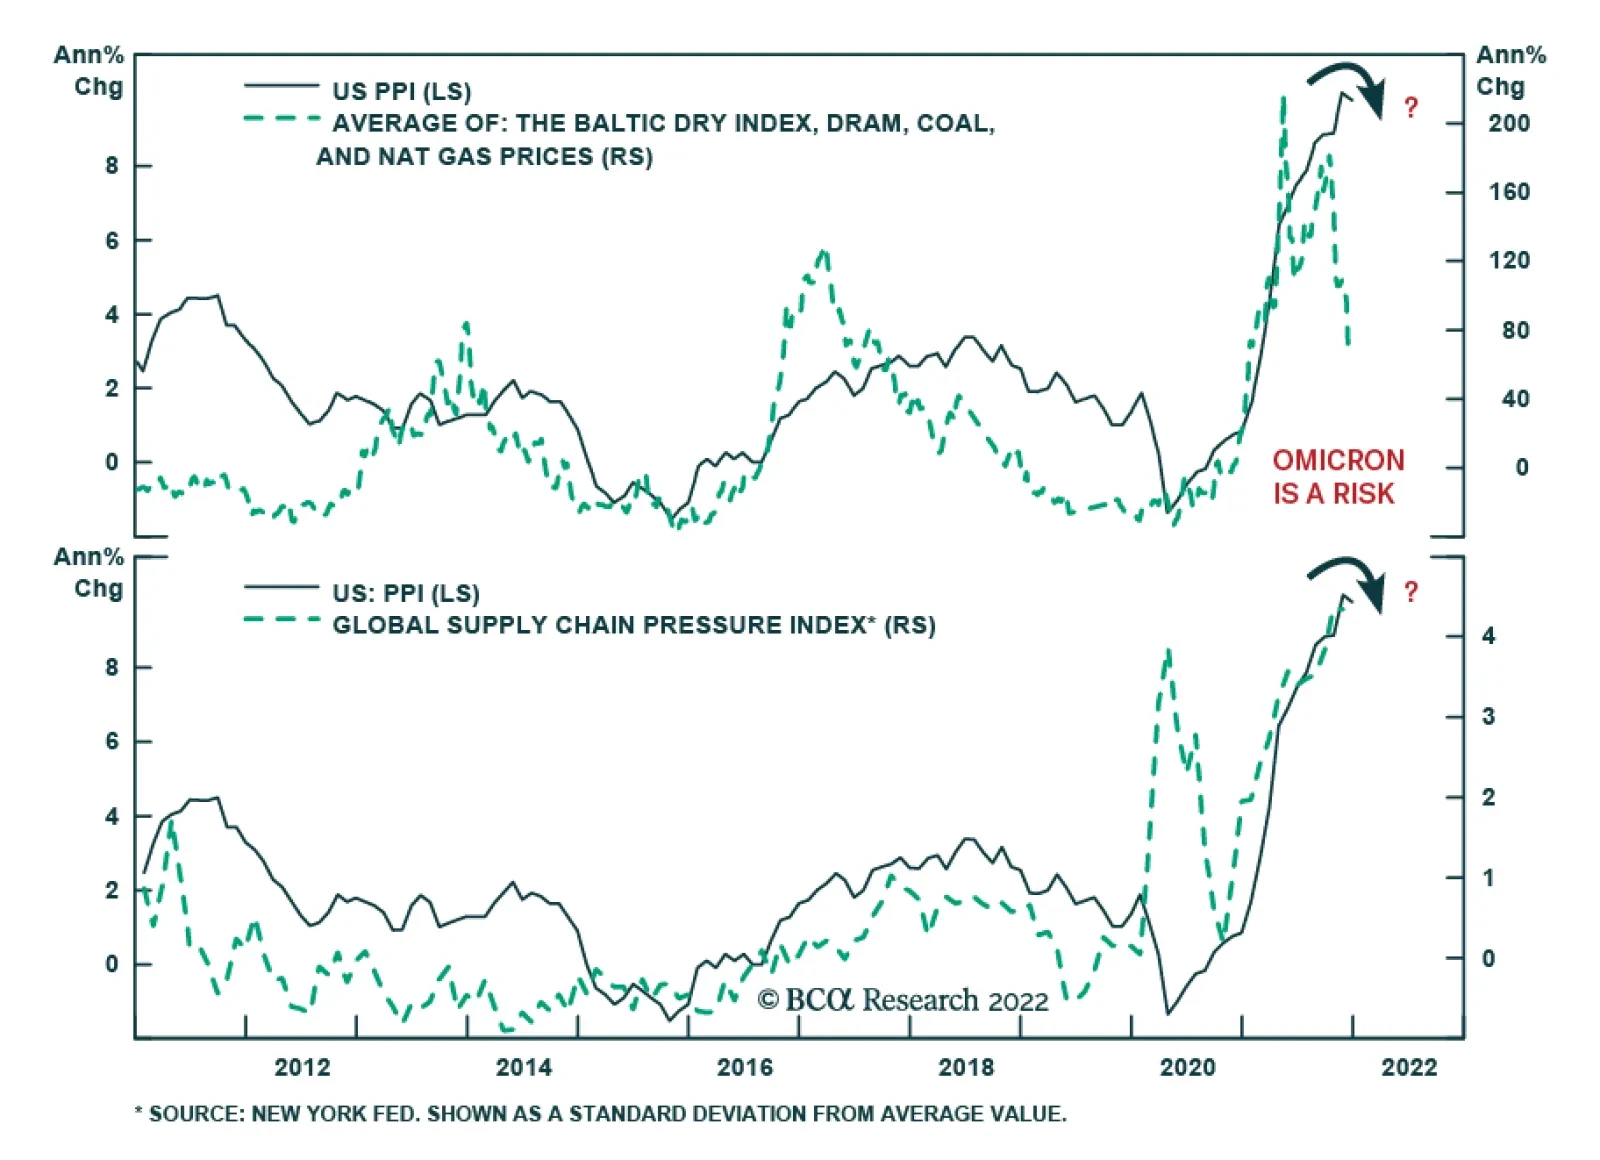
On the surface, the US December producer price index (PPI) suggests that the momentum in price pressures may have eased in December. PPI final demand inflation cooled to 0.2% m/m following November’s 1.0% increase and fell below expectations of a 0.4% m/m…
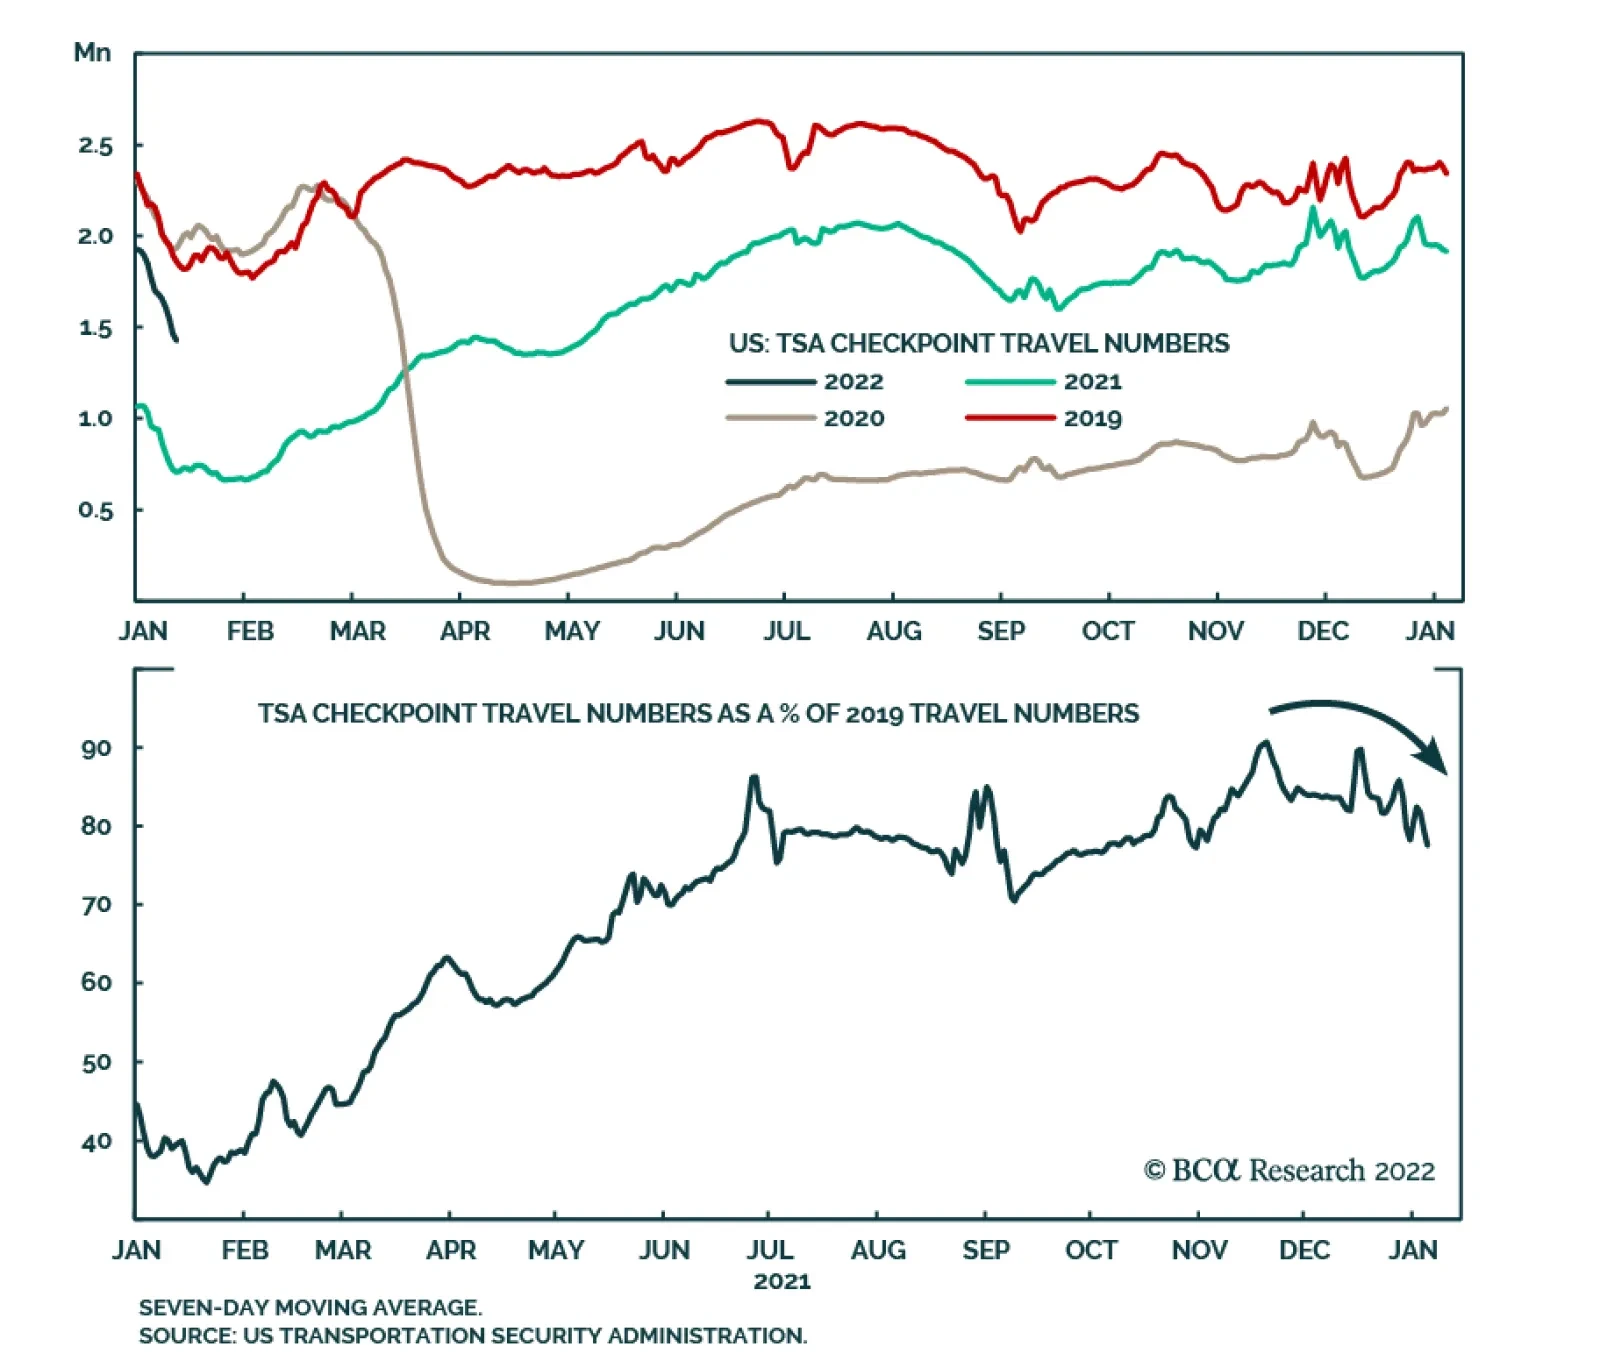
Data from the US Transportation Security Administration (TSA) indicate that the latest surge in COVID-19 cases has weighed down on US travel. The number of travelers screened at TSA checkpoints in US airports increased markedly over the past year. At the…
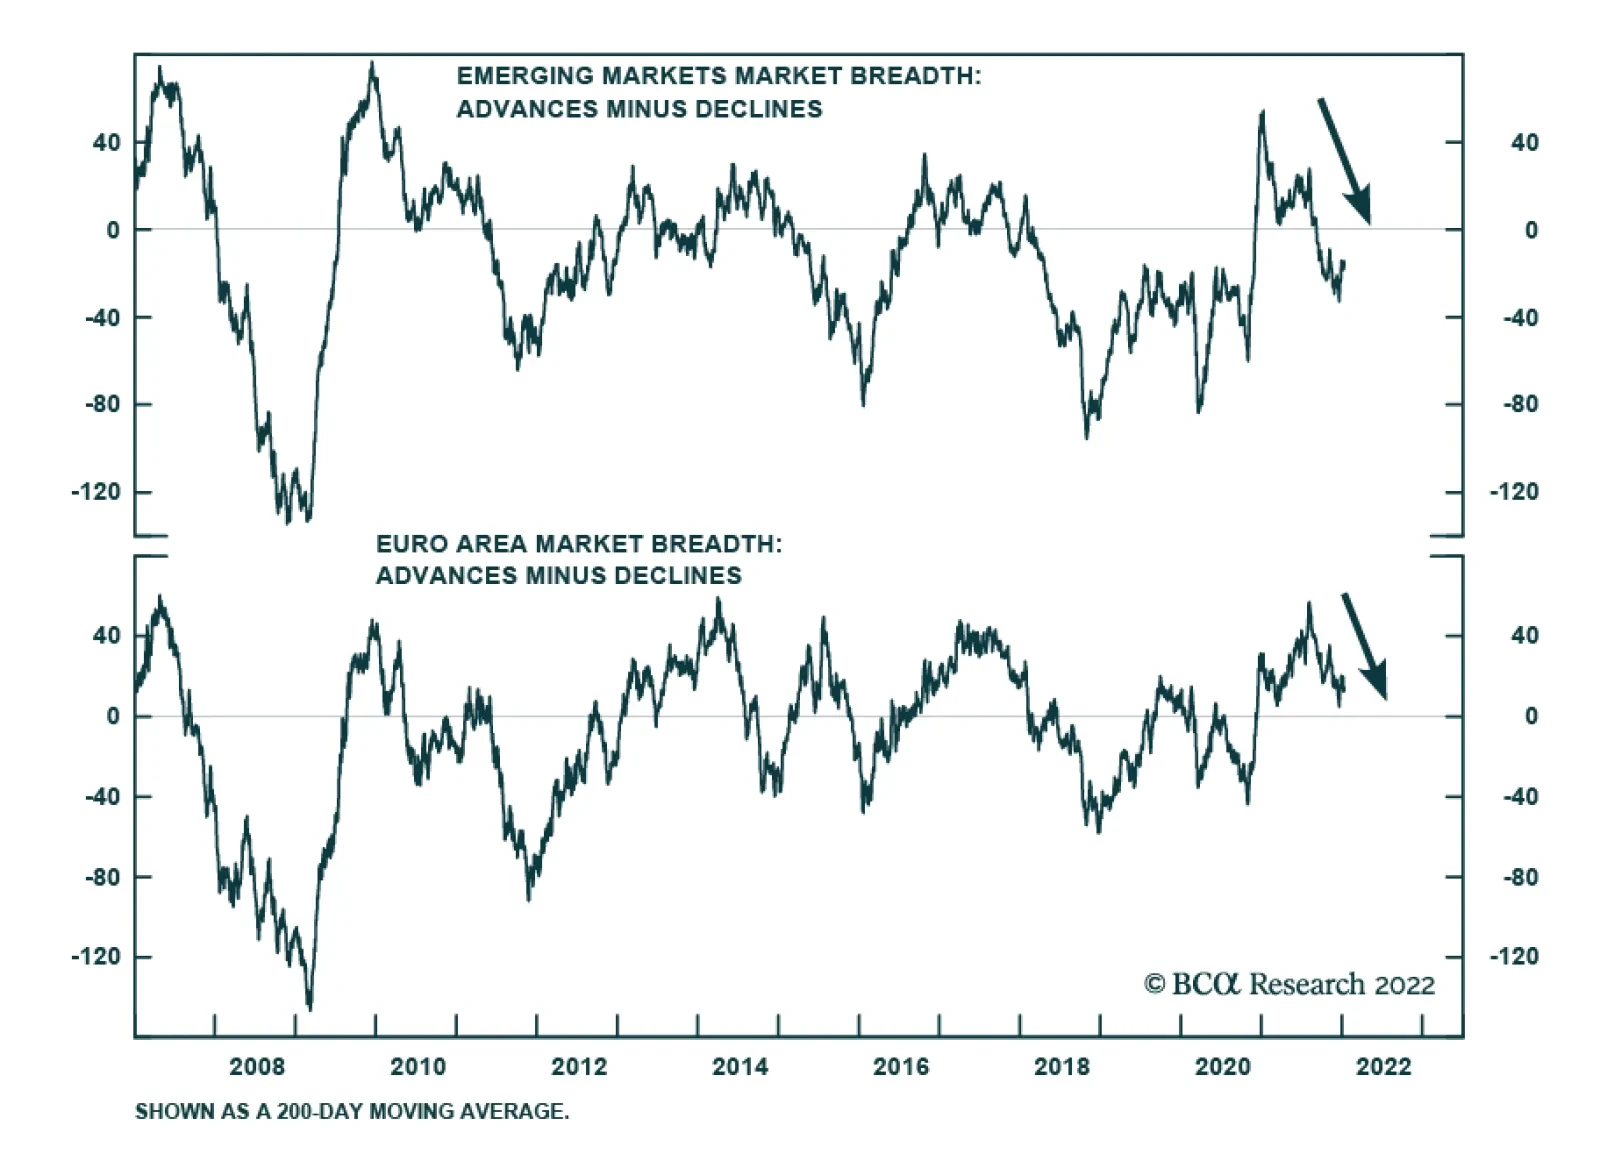
US stocks are not alone experiencing deteriorating market breadth. The chart above highlights that equity market performance has also narrowed among non-US stocks. Emerging market equities experienced a sharp drop in breadth over the course of last year.…
Highlights Data from the UK revealed it is tantalizingly close to declaring COVID-19 an endemic virus, indicating Britain likely will exit the pandemic ahead of other states soon. The UK is a bellwether market regarding its public-health response to the coronavirus. Some 95% of its population is estimated to carry COVID-19 antibodies (Chart of the Week). Other states – e.g., the US, the EU – have followed the UK with a lag, which we expect will continue. While the Fed's reassurance it will be able to hike rates without disrupting labor markets no doubt encourages markets – and boosted commodity prices – we believe the return to economic normalcy that would be ushed in by endemicity will release pent-up consumer demand for goods and services. This will spur commodity demand. If COVID-19 becomes endemic in enough economies globally, it also would fuel inflation, and inflation expectations.1 Given the tight supplies of industrial commodities – chiefly oil, natural gas and base metals – our assessment of upside price risk is higher now than it was at year-end 2021. We remain long broad-based commodity exposure via the COMT ETF, the PICK ETF, and the S&P GSCI index. Feature Fed Chair Powell's confidence that the US central bank will raise rates and keep inflation under control without destabilizing labor markets stole the show earlier this week. The media credited Powell's remarks for the burst of enthusiasm that lifted commodities as an asset class higher. While none would gainsay the Fed's importance to commodity markets, we would point out the approaching endemicity of COVID-19 in the UK – and the likely follow-on from the US and other large commodity-consuming states – is of equal, if not greater, moment. The UK has been out in front on its public-health response to the COVID-19 pandemic and has become a bellwether in the northern hemisphere; the US will follow.
Chart 1
This week, the UK's Office for National Statistics (ONS) reported ~ 95% of England's population tested positive for antibodies to COVID-19 via infection or vaccination in the week beginning 29 November 2021. Similar results were reported for Scotland, Wales and Northern Ireland. This is generally observed in all age cohorts tracked by ONS.2 According to David Heymann of the London School of Hygiene and Tropical Medicine, "population immunity seems to be keeping the virus and its variants at bay, not causing serious illness or death in countries where population immunity is high."3 In a briefing hosted by Chatham House this week, Heymann observed, “And probably, in the UK, it’s the closest to any country of being out of the pandemic if it isn’t already out of the pandemic and having the disease as endemic as the other four coronaviruses” currently in circulation, which are responsible for roughly a quarter of common colds.4 Based on UK government data, the ratios of hospitalizations and deaths to COVID-19 cases has been falling precipitously (Chart 2). This is encouraging, given the sharp increase in cases driven by the rapid spread of the omicron mutant, which appears to be rolling over. Medical experts in the UK suggest the data also point to a possible peaking in the omicron surge. This would lighten the load on hospitals, as well as reduce death rates attributed to the coronavirus (Chart 3).5
Chart 2
Chart 3
Return To Normal? Nothing will return commodity markets to economic normalcy faster than endemicity. If this stays on track over the next month or so, it will spur commodity demand sooner rather than later, as pent-up consumer demand for goods and services is discounted by trading markets. If, as the data appear to indicate, the UK's transition from pandemic to endemic COVID-19 is followed by other states like the US and EU a few months later, we would expect a renewed leg up in the post-pandemic commodities rally. This would be apparent in futures contracts, which already are pricing commodity deliveries a month or more hence. Such a turn of events would force us to accelerate our time table for oil-demand recovery, which we expect will come in 2H22. This could restore our $80/bbl forecast for 2022, and lift our 2023 expectation. We also would have to revisit our copper and base metals view, and bring forward the timing of the copper-price rally we expect will lift COMEX refined copper to $4.80/lb and $6.00/bbl in 2022 and 2023, respectively, on average.6 These industrial commodities would see demand increase amid extremely tight supply conditions. Oil markets are tightening on the back of OPEC 2.0's production discipline, and the inability of many member states to fully restore the 400k b/d every month it signed on for beginning in August of last year, owning to production shortfalls outside the core producers of the coalition (Chart 4). Copper, the base-metals bellwether, remains very tight, as seen in balances (Chart 5) and inventories (Chart 6). Chart 4OPEC 2.0s Strategy Works
OPEC 2.0s Strategy Works
OPEC 2.0s Strategy Works
Chart 5Coppers Physical Deficits Will Persist...
Coppers Physical Deficits Will Persist...
Coppers Physical Deficits Will Persist...
Chart 6Globally, Exchange Warehouses Tighten
Globally, Exchange Warehouses Tighten
Globally, Exchange Warehouses Tighten
China's zero-COVID-19 policy, which has resulted in numerous lock-downs at the local level, has yet to dent oil demand, which, for the time being, is hovering ~ 16mm b/d. We will be updating our oil balances and price forecasts next week, and will have a more extensive analysis of supply-demand balances then. Return Of Speculative Interest Expected With Endemicity Hedge funds have been reducing their exposure to the industrial commodities over the past year, which suggests they either have better alternatives for investing, or did not believe the rallies in commodities over the past year were durable, given the repeated demand shocks visited upon these markets by COVID-19 (Chart 7). We expect that once the pandemic becomes endemic, hedge funds will return to these markets. All the same, given the higher likelihood of price rallies in these markets, we would expect hedge funds to be cited as a cause of higher prices, as typically happens when markets take a sharp leg higher. Regular readers of our research are aware that this generally is not the case – hedge funds follow the news; they don't lead it. This past week we revisited earlier research to see if hedge-fund involvement in commodity markets causes the prices to go up or down to any meaningful degree. And, again, we found no relationship between hedge-fund positioning and the level of commodity prices.7
Chart 7
The presumed influence of hedge funds has been a persistent feature of futures markets in the post-GFC world, following the collapse of commodity prices along with financial markets in 2008. An entire literature has sprung up to explore the influence of these funds on commodity price formation. Below we highlight a few representative articles consistent with our results. Büyüksahin and Harris (2011) show hedge funds and other speculators follow prices – they do not lead them – based on the Granger-causality testing they performed on oil prices and speculative positioning.8 Brunetti et al (2016) argue hedge funds' trading stabilizes markets – i.e., they provide a bid when markets are selling off and an offer when markets are well bid – while swap-dealer trading is uncorrelated with price volatility.9 Knittel and Pindyck (2016) found speculation has reduced volatility in prices since 2004, including during the 2007-08 price run-up.10 Using a straightforward supply-demand-inventory model, they examined cash and storage markets to determine whether speculation had any effect on them or on convenience yields based on cash-vs-futures spreads. They concluded: "We found that although we cannot rule out that speculation had any effect on oil prices, we can indeed rule out speculation as an explanation for the sharp changes in prices beginning in 2004. Unless one believes that the price elasticities of both oil supply and demand are close to zero, the behavior of inventories and futures-spot spreads are simply inconsistent with the view that speculation has been a significant driver of spot prices. If anything, speculation had a slight stabilizing effect on prices." Investment Implications Assuming the UK remains a bellwether for DM economies with reasonably effective vaccine programs, or which have experienced an omicron surge, markets could be close to exiting the COVID-19 pandemic and entering a phase in which the coronavirus is endemic. This would be bullish for demand. And given the extended tightness on the supply side for industrial commodities in particular, it could presage another leg up in prices as economic normalcy returns. We continue to favor broad-based commodity exposure via the COMT ETF, the PICK ETF, and the S&P GSCI index. Robert P. Ryan Chief Commodity & Energy Strategist rryan@bcaresearch.com Ashwin Shyam Research Associate Commodity & Energy Strategy ashwin.shyam@bcaresearch.com Commodities Round-Up Energy: Bullish US LNG baseload and peak liquification capacity is expected to rise ~ 13% this year to 11.4 Bcf/d and 13.8 Bcf/d (on a December-to-December basis), based on the EIA's latest estimates. The agency's forecast for LNG exports is up 17.3% to 11.5 Bcf/d this year, and 12.1 Bcf/d in 2023. With these increases in baseload and peak export capacity, the US is set to become the largest exporter of LNG in the world this year, in the EIA's estimation. This will be integral to US foreign policy, particularly in markets where the US competes with Russia for export sales, in our estimation. Within North America, US pipeline gas exports to Mexico and Canada are expected to average just under 9 Bcf/d this year, a 5% increase vs. 2021, and 9.2 Bcf/d in 2023. Base Metals: Bullish In China, seasonally low production, as stainless-steel firms undergo maintenance, and the upcoming Winter Olympics in February are keeping steel production subdued. To compound this supply shortage, tight raw material markets, particularly that of iron ore and nickel are buoying steel prices. Heavy rainfall in southern-eastern Brazil is curtailing iron ore production in the region. After Australia, Brazil is the second largest iron ore exporter to China. Nickel prices hit a 10-year high on Tuesday on the back of falling inventories. An LME outage also precipitated the price rise. Dwindling inventories point to increasing demand for the metal as electric vehicle companies ramp-up production and sales this year, particularly in China, where the government stated it will remove EV subsidies by the end of 2022. According to The China Passenger Car Association, EV sales in the country will double to 6 million this year. Precious Metals: Bullish Based on the December FOMC minutes, the markets are now pricing in a more hawkish tilt from the Fed, and expect an initial rate hike by March. The Fed may also shrink its balance sheet soon after the initial rate hike, in line with its expectation the U.S. economy will recover faster this time around. While higher nominal interest rates and tighter monetary policy will increase the opportunity cost of holding gold (Chart 8), the commodity-driven inflation we expect this year – especially if COVID-19 becomes endemic across major economies – will buoy demand for the yellow metal as an inflation hedge. An endemic virus this year will also boost physical gold demand from China and India.
Chart 8
Footnotes 1 Please see More Commodity-Led Inflation On The Way, which we published on 9 December 2021. 2 Please see Coronavirus (COVID-19) latest insights: Antibodies, published by the ONS on December 23, 2021. 3 Please see Covid-19: UK ‘closest of any country in northern hemisphere to exiting pandemic’, published on January 11, 2022 by msn.com. 4 Please see What four coronaviruses from history can tell us about covid-19, published by newscientist.com on April 29, 2020. 5 Please see Omicron may be headed for a rapid drop in US and Britain, published by msn.com on January 11, 2022 published by msn.com. 6 Please see 2022 Key Views: Past As Prelude For Commodities, which we published on December 16, 2021. 7 We ran cointegrating regressions – using DOLS and ARDL models – to check for any equilibrium between prices and hedge fund positioning and found none. We looked at the post-GFC period from 2010 to now, since this is the data the US Commodity Futures Trading Commission (CFTC) provides for hedge funds and tested whether hedge-fund positions (in the form of open interest) explained prices vs. the alternative (i.e., prices explain hedge-fund positioning). We again found prices explain position (and not vice versa) for crude oil, natural gas, copper and gold. 8 Please see Büyüksahin, Bahattin and Jeffrey H. Harris (2011),"Do Speculators Drive Crude Oil Futures Prices?" The Energy Journal, 32:2, pp. 167-202. This paper used unique data sets provided by the CFTC. 9 Please see Brunetti, Celso, Bahattin Büyüksahin, and Jeffrey H. Harris (2016), "Speculators, Prices, and Market Volatility," Journal of Financial and Quantitative Analysis, 51:5, pp. 1545-74. 10 Please see Knittel, Christopher R. and Robert S. Pindyck (2016), "The Simple Economics of Commodity Price Speculation," American Economic Journal: Macroeconomics 8:2, pp. 85–110. Investment Views and Themes Strategic Recommendations Trades Closed In 2021
Image
Downgrading Semis To An Underweight
Downgrading Semis To An Underweight
Underweight In the recent Semiconductors: Aren’t They Fab report, we have downgraded the S&P Semis & Semi Equipment index from overweight to neutral on a cyclical basis (3-6 months) on the back of tightening financial conditions that will weigh on the performance of this hypersensitive cyclical industry. So far, the rise in global bond yields has not been fully priced in and remains a headwind (see chart, top panel). Further, semis also face deceleration in manufacturing activity: The ISM New Orders/Inventories ratio has turned sharply down. Historically, it has been a leading indicator for the Global Semiconductor sales, and the relative performance of the industry index (see chart, middle & bottom panels). Last, the sector commands a higher multiple than the S&P 500, while its growth expectations are in line with the market: This suggests that the valuation premium is hardly justified, and there isn’t a valuation cushion to absorb the blow from the global economic slowdown. The combination of these three factors compels us to downgrade semis to underweight. Bottom Line: Today we downgrade the S&P semis & semi equipment index from neutral to underweight. As a reminder, we have recently booked 14% in gains after closing our long semis recommendation (we were overweight Semis from July to December 2021).
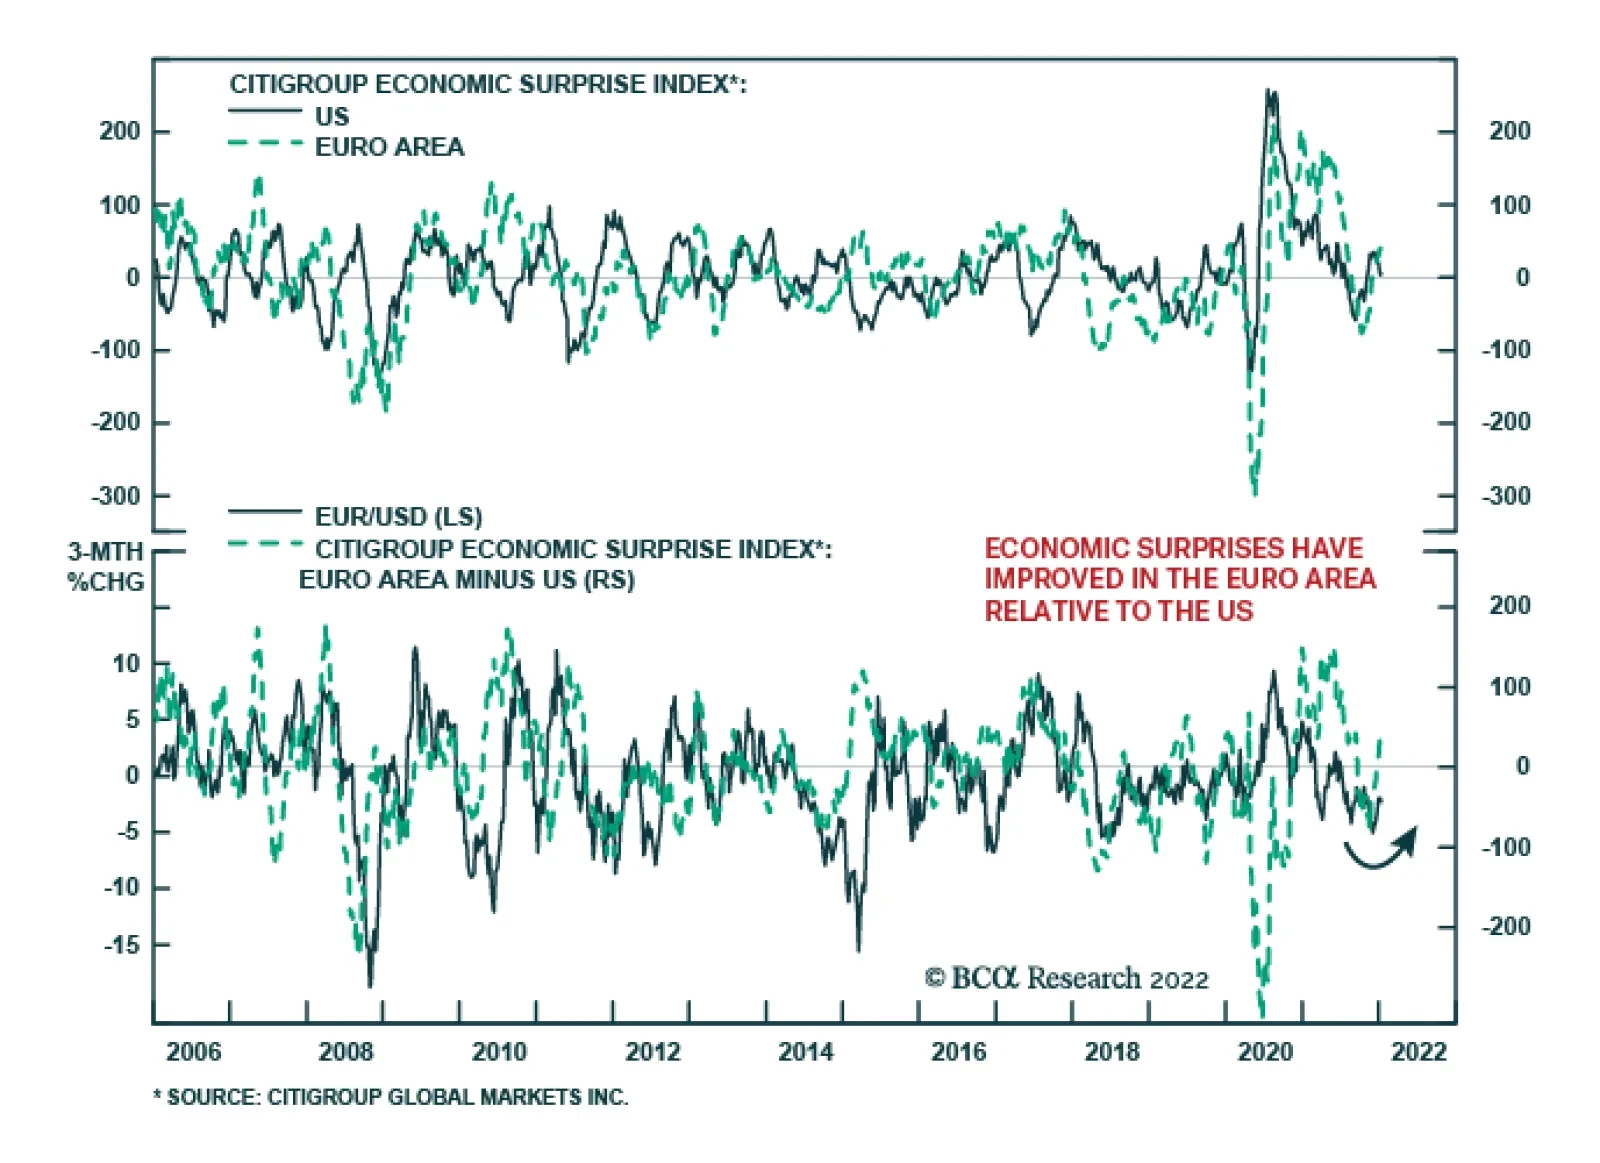
The Citigroup US economic surprise index peaked in late-November and has rolled over since then. It is now just barely in positive territory. Meanwhile, the Eurozone economic surprise index bottomed in mid-October and has been on an upward trend. The Eurozone…
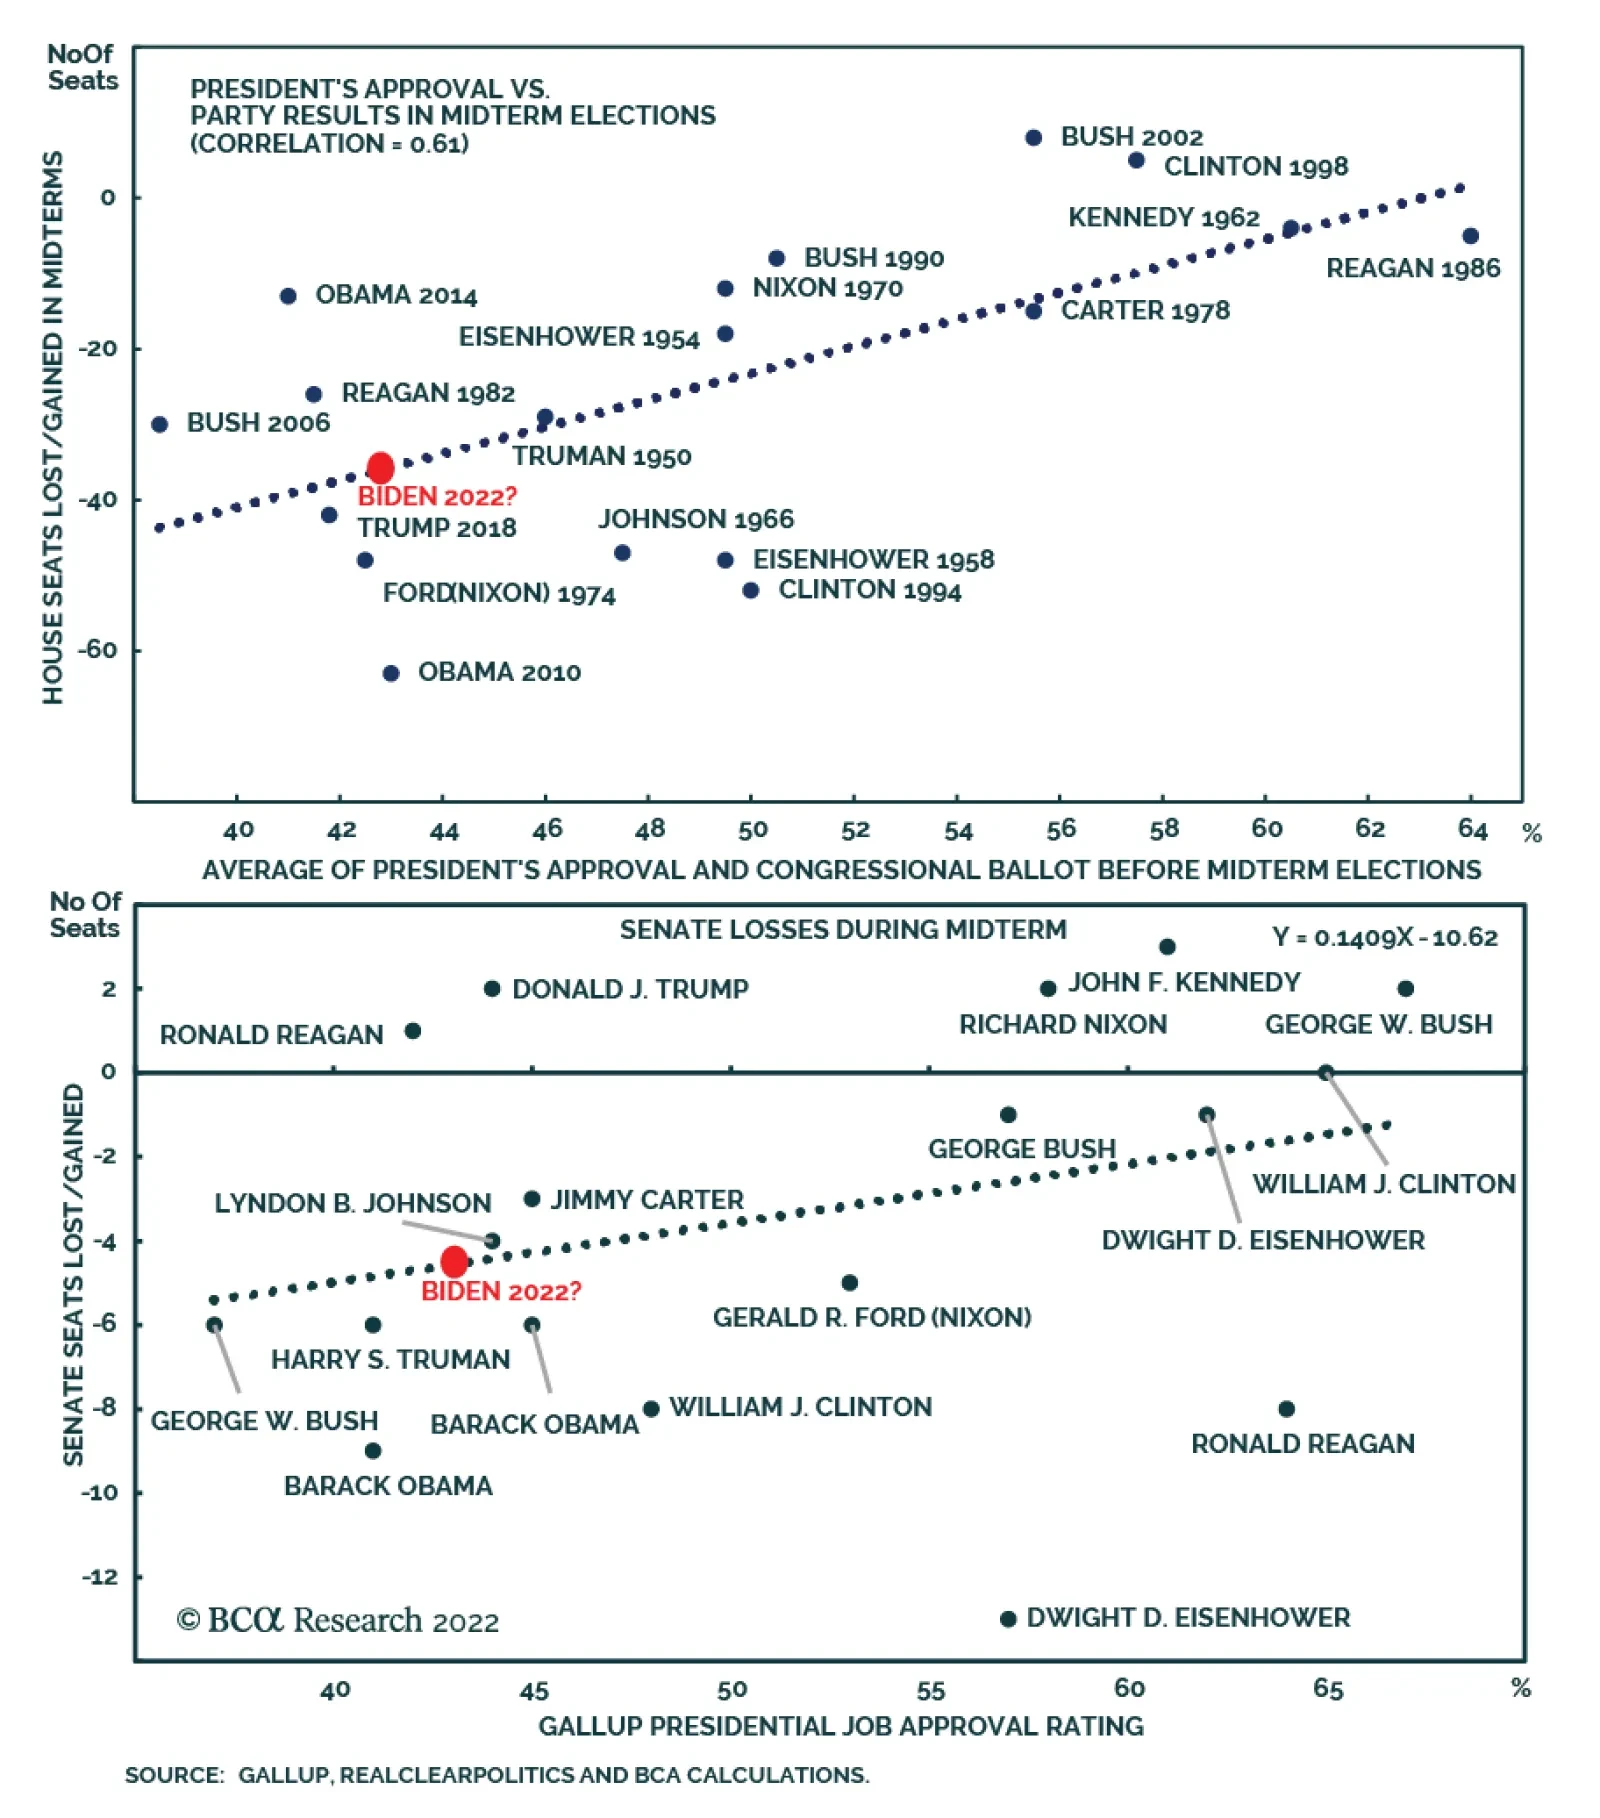
BCA Research’s US Political Strategy service highlights its three key views for this year. 1. From Single-Party Rule To Gridlock: Republicans are highly likely to win back control of the House of Representatives and likely the Senate.…