United States
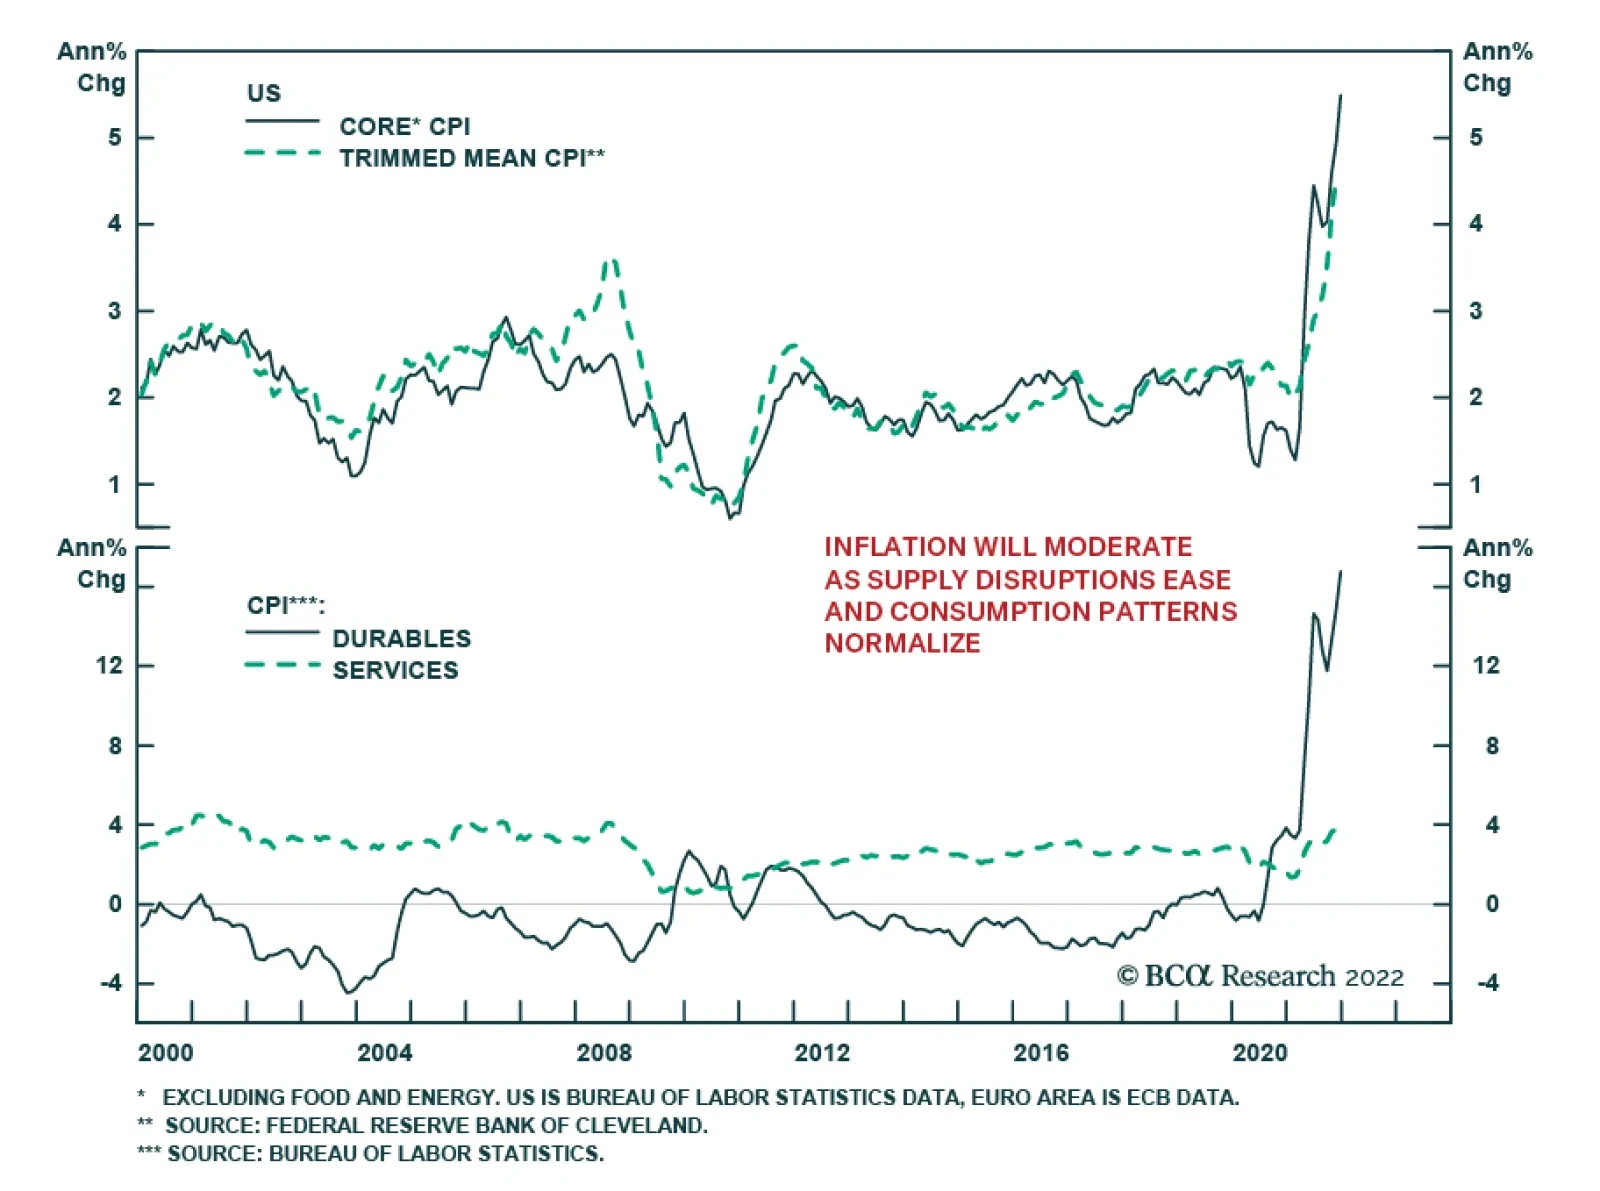
Overall, the December US CPI report indicates that price pressures remain extreme. As expected, US consumer inflation rose to a blistering 7.0% y/y in December from 6.8% y/y in the prior month. Meanwhile, the month-on-month CPI growth rate moderated from…

Dear Client,In this special issue we present the first commentary for the BCA Research US High-Quality Stock Selection strategy, which represents the next evolution of the Equity Analyzer service.The strategy, constructed exclusively using the Equity Analyzer toolset, provides reliable exposure to high-quality US securities through the BCA Score factor model, while maintaining sector neutrality relative to the US market.Most importantly, the underlying portfolio is now offered through BCA Research Investment Solutions, which provides turn-key and directing-indexing implementations of our quantitative signals. This solution marks the most accurate and practical implementation of our equity factor model to-date.For more information about the strategy, including historical performance metrics, or, to learn how to incorporate this service into your investment process, please contact investmentsolutions@bcaresearch.com.Performance RecapThe US equity market regained its composure in month of December 2021, with investors seeing through the rapidly spreading but seemingly less pathogenic Omicron variant. The US High-Quality strategy (USHQ), which closely tracks movement in the SPDR S&P 500 ETF (SPY, approx. 90% correlation since inception), also had a strong month, with an outperformance of 0.49% relative to SPY.1 Since last quarter, strategy performance has been mostly in line with the US market (Chart 1), with modest downside protection and lower daily return volatility (Table 1), which are typical characteristics of the strategy.
Chart 1
Returning to the most recent month of trading (December 2021), we are reminded that tech and health care continue to have a major influence on total returns given their weight in the US market. The USHQ portfolio was able to gain ground against SPY through outperformance in 8 out of 11 GICS Level 1 sectors, namely in tech and health care (Chart 2). Within SPY, mega-cap symbols continued to provide strong contributions2 with AAPL, TSLA, FB, MA, and UNH leading the pack. Downside impact was muted, with ADBE being the top detractor. The USHQ strategy had solid breadth across constituents, with a few holdings standing out in tech and health care. The top/bottom 10 contributors for the month of December are shown in Table 2A and Table 2B. Table 12021Q4 Statistics*
BCA US High-Quality Stock Selection Strategy
BCA US High-Quality Stock Selection Strategy
Chart 2
Chart
Chart
At the current juncture, US equities are experiencing increased volatility due in part to a hawkish tone from the Federal Reserve. The latest set of FOMC minutes point to a mid-march liftoff date. This comes amid sustained inflationary pressures and a move towards maximum employment in the US. Not surprisingly, the market has corrected slightly against this backdrop. As of end-of-day January 11, 2022, USHQ is down -0.3% MTD vs -1.7% for SPY.Factor BreakdownIn this section we examine the current factor landscape for the USHQ portfolio, SPY, and the broad US equity universe.The current factor exposure for the USHQ portfolio and SPY is shown in Chart 3. It is up to date as of the latest portfolio rebalance (Jan 3, 2021). The methodology is similar to that used by the Factor Analyzer widget on the Equity Analyzer (EA) platform. We define the composite factor exposure as the difference between the portfolio or fund-weighted average factor score and the average score of our stock universe. In this case the stock universe consists of the top 1000 US stocks according to market cap. Composite factor scores are obtained from the EA platform and range from 0% to 100%.The portfolio will tend to have a positive factor exposure on most factors as it holds the top ranking stocks in each sector according to the BCA Score. The factor exposure of SPY will vary from month to month depending on the evolution of the market. In the ideal environment, the strategy should have positive BCA Score exposure relative to the market index. Practically speaking, this provides verification that the strategy is correctly tilted towards the factors we deem important for managing market risk.The values in Chart 4 can be interpreted as the difference between the dark green bars and light green bars in Chart 3. This month, we observe that the valuation gap between the portfolio and SPY has narrowed relative to last month. This was mainly due to a drop in the Value Score of USHQ, which can be explained by a significant price appreciation in the strategy's tech holdings. Increased exposure to Technicals for USHQ and SPY indicate that both are increasingly weighted towards firms with strong momentum over the past 12 months.
Chart 3
Chart 4
When considering the broad US equity universe on an equal-weighted basis, it’s clear that the composite Value factor has experienced a resurgence over the past month (Chart 5). The BCA Score metric has remained robust over the same period, with the core model components outperforming on a long/short basis. The current factor landscape reflects a switch to an environment of rising interest rates, as seen by the movement of the 10-year Treasury yield. Based on a previous study of factor performance in different rate environments, the outlook for Quality factors remains strong, as we are currently in an environment of high3 and rising rates (Chart 6).
Chart 5
Chart 6
Portfolio Constituents SummaryThis section provides information about the latest holdings in the portfolio as of last rebalance (Jan 3, 2021). The current sector composition is shown in Chart 7 with changes since last rebalance shown in parentheses. New positions in the portfolio are shown in Table 3A, and closed positions are shown in Table 3B. Movement of securities in and out of the portfolio is driven primarily by the level of the factor model ranking (BCA Score) at the time of rebalance.
Chart 7
Chart
Chart
Specifically, positions are closed when the BCA Score drops below 70% and the Composite Macro Score is below 75%. The closed positions are replaced with high-ranking securities from the pool of top 1000 US stocks by market capitalization. Rebalancing occurs on the first trading day of each month. The number of securities in the portfolio currently sits at 55, with 5 stocks occupying each of the 11 GICS Level 1 sectors.Footnotes1 Calculated for the latest portfolio intra-rebalance period (2021-12-01 to 2022-01-03) using dividend-adjusted end-of-day pricing.2 Contribution defined as fund or portfolio-weighted return during the given month.3 As determined by our moving average (MA) cross indicators. Rates are considered “high” if the 3-month MA is above the 3-year MA.
Highlights This week we highlight key charts for US Political Strategy themes and views in the New Year. For H1 2022, we maintain a pro-cyclical, risk-on approach. We favor industrials, energy, infrastructure, and cyclicals. Foreign supply kinks will persist due to Omicron. The US Congress will pass one more spending bill as Democrats try to save their skin ahead of the midterm election. Yet other trends are not so inflationary: Fed rate hikes, an 8% of GDP fiscal drag, and a looming return to congressional gridlock. Midterm elections usually see defensive and growth stocks outperform cyclical and value stocks. This is a risk to our view and may require adjustments later this year. Feature This week we offer our updated US Political Strategy chart pack for the new year. Inflation and stagflation are the top concerns. But the Federal Reserve is kicking into gear, with the market now expecting three-to-four interest rate hikes in 2022 alone. We doubt that will come to pass but it is possible and there is no question that a 12-month core PCE print of 4.7% is forcing the Fed to move. Since the mega-stimulus of March 2020, markets have seen a 91% rally in the S&P 500 and a 114% rally in the tech sector. Ultra-low interest rates and stay-at-home policies created a paradise for tech stocks. But the 10-year Treasury yield surged from 1.45% in December, when Omicron emerged and the Fed turned hawkish, to 1.76% today. An inflation-induced pullback and rotation out of tech stocks was to be expected and has been our most consistent sectoral view. Long-term inflation expectations have not taken off, however. Many investors see secular stagnation over the long run – and even in the short run the resilient dollar should work against inflation. Not only will the Fed wind down asset purchases by $30bn a month starting January 2022 and start hiking rates in March, but also the budget deficit is contracting, making for an 8% of GDP fiscal drag in 2022. In addition the market no longer has any confidence that Congress will pass President Biden’s “Build Back Better” plan. We still think a reconciliation bill will pass, albeit in watered down form. But ultimately the looming midterm election will paralyze Congress, as we argued in our 2022 outlook report, “Gridlock Begins Before The Midterms.” Gridlock will ensure that whatever passes only modestly expands the long-term deficit and then that fiscal taps will be turned off in 2023. In the context of Fed hikes, this should reduce fears of inflation later in 2022, though we still see inflation as a persistent long-term problem. If history is any guide, stocks and bond yields will be flattish for most of the year due to election uncertainty. The difference between this year and other midterm years is that the US consumer is in better financial shape and yet foreign supply kinks will persist due to Omicron. The takeaway is to prefer industrials, energy, small caps, and cyclicals, even though we may not maintain these recommendations for the whole year. We are hedging by staying long health care stocks. Omicron: Less Relevant At Home, More Relevant Abroad American economic growth is declining but will likely settle at or above trend (Chart 1A). Money growth, a proxy for stimulus, is also coming off its peaks while credit growth is rising moderately. The long deleveraging of the American consumer since 2008 appears to have come to an end. But it is too soon to say how aggressively Americans will lever back up and whether a new private sector “debt super cycle” will begin (Chart 1B). Chart 1AEconomic Growth Peaked, Will Slow To Trend
Economic Growth Peaked, Will Slow To Trend
Economic Growth Peaked, Will Slow To Trend
Chart 1BEconomic Growth Peaked, Will Slow To Trend
Economic Growth Peaked, Will Slow To Trend
Economic Growth Peaked, Will Slow To Trend
The Omicron variant of COVID-19 will have a modest negative impact early in the year. Hospitalizations are picking up in the wake of a surge in new cases following Christmas gatherings. Only 61% of Americans are fully vaccinated and only 23% have received the booster shot that is most effective against Omicron (Chart 2A & Chart 2B). Yet new deaths from the disease remain subdued and only about a fifth of those hospitalized go to the intensive care unit today.
Chart 2
Chart 2BCOVID-19 Continues But Relevance Wanes
COVID-19 Continues But Relevance Wanes
COVID-19 Continues But Relevance Wanes
Pharmaceuticals, both vaccines and anti-viral medications, are saving the day and Americans are becoming resigned to the likelihood of getting the virus at some point. Social mobility has dropped off since summer 2021 but will boom in the springtime and consumer confidence is already picking back up (Chart 3A & Chart 3B). The Biden administration is not likely to impose unpopular social restrictions during an election year unless a variant is deadlier, more contagious, and resistant to vaccines, which is not the case with Omicron. Chart 3AOmicron Not A Major Setback For Recovery
Omicron Not A Major Setback For Recovery
Omicron Not A Major Setback For Recovery
The resilience of the US will come with persistent inflation in goods given that Omicron will still cause supply disruptions abroad. Not all countries have as effective vaccines when it comes to Omicron – if they maintain tighter social restrictions, prices of imported goods will continue to rise. The Fed cannot resolve foreign bottlenecks. While manufacturing surveys show bottlenecks easing from last year’s highs, foreign supply constraints will remain a problem throughout the year. Chart 3BOmicron Not A Major Setback For Recovery
Omicron Not A Major Setback For Recovery
Omicron Not A Major Setback For Recovery
Buy The Rumor, Sell The News Of “Build Back Better” The Biden administration and Democratic Party are still likely to pass one last blast of fiscal spending – the “Build Back Better” budget reconciliation act, a social welfare bill. The output gap is virtually closed and the economy does not need new demand stimulus. However, the Democratic Party needs a legislative win ahead of the midterm election. Thin majorities in both chambers of Congress enable a single senator to derail the bill. But the bill’s provisions are popular among political independents and especially the Democratic Party’s base, which is lacking in enthusiasm about the election as things stand (Charts 4A & 4B). Moderate Democrats in the Senate are still negotiating: their goal is to chop the plan down to size and pass only the most popular provisions, rather than to sink the president and their own party.
Chart 4
Chart 4
This means the bill’s top-line spending will be further reduced. The final size should fall from the earlier range of $2.5-$4.7 trillion to $2.3 trillion or less. Add a few tax hikes, like the minimum corporate tax, and the deficit impact will be around $600 billion (Table 1). Table 1"You’ve Gotta Pass It To See What’s In It"
Chart Pack: Gridlock Now
Chart Pack: Gridlock Now
Ultimately we cannot have high conviction on the BBB plan because we cannot predict what a single senator will do. That is a matter of intelligence, not macro analysis.
Chart 5
Chart 5
But subjectively we still give 65% odds that the Democratic Party will circle the wagons and pass the bill. The party views itself as surrounded by populism on both its right and left flanks – a failure to compromise will whet the appetites of both the Sanderistas (left-wing populists) and the Trumpists (right-wing populists) (Chart 5A). The Republicans still have a better position in the states, and the states have constitutional control of elections, so establishment Democrats are more terrified than usual of flopping in the midterm elections (Chart 5B). Otherwise the midterms – which are already likely to be bad for the Democrats – will deal a devastating blow. Republicans are recovering in party affiliation and tentatively surpassing Democrats among independent voters (Chart 6A). Biden and the Democrats lashed out at former President Trump and the Republican Party on the anniversary of the January 6, 2020 rebellion, but this tactic will not lift their popularity in polls. Their current polling is not much better than that of Republicans in 2018, when the latter suffered a bruising defeat in the midterms (Chart 6B). Chart 6ADemocrats Need A Win Before The Midterm
Democrats Need A Win Before The Midterm
Democrats Need A Win Before The Midterm
Chart 6
Biden’s legislation would reduce the fiscal drag marginally in fiscal year 2023 but overall the budget deficit will shrink and then lie flat over 2022-24 regardless of what Congress does (Chart 7). New spending would be marginally inflationary over the long run since the budget deficit is expected to expand again beyond fiscal year 2024.
Chart 7
Republicans will not be able to slash the budget until they control both Congress and the White House, but in that case they are likely to prove big spenders as in the past. Populism will persist on all sides: the political establishment will keep trying to use fiscal profligacy to peel voters away from populists, who are even more fiscally profligate. Only an inflation-induced recession will restore some fiscal discipline – and that is a way off. Ultimately the significance of the BBB bill is to verify whether establishment politicians – fiscal authorities – are capable of moderating their spending plans according to the threat of inflation, as Modern Monetary Theory maintains. Otherwise the implication is that polarization and populism will produce fiscal overshoots regardless of near-term inflation, even with the narrowest of possible majorities in Congress. The latter, a BBB fiscal overshoot, is what we expect. If it happens it will probably be received negatively by the equity market, fearing faster Fed rate hikes, and it would add credibility to long-term concerns about inflation, because it would reveal that fiscal authorities are not good at adjusting in real time. The former, a BBB failure and a halt to fiscal spending, would suggest that fiscal extravagance remains a crisis-era phenomenon and will be reined in by Congress after a crisis passes, which is probably positive for equities. It would at least suggest that fiscal authorities will adjust when the facts change. Of course, how investors respond to any legislative outcome will depend on a range of factors. But the takeaway is this: Inflation fears may or may not peak in the short run but they will persist over the long run. The Fed: Focus On The Framework In the wake of the Great Recession the Federal Reserve as an institution – both the Federal Open Market Committee and the Board of Governors – shifted in a more accommodative or dovish direction (Chart 8). The shift culminated in the review of monetary policy strategy in August 2020, which produced average inflation targeting.
Chart 8
In practice the dovish policy shift is apparent in a real Fed funds rate at -4%, the lowest level since the inflationary 1970s under Fed Chair Arthur Burns. But what is more remarkable is the simultaneous surge in the budget deficit, unlike anything since World War II, and unlike anything in peacetime (Chart 9). Chart 9Inflation And Stagflation Risks
Inflation And Stagflation Risks
Inflation And Stagflation Risks
The massive increase in federal debt, from 34% of GDP in 2000 to 75% before COVID-19 and 106% today, acts as a constraint on any future Fed hawkishness (Chart 10). A Fed chair who drives interest rates too high amid high debt levels will cause a recession and force the debt-to-GDP ratio up even higher. Yet the result of low rates is to stimulate indebtedness. While the private debt super cycle has subsided, a public debt super cycle is thriving. Chart 10A Major Check On Fed Hawkishness
A Major Check On Fed Hawkishness
A Major Check On Fed Hawkishness
This brings us to today’s predicament. The Fed’s criteria for raising interest rates have mostly been met: 12-month core PCE inflation is running at 4.7% while the inflation breakeven rate in the Treasury market suggests that inflation is well anchored and likely to persist above the 2% inflation target for some time (Chart 11A). The economy is virtually at “maximum employment” (Table 2) – the Fed has set aside concerns about low labor force participation to focus on the collapsing unemployment rate, which is now within the range at which it will feed inflation (Chart 11B). Chart 11AThe Fed's Criteria For Liftoff
The Fed's Criteria For Liftoff
The Fed's Criteria For Liftoff
Table 2The Fed’s Criteria For Liftoff
Chart Pack: Gridlock Now
Chart Pack: Gridlock Now
Chart 11BThe Fed's Criteria For Liftoff
The Fed's Criteria For Liftoff
The Fed's Criteria For Liftoff
The takeaway is that the Fed is suddenly restoring the credibility of its 2% inflation target, with headline PCE rapidly coming up on the trajectory established in the wake of the Great Recession (Chart 12), as our US bond strategist Ryan Swift has demonstrated. Chart 12Lo And Behold: Debt Monetization Generates Inflation
Lo And Behold: Debt Monetization Generates Inflation
Lo And Behold: Debt Monetization Generates Inflation
The explosion of fiscal spending played a critical role in generating this new trajectory. The combination of monetary and fiscal accommodation has worked wonders. Assuming the BBB passes, Chairman Powell will face even greater pressure to prevent this correction of the inflation trajectory from overshooting and turning into a wage-price spiral. The unexpected risk would be if the BBB bill fails, the Fed hikes aggressively, global growth sputters, the dollar surges, and Republicans retake Congress — then Powell may yet see disinflationary challenges in his term in office. Our sense is that the BBB will pass, reinforcing Powell’s less dovish pivot, and yet the Fed’s framework will not permit too hawkish of a stance, resulting in persistent inflation risks over the long run. Three Strategic Themes In our annual strategic outlook, we highlighted three structural or strategic themes that are not beholden to the 12-month forecasting period: 1. Rise Of Millennials And Generation Z: The sharp drop in labor force participation will gradually mend in the wake of the crisis but the aging of the population ensures that the general trend will decline over time as the dependency ratio rises (Chart 13A). Chart 13AStrategic Theme #1: Rise Of Millennials/Gen Z
Strategic Theme #1: Rise Of Millennials/Gen Z
Strategic Theme #1: Rise Of Millennials/Gen Z
Chart 13
Politically the millennials and younger generations are gaining clout over time, although their partisan identity will also evolve as they mature and gain a greater stake in the economy and become asset owners (Chart 13B). 2. Peak Polarization: US political polarization stands at historic highs and will likely remain so over the 2022-24 political cycle (Chart 14A). Polarization coincides with the transformation of society amid falling bond yields and technological revolution (Chart 14B). Chart 14AStrategic Theme #2: Peak Polarization
Strategic Theme #2: Peak Polarization
Strategic Theme #2: Peak Polarization
Chart 14BStrategic Theme #2: Peak Polarization
Strategic Theme #2: Peak Polarization
Strategic Theme #2: Peak Polarization
The pandemic era has been especially polarized due to the 2020 election and controversies over vaccination (Chart 15).
Chart 15
Domestic terrorism of whatever stripe is possible (Chart 16). But any historic incidents will generate a majority opposed to political violence. Chart 16Risk Of Domestic Terrorism
Risk Of Domestic Terrorism
Risk Of Domestic Terrorism
True, former President Trump is still likely to run on the Republican ticket, which will ensure that polarization remains elevated (Diagram 1). However, US elections hinge on structural factors, not individuals. Diagram 1GOP 2024 Is Up To Trump
Chart Pack: Gridlock Now
Chart Pack: Gridlock Now
So far structural factors point to policy continuity: not only are Democrats still slated to retain the White House, but President Biden has coopted many of Trump’s key policies, including infrastructure, protectionism, and big budget deficits (Chart 17). If Democrats falter, Trump’s policies will be reaffirmed. The implication is that a new national policy consensus is taking shape beneath the surface.
Chart 17
3. Limited “Big Government”: Americans have been turning away from “small government” and toward “big government” since the 1990s. Voters no longer worry so much about budget discipline and instead look for the “visible hand” of government to support the economy (Charts 18A & 18B).
Chart 18
Chart 18
Both domestic populism and geopolitical challenges encourage this shift. Industrial policy and domestic manufacturing are making a comeback (Table 3). Table 3Strategic Theme #3: Limited “Big Government”
Chart Pack: Gridlock Now
Chart Pack: Gridlock Now
With extremely robust fiscal policy, the US has avoided the policy mistake of the period after the Global Financial Crisis, when premature fiscal tightening undermined the economic recovery (Chart 19). Policy uncertainty will increase as gridlock returns to Congress and fiscal policy will be frozen. But investors need not fear a slide back into deflation. The Republican Party’s populist base may prevent more Democratic social spending but they will not be able to repeal what is done. Chart 19Even With Looming Gridlock, The US Is Far From Tightening Fiscal Policy Too Soon This Time
Even With Looming Gridlock, The US Is Far From Tightening Fiscal Policy Too Soon This Time
Even With Looming Gridlock, The US Is Far From Tightening Fiscal Policy Too Soon This Time
Three Key Views For 2022 The key views for the 12-month period are connected with the above but of a more short-term or cyclical duration: 1. From Single-Party Rule To Gridlock: Republicans are highly likely to win back control of the House of Representatives and likely the Senate (Charts 20A & 20B). President Biden’s approval rating suggests that Democrats could lose 40 seats in the House (Chart 21) and three in the Senate (Chart 22), whereas they only need to lose five and one to lose control. Our quantitative Senate election model shows an even split but the model’s trend favors Republicans, as does the political cycle and partisan enthusiasm (Chart 23).
Chart 20
Chart 20
Chart 21
Chart 22
Chart 23
2. From Legislative To Executive Power: Biden may still pass one more spending bill but otherwise the legislature will be frozen. Democrats will not succeed in ramming legislation through by abolishing the Senate filibuster. Biden will turn to executive decree, where he is already on track to make a historic increase in regulation, which will increase concerns among small business (Chart 24A & Chart 24B). Anti-trust laws are unlikely to be overhauled and Democrats will struggle to bring back the tough anti-trust posture of the 1900s-1950s without new legislation, meaning that Big Tech faces a bigger threat from inflation than regulation (Table 4). The green transition will continue but primarily in the form of any subsidies passed in the reconciliation bill, rather than new taxes or any carbon pricing scheme (Chart 25A & Chart 25B). Chart 24AKey View #2: From Legislative To Executive Power
Key View #2: From Legislative To Executive Power
Key View #2: From Legislative To Executive Power
Chart 24
Table 4Key View #2: From Legislative To Executive Power
Chart Pack: Gridlock Now
Chart Pack: Gridlock Now
Chart 25
Chart 25BGreen Energy: Subsidies But No Carbon Tax
Green Energy: Subsidies But No Carbon Tax
Green Energy: Subsidies But No Carbon Tax
3. From Domestic To Foreign Policy Risks: Biden faces a slew of foreign policy and external risks that could damage the Democrats in the midterms. The surge in illegal immigration on the southern border is truly historic and will have significant policy ramifications over the long run (Chart 26A & Chart 26B). The surge in inflation will force Biden to contend with foreign policy challenges with one hand tied behind his back, since energy supply disruptions could derail his party ahead of the midterm election (Chart 27). While Biden could ease some inflationary pressure via reduced trade tariffs, protectionist impulses will prevail during an election year (Chart 28). Chart 26AKey View #3: External Risks For Biden
Key View #3: External Risks For Biden
Key View #3: External Risks For Biden
Chart 26BKey View #3: External Risks For Biden
Key View #3: External Risks For Biden
Key View #3: External Risks For Biden
Chart 27Foreign Policy Could Hit Prices At Pump
Foreign Policy Could Hit Prices At Pump
Foreign Policy Could Hit Prices At Pump
Chart 28Tariff Relief In 2022? Don't Bet On It
Tariff Relief In 2022? Don't Bet On It
Tariff Relief In 2022? Don't Bet On It
Investment Takeaways The stock market tends to be flat, with risks skewed to the downside, during midterm election years due to policy uncertainty. The same is true for bond yields (Chart 29). Chart 29Stocks And Bond Yields Trend Lower Before Midterms ...
Stocks And Bond Yields Trend Lower Before Midterms ...
Stocks And Bond Yields Trend Lower Before Midterms ...
When united or single-party governments approach midterms, stocks tend to perform worse than for divided governments in midterm years, while bond yields tend to be a bit higher (Chart 30). This trend is supercharged in 2022 due to the inflationary effects of the pandemic. Chart 30... But United Govts See Higher Bond Yields And Weaker Stocks ...
... But United Govts See Higher Bond Yields And Weaker Stocks ...
... But United Govts See Higher Bond Yields And Weaker Stocks ...
Assuming Republicans regain at least the House, the US will transition from united to divided government (gridlock). In previous such transitions, stocks tend to perform in line with the average for a midterm election year, but bond yields skew higher – reinforcing the previous point (Chart 31). Chart 31... Shift From United To Divided Govt Implies Higher Bond Yields Than Otherwise
... Shift From United To Divided Govt Implies Higher Bond Yields Than Otherwise
... Shift From United To Divided Govt Implies Higher Bond Yields Than Otherwise
We will update our US Sector Political Risk Matrix to bring it better into line with our views, particularly in light of Table 5 below regarding sector relative performance during midterm election years. Normally defensives and growth stocks outperform in midterm years, Table 5ConDisc, Tech, Health Do Best During Midterms …But Waning Pandemic Makes An Exception
Chart Pack: Gridlock Now
Chart Pack: Gridlock Now
while cyclicals and value stocks underperform, but 2022 looks to be different due to inflation. Still over the course of the year we would expect the historic trend to reassert itself. Investors should favor cyclicals even though they probably cannot outperform defensives for much longer (Chart 32A). We recommend health care stocks as a hedge given that the dollar should still be resilient this year, Fed hikes should moderate inflation expectations, and midterm policy uncertainty will eventually weigh on risk appetite (Chart 32B). Chart 32AFavor Cyclicals, Though They May Not Outperform Defensives Much Longer
Favor Cyclicals, Though They May Not Outperform Defensives Much Longer
Favor Cyclicals, Though They May Not Outperform Defensives Much Longer
Chart 32BLong Health Care As Hedge
Long Health Care As Hedge
Long Health Care As Hedge
Value stocks are forming a bottom relative to growth stocks, although this trend is less clear in the US, especially among US large caps, than it is abroad (Chart 33). We favor value over growth on a cyclical basis but midterm election uncertainties will pull the other way, making for a choppy bottom. Chart 33Favor Value And Small Caps, Though Bottom Formation Remains Choppy
Favor Value And Small Caps, Though Bottom Formation Remains Choppy
Favor Value And Small Caps, Though Bottom Formation Remains Choppy
The same process is visible on a sector basis, where energy and materials continue to outperform tech (Chart 34A). We recommend staying long energy on a cyclical basis, though its outperformance against tech could abate later in 2022. Infrastructure stocks – such as building and construction materials – also continue to outperform. Since Biden’s honeymoon period ended, the outperformance is largely relative to tech rather than the S&P as a whole. We still favor infrastructure stocks as the fiscal policy theme will continue even beyond the current legislation, which will barely start to be implemented in 2022 (Chart 34B). Chart 34AFavor Energy, Materials, And Infrastructure Versus Tech
Favor Energy, Materials, And Infrastructure Versus Tech
Favor Energy, Materials, And Infrastructure Versus Tech
Chart 34BFavor Energy, Materials, And Infrastructure Versus Tech
Favor Energy, Materials, And Infrastructure Versus Tech
Favor Energy, Materials, And Infrastructure Versus Tech
Matt Gertken Vice President Geopolitical Strategy mattg@bcaresearch.com Strategic View Open Tactical Positions (0-6 Months) Open Cyclical Recommendations (6-18 Months)
Image
Image
Image
Image
Image
Image
Image
Highlights 2022 Key Views & Allocations: Translating our 2022 global fixed income Key Views into recommended positioning within our model bond portfolio results in the following conclusions to begin the year. Target a moderate level of overall portfolio risk, maintain below-benchmark overall duration exposure, make developed market government bond country allocations based on relative expected central bank hawkishness (underweight the US, UK and Canada; overweight Germany, France, Italy, Australia, Japan), and be selective on allocations to global spread product (overweight high-yield with a bias toward Europe over the US, neutral global investment grade, underweight emerging market hard currency debt). Specific Allocation Changes: Much of the current positioning in our model bond portfolio already reflects our 2022 investment themes. The only significant changes we make to begin the year are reducing emerging market USD-denominated corporate bond exposure to underweight, and shifting some high-yield corporate bond exposure from the US to Europe. Feature In our last report of 2021, we published our 2022 Key Views, outlining the themes and investment implications of the 2022 BCA Outlook for global fixed income markets. In this report, our first of the new year, we translate those views into more specific recommendations and allocations within the BCA Research Global Fixed Income Strategy model bond portfolio. The main takeaways are that another year of expected above-trend global growth, even after the risks to start the year from the Omicron variant, will further absorb spare capacity across the developed economies. Realized inflation will slow from the elevated readings of 2021, but will remain high enough to force central banks – led by the US Federal Reserve – to incrementally remove highly accommodative monetary policies put in place during the pandemic. The backdrop for global bond markets will turn far less friendly as a result, with higher bond yields (led by US Treasuries), flatter yield curves and much weaker returns on spread products that have benefited from easy monetary policies like investment grade corporate debt and emerging market (EM) hard currency debt. Against this challenging backdrop for overall fixed income returns, bond investors will need to focus more on relative exposures between countries, sectors and credit ratings to generate outperformance versus benchmarks. Our recommended portfolio allocations to begin 2022 reflect that shift (Table 1). Table 1GFIS Model Bond Portfolio Recommended Positioning For The Next Six Months
Our Model Bond Portfolio Strategy To Begin 2022: Choosing Our Battles Wisely
Our Model Bond Portfolio Strategy To Begin 2022: Choosing Our Battles Wisely
A Review Of The Model Bond Portfolio Performance In 2021 Chart 12021 Performance: A Positive, Yet Volatile, Year
2021 Performance: A Positive, Yet Volatile, Year
2021 Performance: A Positive, Yet Volatile, Year
Before we begin our discussion of the model bond portfolio for 2022, we will take a final look back at the performance of the portfolio in 2021. Last year, the model bond portfolio delivered a small negative total return (hedged into US dollars) of -0.51%, but this still outperformed its custom benchmark index by +36bps (Chart 1).1 It was a very challenging year for global fixed income markets, in aggregate, with significant swings in bond yields (i.e. US Treasuries were up in Q1, down in Q2/Q3, up then down in Q4) and credit spreads (US high-yield spreads fell in H1/2021 and were rangebound in H2/2021, while EM hard currency spreads were stable in H1/2021 before steadily widening during the rest of the year). Over the full year, the government bond portion of the portfolio outperformed the custom benchmark index by +27bps while the spread product segment outperformed by +9bps (Table 2). The bulk of that government bond outperformance occurred during the first quarter of the year when global bond yields surged higher as COVID-19 vaccines began to be distributed and economic optimism improved in response – trends that benefited the below-benchmark duration tilt within the portfolio. The credit market outperformance was more evenly spread out during the final nine months of the year. Table 2GFIS Model Bond Portfolio Full Year 2021 Overall Return Attribution
Our Model Bond Portfolio Strategy To Begin 2022: Choosing Our Battles Wisely
Our Model Bond Portfolio Strategy To Begin 2022: Choosing Our Battles Wisely
In terms of specific country exposures on government debt (Chart 2), our underweight stance on US Treasuries (both in allocation and duration exposure) generated virtually all of the full-year outperformance of the government bond portion of the portfolio (+38bps versus the benchmark). The biggest underperformer was the UK (-9bps), concentrated at the very end of the year as Gilt yields declined on the back of the Omicron surge, to the detriment of our underweight stance. All other country allocations provided little excess return, in aggregate, over the full year in 2021 – although there was significant variance of those returns during the year.
Chart 2
Within spread product (Chart 3), the biggest gains were seen in US high-yield (+19bps) where we remained overweight throughout 2021. The largest drag on performance came from UK investment grade corporates (-9bps), although this all came in Q1/2021 where we maintained an overweight stance at the time and spreads widened. Other spread product sectors delivered little in the way of excess return, although that should not be a surprise as we maintained a neutral stance on US and euro area investment grade corporates – which have a combined 18% weighting within the model bond portfolio custom benchmark index – throughout 2021.
Chart 3
In the end, our recommended portfolio tilts during 2021 were generally on the right side of the market, with our overweights outperforming in an overall down year for bond returns (Chart 4). The numbers would have been even better without the drag on performance in the fourth quarter (-17bps for the entire portfolio). That came entirely from our two biggest government bond underweights – US Treasuries and UK Gilts – which saw significant bond yield declines in response to the emergence of the Omicron variant. (the detailed breakdown of the Q4/2021 performance can be found in the Appendix on pages 19-23).
Chart 4
Importantly, the surge in bond yields seen in the first week of 2022 has already resulted in a full recovery of that Q4/2021 underperformance, providing a good start to the new year for our model portfolio. Top-Down Bond Market Implications Of Our Key Views We now present the specific fixed income investment recommendations that derive from those themes, described along the following lines: overall portfolio risk, overall duration exposure, country allocations within government bonds, yield curve allocations within countries, and corporate credit allocations by country and credit rating. Overall Portfolio Duration Exposure: BELOW BENCHMARK As we concluded in our 2022 Key Views report, longer-maturity government bond yields are now too low given the mix of very high inflation and very low unemployment seen in many countries. While we expect inflation to come down this year from the very rapid pace of 2021, it will not be by enough to force central banks off the path towards rate hikes that already began at the end of last year in places like the UK and New Zealand. The Fed is now signaling that multiple US rate hikes are likely in 2022, while even some European Central Bank (ECB) officials are expressing concern over very high European inflation. Longer maturity bond yields remain too low, in our view, because investors are discounting very low terminal rates – the peak level of policy rates to be reached in the next monetary tightening cycle. (Chart 5). An upward adjustment of global interest rate expectations is likely this year as central banks like the Fed and the Bank of England (BoE) deliver on expected rate hikes, with more tightening necessary beyond 2022. This will be the primary driver of the rise in global bond yields that we expect this year - an outcome that has already begun in the first week of 2022. Chart 5Global Government Bond Yields Vulnerable To Hawkish Repricing
Global Government Bond Yields Vulnerable To Hawkish Repricing
Global Government Bond Yields Vulnerable To Hawkish Repricing
Chart 6Staying Below-Benchmark On Overall Duration Exposure
Staying Below-Benchmark On Overall Duration Exposure
Staying Below-Benchmark On Overall Duration Exposure
We ended 2021 with a model bond portfolio duration that was -0.65 years below that of the custom performance benchmark (Chart 6). We feel comfortable maintaining that position, in that size, to begin the new year. Government Bond Country Allocation: OVERWEIGHT THE EURO AREA (CORE & PERIPHERY), JAPAN & AUSTRALIA; UNDERWEIGHT THE US, UK & CANADA Our country allocation decisions within our model bond portfolio entering 2022 are based on a simple framework. We are overweighting countries where central banks are less likely to raise rates this year, and vice versa. We expect the largest increase in developed market bond yields in 2022 to occur in the US, as markets are still not priced for the cumulative tightening that the Fed will likely deliver over the next couple of years. Markets are also underpricing how much the Bank of England and Bank of Canada will need to raise rates over the full tightening cycle, even with multiple hikes discounted for 2022. We see the necessary upward repricing of post-2022 rate expectations in all three of those countries – the US, UK and Canada – justifying underweight allocations in our model portfolio. Chart 7Our Recommended DM Government Bond Allocations To Start 2022
Our Recommended DM Government Bond Allocations To Start 2022
Our Recommended DM Government Bond Allocations To Start 2022
The opposite is true in core Europe and Australia. Overnight index swap (OIS) curves are discounting multiple rate hikes this year from the Reserve Bank of Australia (RBA) and even an ECB rate hike later in 2022. As we discussed in our Key Views report, there is still not enough evidence pointing to rapid wage growth in Australia or Europe that would force the RBA and ECB to turn more hawkish than their current forward guidance which calls for no rate hikes in 2022. While both central banks may talk about the possibility that monetary policy will need to be tightened, we expect the actual rate hikes to occur in 2023 and not 2022. Thus, both markets justify overweight allocations in our model bond portfolio. We are also maintaining an overweight to Japanese government bonds, as Japanese inflation remains far too low – even in an environment of high energy prices and global supply chain disruption – for the Bank of Japan to contemplate any tightening of monetary policy. The country allocations within the model portfolio as of the end of 2021 all fit with the above analysis, thus we see no major changes that need to be made to begin 2022 (Chart 7).2 The only significant move made was to slightly bump up the size of the overweights in Italy and Spain, to be funded by the reduction in EM corporate bond exposure (as we discuss below). We continue to see a positive case for owning Peripheral European government bonds for the relatively high yields within Europe, with the ECB maintaining an overall dovish policy stance in 2022 even as it scales back the size of its bond buying activity starting in March. Inflation-Linked Bond Allocations: MAINTAIN A NEUTRAL OVERALL ALLOCATION TO GLOBAL LINKERS Chart 8Our Recommended Inflation-Linked Bond Allocations To Start 2022
Our Recommended Inflation-Linked Bond Allocations To Start 2022
Our Recommended Inflation-Linked Bond Allocations To Start 2022
Inflation-linked bonds have been a necessary part of bond investors' portfolios since the lows in global inflation breakeven spreads were seen in mid-2020. Now, with inflation expectations at or above central bank inflation targets in most developed market countries, and with realized inflation likely to subside from current levels this year, the backdrop no longer justifies structural overweights to linkers across all countries. We are sticking with our end-2021 overall neutral allocation to global inflation-linked bonds, focusing more on country allocations based on our inflation breakeven valuation indicators, as discussed in our 2022 Key Views report (Chart 8). This means maintaining a neutral stance on US TIPS and linkers (vs. nominal government bonds) in Canada, Australia and Japan. We are also staying with underweight positions in linkers (vs. nominals) in the UK, Germany, France and Italy where breakevens appear too high based on our indicators. Spread Product Allocation: MAINTAIN A SMALL OVERWEIGHT TO GLOBAL SPREAD PRODUCT FOCUSED ON EUROPEAN & US HIGH-YIELD CORPORATES, WHILE UNDERWEIGHTING EM CREDIT Chart 9Negative Real Yields: Global Bonds' Biggest Vulnerability
Negative Real Yields: Global Bonds' Biggest Vulnerability
Negative Real Yields: Global Bonds' Biggest Vulnerability
Our expectation of above-trend global growth in 2022, with still relatively high inflation (compared to pre-pandemic levels), should be positive for spread products like corporate bonds that benefit from strong nominal economic (and revenue) growth. However, the less accommodative global monetary policy backdrop we also expect is a potential negative for credit market performance - specially as rate hikes put upward pressure on deeply negative real interest rates, most notably in the US (Chart 9). Thus, we are entering 2022 with a cautious, but still positive, overall position on spread product in our model bond portfolio. We are focusing more on credit valuation, however - both in absolute terms and between countries and sectors – to try and generate outperformance for the credit portion of the portfolio. We are maintaining a neutral stance on investment grade corporates in the US, euro area and UK given the tight spread valuations in those markets. We prefer to focus our corporate credit exposure on overweights to high-yield bonds in the US and Europe, but with a marginal preference for European junk bonds over US equivalents as we discussed in our 2022 Key Views report (Chart 10). Within EM USD-denominated credit, we remain cautious entering 2022 given the poor fundamental backdrop for EM credit: slowing momentum of Chinese economic growth and global commodity prices, a firmer US dollar, and a less-accommodative global monetary policy backdrop (Chart 11). Thus, an underweight stance on EM credit is appropriate within the portfolio to start the year. Chart 10Increase Euro High-Yield Exposure Vs US High-Yield
Increase Euro High-Yield Exposure Vs US High-Yield
Increase Euro High-Yield Exposure Vs US High-Yield
Chart 11Reduce EM USD-Denominated Corporate Debt Exposure To Underweight
Reduce EM USD-Denominated Corporate Debt Exposure To Underweight
Reduce EM USD-Denominated Corporate Debt Exposure To Underweight
Chart 12
Finally, we are entering 2022 with the same relative tilt within US mortgage-backed securities (MBS) that we maintained during the latter half of 2021, with an overweight stance on agency commercial MBS and an underweight on agency residential MBS. Based on our outlook for 2022, we are immediately making two marginal changes to the spread product allocations to the model bond portfolio: Reducing the size of our US high-yield overweight and using the proceeds to increase the size of the European high-yield overweight Reducing our EM USD-denominated corporate bond allocation to underweight from neutral, and placing the proceeds into Italian and Spanish government bonds (hedged into USD) to limit the reduction in the portfolio yield from the EM downgrade. The above moves will lower our overall credit overweight versus government bonds from 5% to 4%, all coming from the EM to Italy/Spain switch (Chart 12). Overall Portfolio Risk: MODERATE The changes made to our spread product allocations had no material impact on the estimated tracking error of the model portfolio – the relative volatility versus that of the benchmark. The tracking error is 78bps, still below our self-imposed limit of 100bps but above the lows seen in early 2021 (Chart 13). That higher tracking error is likely related to our underweight stance on US Treasuries, given the rise in bond volatility evident in measures like the MOVE index (bottom panel). Nonetheless, a moderate level of portfolio risk is reasonable given the combination of solid global economic growth, but with tighter global monetary policy, that we expect in 2022. Chart 13Keeping Overall Portfolio Risk At Moderate Levels
Keeping Overall Portfolio Risk At Moderate Levels
Keeping Overall Portfolio Risk At Moderate Levels
Chart 14Positive Portfolio Carry Via Selective Spread Product Overweights
Positive Portfolio Carry Via Selective Spread Product Overweights
Positive Portfolio Carry Via Selective Spread Product Overweights
The overweights to US high-yield, European high-yield and Italian government bonds all contribute to the model bond portfolio having a yield that begins 2022 modestly higher (+14bps) than that of the benchmark index (Chart 14). Portfolio Scenario Analysis For The Next Six Months After making all the changes to our model portfolio allocations, which can be seen in the tables on pages 24-25, we now turn to our regular quarterly scenario analysis to determine the return expectations for the portfolio during the first half of 2022. On the credit side of the portfolio, we use risk-factor-based regression models to forecast future yield changes for global spread product sectors as a function of four major factors - the VIX, oil prices, the US dollar and the fed funds rate (Table 2A). For the government bond side of the portfolio, we avoid using regression models and instead use a yield-beta driven framework, taking forecasts for changes in US Treasury yields and translating those in changes in non-US bond yields by applying a historical yield beta (Table 2B).
Chart
Chart
For our scenario analysis over the next six months, we use a base case scenario plus two alternate “tail risk” scenarios, based on the following descriptions and inputs: Base Case Omicron related economic weakness is visible in some major economies (euro area, Canada), but the US stays resiliently strong and the US labor market continues to tighten. China is a growth laggard, but this will lead to policymakers providing more macro stimulus (credit, monetary, fiscal) starting in Q2/2022. Inflation pressures from supply chain disruption remain stubbornly strong and realized global inflation rates stay elevated for longer. Developed market central banks continue dialing back pandemic-era monetary policy accommodation, led by Fed tapering and a June 2022 liftoff of the funds rate. There is a mild initial bear steepening of the US Treasury curve with additional widening of US inflation breakevens in Q1/2022, leading to bear flattening in Q2 in the run-up to liftoff – the net effect is a parallel shift higher in the entire yield curve. The VIX index stays near current levels at 20, both the US dollar and oil prices are broadly unchanged and the fed funds rate is increased to 0.25%. Hawkish Fed The Omicron wave is short-lived with limited impact on global growth, which remains well above trend. Global inflation only declines moderately from current elevated levels, both from persistent supply squeezes and faster wage growth. China loosens monetary/credit policies and announces new fiscal stimulus in late Q1/2022 – a positive surprise for global growth expectations. Developed economy central banks turn even more hawkish. Fed liftoff is in March, with another hike in June. The US Treasury curve bear-flattens as US inflation breakevens reach their cyclical peak. The VIX index climbs to 25, the US dollar depreciates by -3% (pulled in opposing directions by strong global growth but relatively higher US interest rates), oil prices climb +10% and the fed funds rate is increased to 0.5%. Pessimistic Scenario The Omicron wave persists in many major countries (including the US) and leads to extended lockdowns and weaker consumer spending. Global growth momentum slows sharply. China does not signal adequate stimulus to offset its slowdown, while a weakened Biden administration passes much smaller US fiscal stimulus. Supply chain disruptions persist and are made worse by Omicron, keeping inflation elevated even as growth slows (stagflation). Developed economy central banks, stuck between slowing growth and elevated inflation, are unable to ease in response to economic weakness. The Fed goes for a slower taper that still ends in June, but liftoff is delayed until at least September. The US Treasury curve bull steepens modestly as the front end prices out 2022 hikes. US inflation breakevens remain sticky due to persistent realized inflation. The VIX index climbs to 30, the US dollar appreciates by +5% on a safe haven bid, oil prices fall -10% and the fed funds rate remains at 0%. The excess return scenarios for the model bond portfolio, using the above inputs in our simple quantitative return forecast framework, are shown in Table 3A. The US Treasury yield assumptions are shown in Table 3B. For the more visually inclined, we present charts showing the model inputs and Treasury yield projections in Chart 15 and Chart 16, respectively.
Chart
Chart
Chart 15Risk Factor Assumptions For The Scenario Analysis
Risk Factor Assumptions For The Scenario Analysis
Risk Factor Assumptions For The Scenario Analysis
Chart 16US Treasury Yield Assumptions For The Scenario Analysis
US Treasury Yield Assumptions For The Scenario Analysis
US Treasury Yield Assumptions For The Scenario Analysis
The model bond portfolio is expected to deliver an excess return over its performance benchmark during the next six months of +54bps in the Base Case and +31bps in the Hawkish Fed scenario, but is projected to underperform by -9bps in the Pessimistic scenario. Importantly, there is virtually no expected excess return from the credit side of model bond portfolio in the Hawkish Fed scenario, even with strong global growth. A faster-than-expected pace of Fed rate hikes in the first half of 2022 would be a clear signal to downgrade exposure to the riskier parts of the fixed income universe like US high-yield. Although in that Hawkish Fed scenario, greater-than-expected China stimulus and a weaker US dollar would also represent signals to begin adding back emerging market credit exposure. Robert Robis, CFA Chief Fixed Income Strategist rrobis@bcaresearch.com Footnotes 1 Our model bond portfolio custom benchmark index is the Bloomberg Barclays Global Aggregate Index, but with allocations to global high-yield corporate debt and USD-denominated emerging market debt replacing very high quality spread product (i.e. AA-rated). We believe this to be more indicative of the typical internal benchmark used by global multi-sector fixed income managers. 2 We also made very slight adjustments within the US, Japan, Germany and France allocations to refine our allocations across the various maturity buckets while keeping the overall portfolio duration unchanged entering 2022. Appendix
Image
Image
Image
Image
Image
Recommendations Duration Regional Allocation Spread Product Tactical Trades GFIS Model Bond Portfolio Recommended Positioning Active Duration Contribution: GFIS Recommended Portfolio Vs. Custom Performance Benchmark
Image
The GFIS Recommended Portfolio Vs. The Custom Benchmark Index
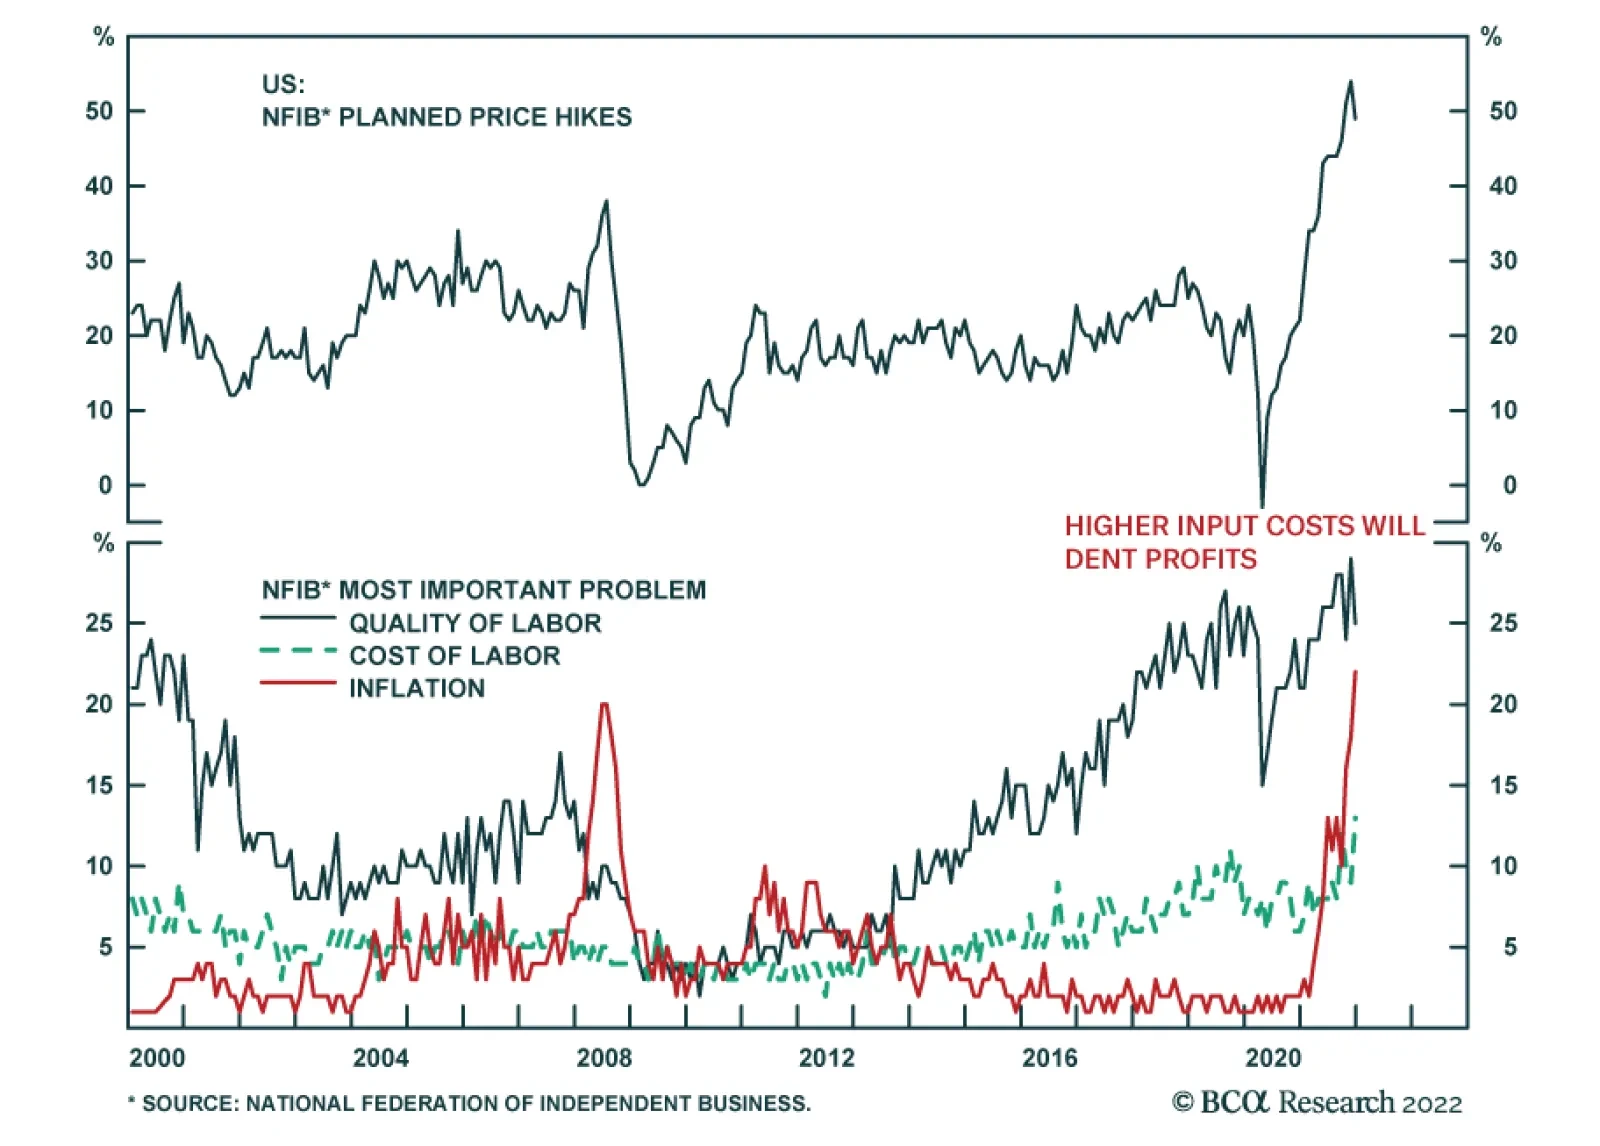
The US NFIB Small Business Optimism Index inched up to 98.9 in December from 98.4, slightly above expectations of a 0.3 point increase. The percent of small business owners who said that they had raised selling prices declined slightly to a net 57% from…
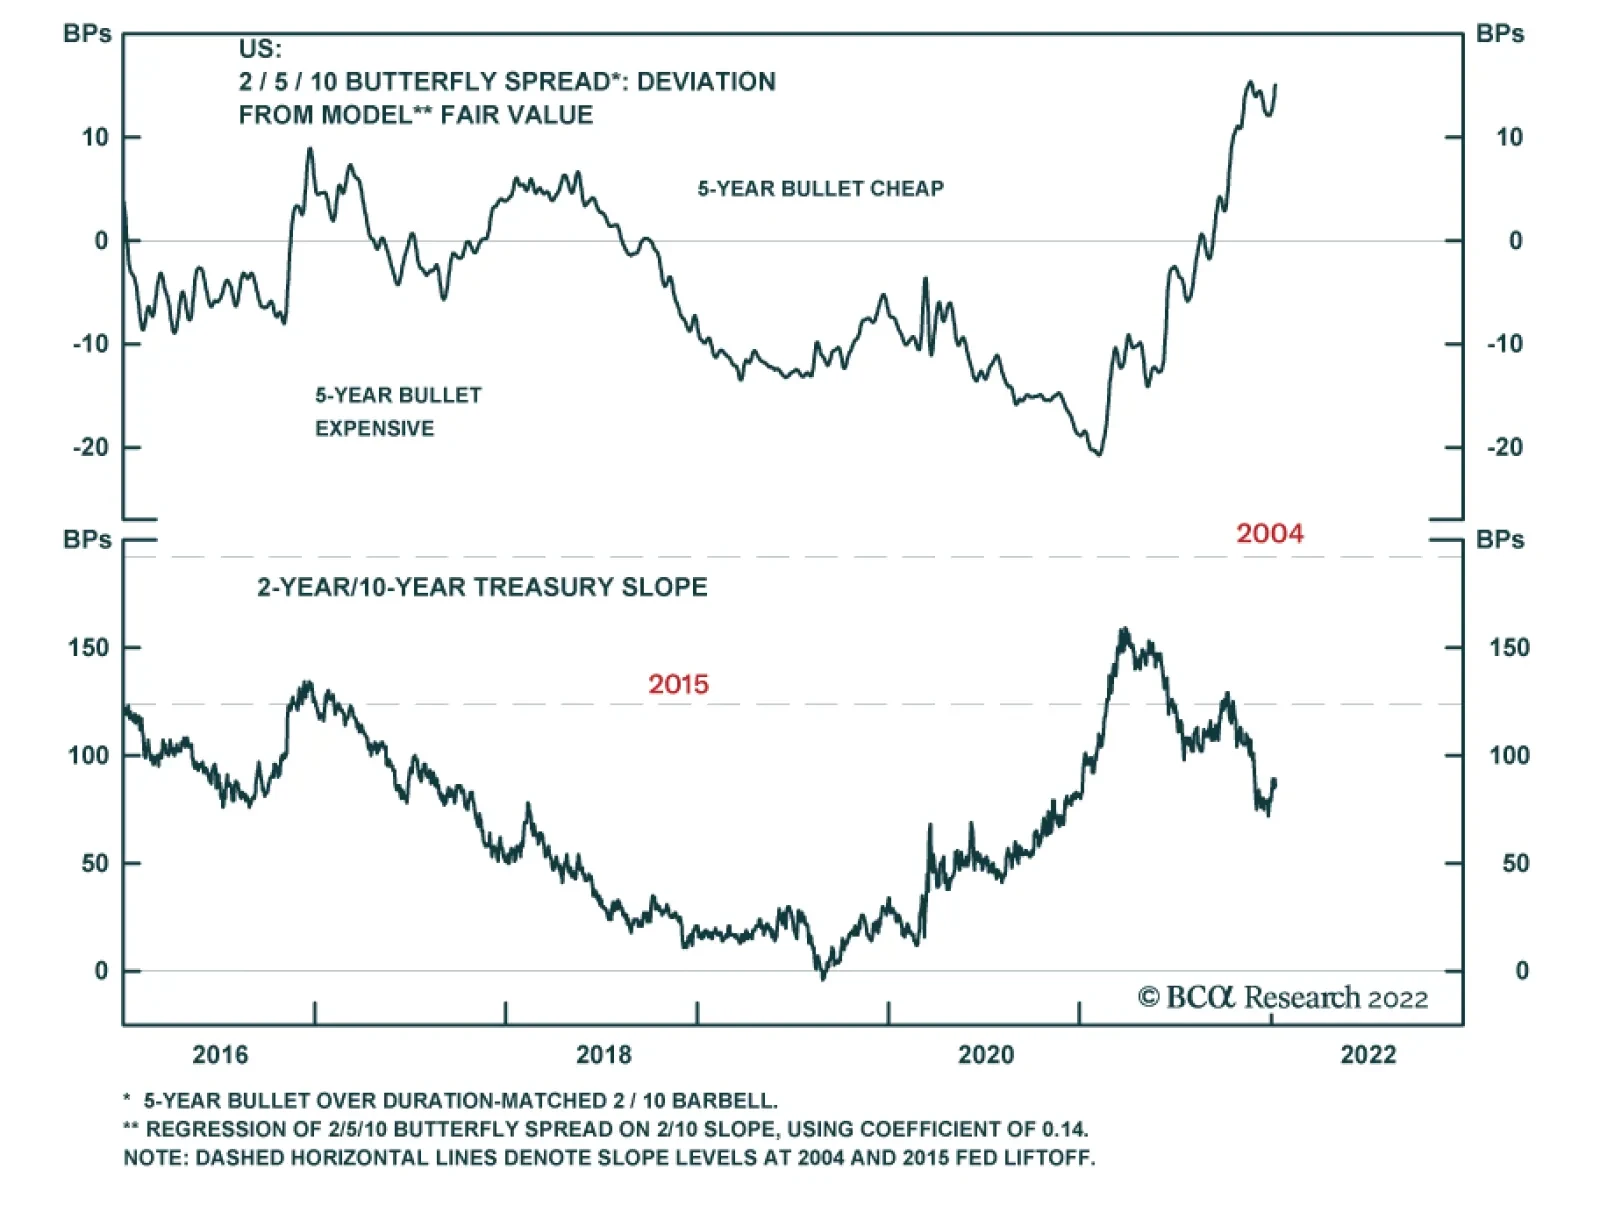
BCA Research’s US Bond Strategy service recommends buying the 2-year bullet versus a duration-matched cash/10 barbell. The 5-year/5-year forward Treasury yield is rising but it is still only at the low-end of survey estimates of the long-run neutral fed…
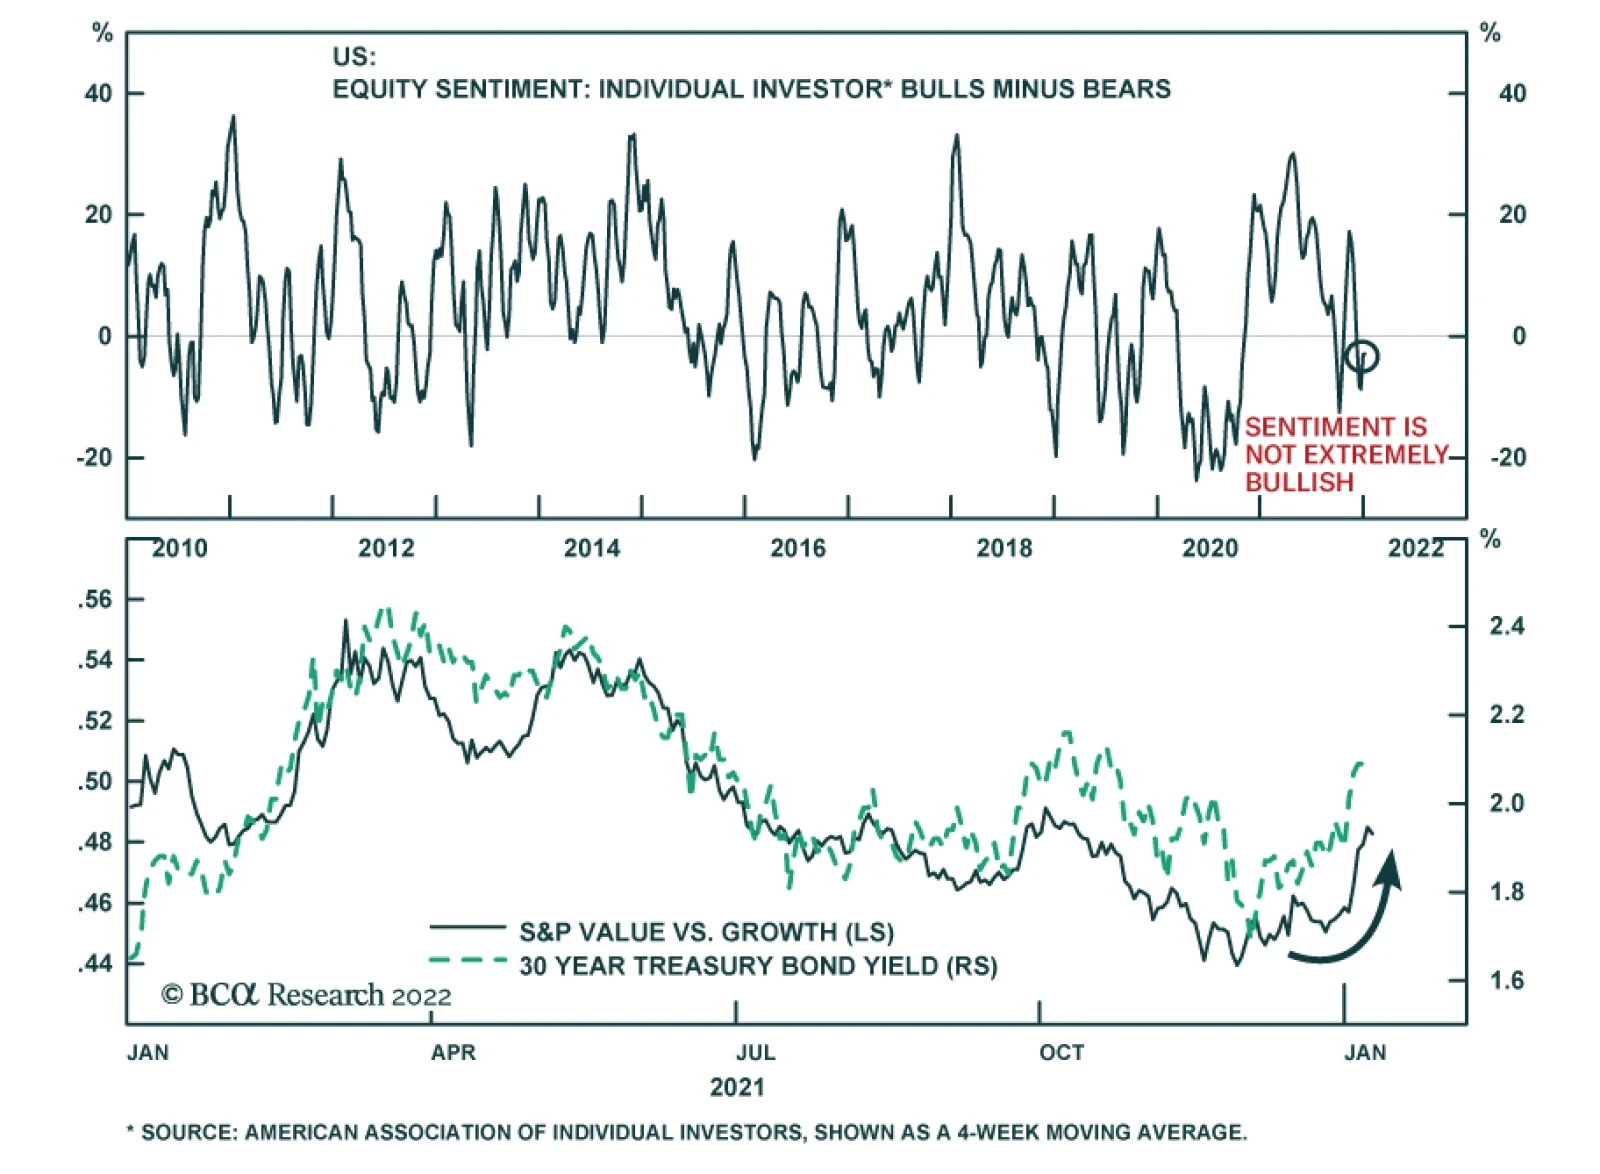
Ultra stimulative policies at the onset of the pandemic supported the impressive rally in equities. However, equity market breadth has been deteriorating since early last year which indicates that fewer and fewer stocks are participating in the rally. The…
Highlights Chart 1Stick With Steepeners
Stick With Steepeners
Stick With Steepeners
The new year promises to be one of Fed tightening. The minutes from the December FOMC meeting reinforced the notion that rate hikes will begin as early as March and the market is now priced for 85 bps of rate increases (between 3 and 4 hikes) by the end of 2022. The long-end of the curve has responded to the hawkishness with the 10-year Treasury yield moving above its previous post-pandemic high of 1.74%. Just as interesting, however, is that the 5-year/5-year forward Treasury yield has only just climbed back to the lower-end of the range of neutral fed funds rate estimates (Chart 1). This has implications for our preferred yield curve positioning. With the 5-year/5-year forward yield still below our target, it makes sense to position for a bear-steepening of the Treasury curve. A shift from steepeners to flatteners will be warranted once the 5-year/5-year is more consistent with survey estimates of the neutral rate. For now, we recommend keeping portfolio duration low and owning 2/10 Treasury curve steepeners (long 2-year, short cash/10 barbell). Feature Table 1Recommended Portfolio Specification
Prepare For Liftoff
Prepare For Liftoff
Table 2Fixed Income Sector Performance
Prepare For Liftoff
Prepare For Liftoff
Investment Grade: Neutral Chart 2Investment Grade Market Overview
Investment Grade Market Overview
Investment Grade Market Overview
Investment grade corporate bonds outperformed the duration-equivalent Treasury index by 60 basis points in December and by 162 bps in 2021. The index option-adjusted spread tightened 7 bps on the month and our quality-adjusted 12-month breakeven spread ticked down to its 6th percentile since 1995 (Chart 2). This indicates that corporate bonds remain expensive, despite the Fed’s pivot toward tightening. The slope of the yield curve is a critical indicator for our corporate bond call. We are very comfortable holding corporate bonds when the 3-year/10-year Treasury slope is above 50 bps, but our work suggests that returns to credit risk take a significant step down once the slope flattens into a range of 0 bps to 50 bps.1 The 3-year/10-year Treasury slope recently bounced off the 50 bps level and it currently sits at 59 bps. However, our fair value estimates for the 3/10 slope suggest that it won’t stay above 50 bps for long (bottom panel). The three scenarios we consider all suggest that the 3/10 slope will break below 50 bps within the next six months.2 We will turn more defensive on corporate bonds once that occurs.
Chart
Chart
High-Yield: Overweight Chart 3High-Yield Market Overview
High-Yield Market Overview
High-Yield Market Overview
High-Yield outperformed the duration-equivalent Treasury index by 216 bps in December and by 669 bps in 2021. The index option-adjusted spread tightened 54 bps on the month, ending the year at 283 bps. The 12-month spread-implied default rate – the default rate that is priced into the junk index assuming a 40% recovery rate on defaulted debt and an excess spread of 100 bps – also fell back to 3.3% (Chart 3). The odds are good that defaults will come in below 3.3% in 2021, which should coincide with the outperformance of high-yield bonds versus duration-matched Treasuries. For context, the high-yield default rate came in at 1.8% for the 12 months ending in November and we showed in a recent report that corporate balance sheets are in excellent shape.3 Specifically, we noted that the ratio of total debt to net worth for the nonfinancial corporate sector has fallen to 41%, the lowest ratio since 2010 (bottom panel). We recommend that investors favor high-yield over investment grade corporate bonds. While, as noted on page 3, we will turn more defensive on credit risk (including high-yield) once the 3/10 Treasury slope moves sustainably below 50 bps, we will likely retain a preference for high-yield over investment grade based on relative valuations. MBS: Underweight Chart 4MBS Market Overview
MBS Market Overview
MBS Market Overview
Mortgage-Backed Securities outperformed the duration-equivalent Treasury index by 21 basis points in December but lagged by 69 bps in 2021. The zero-volatility spread for conventional 30-year agency MBS tightened 6 bps on the month, evenly split between 3 bps of option-adjusted spread (OAS) tightening and a 3 bps drop in the compensation for prepayment risk (option cost) (Chart 4). We wrote in a recent report that MBS’ poor performance in 2021 was attributable to an option cost that was too low relative to the pace of mortgage refinancings, noting that the MBA Refinance Index was slow to fall in 2021, despite the back-up in yields.4 The robust pace of home price appreciation has been an important factor boosting refis, as homeowners have been increasingly incentivized to tap the equity in their homes. With no indication that cash-out refi activity is about to slow, we expect refinancings to remain stubbornly high in 2022. This will put upward pressure on MBS spreads. We recommend an up-in-coupon bias within an overall underweight allocation to MBS. Higher coupon MBS exhibit more attractive option-adjusted spreads and higher convexity than lower coupon MBS. This makes high-coupon MBS (4%, 4.5%) more likely to outperform low-coupon MBS (2%, 2.5%, 3%) in an environment where bond yields are flat or rising (bottom panel). Government-Related: Overweight Chart 5Government-Related Market Overview
Government-Related Market Overview
Government-Related Market Overview
The Government-Related index outperformed the duration-equivalent Treasury index by 34 basis points in December and by 68 bps in 2021. Sovereign debt outperformed duration-equivalent Treasuries by 216 bps in December but lagged by 10 bps in 2021. Foreign Agencies outperformed the Treasury benchmark by 6 bps on the month and by 41 bps in 2021. Local Authority bonds underperformed by 37 bps in December but beat duration-matched Treasuries by 368 bps in 2021. Domestic Agency bonds underperformed by 1 bp in December and were flat versus Treasuries on the year. Supranationals outperformed Treasuries by 2 bps in December and by 20 bps in 2021. The investment grade Emerging Market Sovereign bond index outperformed the duration-equivalent US corporate bond index by 109 bps in December. The Emerging Market Corporate & Quasi-Sovereign index outperformed duration-matched US corporates by 16 bps (Chart 5). Both EM indexes continue to offer significant yield advantages versus US corporate bonds with the same credit rating and duration. We continue to recommend overweighting USD-denominated EM sovereigns and corporates versus investment grade US corporates with the same credit rating and duration.5 Within EM sovereigns, attractive countries include: Philippines, Russia, Mexico, Indonesia, Saudi Arabia, UAE and Qatar. Municipal Bonds: Maximum Overweight Chart 6Municipal Market Overview
Municipal Market Overview
Municipal Market Overview
Municipal bonds outperformed the duration-equivalent Treasury index by 43 basis points in December and by 416 bps in 2021 (before adjusting for the tax advantage). The economic and policy back-drop remains favorable for municipal bond performance. Trailing 4-quarter net state & local government savings are incredibly high (Chart 6) and 2021’s federal spending splurge will support state & local government coffers for some time. A recent report showed that the average duration of municipal bond indexes has fallen significantly during the past few decades, a trend that has implications for how we should perceive municipal bond valuations.6 Specifically, the trend makes municipal bonds more attractive relative to both Treasury securities and investment grade corporates. Long-maturity bonds are especially compelling. We calculate that 12-17 year maturity Revenue munis offer a breakeven tax rate of 19% relative to credit rating and duration matched US corporate bonds. 12-17 year General Obligation Munis offer a breakeven tax rate of 25% versus corporates (panel 2). High-yield muni spreads are reasonably attractive compared to high-yield corporates (panel 4), but we recommend only a neutral allocation to high-yield munis versus high-yield corporates. The deep negative convexity of high-yield munis makes them susceptible to extension risk if bond yields rise. Treasury Curve: Buy 2-Year Bullet Versus Cash/10 Barbell Chart 7Treasury Yield Curve Overview
Treasury Yield Curve Overview
Treasury Yield Curve Overview
The Treasury curve bear-flattened in December but reversed some of that flattening in the first week of January. All in all, the 2-year/10-year Treasury slope has flattened 2 bps since the end of November, bringing it to 89 bps. As noted on the front page of this report, the 5-year/5-year forward Treasury yield is rising but it is still only at the low-end of survey estimates of the long-run neutral fed funds rate. This argues for continuing to hold curve steepeners in the near term. It will make sense to shift into flatteners once the 5-year/5-year forward yield rises to the middle of the range of survey estimates. We also observe that the 2/5/10 butterfly spread is extremely high, both in absolute terms and relative to our model’s fair value (Chart 7). This signals that a 2/10 curve steepening position (long 5-year bullet, short 2/10 barbell) is incredibly cheap. Indeed, the 2/10 slope has already flattened to below the levels that were witnessed on the last two Fed liftoff dates in 2015 and 2004 (panel 4) and the Fed has still not raised rates off the zero bound. A trade long the 5-year bullet and short a duration-matched 2/10 barbell looks attractive in this environment. However, we note that the 2/5 Treasury slope has also flattened to below levels seen on the prior two Fed liftoff dates (bottom panel). In other words, the 2/5 slope also has room to steepen. For that reason, we prefer to focus our long positions on the 2-year Treasury note rather than the 5-year. We recommend buying the 2-year bullet versus a duration-matched cash/10 barbell. We also advise investors to own a position long the 20-year bond versus a duration-matched 10/30 barbell. This latter position offers a very attractive duration-neutral yield advantage of 20 bps. TIPS: Neutral Chart 8TIPS Market Overview
TIPS Market Overview
TIPS Market Overview
TIPS outperformed the duration-equivalent nominal Treasury index by 85 basis points in December and by 830 bps in 2021. The 10-year TIPS breakeven inflation rate rose 8 bps on the month while the 2-year TIPS breakeven inflation rate fell by 2 bps. The 10-year and 2-year rates currently sit at 2.52% and 3.17%, respectively. The Fed’s preferred 5-year/5-year forward TIPS breakeven inflation rate rose 5 bps on the month. It currently sits at 2.19%, somewhat below the Fed’s 2.3% - 2.5% target range. Our valuation indicator shows that 10-year TIPS are slightly expensive compared to 10-year nominal Treasuries (Chart 8), and we retain a neutral allocation to TIPS versus nominals at the long-end of the curve. We acknowledge the risk that a prolonged period of high inflation could lead to a break-out in long-dated TIPS breakevens, but this now looks less likely given the Fed’s increasing hawkishness. We see better trading opportunities at the front-end of the TIPS curve where the 2-year TIPS breakeven inflation rate remains well above the Fed’s target range (panel 4). Short-maturity breakevens are more sensitive to swings in CPI than those at the long end. Therefore, the 2-year TIPS breakeven inflation rate has considerable downside during the next 6-12 months, assuming inflation moderates as we expect. We recommend an underweight allocation to TIPS versus nominals at the front-end of the curve. Given our view that CPI inflation will be lower in 6-12 months, we recommend shorting 2-year TIPS outright, positioning in 2/10 TIPS breakeven inflation curve steepeners (bottom panel) and 2/10 TIPS (real) yield curve flatteners. All three trades will profit from falling short-maturity inflation expectations. ABS: Overweight Chart 9ABS Market Overview
ABS Market Overview
ABS Market Overview
Asset-Backed Securities outperformed the duration-equivalent Treasury index by 5 basis points in December and by 31 bps in 2021. Aaa-rated ABS outperformed by 4 bps in December and by 17 bps in 2021. Non-Aaa ABS outperformed Treasuries by 9 bps in December and by 103 bps in 2021. During the past two years, substantial federal government support for household incomes has caused US households to build up an extremely large buffer of excess savings. During this period, many households have used their windfalls to pay down consumer debt and credit card debt levels have fallen to well below pre-COVID levels (Chart 9). Though consumer credit growth is starting to rebound, debt levels are still low. This indicates that the collateral quality backing consumer ABS remains exceptionally strong. Investors should remain overweight consumer ABS and should take advantage of the high quality of household balance sheets by moving down the quality spectrum, favoring non-Aaa rated securities over Aaa-rated ones. Non-Agency CMBS: Neutral Chart 10CMBS Market Overview
CMBS Market Overview
CMBS Market Overview
Non-Agency Commercial Mortgage-Backed Securities outperformed the duration-equivalent Treasury index by 24 basis points in December and by 180 bps in 2021. Aaa Non-Agency CMBS outperformed Treasuries by 17 bps in December and by 80 bps in 2021. Non-Aaa Non-Agency CMBS outperformed Treasuries by 42 bps in December and by 513 bps in 2021 (Chart 10). Though returns have been strong and spreads remain relatively high, particularly for lower-rated CMBS, we continue to recommend only a neutral allocation to the sector because of the structurally challenging environment for commercial real estate. Agency CMBS: Overweight Agency CMBS outperformed the duration-equivalent Treasury index by 12 basis points in December and by 70 bps in 2021. The average index option-adjusted spread tightened 1 bp on the month. It currently sits at 36 bps (bottom panel). Though Agency CMBS spreads have recovered to well below their pre-COVID levels, they still look attractive compared to other similarly risky spread products. Stay overweight. Appendix A: Butterfly Strategy Valuations The following tables present the current read-outs from our butterfly spread models. We use these models to identify opportunities to take duration-neutral positions across the Treasury curve. The following two Special Reports explain the models in more detail: US Bond Strategy Special Report, “Bullets, Barbells And Butterflies”, dated July 25, 2017, available at usbs.bcaresearch.com US Bond Strategy Special Report, “More Bullets, Barbells And Butterflies”, dated May 15, 2018, available at usbs.bcaresearch.com Table 4 shows the raw residuals from each model. A positive value indicates that the bullet is cheap relative to the duration-matched barbell. A negative value indicates that the barbell is cheap relative to the bullet. Table 4Butterfly Strategy Valuation: Raw Residuals In Basis Points (As Of December 31st, 2021)
Prepare For Liftoff
Prepare For Liftoff
Table 5 scales the raw residuals in Table 4 by their historical means and standard deviations. This facilitates comparison between the different butterfly spreads. Table 5Butterfly Strategy Valuation: Standardized Residuals (As Of December 31st, 2021)
Prepare For Liftoff
Prepare For Liftoff
Table 6 flips the models on their heads. It shows the change in the slope between the two barbell maturities that must be realized during the next six months to make returns between the bullet and barbell equal. For example, a reading of -58 bps in the 5 over 2/10 cell means that we would expect the 5-year to outperform the 2/10 if the 2/10 slope flattens by less than 58 bps during the next six months. Otherwise, we would expect the 2/10 barbell to outperform the 5-year bullet. Table 6Discounted Slope Change During Next 6 Months (BPs)
Prepare For Liftoff
Prepare For Liftoff
Appendix B: Excess Return Bond Map The Excess Return Bond Map is used to assess the relative risk/reward trade-off between different sectors of the US bond market. It is a purely computational exercise and does not impose any macroeconomic view. The Map’s vertical axis shows 12-month expected excess returns. These are proxied by each sector’s option-adjusted spread. Sectors plotting further toward the top of the Map have higher expected returns and vice-versa. Our novel risk measure called the “Risk Of Losing 100 bps” is shown on the Map’s horizontal axis. To calculate it, we first compute the spread widening required on a 12-month horizon for each sector to lose 100 bps or more relative to a duration-matched position in Treasury securities. Then, we divide that amount of spread widening by each sector’s historical spread volatility. The end result is the number of standard deviations of 12-month spread widening required for each sector to lose 100 bps or more versus a position in Treasuries. Lower risk sectors plot further to the right of the Map, and higher risk sectors plot further to the left.
Chart 11
Ryan Swift US Bond Strategist rswift@bcaresearch.com Footnotes 1 Please see US Bond Strategy Weekly Report, “Expected Returns In Corporate Bonds”, dated September 21, 2021. 2 We consider three scenarios for the fed funds rate. (1) March liftoff, 100 bps per year hike pace, 2.08% terminal rate. (2) March liftoff, 75 bps per year hike pace, 2.08% terminal rate. (3) March liftoff, 75 bps per year hike pace, 2.33% terminal rate. 3 Please see US Bond Strategy Weekly Report, “The Fed’s Inflation Problem”, dated November 23, 2021. 4 Please see US Bond Strategy Weekly Report, “The Omicron Impact”, dated November 30, 2021. 5 Please see US Bond Strategy Special Report, “2022 Key Views: US Fixed Income”, dated December 14, 2021. 6 Please see US Bond Strategy Weekly Report, “The Best & Worst Spots On The Yield Curve”, dated October 26, 2021.
Highlights The markets are already looking past Omicron. Now they have new worries – the Fed battling inflation. In the past, the Fed moved because of confidence that strong economic growth can withstand rates normalization. This time around, the Fed’s hand is forced by inflation, which is no longer deemed “transitory”. So far, fear of an inflation-induced tightening cycle manifests in expectations of a steeper trajectory for rates, and violent and indiscriminate rotation out of the tech names. Companies have set aside record amounts of cash for wage increases. This is sure to cut into corporate profitability and validates our thesis that peak margins are in the rear-view window. Supply bottlenecks are easing, so is the ISM activity index, which we interpret as a normalization. When it comes to our style recommendations, we continue preferring small caps over large caps on the back of attractive valuations and favorable economic backdrop. Today, we also upgrade Value / Growth from neutral to OW - rising rates are a tailwind for Value. Recommended Allocation
US Equity Chart Pack
US Equity Chart Pack
Feature December was a good month for equities (Chart 1). While the beginning of the month was marred by turbulence, induced by the arrival of Omicron, and the Fed shifting to a more hawkish stance, Santa Claus did deliver a rally to close the month, with the S&P 500 rising by 6% and lifting its 2021 gains to an impressive 27%. But 2021 was a wild year for active investors, as only 15% of funds and strategies outperformed the S&P 500. Hence, many investors had to watch the S&P 500 gains from the sidelines: The year was characterized by rotation across sectors and styles. December brought about a sell-off in the most speculative names in the equity market (EEM, IWM, ARKK, BTC, IPO), which has continued unabated into January: The Fed’s imminent monetary tightening is a culprit. Capital has also rotated away from Cyclicals and towards Defensives (the MSCI Cyclicals / Defensive ratio was down 7% in December). However, Cyclicals are starting to rebound from the Omicron slump.
Chart 1
Overarching Macroeconomic Themes Omicron or “Omicold”? Either Way, The US Market Is Looking Past It… Little was known about the Omicron variant when it took us all by surprise at the end of November. Fortunately, an expectation that this variant is more contagious but less virulent has come to pass: While the number of cases has surged (nearly, every family I know in the tri-state area has had it by now), the number of hospitalizations has remained contained (Chart 2). The economic damage, at least in the US, has been minor, and mostly due to people being away from work sick or quarantined. It also appears that this COVID wave is close to a peak, which explains the recent outperformance of Cyclicals (Chart 3): The markets are already looking past Omicron. Now they have new worries – the Fed battling inflation. Chart 2Omicron Wave Is Close To A Peak...
Omicron Wave Is Close To A Peak...
Omicron Wave Is Close To A Peak...
Chart 3...And Cyclicals Are Rebounding
...And Cyclicals Are Rebounding
...And Cyclicals Are Rebounding
Inflation Is Forcing The Fed’s Hand Into An Aggressive Tightening Cycle Fed rate hikes are now all but certain: The market is pricing in four rate hikes in 2022 with a probability of nearly 90% (Chart 4), a noticeable increase from the three rate hikes expected in December 2021. The Fed’s December meeting minutes indicate that the first rate hike may come as soon as March. What is different this time is the inflation backdrop: In the past, the Fed moved because of confidence that strong economic growth can withstand rates normalization. This time around, the Fed’s hand is forced by inflation, which is no longer deemed “transitory”. The Fed is raising rates to squish growth to tame inflation, giving rate rises a different context: The Fed is behind the curve, and while in the past the stock market took rate hikes in its stride (after a short-lived slump in performance), now market reaction may be much more negative. So far, fear of an inflation-induced tightening cycle manifests in expectations of a steeper trajectory for rates (Chart 5), and violent and indiscriminate rotation out of the tech names. Chart 4Market Is Expecting Four Hikes In 2022
Market Is Expecting Four Hikes In 2022
Market Is Expecting Four Hikes In 2022
Chart 5Rates Made A Vertical Move
Rates Made A Vertical Move
Rates Made A Vertical Move
More Wage Raises Are On The Way – A Headwind To Corporate Profitability According to the NIPA, wages constitute about 50% of sales of US companies. Over the past year, nominal wages increased by 5.8% but still could not keep up with rising prices – real wage growth is running at -2.3% (Chart 6). Considering that in 2021 only a minor share of workers got raises – those rejoining the workforce, starting a new job, or members of a few labor unions, the majority of Americans have had no change in income and have been bewildered by prices in the supermarkets. As the new calendar year rolls on, many of these workers will negotiate their salaries to get inflation adjustments (Chart 7). In fact, according to the WSJ, companies have set aside record amounts of cash for wage increases. This is sure to cut into corporate profitability and validates our thesis that peak margins are in the rearview window. Chart 6Wages Are Not Keeping Up With Inflation
Wages Are Not Keeping Up With Inflation
Wages Are Not Keeping Up With Inflation
Chart 7Wage-Price Spiral?
Wage-Price Spiral?
Wage-Price Spiral?
Another concern is a wage-price spiral, leading to rampant inflation, making the Fed’s job harder, and calling for more aggressive monetary tightening, striking a blow to the stock market. Supply Bottlenecks Are Easing, So Is The ISM Activity Index The ISM Manufacturing index has turned from 64.7 to 58.7 (Chart 8A). Part of the decline in the top-line numbers is due to the resolution of supply-chain bottlenecks: The ISM Supplier Index has fallen from 78.6 to 64.9 (Chart 8B), indicating a reduction in delivery times. On the other hand, the New Orders index has also declined from 68 to 60.4, suggesting that bottlenecks are clearing thanks to the reduction in business activity, which we interpret as a normalization. Of course, zero-tolerance to COVID policy in China and other countries may lead to new production and shipping delays, and another leg up for the inflation readings. Chart 8AISM PMI Has Turned...
ISM PMI Has Turned...
ISM PMI Has Turned...
Chart 8BAnd Not Only Because Of Shorter Delivery Times
And Not Only Because Of Shorter Delivery Times
And Not Only Because Of Shorter Delivery Times
Styles Comments Small Vs. Large Cap: Sticking To Our Overweight In Small Valuations: Small caps are cheap and unloved, trading at 16x forward earnings with a 25% discount to Large. The BCA Valuation Indicator for Small vs. Large is standing more than two standard deviations below its long-term average. Profitability: Since 2019, Small has delivered 47% annualized profit growth compared to 14% from Large. The small companies have demonstrated resilience and successfully navigated the economic landscape, plagued with supply bottlenecks, labor shortages, and surging prices (Chart 9A). Small-cap margins have exceeded the historical average and have likely peaked, just like the margins of their larger brethren. According to the NFIB Small Business Survey, a core concern is inflation, but 54% of small companies intend to raise prices, passing on costs to customers. Like all other American companies, they experience labor shortages and are planning to raise wages too. On balance, we believe that small caps will remain profitable and their earnings will continue to grow, albeit at a slower pace, i.e., at 15% (Chart 9B), which is significantly less than 88% in 2021, but more than the 10% growth expected of larger companies. Chart 9ASmall Businesses Are Worried About Inflation And Are Raising Prices
Small Businesses Are Worried About Inflation And Are Raising Prices
Small Businesses Are Worried About Inflation And Are Raising Prices
Chart 9BEarnings Growth Expectations Have Normalized
Earnings Growth Expectations Have Normalized
Earnings Growth Expectations Have Normalized
Macroeconomic Backdrop: Historically, small caps have outperformed large caps in the environment of rising rates (Chart 10), because of higher allocations to Cyclicals, such as Financials and Industrials. Also, while rising rates take the froth off the high-flying growth stocks, smaller companies are cheap and have moderate growth expectations. Overweight Small vs. Large: Attractive valuations and fundamentals, and a high likelihood to perform well when rates are rising, make overweighting Small vs Large an attractive proposition.
Chart 10
Risks: While we stay with the call, there are a few caveats: Small caps’ margins are narrow, and continued cost pressures, especially surging labor costs, have the potential to dent their profitability. Further, while empirical analysis indicates that Small outperforms during the rate-hiking cycle, we are concerned that surging inflation may render this analysis less useful – can this time really be different? Growth Vs. Value: Shifting Towards Value Valuations: Over the course of 2021, Growth outperformed Value by 23% (trough to peak), and by 5% over just the last 26 weeks. As a result of such a strong run, Growth has become very expensive, trading at 29x forward multiples, which is which is a 70% premium to Value (which is trading at 17x). The Growth/Value BCA Valuation Indicator corrected below the 2 standard deviation mark and is mean reverting. Profitability: Despite significant valuation discrepancy between Growth and Value, both asset classes are set to deliver roughly the same earnings growth over the next year, suggesting that the premium for Quality and Growth may be excessive (Chart 11A). Macroeconomic Backdrop: Since the beginning of the pandemic, performance of Value vs. Growth has been strongly linked to the direction of change in yields (Chart 11B). Growth is overweight long-duration Technology stocks, while Value is highly exposed to Financials, which appear to thrive in the environment of rising rates. Chart 11AGrowth Expectation Are Similar, But Value Is Cheaper
Growth Expectation Are Similar, But Value Is Cheaper
Growth Expectation Are Similar, But Value Is Cheaper
Chart 11BRising Rates Are A Tailwind For Value
Rising Rates Are A Tailwind For Value
Rising Rates Are A Tailwind For Value
Overweight Value: As we stated in our 2022 Outlook, “Our neutral position [in Growth vs. Value] will be a great launching pad towards overweighting value stocks at the first whiff of rising long rates.” Now, with rate hikes drawing nearer and Omicron peaking, we are changing our neutral allocation to a cyclical overweight in Value, and underweight in Growth. Valuations and the macroeconomic backdrop are at the core of the call. Risks: We may be early with our presumption that Omicron is just an uber-contagious “Omicold” – hospitalizations may still surge, while global lockdowns may cause much economic damage. In that case, rates may remain range-bound, while the Fed may delay rate hikes. Then Growth would be bound to outperform Value. Irene Tunkel Chief Strategist, US Equity Strategy irene.tunkel@bcaresearch.com S&P 500 Chart 12Macroeconomic Backdrop
Macroeconomic Backdrop
Macroeconomic Backdrop
Chart 13Profitability
Profitability
Profitability
Chart 14Valuations And Technicals
Valuations And Technicals
Valuations And Technicals
Chart 15Uses Of Cash
Uses Of Cash
Uses Of Cash
Cyclicals Vs Defensives Chart 16Macroeconomic Backdrop
Macroeconomic Backdrop
Macroeconomic Backdrop
Chart 17Profitability
Profitability
Profitability
Chart 18Valuation And Technicals
Valuation And Technicals
Valuation And Technicals
Chart 19Uses Of Cash
Uses Of Cash
Uses Of Cash
Growth Vs Value Chart 20Macroeconomic Backdrop
Macroeconomic Backdrop
Macroeconomic Backdrop
Chart 21Profitability
Profitability
Profitability
Chart 22Valuations And Technicals
Valuations And Technicals
Valuations And Technicals
Chart 23Uses Of Cash
Uses Of Cash
Uses Of Cash
Small Vs Large Chart 24Macroeconomic Backdrop
Macroeconomic Backdrop
Macroeconomic Backdrop
Chart 25Profitability
Profitability
Profitability
Chart 26Valuations and Technicals
Valuations and Technicals
Valuations and Technicals
Chart 27Uses Of Cash
Uses Of Cash
Uses Of Cash
Image
Image
Recommended Allocation Footnotes .
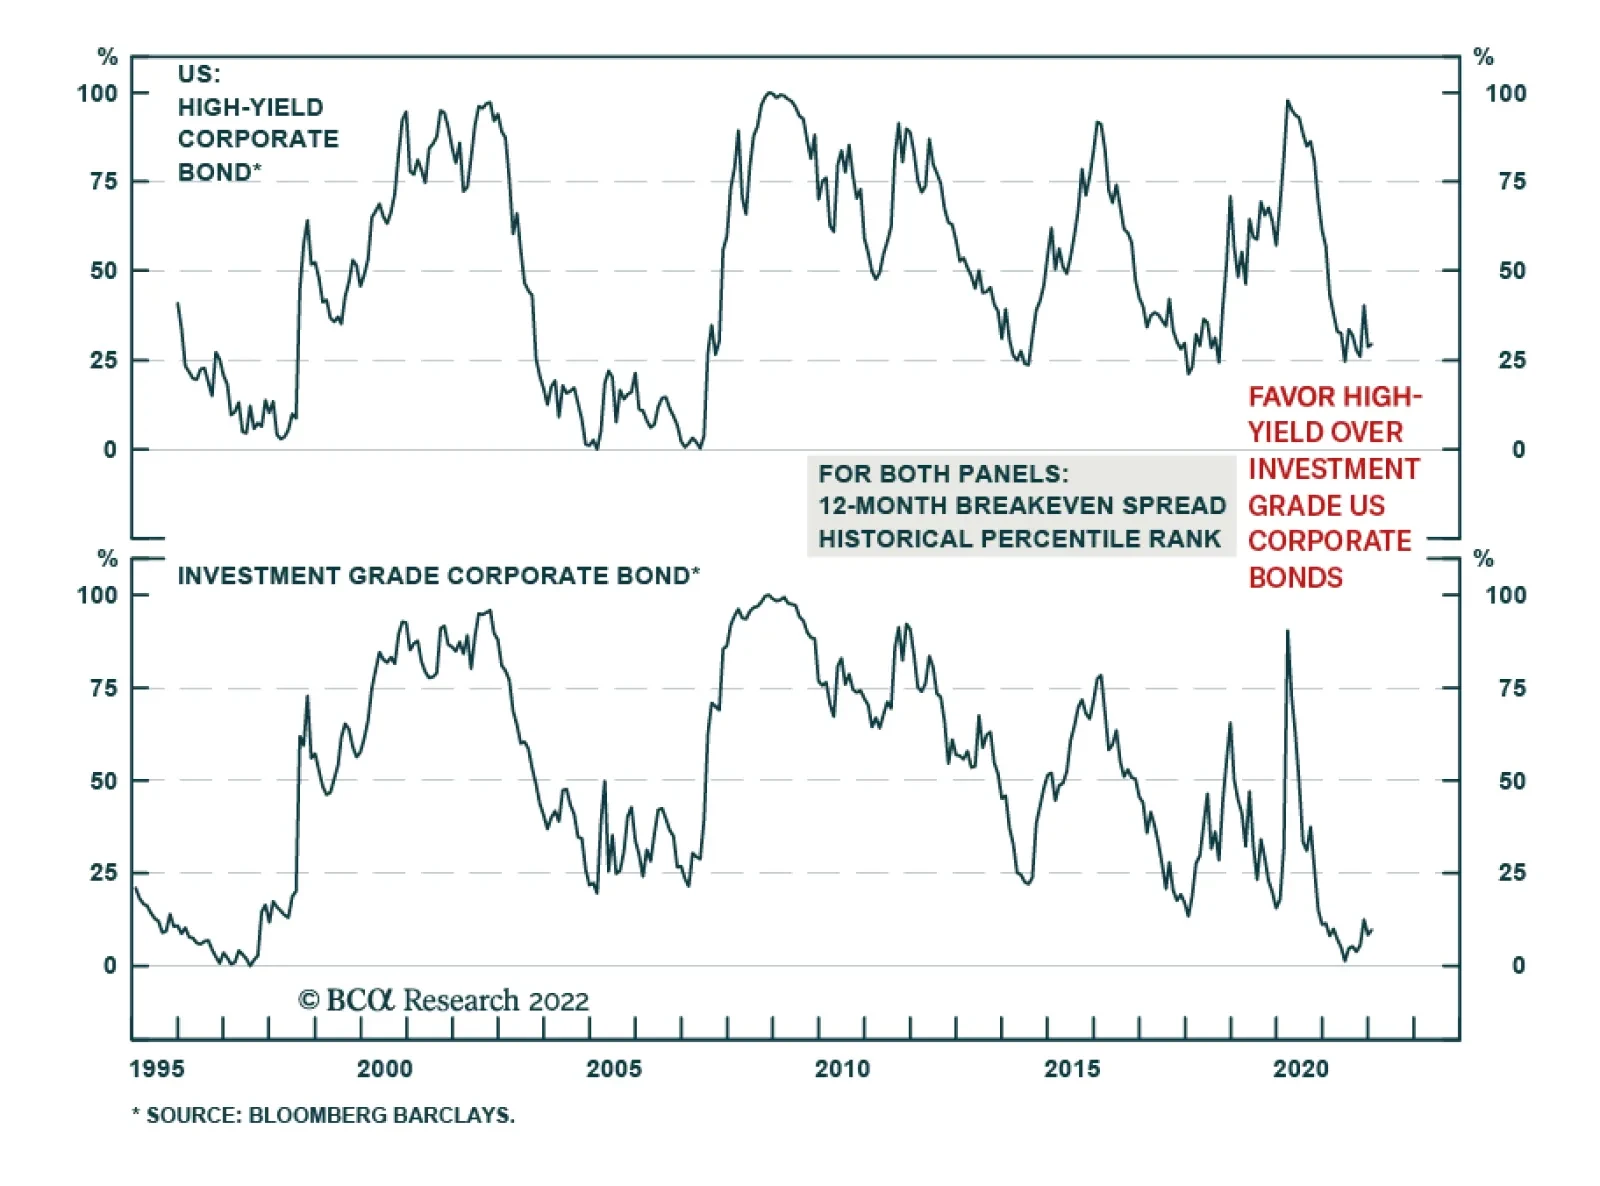
The hawkish shift in the Fed’s policy stance coupled with the omicron-driven rise in COVID-19 infection rates caused US investment grade and high-yield spreads to widen towards the end of 2021. This dynamic coincided with a flattening of the yield curve.…