United States
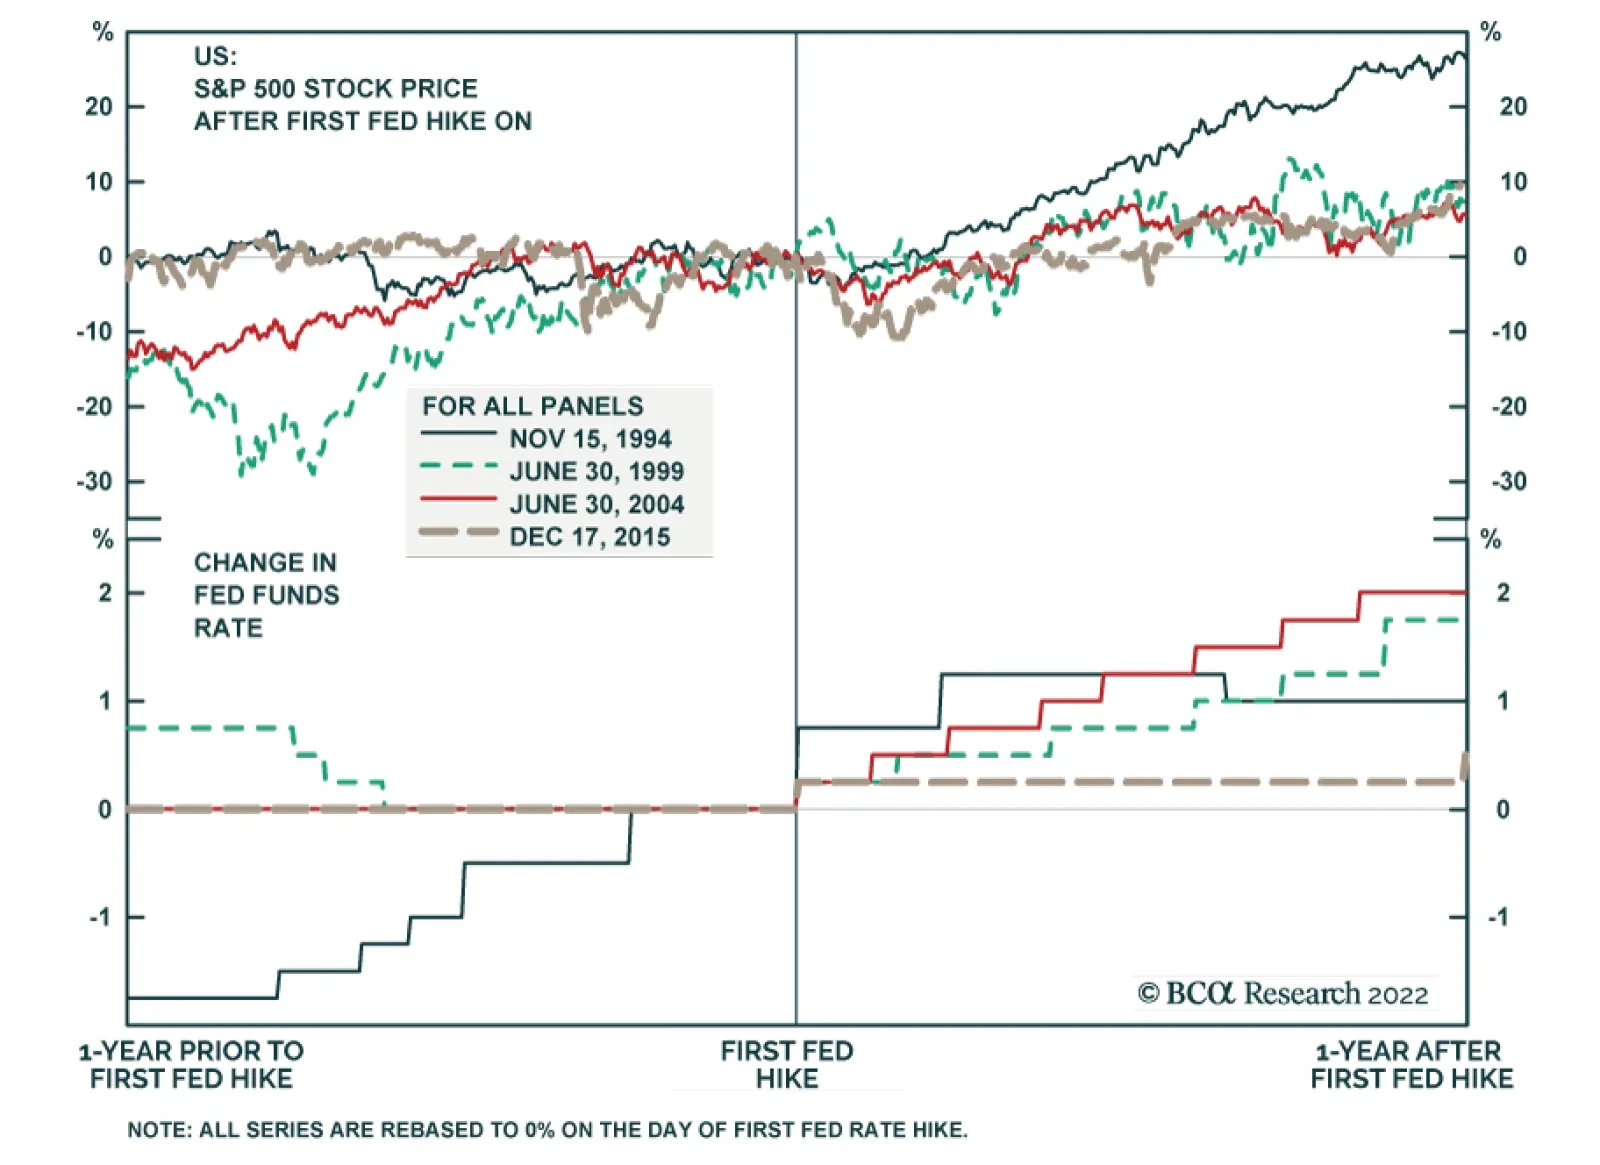
Our US Investment strategists recently highlighted that although the Fed is beginning to tighten monetary policy, the level – rather than the direction – of the fed funds rate has a greater impact on the performance of US equities (see Today’s Pick). …
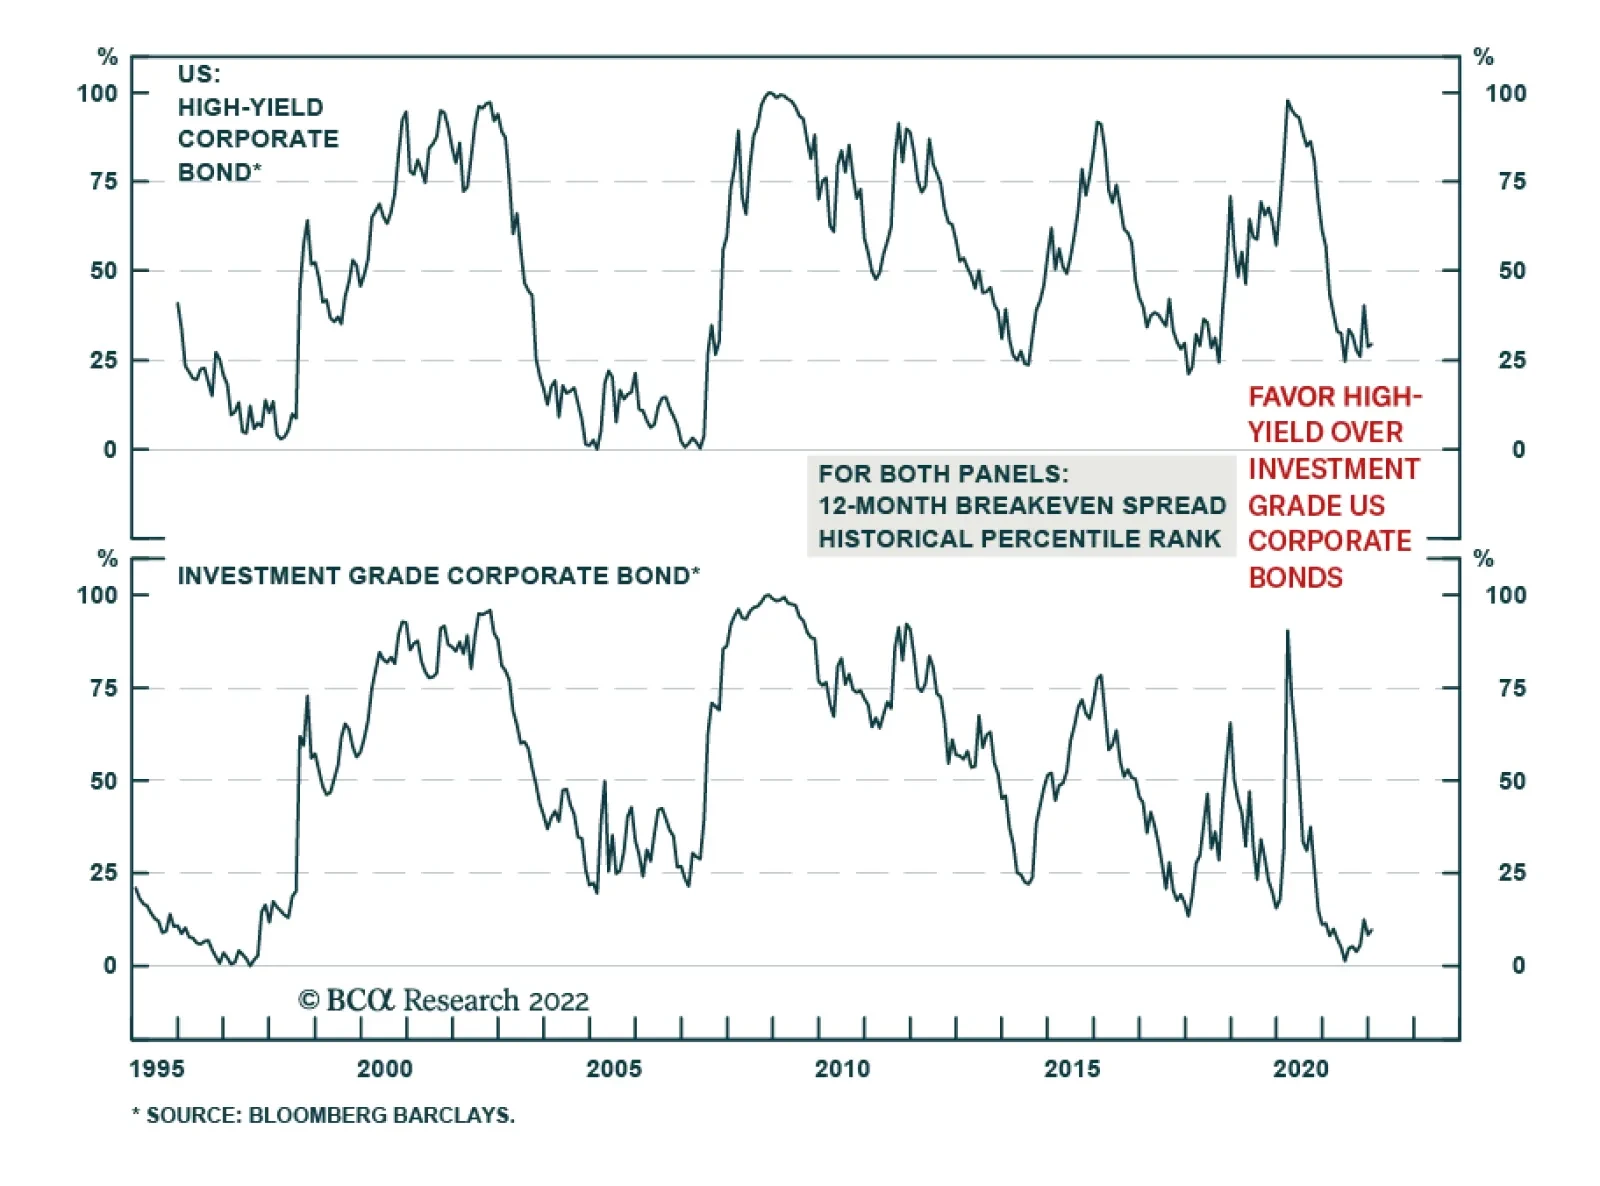
The hawkish shift in the Fed’s policy stance coupled with the omicron-driven rise in COVID-19 infection rates caused US investment grade and high-yield spreads to widen towards the end of 2021. This dynamic coincided with a flattening of the yield curve.…
BCA Research’s US Investment Strategy service concludes that it is too soon to turn defensive in multi-asset portfolios. The team decomposed the monetary policy cycle into four phases based on whether the FOMC is hiking or cutting rates and the position of…

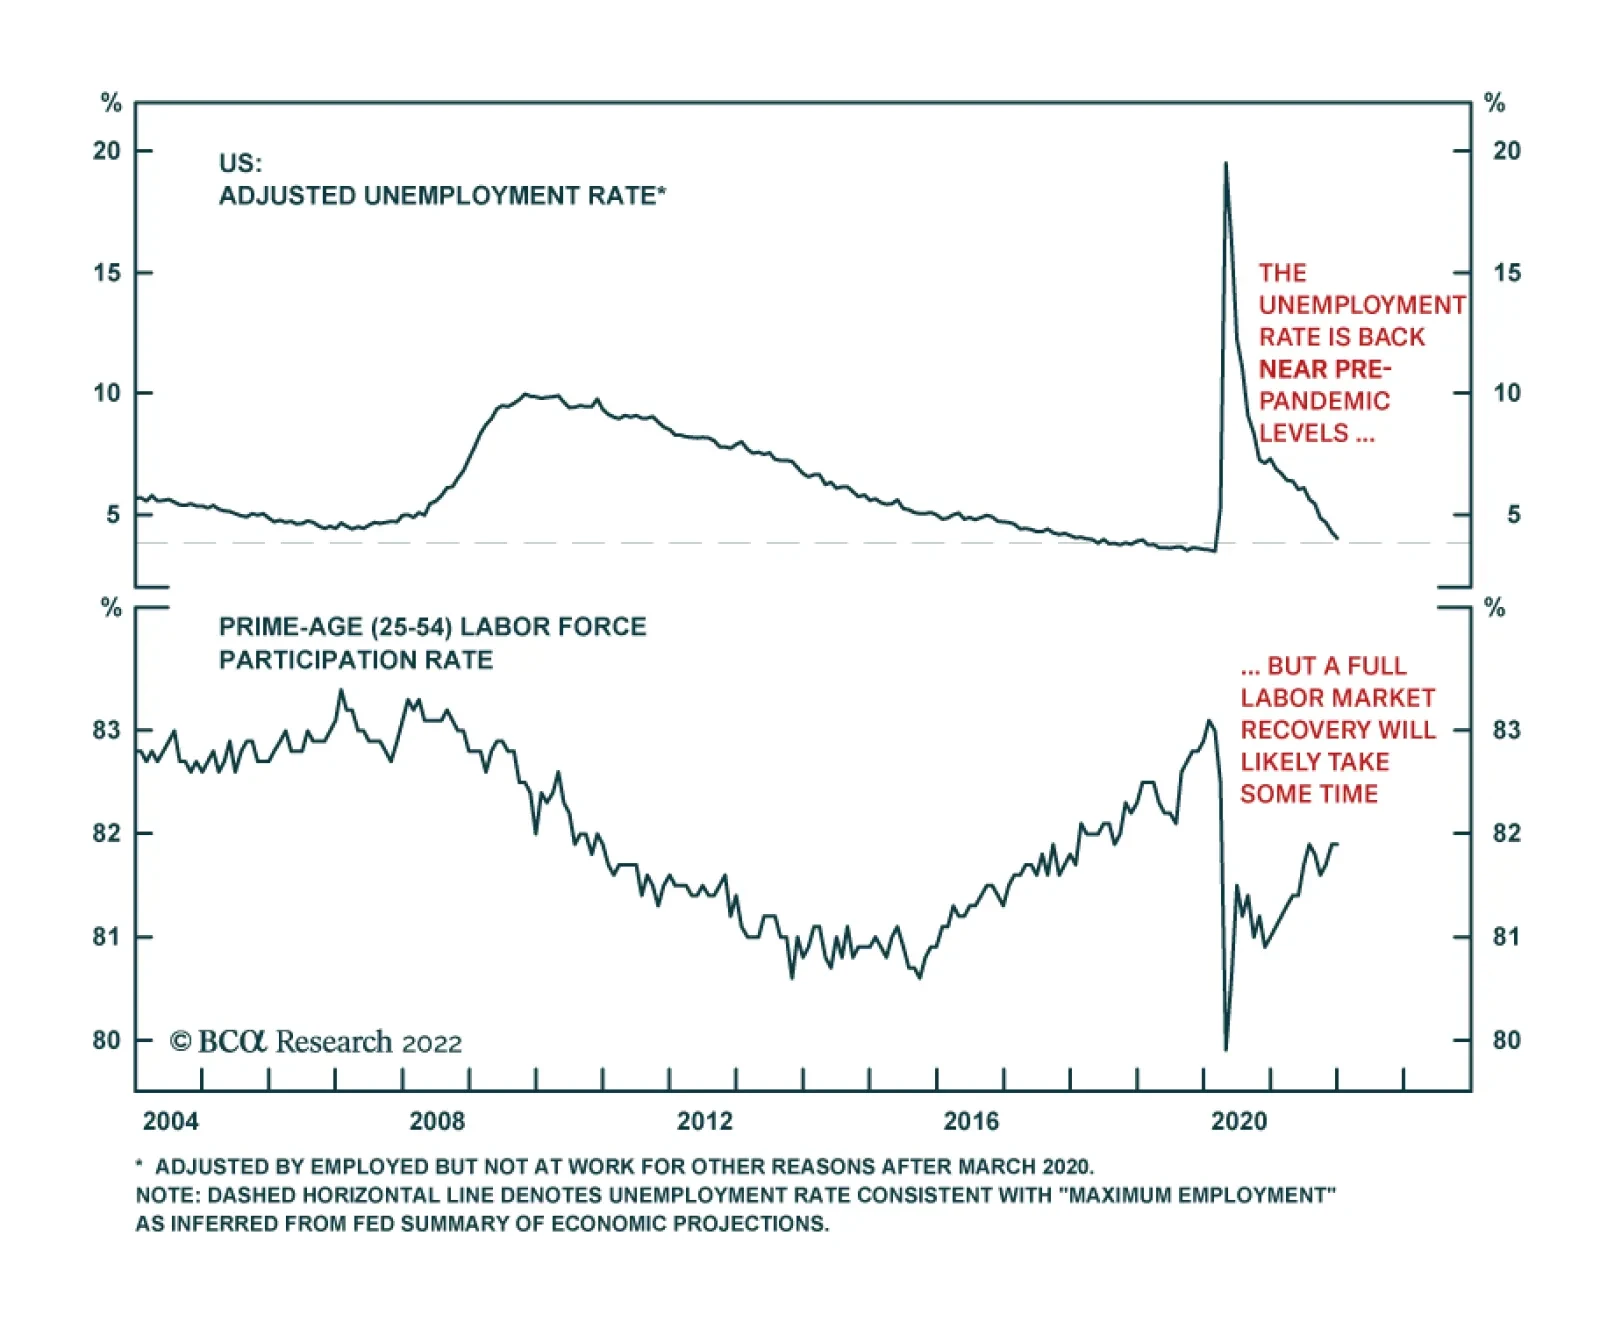
Highlights The prospect of Fed rate hikes seems to be weighing on 2022 equity return expectations, … : Financial media outlets have been sounding the alarm about the impact of rate hikes on equity returns. … but we think concerned investors are getting ahead of themselves, because monetary policy works with a lag, … : It takes time for changes in the fed funds rate to work their way through the economy. Even if the FOMC initiates a rate hike campaign in March, its effects may not begin to be felt until September or next March. … and the fed funds rate is miles away from becoming restrictive: In inflation-adjusted terms, the entire interest rate structure is incredibly supportive of economic activity. Assuming 4% inflation, the real fed funds rate will still be well below the bottom of its 2013-19 range even if all of the rate hikes investors are currently discounting occur in 2022. We continue to believe that it is too soon to turn defensive in multi-asset portfolios: The bull markets in equities and credit will eventually end, but not while the FOMC is only beginning to unwind maximum monetary accommodation. Feature The release of the minutes from the FOMC’s December meeting momentarily roiled financial markets last week. The minutes had a distinctly hawkish tone, pointing to a mid-March liftoff date and raising the specter of a shrinking Fed balance sheet. The ensuing sell-off dovetailed with rising anxiety in the financial media about the potentially adverse equity market impacts of impending rate hikes. The opening two paragraphs of “The Big Uneasy” article that filled the front page of The New York Times’ Business section on New Year’s Day captured the prevailing tone:1 For two years, the stock market has been largely able to ignore the lived reality of Americans during the pandemic … because of underlying policies that kept it buoyant. Investors can now say goodbye to all that. The body of the article was much more measured, pointing out that a series of rate hikes would eventually slow the economy and could diminish investors’ near-term appetite for equities, before wrapping up with a wildly sensationalist quote. “The nightmare scenario is: The Fed tightens and it doesn’t help,” said Aaron Brown, a former risk manager of AQR Capital Management who now manages his own money and teaches math at [NYU]. Mr. Brown said that if the Fed could not orchestrate a “soft landing” for the economy, things could start to get ugly – fast. And then, he said, the Fed may have to take “very aggressive action like a rate hike to 15 percent, or wage and price controls, like we tried in the ‘70s.” By an equal measure, the Fed’s moves, even if they are moderate, could also cause a sell-off in stocks, corporate bonds and other riskier assets, if investors panic when they realize that the free money that drove their risk-taking to ever greater extremes over the past several years is definitely going away. Dennis Gartman, the longtime writer of a daily newsletter for traders and institutional investors, echoed the theme in an interview with Bloomberg Radio last Monday. The Bloomberg story summarizing the interview was headlined “Gartman Sees Stocks Falling 15% in 2022 on Aggressive Fed Hikes” and hewed to the higher-rates/lower-stocks mantra. “Gartman said … that stocks could trade 10% to 15% lower this year. While [he] has long been calling for a bear market, he said the catalyst for the decline could be the central bank raising interest rates amid a continued rise in inflation. … ‘The advent of a bear market will come when the Fed begins to tighten monetary policy, and that will be later this year. No question.’” We admired The Gartman Letter and subscribe to the Times, but fed funds rate concerns have gotten overdone. In our view, anxiety about the effect of rate hikes on equity returns in 2022 is misplaced on two counts. First, it ignores that monetary policy only impacts the economy with a lag. Second, it fails to distinguish between the level of the fed funds rate and its direction. The economy and the S&P 500 have historically thrived in the early stages of rate-hiking campaigns, meeting their Waterloo only after the level of the fed funds rate becomes restrictive. The Fed Funds Rate Cycle We formulate investment strategy based on our analysis of the cycles that exert the strongest pull on financial markets: the business cycle, the credit cycle and the monetary policy cycle. As applied to US markets, we have found that the monetary policy cycle has the most reliably meaningful impact. As shown in Figure 1, we decompose the cycle into four phases based on whether the FOMC is hiking (the left half of the curve) or cutting (the right half) rates and the position of the fed funds rate relative to our estimate of its equilibrium level (the dashed horizontal line). We deem policy to be accommodative when the funds rate is below equilibrium and restrictive when it is above equilibrium.
Chart
We like to describe equilibrium as the fed funds rate that neither encourages nor discourages economic activity. The equilibrium rate is a concept and cannot be directly observed; though our estimate represents our best efforts, we recognize that no one can always pinpoint it in real time. We nonetheless take heart from the sharp divide in S&P 500 returns across periods that we have designated as easy or tight. As we show for the first time in this report, growth in key economic indicators aligns consistently with the progression of the funds rate cycle, supporting the investment conclusion that the approaching rate-hiking phase will be favorable for risk assets. Monetary Policy Works With A Lag The idea that monetary policy affects the economy with long and variable lags, first advanced by Milton Friedman in the late fifties, is universally accepted. To test the proposition within our policy cycle framework, we mapped growth in nonfarm payrolls, aggregate bank lending, consumption and GDP across rate cycle phases over the last 60 years. All series grew at their fastest rate in Phase I, when the Fed is tightening policy but has not yet made it tight. They continued to grow faster than their through-the-cycle pace, even when adjusted for inflation, in Phase II, when the Fed continues to hike the funds rate beyond its equilibrium level. Growth in Phases III and IV, when the Fed is easing policy to stimulate the economy, is markedly slower across all metrics than it is when the Fed is tightening. Chart 1 shows each indicator’s phase-by-phase performance in its own panel, with growth in early tightening Phase I (the solid black line) and late tightening Phase II (the dashed green line) easily surpassing early easing Phase III (the solid gray line) and late easing Phase IV (the dashed red line). Chart 1It Takes A While To Turn A Battleship, Especially When The Rudder Moves With Long And Variable Lags
It Takes A While To Turn A Battleship, Especially When The Rudder Moves With Long And Variable Lags
It Takes A While To Turn A Battleship, Especially When The Rudder Moves With Long And Variable Lags
Table 1 fleshes out the results, reporting each metric’s compound annual growth rate (CAGR) across the phases and compiling the CAGRs when the Fed is hiking rates and when it's cutting them. It also presents the nominal growth rates for lending, consumption and GDP, which are not shown in the chart. We view the results as forcefully supporting the long-and-variable view, especially as the FOMC deliberately moves at an incremental pace so as not to act like Friedman’s fool in the shower.2 Given that Phase II growth is comfortably above trend for every metric, it appears that Phase I would have to move at hyperspeed to hobble the economy at any point over the next year-plus. Table 1Phase I Is The Economy's Growth Sweet Spot
The Difference Between Tightening And Tight
The Difference Between Tightening And Tight
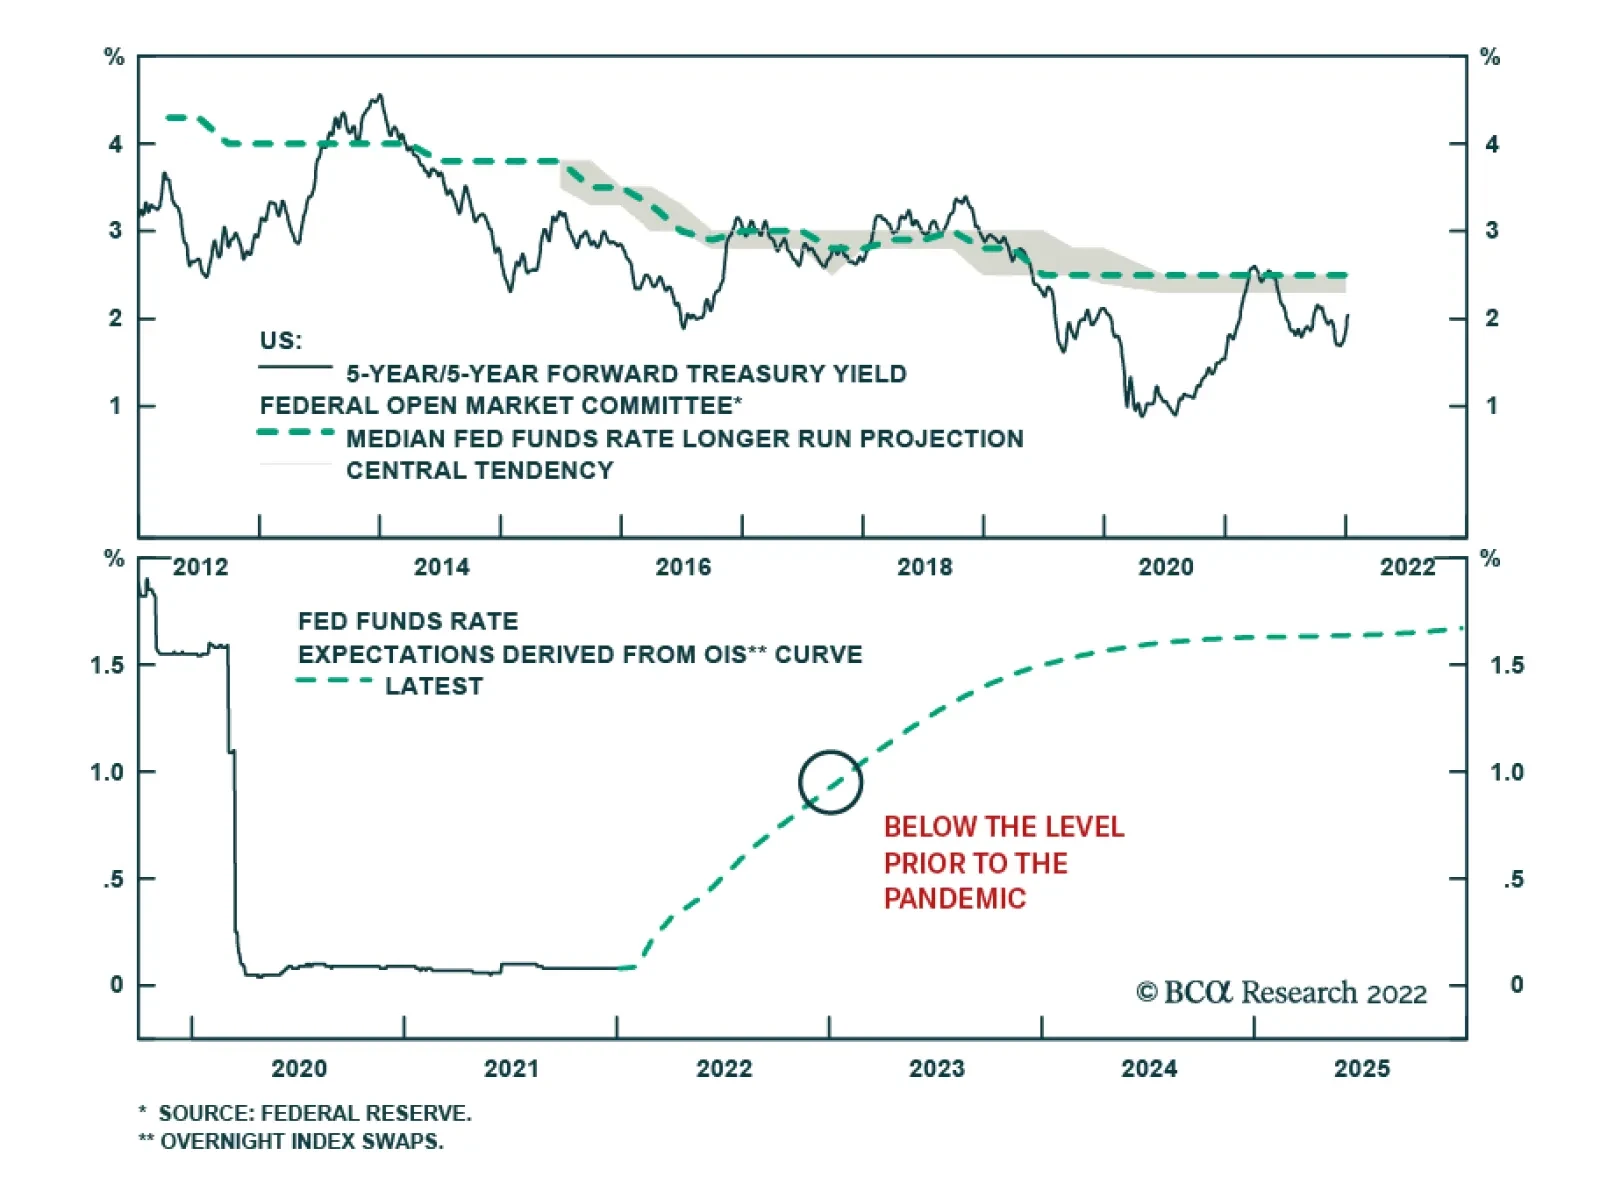
The Starting Point Matters, Too The economy should also be insulated from the adverse effects of reduced accommodation by virtue of its current level of support. The real fed funds rate is way below its financial crisis lows (Chart 2, top panel), along with the real 10-year Treasury yield (Chart 2, bottom panel). Both rates have steadily declined over the last 40 years' complete peak-to-peak cycles, in line with the US economy’s declining potential growth. Falling inflation has further contributed to a decline in the nominal equilibrium rate, as per the actual fed funds rate and our in-house estimate (Chart 3). Chart 2Real Rates Have A Long, Long Way To Go To Become Restrictive
Real Rates Have A Long, Long Way To Go To Become Restrictive
Real Rates Have A Long, Long Way To Go To Become Restrictive
Chart 3Interest Rates May Have More Headroom Than Markets Think
Interest Rates May Have More Headroom Than Markets Think
Interest Rates May Have More Headroom Than Markets Think
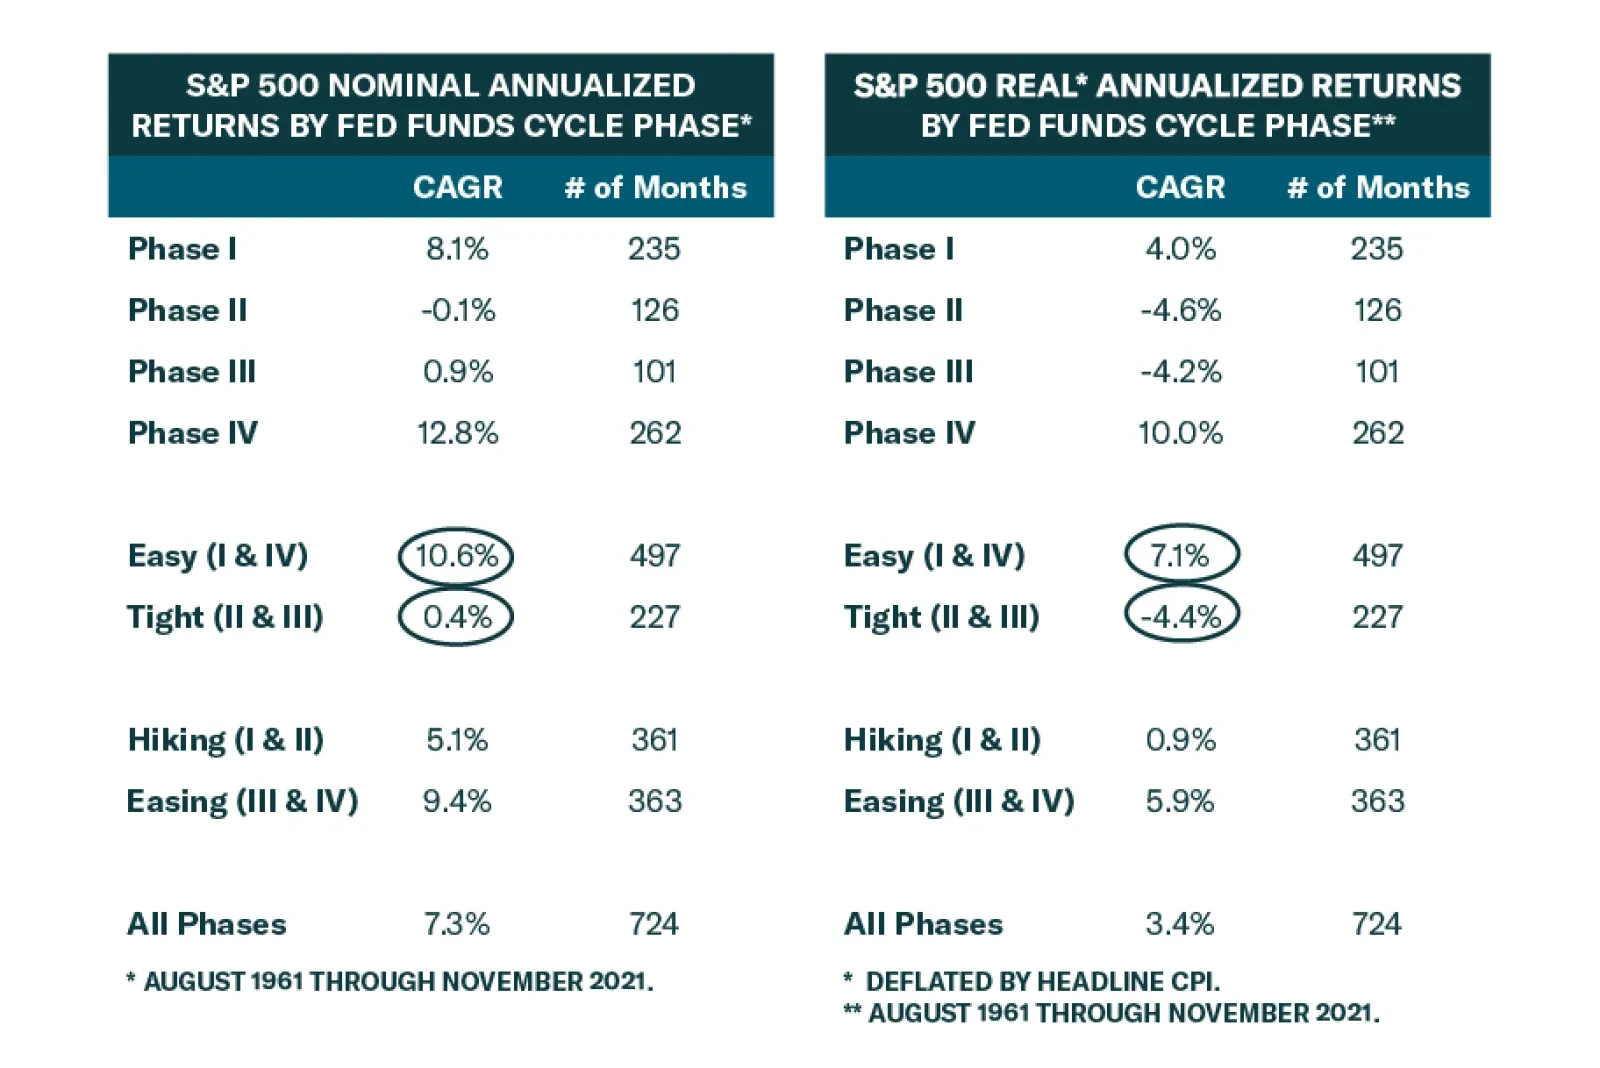
Our estimate bottomed well before the onset of the pandemic, however, and we would argue that the economy currently has far less need for monetary policy support than it did in the aftermath of the crisis. While the financial system reeled, Congress provided stingy fiscal support before taking it back like Lucy pulling the football away from Charlie Brown. In contrast, the US now has a surfeit of fiscal support and even WeWork founder Adam Neumann has ready access to capital. The upshot is that the rates tipping point is miles away and we doubt the Fed can cover that much ground in the space of one year. For Equities, Level Trumps Direction The level, not the direction, of the fed funds rate has driven US equity performance over the 60-year period covered by our equilibrium estimate. The S&P 500 has eked out a 0.4% nominal annualized return across the aggregate 19 years that policy has been tight, by our reckoning, while advancing 10.6% annually over the accumulated 41 years when it has been easy (Table 2). Easy policy’s ten-percentage-point advantage over tight policy leaves cutting rates’ four-point edge over hiking rates in the dust. Table 2Easy Policy Settings Yield An Extra 10 Percentage Points Of Nominal Returns, ...
The Difference Between Tightening And Tight
The Difference Between Tightening And Tight
Table 3... And An Extra 11.5 After Adjusting For Inflation
The Difference Between Tightening And Tight
The Difference Between Tightening And Tight
The easy/tight disparity widens to eleven-and-a-half percentage points when nominal returns are adjusted for inflation. In Phases I and IV, when the fed funds rate is below our estimate of equilibrium, the S&P 500 has generated robust 7.1% real annualized returns while shedding 4.4% in Phases II and III, when the funds rate exceeds our equilibrium estimate (Table 3). Stocks do better on a real basis when the Fed is cutting rates, just as they do on a nominal basis, but the spread is narrower. The level of rates is the key dividing line, not their direction. Investment Implications The empirical record overwhelmingly supports the idea that early-stage rate hikes will not stifle growth or prevent equities from generating ample positive excess returns over Treasuries and cash. Against a backdrop of high and soaring inflation that the economy has only faced twice in the last 50 years (Chart 4), however, it is worth considering whether this time could be different. Whereas most recent rate hike campaigns have patiently aimed to prevent potential inflation pressures from taking root in a robust economy, this one might require the Fed to move urgently to get the genie back in the bottle. Chart 4Be Careful What You Wish For, Central Bankers
Be Careful What You Wish For, Central Bankers
Be Careful What You Wish For, Central Bankers
The potential for urgent rather than incremental action could turn the prevailing positive correlation between stock prices and interest rates negative, as our Chief Emerging Markets Strategist Arthur Budaghyan has warned. If inflation worries choke off animal spirits, multiple de-rating could more than offset typical Phase I earnings gains, sending stocks lower. Although we do not expect multiple contraction in 2022 given the dearth of asset classes with positive expected real returns, we see it as one of the major threats to our risk-friendly positioning. We will be watching out for it, along with adverse pandemic surprises and the possibility that consumption could disappoint, though we will stick with our constructive positioning in the meantime. Doug Peta, CFA Chief US Investment Strategist dougp@bcaresearch.com Footnotes 1 "Fed’s Moves in 2022 Could End the Stock Market’s Pandemic Run", The New York Times (nytimes.com). Accessed January 3, 2022. 2 Friedman likened central banks to a person who excessively turns the hot or the cold tap in the shower when the water temperature does not change immediately, only to shock him/herself once the lag between action and effect closes.
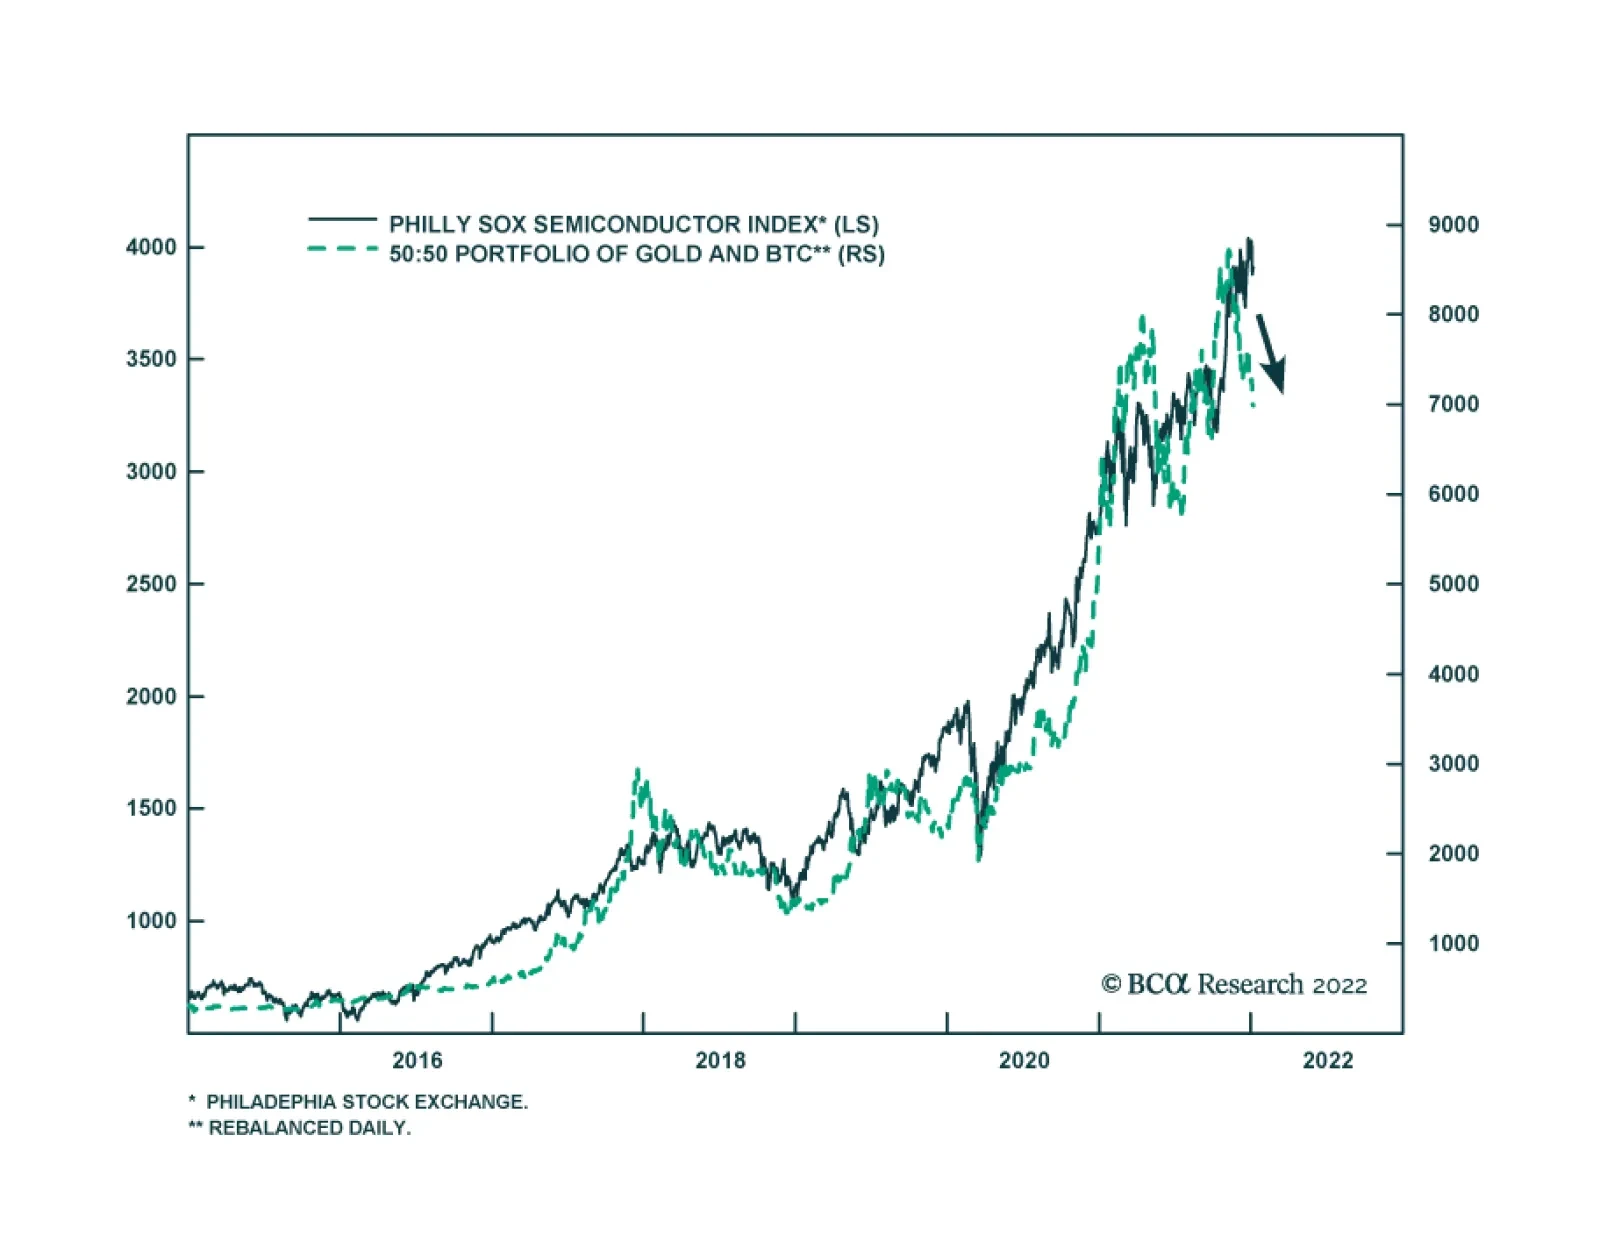
The pandemic has been a boon for semiconductor stocks. The Philadelphia Stock Exchange Semiconductor Index is up 204% since late-March 2020. Ample global liquidity has supported the move higher in semiconductor stocks. As an ultra-cyclical asset,…
The headline figure from the December US employment report produced a negative surprise. Nonfarm payroll employment rose by 199 thousand, which is significantly below expectations of 450 thousand. Despite the disappointing headline figure, the report…
Highlights Global equities are poised to deliver mid-to-high single-digit returns this year, with the outlook turning bleaker in 2023 and beyond. Non-US markets are likely to outperform. We examine the four pillars that have historically underpinned stock market performance. Pillar 1: Technically, the outlook for equities is modestly bullish, as investor sentiment is nowhere near as optimistic as it usually gets near market tops. Pillar 2: The outlook for economic growth and corporate earnings is modestly bullish as well. While global growth is slowing, it will remain solidly above trend in 2022. Pillar 3: Monetary and financial conditions are neutral. The Fed and a number of other central banks are set to raise rates and begin unwinding asset purchases this year. However, monetary policy will remain highly accommodative well into 2023. Pillar 4: Valuations are bearish in the US and neutral elsewhere. Investors should avoid tech stocks in 2022, focusing instead on banks and deep cyclicals, which are more attractively priced. The Bedrock For Equities In assessing the outlook for the stock market, our research has focused on four pillars: 1) Sentiment and other technical factors, which are most pertinent for stocks over short-term horizons of about three months; 2) cyclical fluctuations in economic growth and corporate earnings, which tend to dictate the path for stocks over medium-term horizons of about 12 months; 3) monetary and financial conditions, which are also most relevant over medium-term horizons; and finally 4) valuations, which tend to drive stocks over the long run. In this report, we examine all four pillars, concluding that global equities are likely to deliver mid-to-high single-digit returns this year, with the outlook turning bleaker in 2023 and beyond. Pillar 1: Sentiment And Other Technical Factors (Modestly Bullish) Chart 1US Equities: Breadth Is A Concern
US Equities: Breadth Is A Concern
US Equities: Breadth Is A Concern
Scaling The Wall Of Worry Stocks started the year on a high note, before tumbling on Wednesday following the release of the Fed minutes. Market breadth going into the year was quite poor. Even as the S&P 500 hit a record high on Tuesday, only 57% of NYSE stocks and 38% of NASDAQ stocks were trading above their 200-day moving averages compared to over 90% at the start of 2021 (Chart 1). The US stock market had become increasingly supported by a handful of mega-cap tech stocks, a potentially dangerous situation in an environment where bond yields are rising and stay-at-home restrictions are apt to ease (more on this later). That said, market tops often occur when sentiment reaches euphoric levels. That was not the case going into 2022 and it is certainly not the case after this week's sell-off. The number of bears exceeded the number of bulls in the AAII survey this week and in six of the past seven weeks (Chart 2). The share of financial advisors registering a bullish bias declined by 25 percentage points over the course of 2021 in the Investors Intelligence poll. Option pricing is far from complacent. The VIX stands at 19.6, above its post-GFC median of 16.7. According to the Minneapolis Fed’s market-based probabilities model, the market was discounting a slightly negative 12-month return for the S&P 500 as of end-2021, with a 3.6 percentage-point larger chance of a 20% decline in the index than a 20% increase (Chart 3). Chart 3Option Pricing Is Not Pointing To Elevated Complacency
Option Pricing Is Not Pointing To Elevated Complacency
Option Pricing Is Not Pointing To Elevated Complacency
Chart 2Sentiment Is Not Exceptionally Bullish, Despite The S&P 500 Trading Close To All-Time Highs
Sentiment Is Not Exceptionally Bullish, Despite The S&P 500 Trading Close To All-Time Highs
Sentiment Is Not Exceptionally Bullish, Despite The S&P 500 Trading Close To All-Time Highs
Equities do best when sentiment is bearish but improving (Chart 4). With bulls in short supply, stocks can continue to climb the proverbial wall of worry. Whither The January Effect? Historically, stocks have fared better between October and April than between May and September (Chart 5). One caveat is that the January effect, which often saw stocks rally at the start of the year, has disappeared. In fact, the S&P 500 has fallen in January by an average annualized rate of 5.2% since 2000 (Table 1). Other less well-known calendar effects – such as the tendency for stocks to underperform on Mondays but outperform on the first trading day of each month – have persisted, however.
Chart 4
Chart 5
Table 1Calendar Effects
The Four Pillars Of The Stock Market
The Four Pillars Of The Stock Market
Bottom Line: January trading may be choppy, but stocks should rise over the next few months as more bears join the bullish camp. Last year’s losers are likely to outperform last year’s winners. Pillar 2: Economic Growth And Corporate Earnings (Modestly Bullish) Economic Growth And Earnings: Joined At The Hip The business cycle is the most important driver of stocks over medium-term horizons of about 12 months. The reason is evident in Chart 6: Corporate earnings tend to track key business cycle indicators such as the ISM manufacturing index, industrial production, business sales, and global trade. Chart 6The Business Cycle Is The Most Important Driver Of Stocks Over Medium-Term Horizons
The Business Cycle Is The Most Important Driver Of Stocks Over Medium-Term Horizons
The Business Cycle Is The Most Important Driver Of Stocks Over Medium-Term Horizons
Chart 7PMIs Signaling Above-Trend Growth
PMIs Signaling Above-Trend Growth
PMIs Signaling Above-Trend Growth
Global growth peaked in 2021 but should stay solidly above trend in 2022. Both the service and manufacturing PMIs remain in expansionary territory (Chart 7). The forward-looking new orders component of the ISM exceeded 60 for the second straight month in December. The Bloomberg consensus is for real GDP to rise by 3.9% in the G7 in 2022, well above the OECD’s estimate of trend G7 growth of 1.4% (Chart 8). Global earnings are expected to increase by 7.1%, rising 7.5% in the US and 6.7% abroad (Chart 9). Our sense is that both economic growth and earnings will surprise to the upside in 2022. Chart 9Analysts Expect Single-Digit Earnings Growth
Analysts Expect Single-Digit Earnings Growth
Analysts Expect Single-Digit Earnings Growth
Chart 8
Plenty Of Pent-Up Demand For Both Consumer And Capital Goods US households are sitting on $2.3 trillion in excess savings (Chart 10). Around half of these savings will be spent over the next few years, helping to drive demand. Households in the other major advanced economies have also buttressed their balance sheets. Chart 10Plenty Of Pent-Up Demand
Plenty Of Pent-Up Demand
Plenty Of Pent-Up Demand
After two decades of subdued corporate investment, capital goods orders have soared. This bodes well for capex in 2022. Inventories remain at rock-bottom levels, which implies that output will need to exceed spending for the foreseeable future (Chart 11). On the residential housing side, both the US homeowner vacancy rate and the inventory of homes for sale are near multi-decade lows. Building permits are 11% above pre-pandemic levels (Chart 12). Chart 11Business Investment Should Be Strong In 2022
Business Investment Should Be Strong In 2022
Business Investment Should Be Strong In 2022
Chart 12Residential Construction Will Remain Well Supported
Residential Construction Will Remain Well Supported
Residential Construction Will Remain Well Supported
Chart 13China's Credit Impulse Has Bottomed
China's Credit Impulse Has Bottomed
China's Credit Impulse Has Bottomed
Chinese Growth To Rebound, Europe To Benefit From Lower Natural Gas Prices Chinese credit growth decelerated last year. However, the 6-month credit impulse has bottomed, and the 12-month impulse is sure to follow (Chart 13). Chinese coal prices have collapsed following the government’s decision to instruct 170 mines to expand capacity (Chart 14). China generates 63% of its electricity from coal. Lower energy prices and increased stimulus should support Chinese industrial activity in 2022. Like China, Europe will benefit from lower energy costs. Natural gas prices have fallen by nearly 50% from their peak on December 21st. A shrinking energy bill will support the euro (Chart 15). Chart 14Coal Prices Are Renormalizing In China
Coal Prices Are Renormalizing In China
Coal Prices Are Renormalizing In China
Chart 15A Shrinking Energy Bill Will Support The Euro
A Shrinking Energy Bill Will Support The Euro
A Shrinking Energy Bill Will Support The Euro
Chart 16
Omicron Or Omicold? While the Omicron wave has led to an unprecedented spike in new cases across many countries, the economic fallout will be limited. The new variant is more contagious but significantly less lethal than previous ones. In South Africa, it blew through the population without triggering a major increase in mortality (Chart 16). Preliminary data suggest that exposure to Omicron confers at least partial immunity against Delta. The general tendency is for viral strains to become less lethal over time. After all, a virus that kills its host also kills itself. Given that Omicron is crowding out more dangerous strains such as Delta, any future variant is likely to emanate from Omicron; and odds are this new variant will be even milder than Omicron. Meanwhile, new antiviral drugs are starting to hit the market. Pfizer claims that its new drug, Paxlovid, cuts the risk of hospitalization by almost 90% if taken within five days from the onset of symptoms. Bottom Line: While global growth has peaked and the pandemic remains a risk, growth should stay well above trend in the major economies in 2022, fueling further gains in corporate earnings and equity prices. Pillar 3: Monetary And Financial Factors (Neutral) Chart 17The Overall Stance Of Monetary Policy Will Not Return To Pre-Pandemic Levels For At Least Another 12 Months
The Overall Stance Of Monetary Policy Will Not Return To Pre-Pandemic Levels For At Least Another 12 Months
The Overall Stance Of Monetary Policy Will Not Return To Pre-Pandemic Levels For At Least Another 12 Months
Tighter But Not Tight Monetary and financial factors help govern the direction of equity prices both because they influence economic growth and also because they affect the earnings multiple at which stocks trade. There is little doubt that a number of central banks, including the Federal Reserve, are looking to dial back monetary stimulus. However, there is a big difference between tighter monetary policy and tight policy. Even if the FOMC were to raise rates three times in 2022, as the market is currently discounting, the fed funds rate would still be half of what it was on the eve of the pandemic (Chart 17). Likewise, even if the Fed were to allow maturing assets to run off in the middle of this year, as the minutes of the December FOMC meeting suggest is likely, the size of the Fed’s balance sheet will probably not return to pre-pandemic levels until the second half of this decade. A Higher Neutral Rate We have argued in the past that the neutral rate of interest in the US is higher than widely believed. This implies that the overall stance of monetary policy remains exceptionally stimulative. Historically, stocks have shrugged off rising bond yields, as long as yields did not increase to prohibitively high levels (Table 2). Table 2As Long As Bond Yields Don’t Rise Into Restrictive Territory, Stocks Will Recover
The Four Pillars Of The Stock Market
The Four Pillars Of The Stock Market
If the neutral rate ends up being higher than the Fed supposes, the danger is that monetary policy will stay too loose for too long. The question is one of timing. The good news is that inflation should recede in the US in 2022, as supply-chain bottlenecks ease and spending shifts back from goods to services. The bad news is that the respite from inflation will not last. As discussed in Section II of our recently-published 2022 Strategy Outlook, inflation will resume its upward trajectory in mid-2023 on the back of a tightening labor market and a budding price-wage spiral. This second inflationary wave could force the Fed to turn much more aggressive, spelling the end of the equity bull market. Bottom Line: While the Fed is gearing up to raise rates and trim the size of its balance sheet, monetary policy in the US and in other major economies will remain highly accommodative in 2022. US policy could turn more restrictive in 2023 as a second wave of inflation forces a more aggressive response from the Fed. Pillar 4: Valuations (Bearish In The US; Neutral Elsewhere) US Stocks Are Looking Pricey… While valuations are a poor timing tool in the short run, they are an excellent forecaster of stock prices in the long run. Chart 18 shows that the Shiller PE ratio has reliably predicted the 10-year return on equities. Today, the Shiller PE is consistent with total real returns of close to zero over the next decade.
Chart 18
Investors’ allocation to stocks has also predicted the direction of equity prices (Chart 19). According to the Federal Reserve, US households held a record high 41% of their financial assets in equities as of the third quarter of 2021. If history is any guide, this would also correspond to near-zero long-term returns on stocks. Chart 19Valuations Matter For Long-Term Returns (II)
Valuations Matter For Long-Term Returns (II)
Valuations Matter For Long-Term Returns (II)
… But There Is More Value Abroad Valuations outside the US are more reasonable. Whereas US stocks trade at a Shiller PE ratio of 37, non-US stocks trade at 20-times their 10-year average earnings. Other valuation measures such as price-to-book, price-to-sales, and dividend yield tell a similar story (Chart 20). Chart 20AUS Stocks Are Trading At A Significant Premium To Their Non-US Peers (I)
US Stocks Are Trading At A Significant Premium To Their Non-US Peers (I)
US Stocks Are Trading At A Significant Premium To Their Non-US Peers (I)
Chart 20BUS Stocks Are Trading At A Significant Premium To Their Non-US Peers (II)
US Stocks Are Trading At A Significant Premium To Their Non-US Peers (II)
US Stocks Are Trading At A Significant Premium To Their Non-US Peers (II)
Cyclicals And Banks Overrepresented Abroad Our preferred sector skew for 2022 favors non-US equities. Increased capital spending in developed economies and incremental Chinese stimulus should boost industrial stocks and other deep cyclicals, which are overrepresented outside the US (Table 3). Banks are also heavily weighted in overseas markets; they should also do well in response to faster-than-expected growth and rising bond yields (Chart 21). Table 3Deep Cyclicals And Financials Are Overrepresented Outside The US
The Four Pillars Of The Stock Market
The Four Pillars Of The Stock Market
Chart 21Rising Bond Yields Will Help Bank Shares
Rising Bond Yields Will Help Bank Shares
Rising Bond Yields Will Help Bank Shares
Bottom Line: Valuations are more appealing outside the US, and with deep cyclicals and banks set to outperform tech over the coming months, overseas markets are the place to be in 2022. Peter Berezin Chief Global Strategist peterb@bcaresearch.com Global Investment Strategy View Matrix
Image
Special Trade Recommendations
Image
Current MacroQuant Model Scores
Image
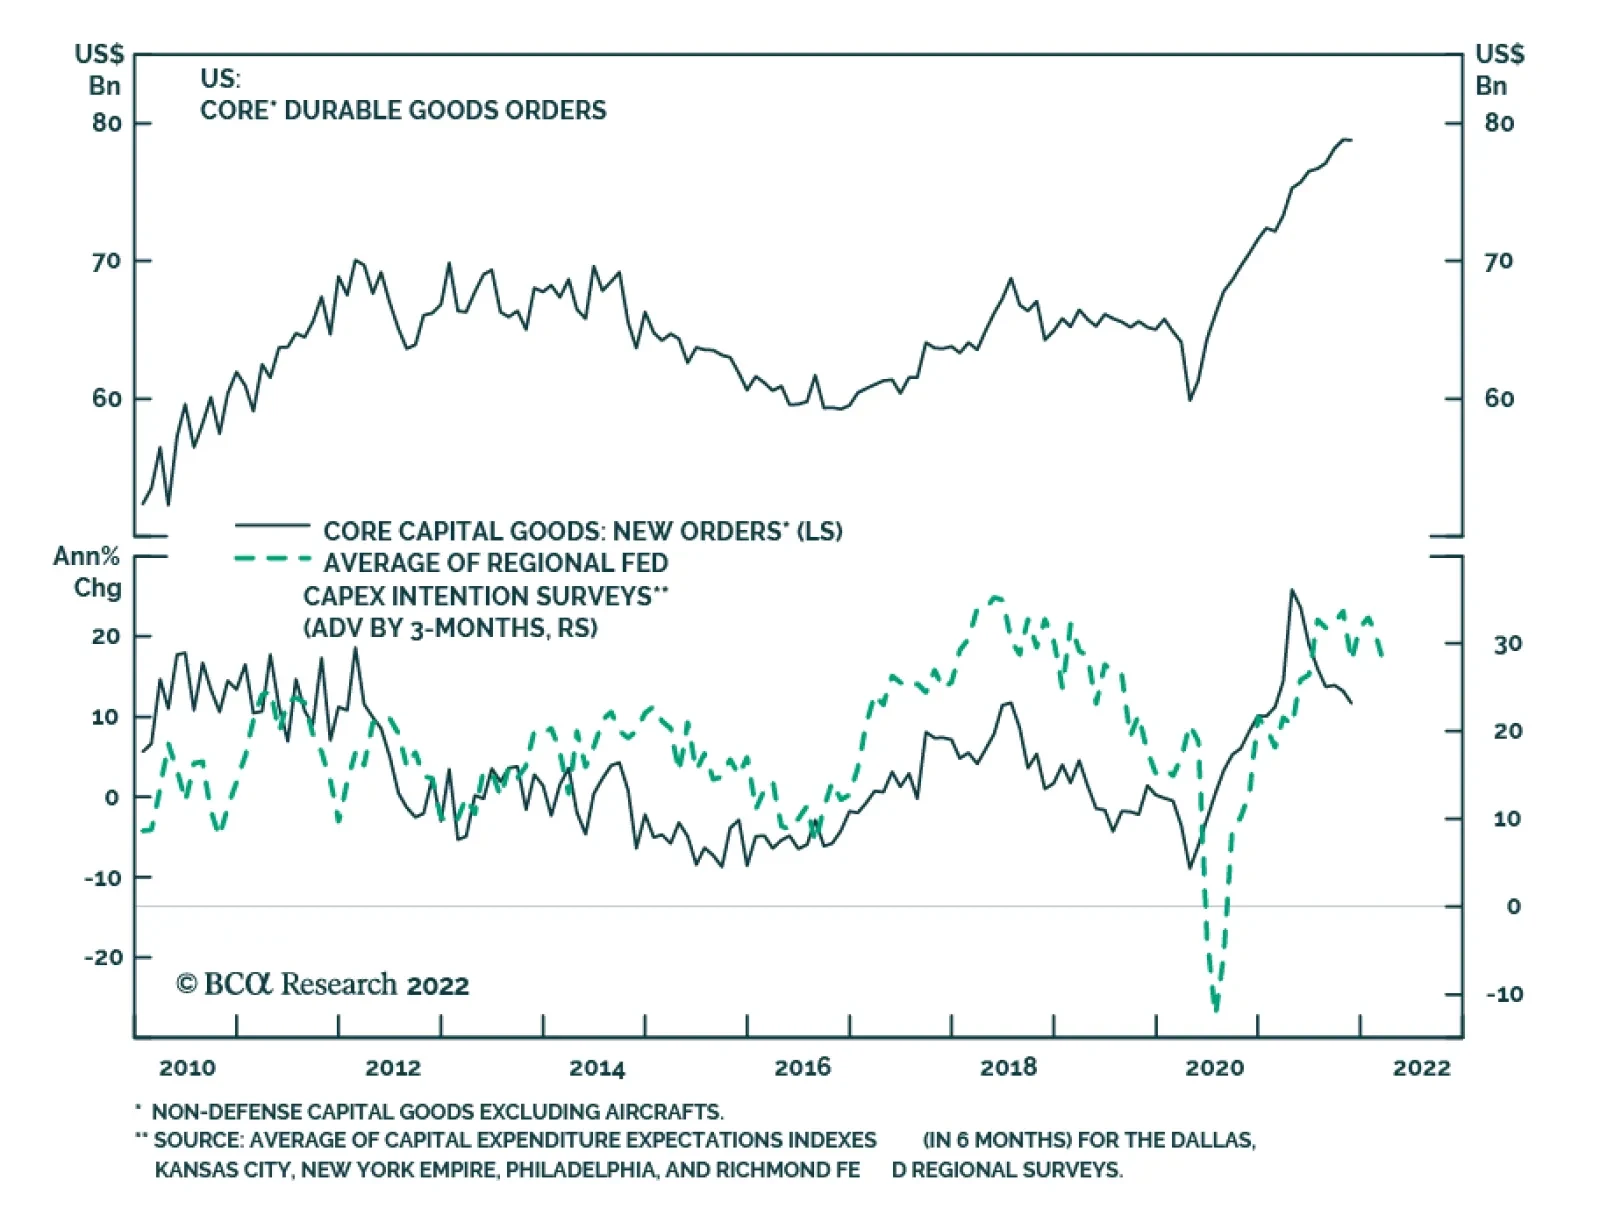
US factory orders increased by 1.6% in November – a slight positive surprise to expectations of a 1.5% rise, and an acceleration from October’s upwardly revised 1.2%. New orders for core capital goods (non-defense capital goods, excluding aircraft) were…
The December FOMC meeting minutes reinforced the Fed’s hawkish pivot and sent a chill down Wall Street on Wednesday. Unsurprisingly, the equity selloff was led by long-duration, interest rate sensitive sectors. The question facing investors going forward is…
Upgrading Airlines
Upgrading Airlines
Following another sell-off, S&P airlines have been regaining some altitude of late despite US Covid cases and hospitalizations rising. The surge in Omicron infections appears to be priced in. Airlines have underperformed S&P 500 by about 20% over the past 13 weeks. The market is expecting the virus story to be over soon and is slowly rotating into the beaten down industries. One of the reasons for the optimistic outlook is likely due to the fact that the Omicron variant is milder. At the same time, there are no lockdowns in the US, and Americans are learning how to live with Covid on a permanent basis. Case in point, holiday travel has exceeded the pre-pandemic peak. We are also getting closer to the point of the white-collar workers returning to the office – hope is that business travel will pick up shortly after – which will benefit airlines stocks. True, international travel still weighs on the industry as quite a few European and Asian countries have reinstituted the lockdowns, but those headwinds are likely to dissipate over the course of 2022. Bottom Line: The time is ripe to start nibbling at the S&P airlines index.