United States

Highlights Investors and consumers expect that inflation will remain quite high over the next year, but they are unconcerned that upward price pressures will last: According to surveys and market prices, inflation will exceed 4% next year before subsiding over the longer term to the comfortable levels of the last two decades. The Fed also views elevated inflation as a near-term phenomenon and accordingly expects to hike the fed funds rate at a deliberate pace: The Fed is on the same page as the hoi polloi, and is not gearing up to remove accommodation with any particular haste. While the decade following the financial crisis demonstrated that extremely easy monetary policy does not by itself promote high inflation, the landscape has changed: A decade of ZIRP and QE failed to produce any dire effects, but it remains to be seen how extreme monetary and fiscal accommodation will interact. We expect the bull market will end once the Fed falls behind the curve on inflation and is forced to tighten monetary policy aggressively to catch up: We think the bull has another year to run, but excessive stimulation will eventually bring about its demise. Feature For most of the year, every discussion with our investor-clients has eventually worked its way around to inflation. How high is it going to go? How long will it last? What will it mean for the economy? What will it mean for stocks? How will the Fed react? As the year-over-year change in the Consumer Price Index has climbed steadily higher, breaking above 6% last month for the first time in 31 years (Chart 1), the tenor of the conversations has shifted. Investors have come to recognize that the economy is subject to upward price pressures that are more than the temporary by-product of pandemic base effects. Inflation is nonetheless still largely viewed as a temporary phenomenon that will fade once reopening supply bottlenecks can be resolved. While markets are resigned to another year of high inflation, they are secure in the notion that the disinflationary currents of the last several decades will squelch them over the longer term. Chart 1Long Time, No See
Long Time, No See
Long Time, No See
The tension between the competing ideas that both inflationary and disinflationary currents are real sets up a potential market showdown. If it is only a matter of time before disinflationary forces return to smother today’s post-COVID disruptions, the widely shared consensus view that the fed funds rate will meander its way to a peak of 2% will be validated. The equity bull market will continue, albeit at a slower pace, until it dies of natural causes. Markets could be in for a rude awakening, however, if the forces supporting higher prices outlast the pandemic and overcome the long-running disinflationary trend. This report considers how inflation could ruin the party. Our base-case view is that the Fed will find itself behind the curve. When it does, it will be forced to tighten monetary policy fast and furious, moving more swiftly to a higher terminal fed funds rate than markets currently expect. That will bring down the curtain on the bull market in risk assets and it may also spark the next recession, but we think the good times will last for at least one more year. What Markets Expect: Inflation Despite all the attention higher prices have drawn, investors haven’t gotten too worked up over them. Although they’ve made considerable revisions to their near-term expectations, their expectations for inflation ten years from now haven’t budged since the start of the year. As the Treasury1 (Chart 2) and CPI swaps (Chart 3) markets show, big consumer price increases are expected to be concentrated in the next year, come off the boil in year two and then slowly cool over the next few years. At the back half of the 10-year curve, year-over-year CPI increases are expected to settle into the range that prevailed during the nineties’ and early 2000s’ inflation moderation.
Chart 2
Chart 3
Financial markets do not exist in a vacuum, of course, and the expectations of participants in the real economy matter as well. The University of Michigan’s consumer survey indicates that households’ expectations accord with financial markets’ (Chart 4): inflation will be uncomfortably high over the next year but an afterthought five years from now. Whether the phenomenon is called adaptive expectations or recency bias, everyone’s – investors’, consumers’, businesses’, and economists’ (Chart 5) – expectations of the future are colored by the recent past. It is not a stretch to envision consumer prices rising by more than 4% in 2022 after having watched them surge since March, but apparently economic participants will need to see them remain elevated for a longer stretch before they can picture inflation enduring for two or three years, much less five to ten years. Chart 45% Now, But Only 3% Later
5% Now, But Only 3% Later
5% Now, But Only 3% Later
Chart 5Reliably Anchoring To The Recent Past
Reliably Anchoring To The Recent Past
Reliably Anchoring To The Recent Past
What Markets Expect: Fed Policy Chart 6Faster, Yes; Farther, No
Faster, Yes; Farther, No
Faster, Yes; Farther, No
If inflation isn’t expected to persist at an elevated rate for an extended period, there’s no reason to expect that the Fed will aggressively tighten monetary policy. Higher-than-expected inflation readings have led money markets to bring their first rate hike ETA (the liftoff date) forward to next July, and to price in two rate hikes in the second half of next year (Chart 6, top panel). They continue to expect that the Fed will conclude its tightening cycle once the fed funds rate is around 2% (the terminal rate). They also expect that the Fed will take its time getting to that terminal rate, hiking by no more than 75 basis points (“bps”) in a single year (Chart 6, bottom two panels), roughly in line with the 100-bps annual pace of 2017 and 2018. The Fed concurs. As per the latest Summary of Economic Projections (SEP), released after the September FOMC meeting, the 18 board members and regional presidents casting votes expect the FOMC to take its time hiking rates. With exactly half of the voters calling for no rate hikes next year, the median and mean expectations were for one-half and two-thirds of a 25-bps rate hike in 2022, respectively (Chart 7A). By the end of 2023, the median and mean SEP voter expects a cumulative 3.5 and 3.1 25-bps rate hikes, respectively (Chart 7B). By the end of 2024, median and mean expectations are for a cumulative 6.5 and 6.1 25-bps rate hikes, respectively (Chart 7C).
Chart 7
Chart 7
Chart 7
Table 1Same Terminal Rate, Different Liftoff Date
How Will The Party End?
How Will The Party End?
Conditions have changed since late-September upon the release of September and October inflation data, though Chair Powell didn’t give any ground in his press conference following the November 3rd meeting. Rounding the expectations at each year-end period as of the September 22nd meeting, the median SEP voter expected zero or one rate hike in 2022, three in 2023 and three in 2024, pushing the top end of the fed funds rate range to 2% as of the end of 2024. Market expectations have moved since the last SEP, with the overnight index swap curve going from zero rate hikes in the next twelve months to two, and from two rate hikes in the next 24 months to five, but financial markets and the Fed remain on the same page (Table 1). A Kinder, Gentler Fed Emboldened by the experience of the last expansion, in which worrisome inflation did not materialize despite a zero fed funds rate and 50-year lows in unemployment, the Fed has embarked on a course quite different from the one the late Paul Volcker might have charted. Nagged by persistently low post-crisis inflation, the FOMC has decided that pursuing an average inflation target that makes up for previous shortfalls will best allow it to meet its price stability mandate. Letting undershoot bygones be bygones paved the way for inflation expectations to slide, constraining its ability to stimulate the economy at the zero bound. To re-anchor expectations in its preferred 2.3-2.5% range, and give a zero fed funds rate more zip, the FOMC must convince markets that it will occasionally let inflation run hot. A more aggressive pursuit of its full employment mandate, as outlined in the August 2020 revisions to the FOMC’s Statement on Longer-Run Goals and Monetary Policy Strategy, should also help nudge expectations upward. Per the revisions commentary on the Fed’s website, “The previous expansion demonstrated that a strong labor market can be sustained without inducing an unwanted increase in inflation. To the contrary, when unemployment fell to levels that were previously thought to be unsustainable, the labor market proved remarkably adaptable, bringing many benefits to families and communities that all too often had been left behind. Accordingly, the new Statement … only … [pledges to address] ‘shortfalls of employment from its maximum level’ rather than the [previous] ‘deviations from its maximum level’[.] This change signals that high employment, in the absence of unwanted increases in inflation or the emergence of other risks that could impede the attainment of the Committee’s goals, will not by itself be a cause for policy concern.”2 The Fly In The Ointment Chart 8Wall Street And Main Street
Wall Street And Main Street
Wall Street And Main Street
While we acknowledge that the September 22nd SEP may be somewhat out of date as a guide to the board members’ and regional presidents’ fed funds rate expectations, the easier stance outlined in the revised monetary policy strategy statement remains very much in effect. The upshot, from our perspective, is that the FOMC intends to be behind the inflation curve in the coming rate-hiking cycle. If inflation remains contained after lingering pandemic dislocations are resolved, the behind-the-curve takeaway will not be all that impactful for investors. After all, those who positioned for dollar debasement and runaway inflation when the Bernanke Fed introduced QE and ZIRP were clobbered by investors who loaded up on risk assets and blithely rode easy money tailwinds higher. There is a critical difference this time, however, beyond the increasing magnitude of the Fed’s accumulated asset purchases. Pandemic fiscal stimulus has dwarfed the comparatively meager fiscal response to the global financial crisis. And going forward, the Biden administration’s spate of ambitious spending proposals contrasts sharply with the Obama administration’s deficit reduction focus. The post-crisis era has served as a natural experiment on the effects of unprecedented monetary accommodation on economic activity and consumer price inflation. Asset prices surged, buoyed by a negative real fed funds rate and a ballooning Fed balance sheet (Chart 8, top panel), but the rate of growth in consumption (Chart 8, bottom panel) was unchanged. Although household net worth gains lead consumption growth, the vast majority of financial assets are held by households with a low marginal propensity to consume. Asset price inflation doesn’t necessarily lead to consumer price inflation because it doesn’t necessarily have an observable impact on aggregate demand. Fiscal stimulus is different, however. The stimulus packages created to counter the economic effects of COVID-19 put money directly in the hands of households with high marginal propensities to consume. They have been consuming avidly since emerging from their spring 2020 lockdowns (Chart 9) and we expect that they will continue to do so until they’ve run down at least one half of their $2.3 trillion of excess pandemic savings. Rising wages may additionally promote demand, as will the baby boomers’ shift into their peak consumption years, along with the massive investment required to meet green energy goals. Chart 9Consumers Have Momentum (And The Savings And Borrowing Capacity To Sustain It)
Consumers Have Momentum (And The Savings And Borrowing Capacity To Sustain It)
Consumers Have Momentum (And The Savings And Borrowing Capacity To Sustain It)
Demand was sluggish for an entire decade following the GFC, but it appears as if it will be quite robust for a while after the pandemic. We believe that aggregate demand is on a course to exceed aggregate supply after reopening supply chain issues are resolved. At that point, the transitory inflation view will no longer be credible, and the Fed may find itself having to play catch up. When it does, it will have to hike rates more and faster than financial markets expect. Once the Fed has shifted into fast and furious mode, or markets develop a widespread conviction that it will, the bull markets in risk assets will end and the expansion might, too. In the meantime, setting investment strategy will depend on how long it takes for the inflation inflection point to arrive. We do not yet think the inflection point is in sight and therefore continue to recommend that investors with a twelve-month timeframe overweight equities and credit in multi-asset portfolios. We remain on the alert, however, and will shift our view if events move faster than we currently expect. We would rather leave some upside on the table than stay at the party too long. Doug Peta, CFA Chief US Investment Strategist dougp@bcaresearch.com Footnotes 1 Off-the-run Treasury maturities do not trade all that well, and TIPS other than 1-, 2-, 5- and 10-year maturities are even less liquid. The TIPS inflation expectations curve (Chart 2) is therefore less reliable than the CPI swaps curve (Chart 3) at individual points, but it confirms the broad direction of investors’ inflation expectations. 2 Question 6, How has the review altered how the Federal Reserve will pursue its maximum employment objective? Accessed November 22, 2021. Emphasis added. Federal Reserve Board - Q&As.
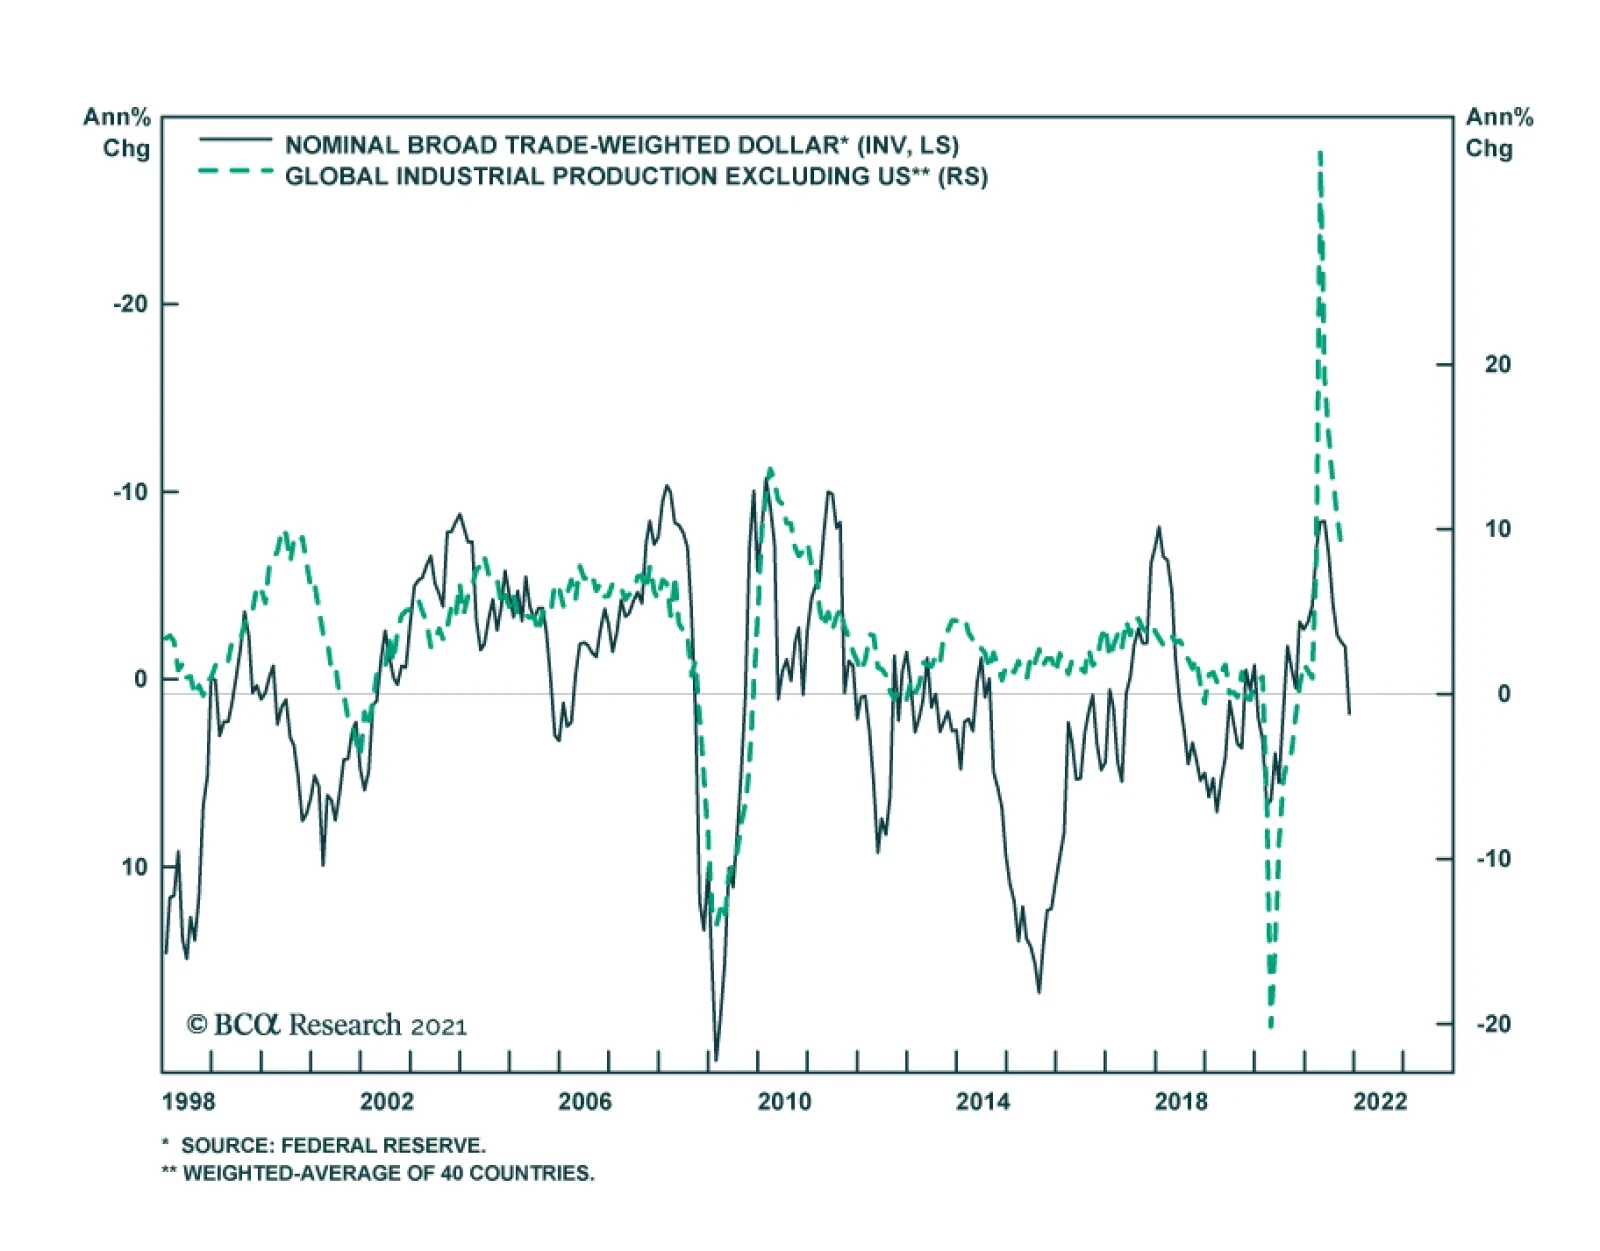
BCA Research’s Foreign Exchange Strategy service is shifting its near-term target for the DXY to 98 from 95. The market is now pricing in that the Fed will raise interest rates much faster, compared to earlier this year. According to the…
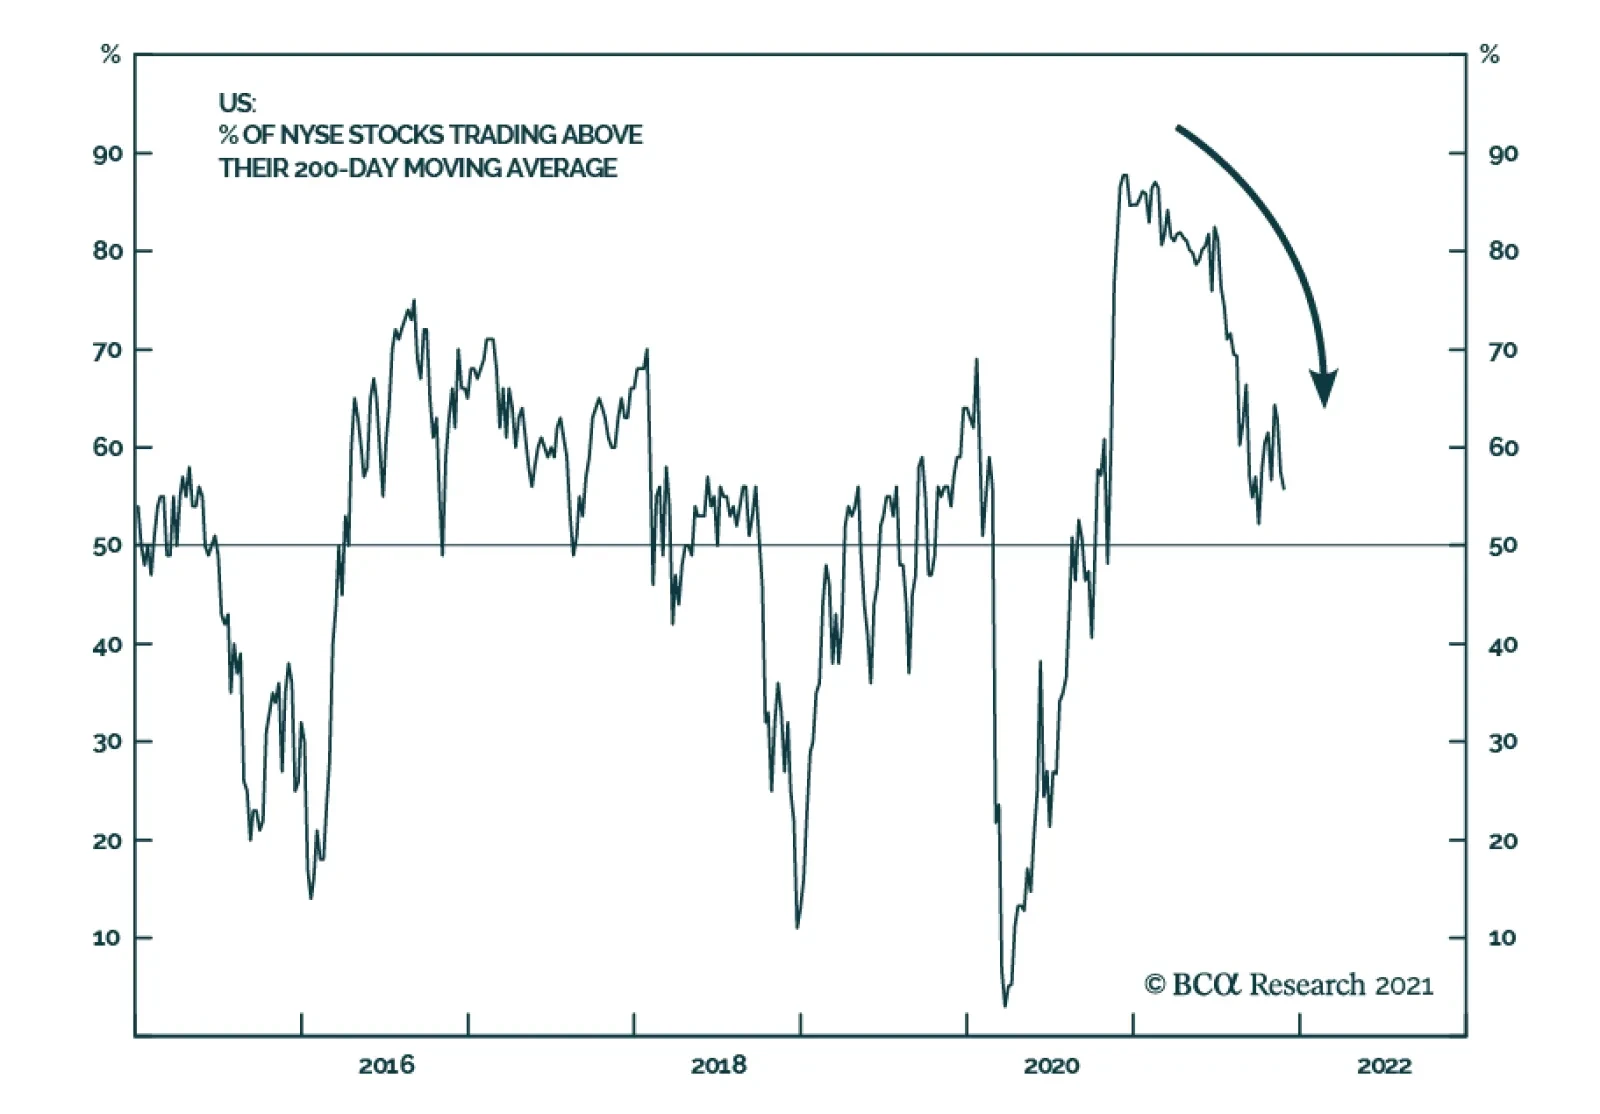
US equity breadth measured as the share of stocks trading above their 200-day moving average has collapsed since earlier this year. This development raises the question whether a constructive outlook on US equities is still appropriate. At 21.5x forward…

The November FOMC meeting minutes released on Wednesday reveal that there is a greater willingness among Fed officials to accelerate the pace of tapering when the current target ends in December. Moreover, San Francisco Fed President Mary Daly’s Wednesday…

The University of Michigan Survey of Consumers revealed that American household sentiment deteriorated in November. The headline index dropped 4.3 points to 67.4 – the lowest since November 2011. The decline was driven by weakness in both current conditions…

The US Personal Income and Outlays report for October sent a reassuring message about US household balance sheets. Personal income rose 0.5% m/m and beat expectations of a 0.2% m/m increase. Similarly, personal spending accelerated from 0.6% m/m to 1.3% m/m.…
According to BCA Research’s US Bond Strategy service, investors should stay overweight spread product in US bond portfolios. Gross corporate leverage has plunged during the past few quarters. This drop explains why there have been so few corporate defaults…

Since the beginning of the year, a confluence of both supply- and demand-side factors contributed to shortages. On the one hand, the pandemic caused demand for goods to surge as consumers shifted their spending patterns away from services during lockdowns.…
Highlights Fed: The Fed is embroiled in a debate about whether to move more quickly toward rate hikes. Our expectation is that the Fed will remain relatively dovish unless 5-year/5-year forward inflation expectations show signs of breaking out. We continue to expect liftoff in December 2022. TIPS: We recommend a neutral allocation to long-maturity (10-year+) TIPS versus nominal Treasuries and an underweight allocation to short-maturity TIPS versus nominal Treasuries. Investors should short 2-year TIPS outright, enter 2/10 inflation curve steepeners and 2/10 real (TIPS) curve flatteners. Corporate Bonds: The amount of debt relative to equity on corporate balance sheets is the lowest it has been in several years. We expect that corporate balance sheet health will start to deteriorate next year as capital spending and debt issuance ramp up. However, it will be some time before balance sheet health threatens higher defaults or wider corporate spreads. Stay overweight spread product in US bond portfolios. Should The Fed Take Out Some Insurance? Inflation has arrived much earlier in the cycle than usual and it has put the Fed in a tough spot. The so-called Misery Index – the sum of the unemployment and inflation rates – has moved in the wrong direction this year (Chart 1), and there is increasing disagreement about how the Fed should respond. Chart 1A Setback For The Fed
A Setback For The Fed
A Setback For The Fed
The Case For Buying Insurance On the one hand, some people – both inside and outside the FOMC – are calling for the Fed to move more quickly toward tightening. One notable external voice is the former Chair of the Council of Economic Advisers Jason Furman who just published a report calling for the Fed to speed up the pace of tapering so that it can prepare markets for rate hikes starting in the first half of 2022.1 Such a policy shift would significantly impact bond markets, which are currently priced for Fed liftoff to occur at the July 2022 FOMC meeting and for 69 bps of rate hikes in total by the end of 2022 (Chart 2). This equates to 100% odds of two 25 basis point rate hikes in 2022, with a 92% chance of a third. Chart 22022 Rate Expectations
2022 Rate Expectations
2022 Rate Expectations
Furman makes the point that the Fed has already achieved its new Flexible Average Inflation Target (FAIT). The PCE deflator has averaged more than 2% annual growth since the target was adopted in August 2020 and even since just before the pandemic (Chart 3). Inflation has still averaged only 1.7% annual growth during the post-Great Financial Crisis period, but FOMC participants have generally focused on shorter look-back periods when discussing the FAIT framework. Chart 3The Fed's Flexible Average Inflation Target In Action
The Fed's Flexible Average Inflation Target In Action
The Fed's Flexible Average Inflation Target In Action
In addition to its FAIT framework, the Fed has articulated a three-pronged test for when it will lift rates. The Fed has promised to only lift rates once (i) PCE inflation is above 2%, (ii) PCE inflation is expected to remain above 2% for some time and (iii) labor market conditions have reached levels consistent with “maximum employment”. Furman argues that the Fed should abandon this three-pronged liftoff test on the grounds that it leaves no room for assessing how far inflation is from its goal. For example, Furman says that if we take the Fed’s guidance literally then “it would not lift rates in the face of a 10 percent inflation rate if the unemployment rate was even 0.2 percentage points above its full employment level.” Chart 4Short-term Inflation Expectations
Short-term Inflation Expectations
Short-term Inflation Expectations
Effectively, Furman is arguing for the Fed to take out some insurance against the risk of long-lasting inflationary pressures. Inflation is high right now. It may come back down naturally, but it may not. Furman argues that it makes sense for the Fed to marginally tighten policy in the meantime to lessen the risk of falling behind the curve and having to play catch-up. Fed Governor Christopher Waller seems to agree with most of Furman’s arguments. Waller also argued for speeding up the pace of tapering in a recent speech, and while he didn’t go so far as to say that the Fed should abandon its maximum employment test for liftoff, he implied that his personal definition of “maximum employment” could be achieved very soon.2 Waller said that after “adjusting for early retirements, we are only 2 million jobs short of where we were in February 2020”. This would suggest that just four more months of +500k employment gains, like we saw in October, would be enough for Waller to argue for rate increases. In his speech, Waller also mentioned the risk he sees from rising inflation expectations. He specifically pointed to elevated readings from the 5-year TIPS breakeven inflation rate, the New York Fed Survey of Consumers’ 3-year expectation, and the University of Michigan Survey’s 1-year expectation (Chart 4). Waller cautioned that: [I]f these measures were to continue moving upward, I would become concerned that expectations would lead households to demand higher wages to compensate for expected inflation, which could raise inflation in the near term and keep it elevated for some time. This possibility is a risk to the inflation outlook that I’m watching carefully. The Case Against Insurance San Francisco Fed President Mary Daly sits on the other side of the argument. She argued against the Fed taking preemptive action to tame inflation in a recent speech.3 Her main argument is that rate hikes would do little to lower inflation in the near-term and may end up harming the economy down the road: Chart 5Long-term Inflation Expectations
Long-term Inflation Expectations
Long-term Inflation Expectations
Monetary policy is a blunt tool that acts with a considerable lag. So, raising rates today would do little to increase production, fix supply chains, or stop consumers from spending more on goods than on services. But it would curb demand 12 to 18 months from now. Should current high inflation readings and worker shortages turn out to be COVID-related and transitory, higher interest rates would bridle growth, slow recovery in the labor market and unnecessarily sideline millions of workers. Like Waller, Daly also pointed to possible risks from rising inflation expectations. If the high readings on inflation last long enough, they could seep into our psychology and change our expectations about future inflation. Households would then expect prices to keep rising and ask for higher wages to offset that. Businesses, of course, would pass those increases on to consumers in the form of higher prices, causing workers to ask for even higher wages. And on it would go, in a vicious wage-price spiral that would end well for no one. However, unlike Waller, Daly said that “there is little evidence” that such an expectations-driven spiral is starting to take hold. To make her point, Daly stressed that long-term inflation expectations remain well-anchored near levels consistent with the Fed’s target. This is certainly true. Five-to-ten year ahead inflation expectations, whether from survey responses or derived from TIPS prices, have been remarkably stable during inflation’s recent surge (Chart 5). This would seem to suggest that people generally believe that current high inflation will fade over time, and that the Fed’s medium-term inflation target is not at risk. The BCA View Our sense is that there are a number of FOMC participants in both the hawkish and dovish camps. But for the time being, the fact that 5-year/5-year forward inflation expectations remain well-anchored tips the scale in favor of the doves. As a result, the Fed will watch the incoming data as it tapers asset purchases between now and June. If 5-year/5-year forward inflation expectations remain stable during that period, the Fed will wait until its “maximum employment” goal is met before lifting rates. However, if the 5-year/5-year forward TIPS breakeven inflation rate rises above 2.5%, the doves will capitulate and abandon the “maximum employment” liftoff target. The committee will move quickly toward tightening to stave off the sort of wage/price spiral described by both Waller and Daly. Our own view is that realized inflation will trend lower between now and next June. This will prevent 5-year/5-year forward inflation expectations from rising and will push down shorter-dated inflation expectations. As a result, the Fed will wait until its “maximum employment” target is met before lifting rates. We continue to think the first rate hike is most likely to occur at the December 2022 FOMC meeting, slightly later than what is currently priced in the market. On Inflation And TIPS Valuation We continue to recommend a neutral allocation to long-maturity (10-year+) TIPS versus nominal Treasuries. While there is a risk that a lengthy period of high inflation will eventually lead to a break-out in long-maturity TIPS breakeven inflation rates, that risk must be weighed against the fact that our TIPS Breakeven Valuation Indicator shows that the 10-year TIPS breakeven inflation rate is too high relative to different measures of underlying inflation (Chart 6). Chart 6TIPS Are Expensive Relative To Nominals
TIPS Are Expensive Relative To Nominals
TIPS Are Expensive Relative To Nominals
Our TIPS Breakeven Valuation Indicator has a strong track record, with readings between -1 and -0.5 usually coinciding with a subsequent drop in the 10-year TIPS breakeven inflation rate (Table 1). Table 1TIPS Valuation Indicator Track Record
The Fed’s Inflation Problem
The Fed’s Inflation Problem
Moreover, we continue to think that inflation is very likely to trend down during the next 6-12 months. The most important driver of today’s high inflation rate has been a remarkable surge in core goods inflation, from near 0% prior to the pandemic to 8.5% today (Chart 7). This jump in core goods prices is explained by a shift in the composition of consumer spending away from services and toward goods (Chart 8). This shift started during the worst of the pandemic when spending on services was not an option. Households diverted their spending toward goods at a time when COVID prevented factories from running at full capacity. Chart 7Goods Inflation
Goods Inflation
Goods Inflation
Chart 8Consumer Spending: Goods v. Services
Consumer Spending: Goods v. Services
Consumer Spending: Goods v. Services
Our sense is that as the impact of the pandemic fades, we will see the composition of spending shift back toward services and firms will also be able to increase capacity. The result will be a drop in core goods inflation during the next 6-12 months, one that is significant enough to send the overall inflation rate lower. In fact, there are already signs that inflation is close to peaking. The Baltic Dry Index – an index that measures the cost of transporting raw materials – has plunged (Chart 9), and other measures of the price of shipping containers are starting to top out (Chart 9, bottom 2 panels). All of these indicators tracked inflation’s recent rise and are now signaling an easing of bottlenecks in the goods supply chain. The upshot from an investment perspective is that falling inflation will keep a lid on long-maturity TIPS breakeven inflation rates during the next 6-12 months. It will also send short-maturity TIPS breakeven inflation rates lower, and we recommend an underweight allocation to TIPS versus nominal Treasuries at the front-end of the curve. The top panel of Chart 10 shows that the 2-year TIPS breakeven inflation rate has greatly exceeded the Fed’s target range. In contrast, the 10-year TIPS breakeven inflation rate is only slightly above target. If we assume a base case scenario where both rates trend toward the middle of the Fed’s target range during the next 12 months, and a base case scenario for nominal yields consistent with the Fed lifting rates in December 2022 and then hiking at a pace of 100 bps per year until reaching a 2.08% terminal rate (Chart 10, bottom panel), we see that the 2-year real yield has a lot of upside during the next 12 months (Chart 10, panel 2). This is true both in absolute terms and relative to the 10-year real yield. Chart 9Peak Shipping Costs
Peak Shipping Costs
Peak Shipping Costs
Chart 10The Upside In Real Yields
The Upside In Real Yields
The Upside In Real Yields
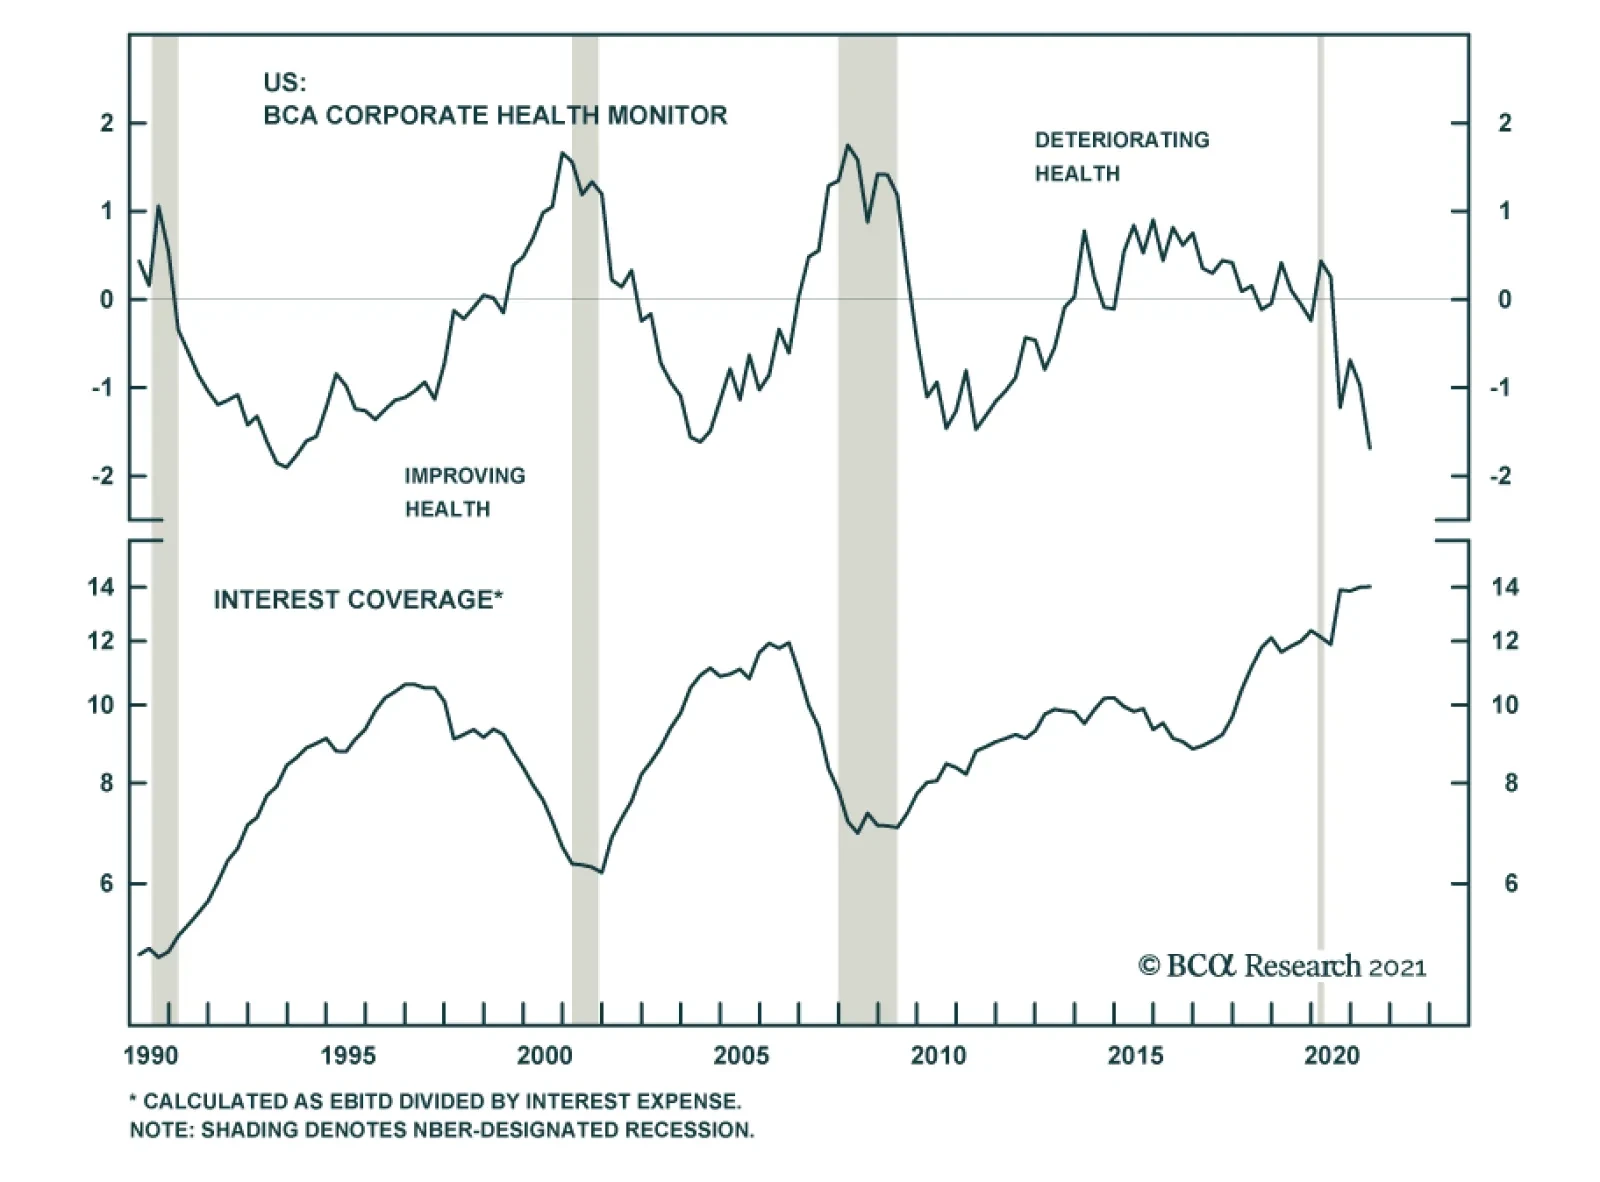
As a result, our view that inflationary pressures will ease during the next 6-12 months leads to the following investment recommendations: Short 2-year TIPS outright Enter 2/10 TIPS breakeven inflation curve steepeners Enter 2/10 real (TIPS) yield curve flatteners Corporate Balance Sheets Are In Great Shape Gross corporate leverage – the ratio of total corporate debt to pre-tax profits – has plunged during the past few quarters. This indicator is the backbone of our macro default rate model and, as such, its drop explains why there have been so few corporate defaults this year.4 Digging beneath the surface, we see that a great deal of leverage’s decline is explained by soaring profit growth, but a sharp drop in debt growth is also partly to blame (Chart 11). If we broaden our scope of corporate balance sheet indicators, the evidence further points to the fact that balance sheets are in great shape. Our Corporate Health Monitor – a composite indicator consisting of six different balance sheet metrics – is deep in “improving health” territory, aided by extremely high readings from the Free Cash Flow-to-Total Debt and Interest Coverage ratios (Chart 12). Chart 11Gross Leverage Is Falling
Gross Leverage Is Falling
Gross Leverage Is Falling
Chart 12Corporate Health Monitor
Corporate Health Monitor
Corporate Health Monitor
One thing that seems certain is that corporate profits will not continue to grow by more than 50%, as they did during the past four quarters. As such, we hesitate to make too big a deal out of balance sheet ratios that are directly tied to profit growth. However, even if we look at different measures of the amount of debt versus equity on corporate balance sheets, we arrive at the same conclusion that balance sheets are extremely healthy. The top panel of Chart 13 shows the ratio between total corporate debt and the market value of equity. This ratio is at its all-time low, but one could argue that it is being inappropriately flattered by elevated stock valuations. If we look at the ratio of total debt-to-net worth, where net worth is the difference between assets and liabilities with real estate assets valued at market value and non-real estate assets valued at replacement value, we also see a significant improvement and the lowest ratio since 2010 (Chart 13, panel 2). Finally, we also find the lowest ratio of debt-to-net worth since 2013 even if we value all non-financial corporate assets at historical cost (Chart 13, bottom panel). In other words, the message is clear. Corporate balance sheets have repaired themselves considerably since the pandemic and leverage ratios are the lowest they’ve been in years. This fact has not gone unnoticed by ratings agencies who’ve announced far more upgrades than downgrades so far this year (Chart 14). Chart 13Leverage Ratios
Leverage Ratios
Leverage Ratios
Chart 14Upgrades Much Higher Than Downgrades
Upgrades Much Higher Than Downgrades
Upgrades Much Higher Than Downgrades
What about the path forward for balance sheets? Our view is that balance sheet health will stop improving at the margin, but that it still has a long way to go before it poses a risk for defaults or corporate bond spreads. The recent spike in profit growth will recede in the coming quarters. This sort of large jump in profits following a recession is fairly typical, but it also tends to be short-lived (Chart 11, panel 2). Further, while corporate debt growth probably won’t surge next year it is likely that it will start to increase. At present, slow corporate debt growth is explained by the fact that company earnings have far outpaced capital investment requirements (Chart 15). This is partly because earnings have been strong and partly because capex requirements have been low. This is about to change. Inventory-to-sales ratios are near record lows and we have already seen a jump in core durable goods orders. All of this points to a capex resurgence in 2022 that will be partially financed by rising corporate debt. Chart 15Debt Growth Will Rise In 2022
Debt Growth Will Rise In 2022
Debt Growth Will Rise In 2022
Bottom Line: The amount of debt relative to equity on corporate balance sheets is the lowest it has been in several years. We expect that corporate balance sheet health will start to deteriorate next year as capital spending and debt issuance ramp up. However, it will be some time before balance sheet health threatens higher defaults or wider corporate spreads. Stay overweight spread product in US bond portfolios. Ryan Swift US Bond Strategist rswift@bcaresearch.com Footnotes 1 https://www.piie.com/sites/default/files/documents/furman-2021-11-17.pdf 2 https://www.federalreserve.gov/newsevents/speech/waller20211119a.htm 3 https://www.frbsf.org/our-district/press/presidents-speeches/mary-c-daly/2021/november/policymaking-in-a-time-of-uncertainty/ 4 For more details on our Default Rate Model please see US Bond Strategy Weekly Report, “The Post-FOMC Credit Environment”, dated June 29, 2021. Recommended Portfolio Specification Other Recommendations Treasury Index Returns Spread Product Returns

US financial market moves on Monday suggest that news of President Biden’s decision to reappoint Fed Chair Jerome Powell for another four-year term was a slight hawkish surprise. The interest rate sensitive financials sector outperformed the benchmark index…