United States
BCA Research’s US Political Strategy service concludes that the federal government is permanently taking a larger role in the economy – but this role will still be limited by voters, who do not favor socialism. Over the long run, new spending will add…

Highlights The bipartisan Infrastructure Investment and Jobs Act will increase US government non-defense spending to around 3% of GDP, a level comparable to the 1980s-90s and larger than the 2010s. Democrats are increasingly likely to pass their ~$1.75 trillion social spending bill, with odds at 65%. The budget reconciliation process necessary to pass this bill is also necessary to raise the national debt limit by December 3, so Congress is unlikely to fail. The Democratic spending bills will reduce fiscal drag very marginally in 2022-24 and will occasionally increase fiscal thrust thereafter. Republicans are unlikely to repeal much of the spending in coming years. Limited Big Government is a new strategic theme. The federal government is permanently taking a larger role in the economy – but this role will still be limited by voters, who do not favor socialism. Biden’s approval rating will stabilize at a low level. Immigration, crime, and especially inflation will determine the Democrats’ fate in the 2022 midterms. Gridlock is likely. The stock market has already priced the infrastructure bill and it will continue to rally on the rumor that reconciliation will pass. But growth has outperformed value, contrary to expectations. Feature Democrats in the House of Representatives finally passed the $1.2 trillion Infrastructure Investment and Jobs Act, which consists of $550 billion in brand new spending and $650 billion in a continuation of existing levels of spending to cover the next ten years. The legislation passed with 228 votes in the House, ten more than needed, due to 13 Republican votes, making it “bipartisan” (Chart 1). The contents of the bill are shown in Table 1. Republicans supported the bill because of its focus on traditional infrastructure – roads, bridges, ports – but they also agreed to more modern elements such as $65 billion on broadband Internet and $36 billion on electric vehicles and environmental remediation. Implementation of the bill will be felt in 2023-24, in time for the presidential election, as committees will need to be set up to identify and approve projects.
Chart 1
Table 1Itemized Infrastructure Plan
Closing The Loop On Infrastructure
Closing The Loop On Infrastructure
While $550 billion is not a lot in a world of multi-trillion dollar stimulus bills, nevertheless it makes for a 34% increase in federal non-defense investment to levels consistent with the 1980s-90s (Chart 2).
Chart 2
The new government spending will amount to 3% of GDP per year over the next ten years, a non-trivial amount of stimulus even though the big picture of the budget deficit remains about the same (Chart 3).
Chart 3
The passage of the infrastructure bill will increase, not decrease, the odds of Biden and the Democrats passing their $1.75 trillion social spending bill via the partisan budget reconciliation process. Subjectively we put the odds at 65% in the wake of infrastructure, although recent events suggest that the odds could be put even higher. While left-wing Democrats failed to link the infrastructure and social spending bills, as we argued, nevertheless the passage of infrastructure was a requirement for the key swing voter in the Senate, Joe Manchin of West Virginia. Manchin is negotiating on the reconciliation bill, suggesting he will vote for it, and he will ultimately capitulate because he will not want to be blamed for a default on the US national debt. The US will hit the national debt ceiling on December 3 and the only reliable means for the Democrats to raise the ceiling is reconciliation. The other critical moderate Democratic senator, Kyrsten Sinema of Arizona, seems to have capitulated, after securing a removal of corporate and high-income individual tax hikes from the bill. Far-left senators might make a last stand, holding up reconciliation and winning some last-minute concession. Six House Democrats refused to vote for the infrastructure bill (including New York House member Alexandria Ocasio-Cortez). However, progressives lost leverage after the Democrats’ losses in the off-year elections. Moreover the debt ceiling will force the hand of the progressives as well as the moderates. Any such hurdles will ultimately be steamrolled by the president and Democratic Party leaders. Combined with infrastructure, the net deficit impact of the infrastructure and reconciliation bills will range from $461 billion to $1 trillion (Table 2). Our scenarios vary based on how much credence we give to Democratic revenue raisers, since many of these are gimmicks and accounting tricks to make the bill look more fiscally responsible than it really is. At the most the US is looking at an increase in the budget deficit of less than 0.5% of GDP per year in the coming years. Table 2Biden Administration Tax-And-Spend Scenarios
Closing The Loop On Infrastructure
Closing The Loop On Infrastructure
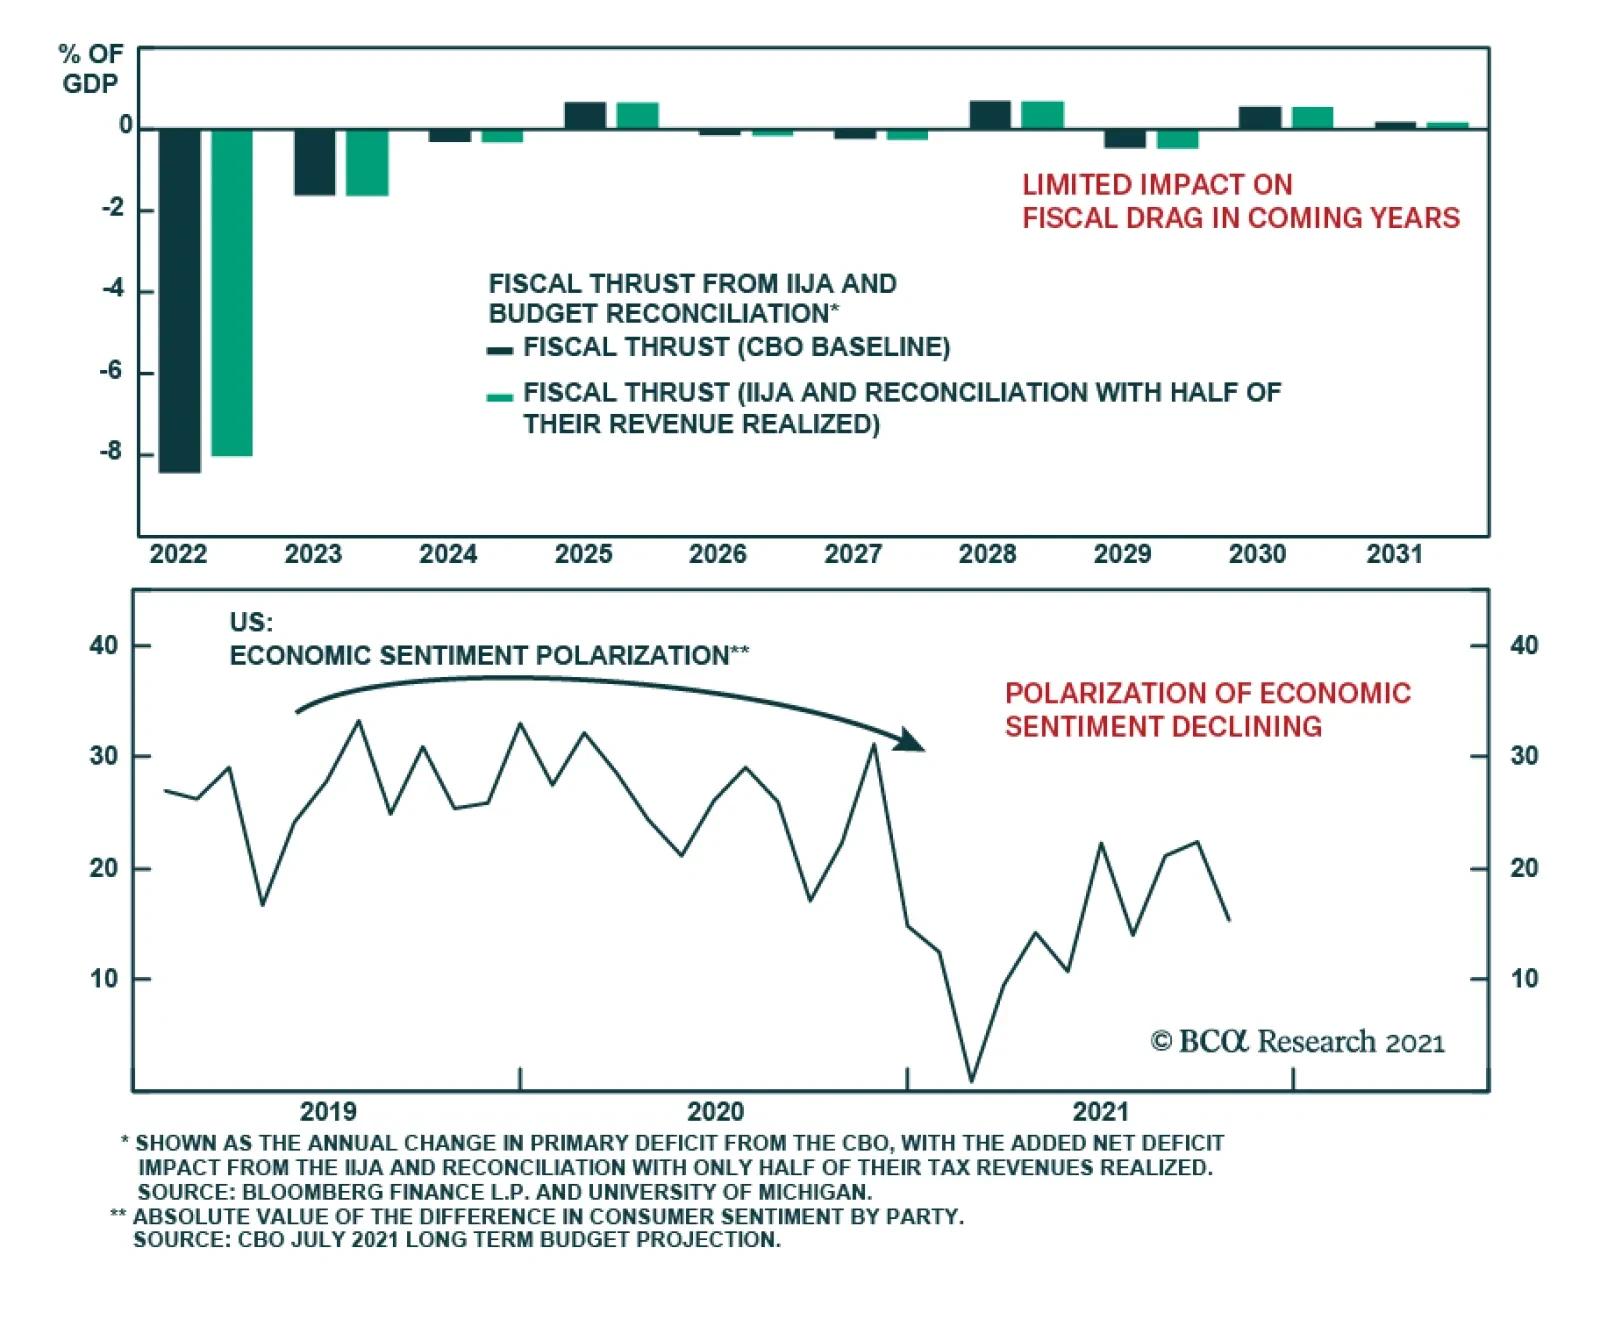
Investors should think of Biden’s legislative efforts as very marginally reducing fiscal drag rather than increasing fiscal thrust, at least in the short run. The budget deficit is normalizing after hitting unprecedented peacetime extremes at the height of the global pandemic and social lockdowns. The shrinking deficit subtracts from aggregate demand in 2022-2024. But the new spending bills will remove a small part of that drag during these years, as highlighted in Chart 4. More importantly the US Congress is signaling that fiscal policy is back in action and that fiscal retrenchment is a long way off. Over the long run, new spending will add marginally to fiscal thrust and aggregate demand, suggesting that the US government’s contribution to the economy will grow a bit in the latter part of the 2020s, namely if Democratic legislation survives the 2024 election. For the most part it probably will, as it is very difficult to repeal entitlements or slash government spending even with Republican majorities, as witnessed with the Affordable Care Act (Obamacare) in 2017.
Chart 4
Chart 5Polarization Of Economic Sentiment Declining
Polarization Of Economic Sentiment Declining
Polarization Of Economic Sentiment Declining
The polarization of economic sentiment – i.e. divergence in partisan views of the economy – has fallen since the pandemic and will likely continue to fall as the business cycle continues (Chart 5). Both presidential candidates offered infrastructure packages – they only differed on how to fund it. With the government taking a larger role in the economy – and yet the Republicans likely to rebound in future elections – the result is one of our new strategic themes: limited big government. The heyday of “limited government,” from President Ronald Reagan through George W. Bush, has ended. But the new popular and elite consensus in favor of “Big Government” can be overrated – the US political system is defined by checks and balances that will limit the pace and magnitude of the big government trend, and at times even seem to reverse it. Hence investors should think of US fiscal policy and government role in the economy as limited big government. Political Implications Of Bipartisan Infrastructure President Biden’s approval rating has collapsed since this summer when he suffered from perceptions of incompetence on both the delta variant of COVID-19 and the withdrawal from Afghanistan. Democratic infighting, which delayed the passage of his legislation, also hurt him (Chart 6). However, these are all passing narratives, with the exception of the incompetence narrative, which could become a lasting threat to Biden if not addressed. Biden’s signing of the infrastructure bill will stabilize his approval rating. Biden will probably end up somewhere between Presidents Obama and Trump. Voters will most likely upgrade their assessment of his handling of the economy over the coming year, at least marginally. But on foreign policy he will remain extremely vulnerable since he faces numerous immediate crises in coming years. American presidential disapproval has trended upwards since the 1950s of President Eisenhower. Disapproval peaks during recessions and wars. As the economy improves, Biden’s disapproval will fall, but foreign crises and wars are likely in today’s fraught geopolitical environment (Chart 7).
Chart 6
Chart 7
A few opinion polls suggest that Republicans have taken the lead over the Democrats in generic opinion polling regarding support for the parties in Congress. These polls are outliers and may or may not become the norm over the next year. Democrats have fallen from their peaks but Republicans still suffer from significant internal divisions (Chart 8).
Chart 8
Voters continue to identify mostly as political independents, with a notable downtrend in the share of voters who see themselves as Republicans or Democrats in recent years (Chart 9). Independent voters have marked leanings, right or left. While the leftward lean of independents has peaked, they are not leaning to the right. The infrastructure bill and even reconciliation bill will support Democratic identification. But the sharp rise in immigration, crime, and potentially persistent inflation will support Republicans. These last will become the critical political issues going forward. The democratic socialist or progressive agenda has already been checked by voters and Democrats can only double down on that agenda at their own peril. The infrastructure bill’s passage may give a boost to perceptions of Democratic odds of maintaining the Senate in the 2022 midterm elections – that question is still up in the air, even as the House is very likely to return to Republican control (Chart 10). Chart 9Independent Voters Still Rule
Independent Voters Still Rule
Independent Voters Still Rule
An under-the-radar beneficiary of the bipartisan infrastructure bill is Congress itself. Since 2014, public approval of Congress has gradually recovered from historic lows. The level is still low, at 27%, but the upward trend is notable for suggesting that a fiscally active Congress gains popular approval (Chart 11). New social spending will also increase Congress’s image, first for “doing something,” and second for expanding the social safety net, which more than half of voters will approve.
Chart 10
Chart 11
Partisan gridlock after 2022 could reverse the trend, as Republicans may find or invent a reason to impeach President Biden in retribution for President Trump’s impeachments. But our best guess is that Congress will remain above its low point as long as fiscal support – limited big government – remains intact. Aggressive tax hikes or spending cuts, or a national debt default, could reverse the recovery of this institution. Investment Takeaways The infrastructure bill’s passage may have supported the recent rally in stocks but it is not the main driver. Infrastructure stocks had largely discounted the bill’s passage by spring and our BCA Infrastructure Basket has underperformed the broad market since then. In absolute terms, infrastructure stocks have reached new highs and show a rising trajectory (Chart 12). The infrastructure bill has not delivered as expected when it comes to sectors or investment styles. Cyclicals have outperformed defensives, as expected. But value stocks have hit new lows relative to growth stocks, contrary to our expectation this year (Chart 13). Chart 12Infrastructure Was Already Priced
Infrastructure Was Already Priced
Infrastructure Was Already Priced
Chart 13Wall Street Looks Well Beyond Infrastructure
Wall Street Looks Well Beyond Infrastructure
Wall Street Looks Well Beyond Infrastructure
External factors – namely China’s policy tightening and bumps in the global recovery – weighed on cyclicals and value plays, especially relative to Big Tech (Chart 14). Growth stocks have surged yet again on low bond yields, positive earnings surprises, and secular trends like innovation and digitization. The American economy looks robust as the year draws to a close. The service sector is recovering smartly from the delta variant. Non-manufacturing business activity is surging and new orders are exploding upward relative to inventories (Chart 15). Service sector employment has suffered from shortages. Chart 14External Factors Weigh On Infrastructure Plays
External Factors Weigh On Infrastructure Plays
External Factors Weigh On Infrastructure Plays
Chart 15Service Sector Recovery Underway
Service Sector Recovery Underway
Service Sector Recovery Underway
Inflation risks are trickling into consumer and voter consciousness as Christmas approaches and prices rise at the pump (Chart 16). The Democrats’ two big bills will mitigate the damage they face in next year’s midterm elections – the Senate is still in competition. But a persistent inflation problem will overwhelm their legislative accomplishments. Voters will connect the dots between large deficit spending and inflationary surprises (not to mention any Democratic changes that reinforce the extremely dovish stance of the Fed). The normal political cycle will count heavily against the Democrats in 2022 regardless of inflation. But voters simultaneously face historic spikes in immigration and crime – and the former, at least, will get worse and not better over the next 12 months. Predicting inflation is a mug’s game but wage growth suggests it will remain a substantial risk in 2022 – and the structural shift in favor of big government, even if it is limited big government due to the political cycle, is inflationary on the margin. Chart 16Voters Awakening To Inflation
Voters Awakening To Inflation
Voters Awakening To Inflation
Matt Gertken Vice President Geopolitical Strategy mattg@bcaresearch.com Appendix
Image
Image
Image
Image
Image
Image
Image
Image
Highlights Fed/BoE: Both the Fed and the Bank of England found ways to talk down 2022 rate hike expectations discounted in US and UK bond markets. This is only a temporary reprieve, however, as the near-term uncertainties over the persistence of cost-push inflation will eventually be overwhelmed by medium-term certainties of demand-pull inflation confirmed by tightening labor markets. Stay underweight US Treasuries and UK Gilts in global bond portfolios. US Treasury Curve: Longer-term US Treasury yields are priced too low relative to the likely peak in the fed funds rate in the next cycle. Position for a steeper US Treasury curve until Fed rate hikes are imminent, which will likely not be until Q4/2022. Feature Chart of the WeekShifting Rate Expectations Driving Bond Yields As QE Fades
Shifting Rate Expectations Driving Bond Yields As QE Fades
Shifting Rate Expectations Driving Bond Yields As QE Fades
Bond market uncertainty about future monetary policy moves is on the rise. Bond volatility has picked up, most notably at the front end of yield curves that are most sensitive to rate hike expectations which have been intensifying. Yet last week, the Federal Reserve and Bank of England (BoE) were able to talk bond investors off the ledge – at least, temporarily - by pushing back against expectations of multiple rate hikes in the US and UK in 2022. Central bankers in those countries are stuck in a difficult spot. Inflation is high enough to warrant some tightening of monetary policy. Yet there are lingering concerns over how long the current upturn in global inflation will last. Meanwhile, there are just enough questions on the underlying pace of economic momentum to require policymakers to see more data, especially in labor markets, before feeling comfortable enough to pull the trigger on actual rate hikes. We now see that happening first in the UK early next year, and in the US in late 2022. One thing that is certain is that the ups and downs of interest rate expectations – and the central bank forward guidance that influences them – will increasingly become the more dominant driver of bond yields and yield curve shape as global pandemic bond-buying programs get wound down (Chart of the Week). On that front, we see more potential for bond-bearish steepening in the UK and US over the next several months. The BoE: Another Bad Date With The Unreliable Boyfriend The UK financial press infamously dubbed the BoE “the unreliable boyfriend”, under the leadership of former Governor Mark Carney, for hinting at interest rate increases that never materialized. At last week’s Monetary Policy Committee (MPC) meeting, rates were kept unchanged in a 7-2 vote despite some intense signaling in recent weeks that a rate hike was imminent. Under current BoE Governor Andrew Bailey, this edition of the MPC is more like an indecisive spouse than unreliable boyfriend. On the one hand, there is a clear overshoot of UK inflation (and inflation expectations) that would justify a rate hike as soon as possible (Chart 2). The BoE’s new economic forecasts presented in the November Monetary Policy Report (MPR) called for headline CPI inflation to reach a peak of 5% in April 2022 – significantly higher than the 4% late-2021 forecast from the August MPR. On the other hand, high current inflation is already having a dampening effect on economic sentiment. The GfK index of UK consumer confidence is down -10% from the peak seen in July, despite diminishing concerns over COVID seen in public opinion polls (Chart 3, middle panel). A similar divergence is evident in the BoE’s Decision Maker Panel survey of UK Chief Financial Officers, which showed that uncertainty over future sales was somewhat elevated compared to diminished concerns about COVID and Brexit (bottom panel). Chart 2Fed/BoE Cannot Stay Dovish For Much Longer
Fed/BoE Cannot Stay Dovish For Much Longer
Fed/BoE Cannot Stay Dovish For Much Longer
Chart 3High UK Inflation Raises Growth Uncertainty
High UK Inflation Raises Growth Uncertainty
High UK Inflation Raises Growth Uncertainty
The BoE highlighted these divergences in economic sentiment series in the November MPR as examples of how high inflation, fueled by global supply chain disruptions and soaring energy prices, introduced uncertainty into the central bank’s forecasts. Even more uncertainty exists in the BoE’s ability to assess the amount of spare capacity, and underlying inflationary pressure, in the UK economy. The BoE dedicated a 9-page section of the November MPR to a discussion about estimating the growth of the supply-side of the UK economy, evidence of how difficult that process has become during the COVID era. The BoE concluded that the pandemic would end up reducing the level of UK potential supply by -2% from pre-COVID levels, even though the growth rate would return to a pre-pandemic pace of around 1.5% by 2023-24. This is a combination that makes setting monetary policy tricky. Reduced supply indicates that the UK economy has a smaller output gap with more inflationary pressure that would require higher interest rates. Yet sluggish growth in potential supply implies that the UK equilibrium interest rate is likely still very low, thus the BoE would not have to raise rates much to get policy back to neutral. This uncertainty over the size of the output gap in the UK economy will force to BoE to focus more on the labor market as the best “real-time” measure of spare capacity. On that front, the evidence is also difficult to interpret. The UK unemployment rate fell to 4.5% over the three months to August, the last available data before the UK government’s COVID furlough schemes, which protected worker incomes hit by COVID job losses, ended on September 30. The UK Office of National Statistics estimates that there were between 900,000 and 1.4 million UK workers furloughed in late September, representing a significant source of labor supply to be absorbed when the government income assistance ends. Thus, the BoE would need to see at least a month or two of post-furlough employment reports – not just job growth, but labor force participation - to assess how quickly those workers were being reabsorbed into the UK labor market. By the BoE’s own estimates, the impact of the furlough schemes, combined with the compositional issues arising from pandemic job losses being borne more by lower-wage workers, boosted UK wage growth by 2.2% (Chart 4, bottom panel). “Underlying” wage growth, net of those effects, is 0.6%, above the pre-COVID peak, suggesting a tightening labor market before the return of furloughed workers to the labor force. In the end, we see the BoE’s November non-hike as nothing more than a delay of the inevitable. While a December hike is possible, this would represent a “double tightening” of monetary policy with the current BoE quantitative easing program set to expire at year-end. The more likely date for a rate hike is now February. This would give the MPC a few months of post-furlough labor data to assess the amount of spare capacity in UK labor markets. We expect the data to show enough underlying health in labor demand relative to supply for the BoE to conclude that accelerating wage growth represents a more sustainable form of UK inflation in 2022 than energy prices or supply-chain disruptions were in 2021, justifying a move to begin hiking rates. We continue to recommend positioning for a steeper UK Gilt curve, focused on longer-maturities where yields were too low relative to even a moderate future BoE rate hike cycle (Chart 5). We entered a new tactical butterfly spread trade last week, going long the 10-year Gilt bullet versus a duration-neutral 7-year/30-year barbell – we continue to like that trade as a way to play for eventual BoE rate hikes in the first half of 2022. Chart 4BoE Needs More Employment Data To Confirm Wage Uptrend
BoE Needs More Employment Data To Confirm Wage Uptrend
BoE Needs More Employment Data To Confirm Wage Uptrend
Chart 5Stay In UK Long-End Gilt Curve Steepeners
Stay In UK Long-End Gilt Curve Steepeners
Stay In UK Long-End Gilt Curve Steepeners
Bottom Line: The Bank of England is still on a path to begin rate hikes, either in December or, more likely, February of next year. Stay underweight UK Gilts. Position For A Steeper US Treasury Curve The Fed announced last week that tapering would begin right away in November, in a move that has been hinted at since the summer. The monthly pace of purchases of Treasuries and Agency MBS will decline by $10 billion and $5 billion, respectively in November and also December. The Fed declined to commit to any specific tapering amounts beyond that, although it seems likely that the same monthly pace of reduction will continue in 2022. This would take the buying of Treasuries and MBS, net of maturing debt, to zero by June of next year, clearing the first necessary hurdle before the FOMC could contemplate a hike in the funds rate. A completion of the taper by June has been hinted at in the speeches of several Fed officials in recent weeks. This is a bit faster than the expected pace of tapering seen in the most recent New York Fed Primary Dealer and Market Participant Surveys from September (Chart 6), but should not be categorized as a hawkish surprise. There were also few bond-bearish signals on future policy moves hinted at by Fed Chair Jay Powell in post post-FOMC meeting press conference.
Chart 6
Chart 7Upside Risk To UST Yields From A Tightening Labor Market
Upside Risk To UST Yields From A Tightening Labor Market
Upside Risk To UST Yields From A Tightening Labor Market
Powell did note that it was still not clear how long the current supply chain/commodity price driven surge in inflation would persist into next year. The expectation, however, was that these forces would eventually subside and allow US inflation to return back to levels much closer to the Fed’s 2% target. Given the uncertainties in the timing of that peak and decline in US inflation, the Fed has limited ability to calibrate any post-taper rate hikes by focusing solely on inflation - especially with longer-term inflation expectations still at levels consistent with the Fed’s target. The Fed will continue to look at US labor market developments to determine the timing and pace of future rate hikes. The last set of FOMC economic projections compiled for the September meeting have the US unemployment rate falling to 3.8% next year, below the median FOMC estimate of full employment at 4%, with one 25bp rate hike penciled in for 2022. We can use that as a baseline assumption on what the Fed considers to be the level of “maximum employment” that would need to be reached before rate hikes could begin. The US unemployment rate fell to 4.6% in October, thus there is still some more to go before hitting that 3.8% rate hike threshold. Yet among the FOMC members, the estimates of full employment range from 3.5%-4.5%, so the October print did knock on the door of that range (Chart 7, middle panel). With US wage growth already showing signs of breaking out – the Atlanta Fed Wage Tracker hit a 14-year high of 14% in September (bottom panel), while the Employment Cost Index rose by a record quarterly pace of 1.3% in Q3 – the Fed will likely be under a lot of pressure to begin hiking rates soon after the taper is expected to end next June. Chart 8UST Curve Forwards Too Flat Vs. Likely Fed Rate Hikes
UST Curve Forwards Too Flat Vs. Likely Fed Rate Hikes
UST Curve Forwards Too Flat Vs. Likely Fed Rate Hikes
We still see December 2022 as the most likely liftoff date, although a faster decline in unemployment could move that timetable forward. The bigger issue for the US Treasury market, however, is not the timing of liftoff but how fast the pace of hikes will be afterward. On that note, future rate expectations are still far too low. For example, according to the New York Fed’s Primary Dealer Survey, the fed funds rate is expected to average only 1.7% over the next ten years (top panel), a level that has proved to be a ceiling for the 10-year Treasury yield so far in 2021. Our colleagues at BCA Research US Bond Strategy recently made the case for expecting the US Treasury curve to bearishly steepen in the coming months. In their view, longer-maturity Treasury yield forward rates were too low compared to a fair value determined by the likely path for the funds rate that assumes rate hikes start in December of next year and rise by 100bps per year to a terminal rate of 2.08% (Chart 8). Interestingly, 2-year Treasury forward rates were in line with the projections of our US Bond Strategy team’s fair value framework. We fully agree with our US Bond colleagues on the likelihood of future Treasury curve steepening. This fits with our views on many developed market countries, not just the US, where longer-maturity bond yields were pricing in too few future rate hikes relative to what was likely to occur over the next few years. Even when taking a much longer perspective, the US Treasury curve looks too flat right now. Going back to the mid-1980s, the current 2-year/10-year US Treasury curve slope of just over 100bps has never been reached (in a flattening move) in the absence of actual Fed rate hikes (Chart 9). Chart 9UST Curve Has Never Been This Flat Without Some Actual Fed Rate Hikes
UST Curve Has Never Been This Flat Without Some Actual Fed Rate Hikes
UST Curve Has Never Been This Flat Without Some Actual Fed Rate Hikes
This week, we are adding a new trade to our Tactical Overlay table to benefit from this expected move in the US yield curve, a US Treasury 2-year/10-year curve steepener (combined with a position in cash, or US 3-month treasury bills, to make the entire trade duration-neutral). We are also taking profits on our previous Tactical US curve flattening trade, which has returned 0.84% since initiation back in June. The exact securities and weightings for our new trade can be found in the Tactical Overlay Trades table below. Bottom Line: Longer-term US Treasury yields are priced too low relative to the likely peak in the fed funds rate in the next cycle. Position for a steeper US Treasury curve until Fed rate hikes are imminent, which will likely not be until Q4/2022. Robert Robis, CFA Chief Fixed Income Strategist rrobis@bcaresearch.com Recommendations Duration Regional Allocation Spread Product Tactical Overlay Trades GFIS Model Bond Portfolio Recommended Positioning Active Duration Contribution: GFIS Recommended Portfolio Vs. Custom Performance Benchmark
Image
The GFIS Recommended Portfolio Vs. The Custom Benchmark Index
To determine how to position within the Treasury market, BCA Research’s US Bond Strategy service translates its views on the timing of Fed liftoff into fair value estimates for different segments of the Treasury curve. The team assumes a scenario where the…
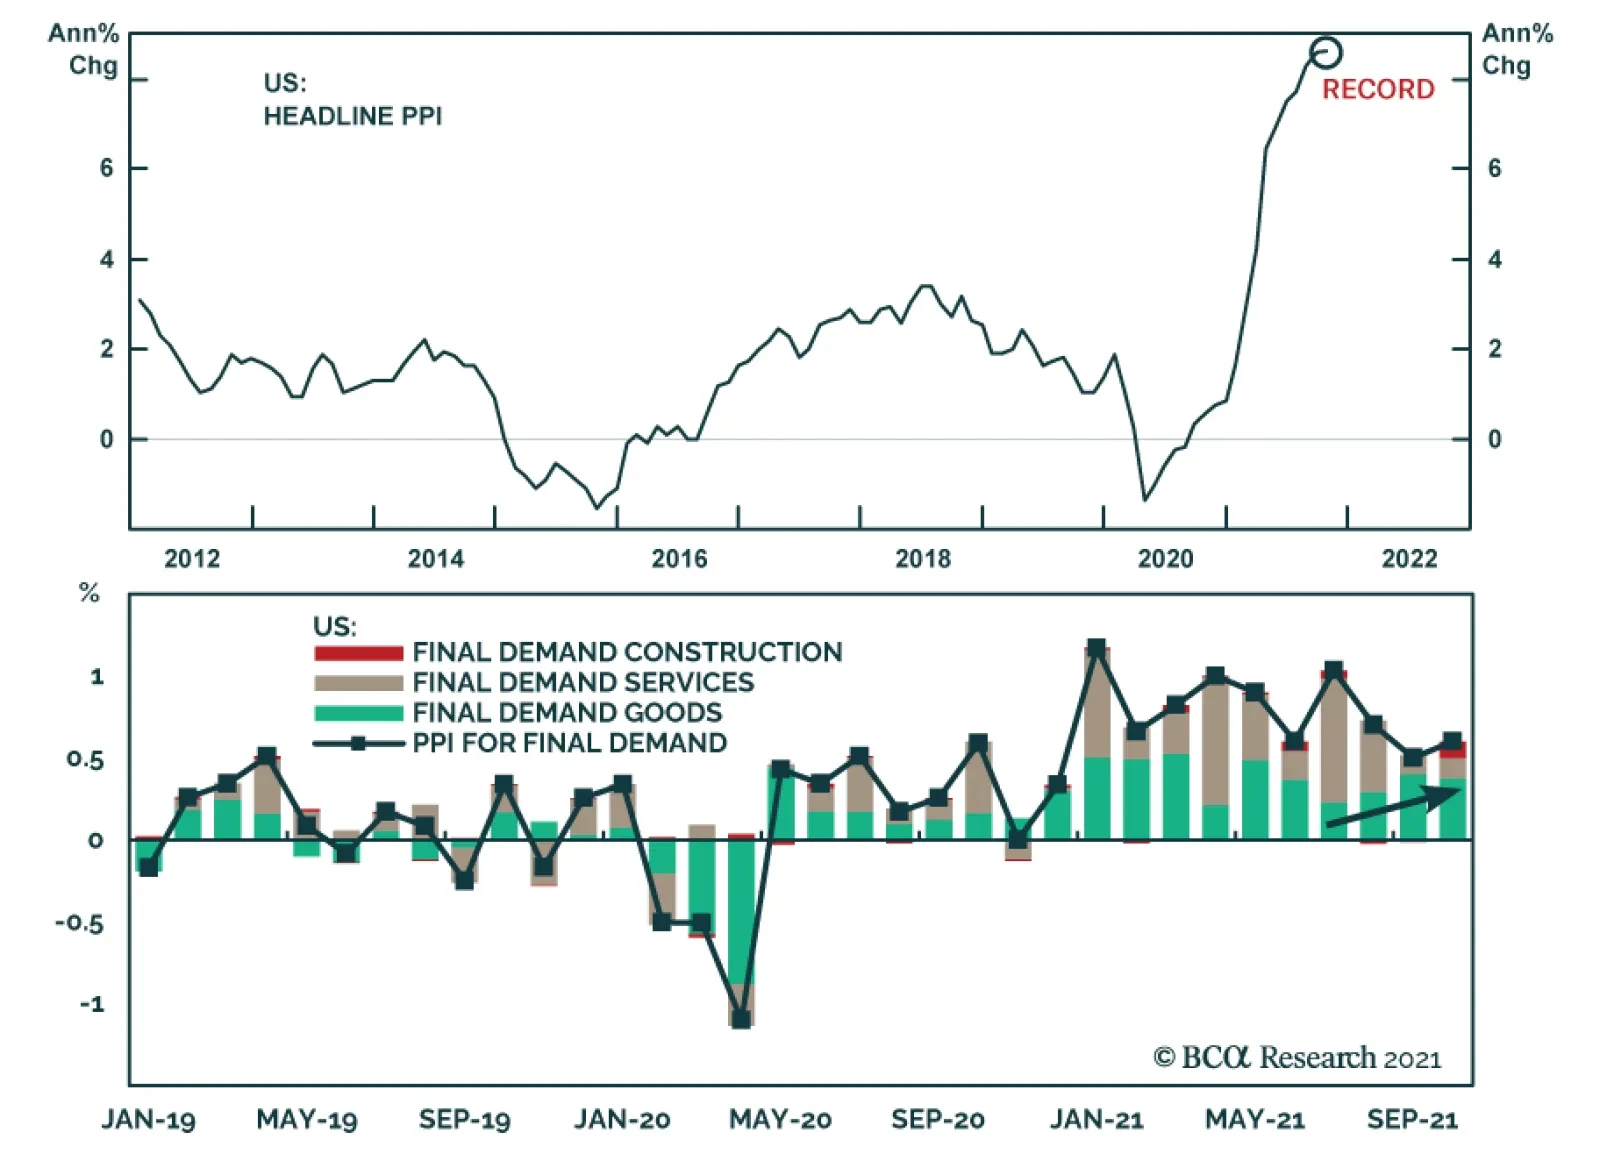
On the surface, the US October PPI report suggests that pipeline inflationary pressures are intensifying. US Headline PPI inflation remained at September’s record 8.6% y/y rate. In month-on-month terms, PPI for final demand accelerated from 0.5% to 0.6%.…
Revelations that Lael Brainard was interviewed last week for the position of Fed chair sparked speculation that monetary policy will shift in a more dovish direction once Jerome Powell’s term expires in February. Inflation breakevens moved up in response to…
Highlights Fed: Chair Powell’s remarks after the November FOMC meeting suggest that the Fed will not panic and move quickly toward tightening in the face of high inflation. Rather, the Fed will stay the course and will only lift rates once its “maximum employment” liftoff trigger is met. We continue to expect Fed liftoff in December 2022. Nominal Treasuries: We project that Treasury securities will still deliver negative total returns, even if Fed liftoff is delayed until December 2022. Investors can protect returns by favoring the 2-year note (long 2yr over cash/10yr barbell) and 20-year bond (long 20yr over 10yr/30yr barbell). TIPS: Investors should short 2-year TIPS outright in anticipation of falling short-dated inflation expectations during the next 12 months. The Taper Is Done, Now Onto Liftoff The Fed announced a tapering of its asset purchases last week and the details of the tapering plan were consistent with what had already been signaled to the public. The Fed will purchase $70 billion of Treasuries this month (compared to $80 billion in October) and $35 billion of agency MBS (down from $40 billion in October). It will then reduce monthly Treasury and MBS purchases by $10 billion and $5 billion each month, respectively, until it reaches net zero asset purchases by June of next year (Chart 2). The Fed didn’t give specific guidance on what will happen with the balance sheet after June, but it’s highly likely that it will follow the pattern of the last tightening cycle and keep the balance sheet flat for a long time, until the fed funds rate is well above the zero bound. The Fed also gave itself the option to increase or decrease the pace of purchases if such changes are warranted by the economic outlook, but it would take a major shock to knock the Fed off its pre-set course. Chart 1The Market's Liftoff Expectations
The Market's Liftoff Expectations
The Market's Liftoff Expectations
Chart 2Net Purchases Will Reach Zero By June
Net Purchases Will Reach Zero By June
Net Purchases Will Reach Zero By June
With the tapering announcement out of the way, the Fed can now turn to the more important question of when to start lifting interest rates. Jay Powell made it clear at last week’s press conference that the committee hasn’t yet formally taken up the issue, but that didn’t stop reporters from pressing the Chairman to provide more details about when the Fed will hike. None of that should be too surprising. There’s intense market interest and a great deal of uncertainty about the timing of Fed liftoff. Two months ago, markets were pricing-in no rate hikes at all in 2022. Now, markets are looking for Fed liftoff at the September 2022 FOMC meeting and are discounting a 90% chance of 2 rate hikes by the end of next year (Chart 1). The Fed’s Thinking On Liftoff So, what did we learn from last week’s FOMC Statement and press conference about how the Fed is thinking about the liftoff date? First, we know from previous comments that the Fed would prefer to reduce net asset purchases to zero before it starts lifting rates. This means that the July 2022 FOMC meeting is the first “live meeting” where a rate hike could possibly occur, and the fed funds futures market is already pricing-in a 74% chance that liftoff will occur at that meeting (Chart 1). We aren’t so sure. In fact, we don’t see the Fed lifting rates until December 2022, and Chair Powell’s comments about inflation at last week’s press conference only increased our confidence in that view. On inflation, Powell echoed comments by Fed Governor Randal Quarles that we flagged in a recent report.1 Both Powell and Quarles put less emphasis on the length of time that inflation remains above the Fed’s target and more emphasis on the causes of that inflation and whether it’s appropriate for the Fed to lean against it. Here’s Powell from last week (emphasis added): Supply constraints have been larger and longer lasting than anticipated. Nonetheless, it remains the case that the drivers of higher inflation have been predominantly connected to dislocations caused by the pandemic, specifically the effects on supply and demand from the shutdown, the uneven reopening, and the ongoing effects of the virus itself. Our tools cannot ease supply constraints. Like most forecasters, we continue to believe that our dynamic economy will adjust to the supply and demand imbalances, and that as it does, inflation will decline to levels much closer to our 2 percent longer-run goal. Of course, it is very difficult to predict the persistence of supply constraints or their effects on inflation. Global supply chains are complex; they will return to normal function, but the timing of that is highly uncertain.2 Essentially, Powell is pointing out that it would be a mistake for the Fed to tighten policy to bring down inflation only to find out that the economy’s natural supply side response was about to do so anyways. The Fed would have dragged down aggregate demand for no reason. So what would cause the Fed to lift rates? We see two potential triggers. The first liftoff trigger would be an assessment by the FOMC that the labor market has reached “maximum employment”. This is the liftoff condition that the Fed has officially set for itself. The second liftoff trigger would be an uncomfortable increase in long-dated inflation expectations. A spike in long-dated inflation expectations would be worrying enough that the Fed would abandon its “maximum employment” goal and tighten earlier. The “Maximum Employment” Trigger Chart 3How Far From "Maximum Employment"?
How Far From "Maximum Employment"?
How Far From "Maximum Employment"?
The concept of “maximum employment” brings a whole host of other issues along with it. How will the Fed know if the labor market is at “maximum employment”? We’ve discussed this topic at length ourselves and have come to a few helpful conclusions.3 First, we can infer from the most recent Summary of Economic Projections that the Fed views an unemployment rate of 3.8% as roughly consistent with “maximum employment”. It is therefore highly unlikely that the Fed will even consider declaring victory on its employment goal until the unemployment rate is in the vicinity of 3.8%, down from its current 4.6% (Chart 3). Second, there are good reasons to believe that the aging of the US population and the recent sharp increase in retirements will prevent the labor force participation rate from re-gaining its pre-pandemic level. However, FOMC participants seem to agree that the prime-age (25-54) labor force participation rate should be close to its February 2020 level for the “maximum employment” condition to be satisfied (Chart 3, bottom panel). Chair Powell even specifically referenced the prime-age participation rate at last week’s press conference.
Chart 4
We think a declaration of “maximum employment” will only occur once the unemployment rate is near 3.8% and the prime-age (25-54) labor force participation rate is near its February 2020 level of 82.9%, up from its current 81.7%. It’s unlikely that these conditions will be met in time for a July 2022 rate hike. The Appendix to this report updates our scenarios for the average monthly nonfarm payroll growth that is required to reach different combinations of the unemployment and participation rates by specific future dates. Our scenarios use the overall participation rate (not the prime-age one), but we think the scenarios derived from the New York Fed’s Surveys of Market Participants and Primary Dealers come close to capturing reasonable conditions for “maximum employment”. Based on those scenarios, we calculate that average monthly nonfarm payroll growth of 602k to 733k is required to reach “maximum employment” by June 2022. Conversely, average monthly payroll growth of only 379k to 455k is required to reach “maximum employment” by December 2022. We see the latter as easily achievable and the former as more of a stretch. On the topic of employment growth, it’s worth noting that both monthly nonfarm payroll growth and the prime-age labor force participation rate were dragged down by the spread of the Delta variant during the past few months (Chart 4). With new COVID cases falling, we should see stronger payroll growth and a higher prime-age part rate in the months ahead. Relatedly, falling COVID cases will also help alleviate some the constraints on labor supply as workers grow less fearful of the virus and more confident about re-entering the labor force. This will not only push prime-age participation higher, but it will also take some of the sting out of wage growth. Wage growth has been extremely high recently as the number of job openings has far outpaced the number of new hires (Chart 5). Fading COVID fears should increase the pace of hiring and slow wage growth. This will give the Fed even more confidence that it should stay the course. Chart 5Peak Wage Growth?
Peak Wage Growth?
Peak Wage Growth?
The Inflation Expectations Trigger Chart 6Inflation Expectations Are Well-Anchored
Inflation Expectations Are Well-Anchored
Inflation Expectations Are Well-Anchored
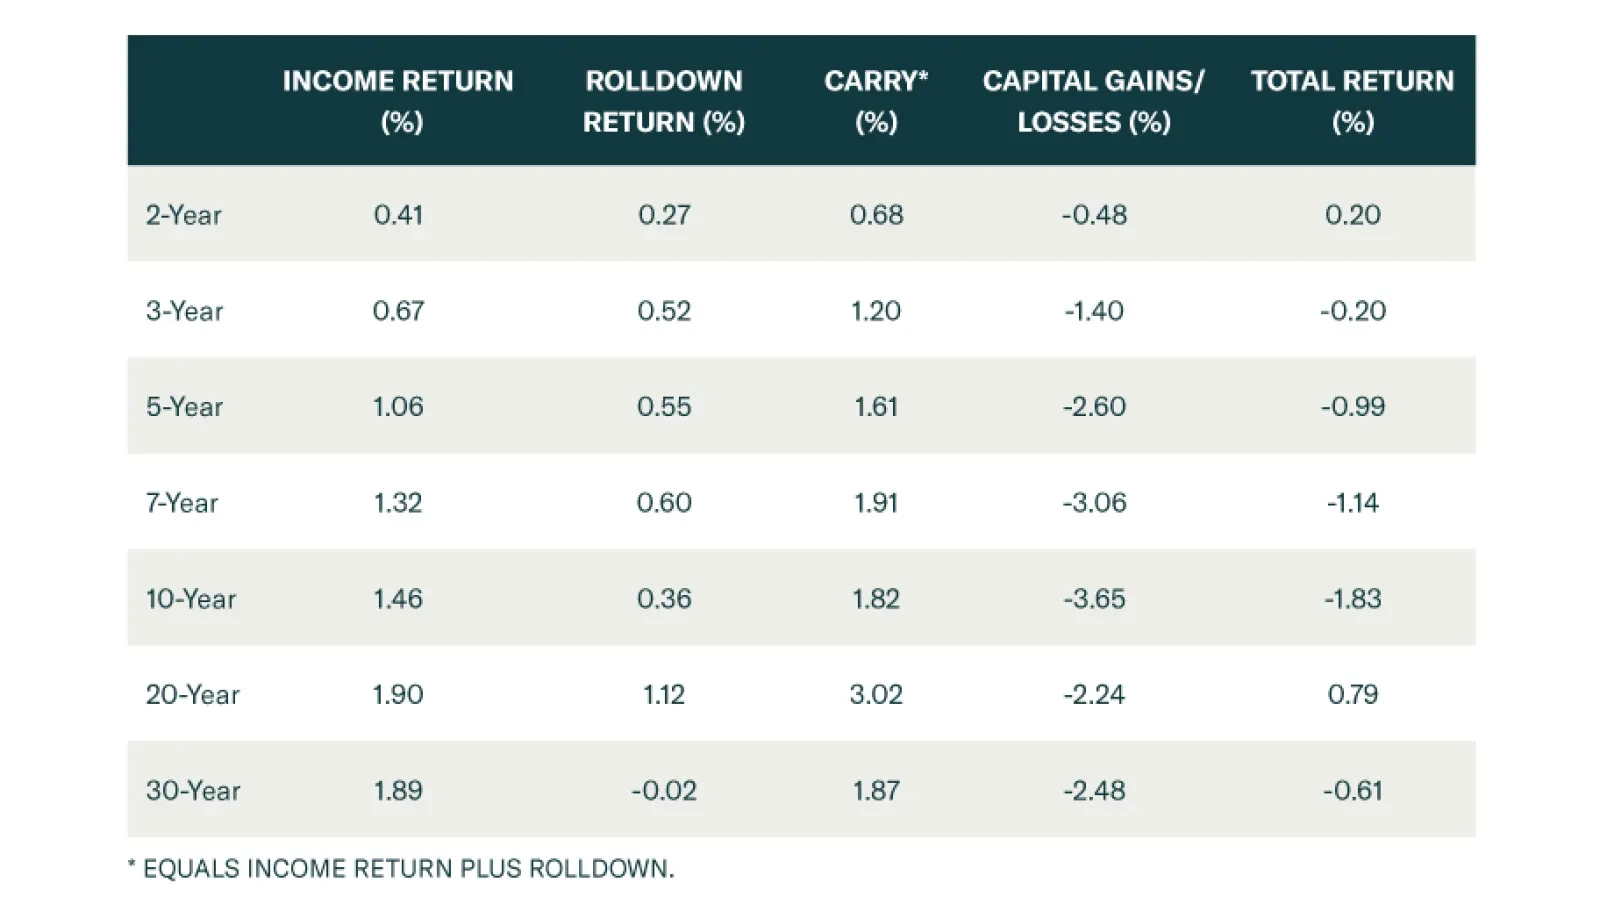
We noted above that the Fed would abandon its “maximum employment” liftoff condition if long-dated inflation expectations rose to uncomfortably high levels. Specifically, we like to track the 5-year/5-year forward TIPS breakeven inflation rate relative to a target range of 2.3% to 2.5% (Chart 6). As long as the 5-year/5-year breakeven rate stays within that range or below, the Fed will be guided by its “maximum employment” goal. However, if that rate were to break above 2.5% for a significant period of time, the Fed would be sufficiently worried about an expectations-driven inflationary spiral that it would abandon its “maximum employment” trigger and bring forward the liftoff date. We don’t expect to see a breakout above 2.5% in the 5-year/5-year forward TIPS breakeven inflation rate anytime soon. The rate has stayed well contained throughout the past few months even as inflation skyrocketed. It would be strange for it to suddenly spike after inflation has already peaked.4 Bottom Line: Chair Powell’s remarks after the November FOMC meeting suggest that the Fed will not panic and move quickly toward tightening in the face of high inflation. Rather, the Fed will stay the course and will only lift rates once its “maximum employment” liftoff trigger is met. We continue to expect Fed liftoff in December 2022. Treasury Market Positioning For A December 2022 Liftoff To determine how we should position within the Treasury market, we translate our above views on the timing of Fed liftoff into fair value estimates for different segments of the Treasury curve. Specifically, we assume a scenario where the Fed starts hiking in December 2022 and then lifts rates at a pace of 100 bps per year until reaching a terminal rate of 2.08%. That 2.08% terminal rate is based on an expected target range of 2%-2.25% that is inferred from responses to the New York Fed’s Surveys of Market Participants and Primary Dealers. We assume that the effective fed funds rate will trade 8 bps above the lower-bound of its target range, as it does currently. Table 1 shows expected 12-month total returns for each Treasury maturity, assuming the market moves to fully price-in our expected funds rate path during the next year. Table 1Projected 12-Month Treasury Returns: Dec 2022 Liftoff/100 Bps Per Year Pace/2.08% Terminal Rate
A Rate Hike Next Summer? Don’t Count On It.
A Rate Hike Next Summer? Don’t Count On It.
The first observation that jumps out is that, except for the 2-year and 20-year maturities, expected Treasury returns are negative across the board. This justifies sticking with our recommended below-benchmark portfolio duration stance. Second, our expectation that liftoff will be delayed relative to current market expectations gives the 2-year note slightly better expected returns, particularly relative to the 10-year note. As a result, we advise investors to hold 2/10 yield curve steepeners. Specifically, investors should go long the 2-year note versus a duration-matched barbell consisting of the 10-year note and cash. Third, the 20-year bond looks to be priced cheaply on the curve. It offers expected 12-month returns of +79 bps while the 10-year note and 30-year bond are both projected to lose money. We recommend taking advantage of this situation by going long the 20-year bond versus a duration-matched barbell consisting of the 10-year note and 30-year bond. This proposed trade offers positive carry of 20 bps (Chart 7). Further, the 10/20 slope is stuck in the middle of where it was on the 2015 and 2004 liftoff dates (Chart 7, panel 2). The 20/30 slope, meanwhile, is inverted and well below where it was on the 2015 and 2004 liftoff dates (Chart 7, bottom panel). Our 20 over 10/30 trade will profit as the 20/30 slope re-steepens, even if the 10/20 slope doesn’t move that much. Chart 7Buy 20s Versus 10s30s
Buy 20s Versus 10s30s
Buy 20s Versus 10s30s
It could be argued that our recommend trades are all predicated on a fed funds rate scenario that embeds too low of a terminal rate. In fact, the median projection of FOMC participants would place the terminal rate closer to 2.5% than to 2%. If we alter our scenario by increasing the terminal rate assumption from 2.08% to 2.58%, it only improves the outlook for our recommended positions (Table 2). Table 2Projected 12-Month Treasury Returns: Dec 2022 Liftoff/100 Bps Per Year Pace/2.58% Terminal Rate
A Rate Hike Next Summer? Don’t Count On It.
A Rate Hike Next Summer? Don’t Count On It.
In the new scenario, expected Treasury returns are more negative – especially at the long-end. However, the 2-year note is still expected to earn a small profit. Our 20 over 10/30 trade performs slightly worse in this second scenario compared to the first one (+1.79% versus +1.95%), but it is still expected to make money. TIPS Chart 8A Lot Of Upside In Short-Maturity Real Yields
A Lot Of Upside In Short-Maturity Real Yields
A Lot Of Upside In Short-Maturity Real Yields
We have one final government bond recommendation based on our expectation that Fed liftoff will be delayed until December 2022. That trade is to go short 2-year TIPS. Alternatively, investors could enter 2/10 inflation curve steepeners or 2/10 real yield curve flatteners. Our base case economic outlook is that supply side constraints (both in global supply chains and in the labor market) will loosen during the next 12 months. This will push down short-dated inflation expectations while long-dated inflation expectations stay relatively close to the Fed’s target. If we assume that both the 2-year and 10-year TIPS breakeven inflation rates trend towards the middle of the Fed’s 2.3% to 2.5% target range during the next 12 months and that the nominal 2-year and 10-year yields follow the paths predicted by the fair value scenario presented in Table 1, then we see that the 2-year real yield has a lot of upside (Chart 8). This is true both in absolute terms and relative to the 10-year real yield. We advise investors to short 2-year TIPS outright. Alternatively, 2/10 inflation curve steepeners or 2/10 real yield curve flatteners will also perform well during the next 12 months. Bottom Line: We suggest four different ways that bond investors can profit from the Fed delaying liftoff until December 2022. Investors should keep portfolio duration low, enter 2/10 nominal curve steepeners, buy the 20-year T-bond versus a 10/30 barbell and short 2-year TIPS. Appendix: How Far From “Maximum Employment” And Fed Liftoff? Chart A1Defining “Maximum Employment”
Defining "Maximum Employment"
Defining "Maximum Employment"
The Federal Reserve has promised that the funds rate will stay pinned at zero until the labor market returns to “maximum employment”. The Fed has not provided explicit guidance on the definition of “maximum employment”, but we deduce that “maximum employment” means that the Fed wants to see the U3 unemployment rate within a range consistent with its estimates of the natural rate of unemployment, currently 3.5% to 4.5%, and that it wants to see a significant increase in the labor force participation rate (Chart A1). Alternatively, we can infer definitions of “maximum employment” from the New York Fed’s Surveys of Primary Dealers and Market Participants. These surveys ask respondents what they think the unemployment and labor force participation rates will be at the time of Fed liftoff. Currently, the median respondent from the Survey of Market Participants expects an unemployment rate of 3.5% and a participation rate of 63%. The median respondent from the Survey of Primary Dealers expects an unemployment rate of 3.7% and a participation rate of 62.7%. Tables A1-A4 present the average monthly nonfarm payroll growth required to reach different combinations of unemployment rate and participation rate by specific future dates. For example, if we use the definition of “maximum employment” from the Survey of Market Participants, then we need to see average monthly nonfarm payroll growth of +455k in order to hit “maximum employment” by the end of 2022.
Image
Image
Image
Image
Chart A2 presents recent monthly nonfarm payroll growth along with target levels based on the Survey of Market Participants’ definition of “maximum employment”. This chart is to help us track progress toward specific liftoff dates. For example, if monthly nonfarm payroll growth prints +400k per month going forward, we would expect Fed liftoff between December 2022 and June 2023. Chart A2Tracking Toward Fed Liftoff
Tracking Toward Fed Liftoff
Tracking Toward Fed Liftoff
We will continue to track these charts and tables in the coming months, and will publish updates after the release of each monthly employment report. Ryan Swift US Bond Strategist rswift@bcaresearch.com Footnotes 1 Please see US Bond Strategy Weekly Report, “The Best & Worst Spots On The Yield Curve”, dated October 26, 2021. 2 https://www.federalreserve.gov/mediacenter/files/FOMCpresconf20211103.pdf 3 Please see US Bond Strategy Weekly Report, “2022 Will Be All About Inflation”, dated September 14, 2021. 4 For more details on our inflation outlook please see US Bond Strategy Weekly Report, “Right Price, Wrong Reason”, dated October 19, 2021. Recommended Portfolio Specification Other Recommendations Treasury Index Returns Spread Product Returns
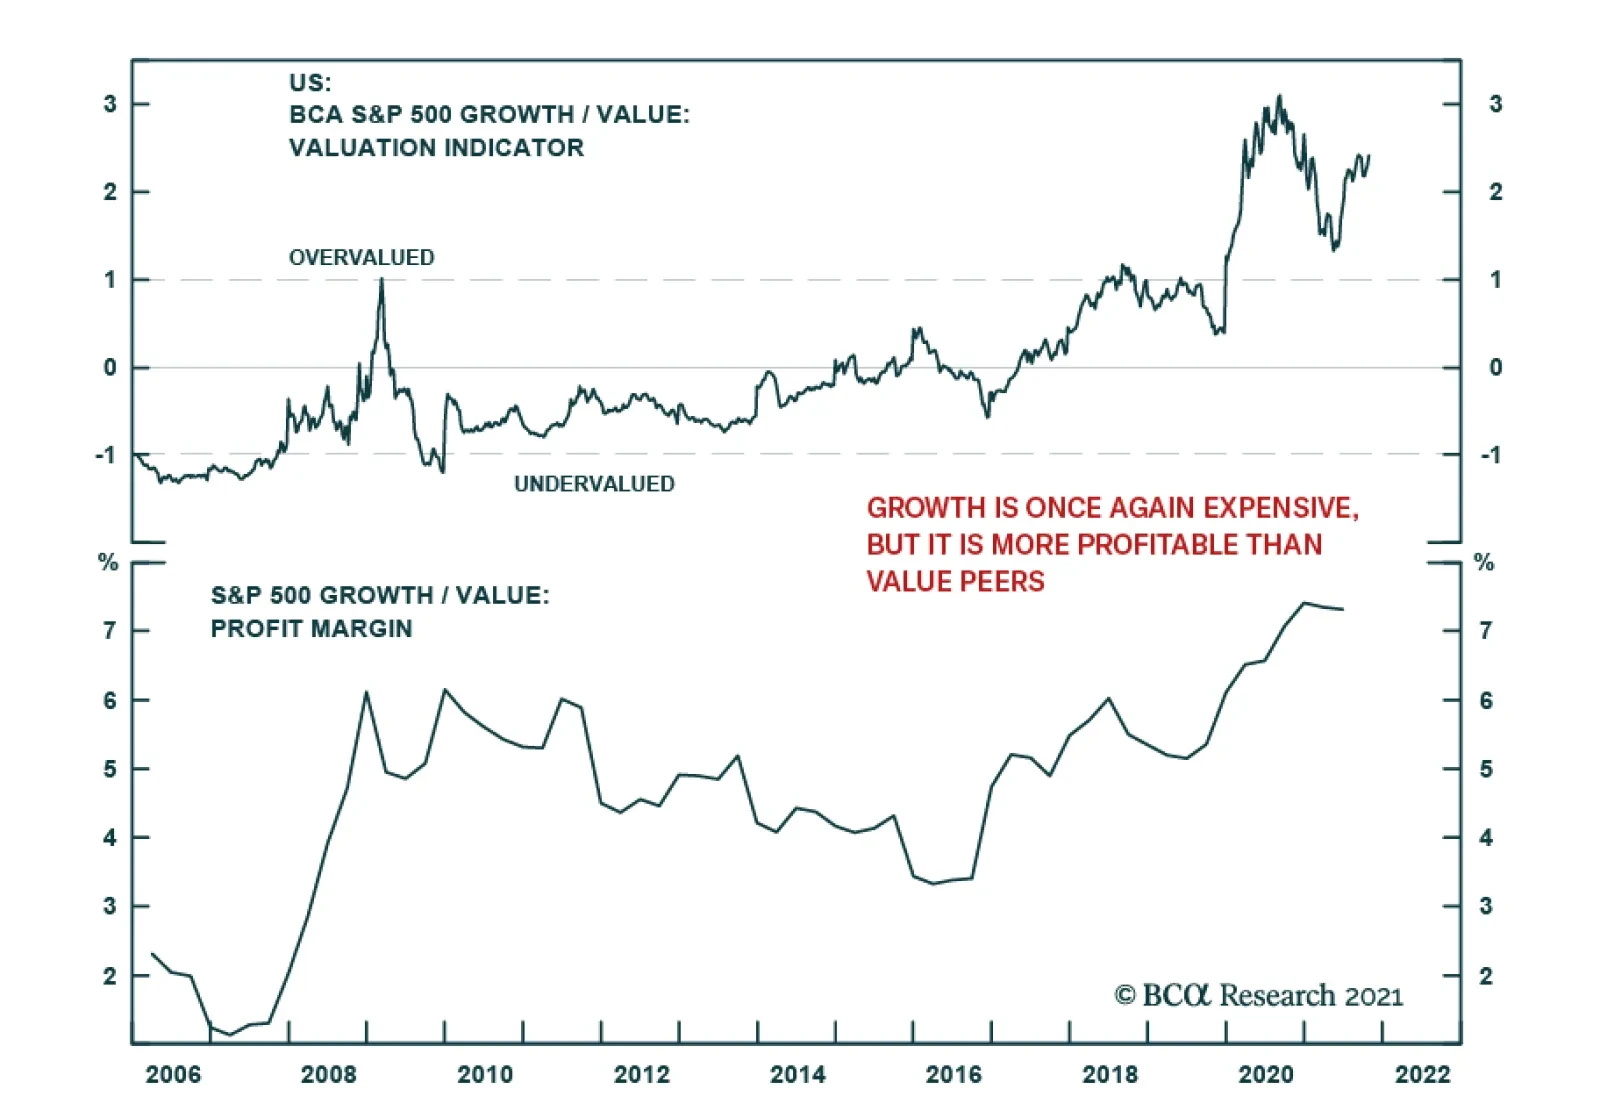
Recent weakness among key stocks that benefitted from the pandemic suggests that the stay at home trade is nearing exhaustion. Our equity strategists’ growth/value valuation indicator shows that growth stocks are once again expensive. Similarly, their…
Highlights Rate Hikes Are Coming – O/W Banks And Small Caps: Rampant inflation is changing investor expectations on the timing and speed of rate hikes. At present, the market is pricing in three rate hikes in 2022. Overweight sectors that outperform in a rising rates environment. Shortages Of Goods – O/W Semis: Overweight industries which are upstream in the supply chain, such as semiconductor manufacturers. They enjoy strong pent-up demand and significant pricing power. Transportation Bottlenecks – O/W Airfreight, Road And Rail: While skyrocketing transportation costs are a boost for most, they are a boon for ocean shipping lines, and US transport companies, such as truck lines and railways. Pent-Up Demand For Services – O/W Travel Complex: The ISM PMI Non-Manufacturing composite reading indicates that demand for services still exceeds demand for goods. Stay overweight Hotels, Restaurants, Entertainment and Professional Business Services. Underweight Airlines for now. US Consumers Are Feeling Poorer – This Will Weight On Profits: Real wages are not keeping up with prices, erasing American consumer purchasing power, thus putting a lid on corporate pricing power. This will hurt profits in the Consumer Discretionary sector, in addition to causing broad-based margin compression. Fundamentals Are Strong For Now: Companies delivered blockbuster Q3 2021 earnings results and peak margins. However, an unusually high percentage of companies (52.6%) were guiding lower. Rising labor costs, reduced productivity, and loss of corporate pricing power will lead to margin compression as early as 2022. Strong Equity Inflows Into Year-End: Late-in-year catchup pension contributions translate into strong inflows into US equities after the early fall hiatus. Buying on dips still offers downward protection from a major market pullback. Buybacks vs Dividends: Share buybacks are on the rise, seemingly displacing dividends as a means of returning cash to shareholders. For cash yield, focus on sectors known for using buybacks to disburse cash to shareholders: Technology and Financials.
Image
Reiterating Investment Positioning Overarching Macroeconomic Themes Rate Hikes Are Coming Taper Tantrum 2.0 rotation is running its course: Sectors and styles most adversely affected by rising rates, such as Consumer Staples, Communications, Services and Health Care have underperformed in October (Chart 1), while cyclicals, geared to rising rates, have outperformed. Growth/Technology has benefited from recent rate stabilization.
Chart 1
Chart 2Market Is Pricing In Three Rate Hikes in 2022
Market Is Pricing In Three Rate Hikes in 2022
Market Is Pricing In Three Rate Hikes in 2022
Market now expects three rate hikes by the end of 2022: Rampant inflation is changing investor expectations on the timing and the speed of rate hikes. A month ago, the probability of two rate hikes in 2022 stood at around 55%. Now, the probability of three rate hikes is roughly 64% (Chart 2). The BCA house view is that the Fed will raise rates once in December 2022 – an outlook much more temperate than the market’s. Investment Implication: Banks, Small Caps and Cyclicals outperform in a rising rates environment (Table 1). Table 1Recent Performance Of Sectors In A Rising Rates Regime
US Equity Chart Pack
US Equity Chart Pack
Shortages Of Goods Shortages are ubiquitous. How do we make money from this theme? We choose industries that are positioned upstream in the supply chain; for example, we prefer Semis to Durable Goods (Chart 3). Manufacturers of chips face strong demand and significant pricing power, while durable goods manufacturers face shortages and have to pass higher input costs on to their customers, which constrains demand and sales growth. Of course, there is also another aspect contributing to the underperformance of durables: Purchases of goods have exceeded the pre-pandemic trend and turned. Over the past three months, semis outperformed the S&P 500 by nearly 5%, while durables underperformed by 12%. Investment Implication: Stay overweight Semiconductors and Semiconductor Equipment, underweight Durable Goods (Table 2). Chart 3Demand for Chips Is Booming
Demand for Chips Is Booming
Demand for Chips Is Booming
Table 2Sectors Affected By Shortage: Recent Performance
US Equity Chart Pack
US Equity Chart Pack
Pent-Up Demand for Services The ISM Non-Manufacturing PMI for October has come in at a record 66.7 (62 expected) (Chart 4A), and new orders are soaring at 70. These readings exceed the ISM Manufacturing PMI (60.8), suggesting that demand for services still exceeds demand for goods. Furthermore, spending on services is still below pre-pandemic levels, and the rebound is running its course (Chart 4B). We conclude that our “pent-up demand for services” investment theme still has legs. Chart 4AISM Services Is Soaring
ISM Services Is Soaring
ISM Services Is Soaring
Chart 4BStill Strong Pent-up Demand For Services
Still Strong Pent-up Demand For Services
Still Strong Pent-up Demand For Services
Investment Implication: Stay overweight Hotels, Restaurants, Entertainment and Professional Business Services (Table 3). Stay away from Airlines for now. Table 3Travel Complex: Recent Performance
US Equity Chart Pack
US Equity Chart Pack
Transportation Bottlenecks Shipping costs continue their ascent (Chart 5). Over 100 ships are currently anchored in LA/Long Beach ports compared to almost immediate unloading before the pandemic. While rising transportation costs are denting the profit margins of a wide range of companies, from retailers to manufacturers, they are a boon for ocean shipping lines, and US transport companies, such as truck lines and railways. Case in point: A.P. Moller-Maersk, the world’s largest boxship operator, delivered $5.44B in quarterly profits last week – doubling its entire 2020 income, on the heels of the unprofitable years of 2018 and 2019.1 Profits of other freight operators are also surging. Investors take notice: After a stretch of underperformance, the S&P 500 Transportation Index outperformed the S&P 500 by 6.55% in October. Chart 5Shipping Costs Still Exorbitant
Shipping Costs Still Exorbitant
Shipping Costs Still Exorbitant
Investment Implication: Continue overweight of Transportation Services, specifically Air Freight and Logistics, and Road and Rail (Table 4). Table 4Transportation: Recent Performance
US Equity Chart Pack
US Equity Chart Pack
US Consumers Are Feeling Poorer Consumers are right to worry about inflation: Nominal wages increased by 4.5% Year-on-Year in October, the highest reading over the past 40 years. However, real wage growth is negative, i.e. it is not keeping up with prices, erasing American consumers’ buying power (Chart 6). According to a Gallup survey, upticks in citations of the deficit and inflation are largely responsible for an increase in mentions of any economic issue – from 16% in September to 24% in October.2 According to the Conference Board survey, consumers expect prices to rise by 7% over the next 12 months. Loss of purchasing power is bound to dampen consumer demand, as we have seen with demand for Consumer Durables and Autos which has collapsed due to shortages and sky-high prices. Corporate pricing power is waning: As a result of pressures on consumer purchasing power, US producers are reporting that they find it harder to raise prices. Looking ahead, companies will have to absorb price increases (Chart 7). Chart 6Wage Increases Are Not Keeping Up With Inflation
Wage Increases Are Not Keeping Up With Inflation
Wage Increases Are Not Keeping Up With Inflation
Chart 7Corporate Pricing Power Is Waning
Corporate Pricing Power Is Waning
Corporate Pricing Power Is Waning
Investment Implication: Erosion of consumer pricing power will eventually harm the Consumer Discretionary sector and will lead to a broad-based margin compression. Fundamentals Peak margins are here: The confluence of rising wages, falling productivity, and reduced ability to raise prices translates into an impending margin squeeze. We forecast that the year-over-year margin change will be negative in 2022 (Chart 8). The Q3 2021 earnings season delivered blockbuster results so far with roughly two-thirds of the companies reporting, and results are striking. 83% of companies have beaten the street expectations with the average earnings surprise standing at 11% (Chart 9).
Chart 8
Chart 9
Sales beats are only marginally worse: 77% of the companies have exceeded expectations with an average sales surprise of 3%. Quarter-on-quarter earnings growth is 0.25%, exceeding an expected 6% contraction. Compared to Q3 2019, EPS CAGR is 12%. These results indicate that street expectations were a low bar to clear. Forward guidance is concerning: Most companies commented that supply chain bottlenecks and soaring shipping costs are the major headwinds. Most companies have navigated a challenging economic environment swimmingly so far. However, looking ahead, waning pricing power, falling productivity, and rising costs will weigh on profitability. These factors are the ubiquitous reasons for negative guidance: 52.6% of companies are guiding lower for Q4 2021 (compare that to 32.7% in the previous quarter). Investment Implication: It is likely that the Q4 2021 earnings season disappoints. Sentiment Strong inflows into US equities after early fall hiatus. This can be explained by FOMO (fear of missing out), and lots of cash sitting on the sidelines, which many retail investors aim to park in US equities (Chart 10). Furthermore, historically, November and December have been characterized by robust equity inflows: Retail investors wait until the end of the year to reach clarity on their financial situation and to allocate funds to 401Ks, IRAs, and 529s. Investment Implication: Buying on dips still offers downward protection from a major market pullback. Chart 10Strong Inflows Into US Equities: Buying On Dip Is Still En Vogue
Strong Inflows Into US Equities: Buying On Dip Is Still En Vogue
Strong Inflows Into US Equities: Buying On Dip Is Still En Vogue
Uses Of Cash Buybacks Replace Dividends: Share buybacks are on the rise again (Chart 11, Panel 1), seemingly displacing dividends as a means of returning cash to shareholders: The dividend payout ratio is flagging (Chart 11, Panel 2). From a corporate standpoint, dividends require a long-term commitment, while buybacks can be a “one-off,” lending more flexibility to corporate treasurers. Corporations also prefer buybacks as they reduce their share count and inflate earnings per share. Investment Implication: For cash yield, focus on sectors known for using buybacks to disburse cash to shareholders: Technology and Financials. Chart 11Buybacks Are Replacing Dividends
Buybacks Are Replacing Dividends
Buybacks Are Replacing Dividends
Irene Tunkel Chief Strategist, US Equity Strategy irene.tunkel@bcaresearch.com S&P 500 Chart 12Macroeconomic Backdrop
Macroeconomic Backdrop
Macroeconomic Backdrop
Chart 13Profitability
Profitability
Profitability
Chart 14Valuations And Technicals
Valuations And Technicals
Valuations And Technicals
Chart 15Uses Of Cash
Uses Of Cash
Uses Of Cash
Cyclicals Vs Defensives Chart 16Macroeconomic Backdrop
Macroeconomic Backdrop
Macroeconomic Backdrop
Chart 17Profitability
Profitability
Profitability
Chart 18Valuation And Technicals
Valuation And Technicals
Valuation And Technicals
Chart 19Uses Of Cash
Uses Of Cash
Uses Of Cash
Growth Vs Value Chart 20Macroeconomic Backdrop
Macroeconomic Backdrop
Macroeconomic Backdrop
Chart 21Profitability
Profitability
Profitability
Chart 22Valuations And Technicals
Valuations And Technicals
Valuations And Technicals
Small Vs Large Chart 23Macroeconomic Backdrop
Macroeconomic Backdrop
Macroeconomic Backdrop
Chart 24Profitability
Profitability
Profitability
Chart 25Valuations and Technicals
Valuations and Technicals
Valuations and Technicals
Chart 26Uses Of Cash
Uses Of Cash
Uses Of Cash
Footnotes 1 WSJ, Supply-Chain Pain Is Maersk’s Gain as $5.44 Billion Profit Dwarfs Amazon, UPS, November 2, 2021. 2 Job Market Ratings Set Record, but Economic Confidence Slides (gallup.com), October 27, 2021. Recommended Allocation
We will be holding our quarterly webcasts next Monday, November 15th at 10:00 a.m. Eastern time and Tuesday, November 16th at 8:00 a.m. Hong Kong time in lieu of publishing a Weekly Report. Please join us with your questions to make it a fully interactive event. We will resume our regular publication schedule on the 22nd. Highlights Economy – Wages could be on the rise if workers are able to exploit the considerable leverage they now enjoy: The labor market currently has no slack. Workers’ ability to derive a lasting advantage from today’s shortages will determine if the extended decline in labor’s share of income will reverse. Markets – Lengthy agreements in labor’s favor could give inflation an additional impetus: Investors are not prepared for a shift in the balance of power from management to labor and a range of assets will have to reprice if workers can achieve some durable victories. Strategy – Keep an eye on labor agreements, which could hasten a shift to more defensive positioning: The current economic backdrop, along with accommodative monetary and fiscal policy, support risk-friendly portfolio positioning, but a labor revival could prompt the Fed to engage in a disruptive tightening cycle that would halt the bull markets in equities and credit and possibly also short-circuit the expansion. Feature At the end of 2019, tiring of the market debates du jour, we began haunting the New York Public Library, reading all we could about US labor relations history. Several books and rolls of microfilm later, we published a three-part Special Report on workers’ past, present and future. While we concluded that organized labor would not regain the influence it wielded in the fifties, sixties and seventies, we thought that investors were underestimating the potential for workers to reverse the grinding decline in their fortunes that began in the early eighties. Public opinion seemed to be shifting in workers’ favor, especially among the young; the coming election held promise for the Democrats; and the pendulum had swung so far, for so long, that there was little scope for management to gain any more ground. We looked forward to countering the view that organized labor was as dead as a doornail, only to have COVID-19 render the topic irrelevant. Nearly two years later, however, dislocations caused by the pandemic have pushed negotiations over wages and labor conditions to the fore. Amidst a recent flurry of strikes against S&P 500 constituents, clients have been asking what the labor future holds. We refresh the themes we identified in our initial analysis, noting how conditions have shifted since early 2020. The investment takeaway is that increasing labor muscle could stoke inflation and push long-run inflation expectations higher, forcing the Fed to tighten monetary policy more abruptly than markets expect. The 2020 Election Went Labor’s Way A review of the historical record makes it crystal clear that employees cannot gain ground if government sides with employers. The 2020 election, which delivered both the White House and the Senate to Democrats, put some unexpected wind in labor’s sails. They did not mark a revival of the New Deal, however, as Democrats’ legislative majorities are precariously thin and unlikely to survive the 2022 midterms, their control of the presidency may not extend beyond 2024, and the federal judiciary will be inclined to see things management’s way for some time thanks to past conservative appointments. At the state level, the executive and legislative branches remain firmly in Republican control. A friendly executive branch can do a lot to reset the scales nonetheless. The Biden Department of Labor, National Labor Relations Board (NLRB), Occupational Safety and Health Administration (OSHA) and Department of Justice are certain to enforce existing worker protection laws more vigorously than their recent predecessors, while more actively challenging business combinations. Joe Biden began his election campaign at a Pittsburgh union hall and returned to the Steel City to end it, promising to be “the most pro-union president you’ve ever seen.” Labor leaders have generally given him high marks since taking office for supporting legislation to make it easier for workers to organize and he publicly offered moral support to John Deere’s UAW workers when they went on strike last month, saying, “My message is they have a right to strike and they have a right to demand higher wages.” Public Opinion Has Continued To Shift Toward Labor We noted two years ago that young Democratic voters overwhelmingly favored Bernie Sanders’ and Elizabeth Warren’s candidacies, suggesting that solidarity with workers might be on the rise. It is no surprise that students would be the most avid supporters of progressive campaigns, but Millennials, born between 1981 and 1996, and Generation Z might be viewed as the Inequality Generations, having entered the workforce after China’s admittance to the WTO, which coincided with a peak in labor’s share of income (Chart 1). Their lives have spanned the September 11th attacks, the financial crisis, a once-in-a-century pandemic and three equity market crashes, and many of them started adulthood with onerous student debt burdens and dim earnings prospects. They might find the notion of a union buffer from market forces especially alluring and therefore view unions favorably. The 2019 Gallup poll found that public approval for unions had reached nearly 20-year highs; two years on, it’s up to levels last reached over 50 years ago (Chart 2). Chart 1Workers' Share Of The Pie Shrank For 15 Years
Workers' Share Of The Pie Shrank For 15 Years
Workers' Share Of The Pie Shrank For 15 Years
Chart 2Extreme Makeover
Extreme Makeover
Extreme Makeover
Public opinion is crucially important to the outcome of labor negotiations because for-profit employers will seek the most favorable terms they can get, to the extent that they are socially acceptable. In our schematic of the 1980s vicious circle that initiated unions’ 40-year decline, public opinion made it possible for the Reagan administration to take a hard line against the air traffic controllers’ union and emboldened private employers to take more aggressive measures as well (Figure 1). Beyond the private sector, elected officials reliably deliver what their constituents want, and the courts do, too, albeit with a longer lag. The median voter theory advanced by our geopolitical strategists doesn’t just predict future outcomes, it directly influences them.
Chart
Striketober Another key takeaway from our original study was that successful strikes beget strikes. Strikes are the most potent weapon in workers’ arsenal – withholding their labor threatens to reduce their employer’s output and may halt it altogether – but they are fraught with risk for individual employees. Striking workers don’t get paid beyond the partial support that may be provided by their union strike fund and may find themselves entirely out of work if the strike fails. Workers should only strike when they have a good chance of winning or when their situation has become so intolerable that they have little to lose. Strikes (and lockouts) occur when labor and management cannot reach a mutually acceptable settlement, often because at least one side overestimates its bargaining power. It is easy to agree when labor and management hold similar views about each side’s relative position, as when both perceive that one of them is considerably stronger. In that case, a settlement favoring the stronger side can be reached quickly, especially if the stronger side exercises some restraint and does not seek to impose terms that the weaker side can scarcely abide. Restraint is rational in repeated games like employer-employee bargaining, and when both parties recognize that relative bargaining positions are fluid, they are likely to exercise it. Viewing labor negotiations through a game theory lens, we posit a simple framework in which each side can hold any of five perceptions of its bargaining power, resulting in a total of 25 possible joint perceptions. Labor (L) can believe it is way stronger than Management (M), L >> M; stronger than Management, L > M; roughly equal, L ≈ M; weaker than Management, L < M; or way weaker than Management, L << M. Management also holds one of these five perceptions, and the interaction of the two sides’ perceptions establishes the path negotiations will follow. Limiting our focus to today’s prevailing conditions, Figure 2 displays only the outcomes consistent with labor’s belief that it has the upper hand. For completeness, the exhibit lists all of management’s potential perceptions, but we deem the three away from the extremes to be most likely. Record job openings and job quits rates (Chart 3) should disabuse even the most rabidly anti-union managements from thinking they hold all the cards. On the other hand, four consecutive decades of victories will make it hard for all but the most objective management negotiators to believe that the tables have completely turned and that labor is fully in control.
Chart
Chart 3It's A Labor Seller's Market ...
It's A Labor Seller's Market ...
It's A Labor Seller's Market ...
Strike outcomes turn on which side has overestimated its leverage. The broad factors we use to assess leverage are overall labor market slack; economic concentration; regulatory and legal trends; and the sustainability of either side’s accumulated advantage, which we describe as the labor-management rubber band. Other factors that matter on a case-by-case basis, but are beyond the scope of our analysis, include industry-level slack, a labor input’s susceptibility to automation, and the degree of labor specialization/skill involved in that input. For these micro-level factors, a given group of workers’ leverage is inversely related to the availability of substitutes for their input. Labor Market Slack Though we hold the view that labor force participation is likely to revive in coming months because inequality and a comparatively thin social safety net will compel many lower-income workers to return to the work force, no one knows for sure where the workers have gone or when they will return, if at all. It is abundantly clear from accelerating wage gains (Chart 4), the openings and quits rates, and small businesses’ historic inability to fill job openings (Chart 5) that the labor market is extremely tight right now. A difference of opinion about whether and how long the worker shortages will persist could make finding common ground in contract negotiations a challenge. Chart 4... As Rising Wages ...
... As Rising Wages ...
... As Rising Wages ...
Chart 5... And Frantic Employers Confirm
... And Frantic Employers Confirm
... And Frantic Employers Confirm
Economic Concentration We previously noted that the trend toward economic concentration has strengthened management’s hand in labor negotiations as it has made an increasing share of local labor markets tend toward monopsony. A monopsony is a market with a single buyer, the mirror image of a monopoly, which is a market with a single seller. Unfortunately for labor, monopsonies restrain prices just as monopolies inflate them. The trend toward economic concentration is well established and we think the probability that it will reverse is low – Congress may shake its fist at Big Tech and the Biden Justice Department will more vigorously contest mergers on anti-trust grounds, but there is an ocean of liquidity available to support acquisitions and robust CEO confidence suggests it will be deployed. Regulatory And Legal Trends Over the last four decades, unions have endured a near-constant drubbing from statehouses, federal agencies and the courts, as union and labor protections have been under siege from all sides. But the regulatory and legal tide has been such a huge benefit for employers since the beginning of the Reagan administration that it simply cannot continue to maintain its pace. Furthermore, as our Global Investment Strategy colleagues have observed, the Republican party’s lurch toward populism may leave Big Business without a champion in Washington, DC. The regulatory and legal winds are shifting and management teams that have spent their entire careers in an environment in which labor has perpetually been on the back foot may be the last to know, leading to an uptick in the number and contentiousness of labor disputes. A change in Fed policy, as unveiled in the August 2020 revision to the FOMC’s statement on longer-run monetary policy goals, has also tilted the playing field in workers’ favor. The Fed has sworn off preemptively tightening monetary policy when the labor market appears to be getting tight. The new direction contrasts with 40-plus years of Fed policy that were predicated on taking away the punch bowl before upward wage pressures could build momentum. The tacit pledge in the revised statement on monetary policy implies that the Fed will prioritize its full employment mandate over its price stability mandate in the near term. That’s not an unalloyed positive for workers, who will only be better off if their nominal wage gains outpace inflation, but it will help give them more of a head start than they would have gotten if the FOMC had stuck with the proposition that tight labor markets stoke inflation. The Labor-Management Rubber Band Employees and employers have a deeply symbiotic relationship, and we like to think of labor and management as being linked by an elastic tether with a finite range. Since neither side can indefinitely thrive if the other is suffering, the tether pulls the two sides closer together when the gap between them threatens to become too wide. When labor does too well for too long at management’s expense, profit margins shrink and the company’s viability as a going concern is threatened. When management does too well, deteriorating living standards drive the best employees away, undermining productivity and profitability. One does not have to be a card-carrying socialist to believe that the band is near its limit and that some sort of mean reversion is inevitable, given how badly real hourly wages have lagged gains in hourly output over the last 50 years (Chart 6). Chart 6Testing How Far The Labor-Management Rubber Band Can Stretch
Testing How Far The Labor-Management Rubber Band Can Stretch
Testing How Far The Labor-Management Rubber Band Can Stretch
What Comes Next Steady concentration across industries and a persistently hospitable legal and regulatory climate has given management the upper hand for four decades. Going forward, however, labor should see its fortunes improve as the legal and regulatory climate cannot get materially better for employers, and the labor-management rubber band becomes less stretched in management’s favor (Figure 3).
Chart
The major uncertainty pertains to the ongoing level of slack in the labor market and how employment agreements should account for it. All parties recognize there is no slack right now and employers are duly offering generous inducements to attract workers. Sign-on bonuses for new employees in unskilled services positions are ubiquitous and negotiations with unionized employees include ratification bonuses for signing new contract packages. Because wages are sticky on the downside – it’s difficult to get employees to swallow outright pay cuts – employers prefer making one-time concessions like bonuses to increasing wage rates across the board, which is tantamount to locking in higher long-term input costs. The duration of concessions appears to be a sticking point in the negotiations to settle the current strikes. Over the last two decades, several large companies with unionized workforces have instituted a two-tier employment track distinguishing legacy employees from new hires. The legacy employees remain on their existing salary path and retain their retirement and health insurance benefits, while new employees are subject to a lower salary scale and are entitled to fewer benefits, if any. The result has been to bend the human resources cost curve lower in the future as natural attrition shrinks the share of employees on the more costly legacy path. The two-tier employment classification has proven to be an effective way for employers to bend the cost curve to their liking, as it protects the interests of a considerable majority of employee voters at the expense of a largely hypothetical future employee constituency. It is presumably difficult to empathize with workers who aren’t yet coming to the plant every day and legacy employees haven’t dwelled on their plight when participating in contract ratification votes. An interesting feature of the ongoing John Deere strike is that the UAW rejected what appeared to be a strikingly generous package partially in the interest of defending current and future employees who have no path to reach legacy employees’ all-in compensation level. The recent strikes against S&P 500 constituents have been concentrated in industries that faced demand spikes during the pandemic. The bakery worker’s union (BCTGM) representing Kellogg’s workers struck against Frito-Lay (owned by Pepsi) for three weeks in July and Nabisco (a unit of Mondelez) for five weeks in August and September. A significant motivation for the BCTGM workers’ actions seemed to be frustration over intense pandemic workloads. Their plants ramped up capacity to fill kitchen cabinets while consumers were cooped up at home and they are now seeking redress for the emergency hours they were asked to work. (All of the bakery workers who struck, as well as the John Deere workers, were considered essential workers.) Management, on the other hand, might take the view that their employees’ sacrifices are in the past, and are not likely to be repeated if product demand settles back into its pre-pandemic trend. Viewing ongoing negotiations from our game theory perspective, there is ample room for divergent perceptions of relative negotiating strength, based on differing opinions about the persistence of pandemic trends. The divergence might make for increasingly contentious labor negotiations going forward, with strikes exacerbating supply bottlenecks and ramping up near-term inflation pressures. If ongoing rounds of labor negotiations result in workers achieving longer-term victories, it will pressure corporate profit margins. Labor gains will also potentially feed into inflation if capacity is not poised to meet the ensuing increase in aggregate demand. We will keep close tabs on labor negotiations as the economy works its way back to a post-pandemic steady state. Doug Peta, CFA Chief US Investment Strategist dougp@bcaresearch.com