United States
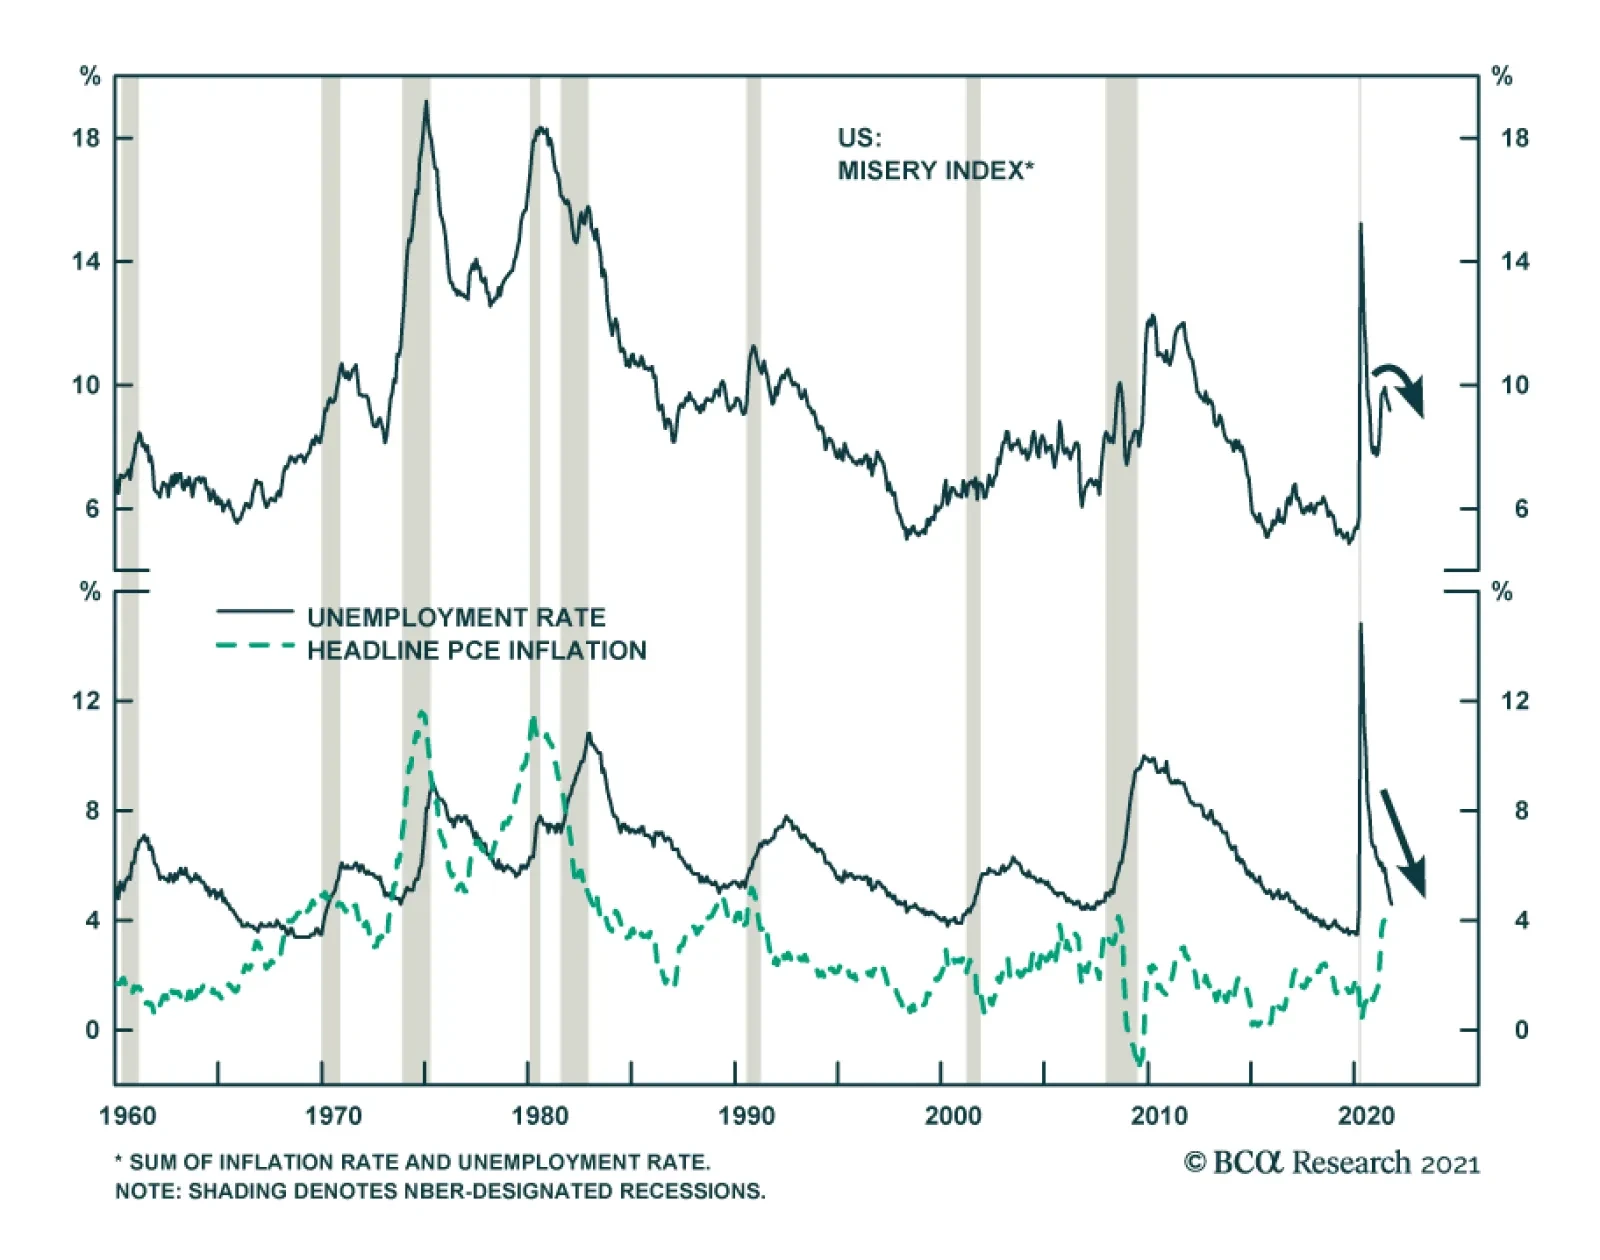
Our colleagues at BCA Research’s Bank Credit Analyst service recently showed the US misery index – the sum of the unemployment rate and the inflation rate – as a measure of the risk of stagflation. They highlighted that the misery index rose sharply at the…
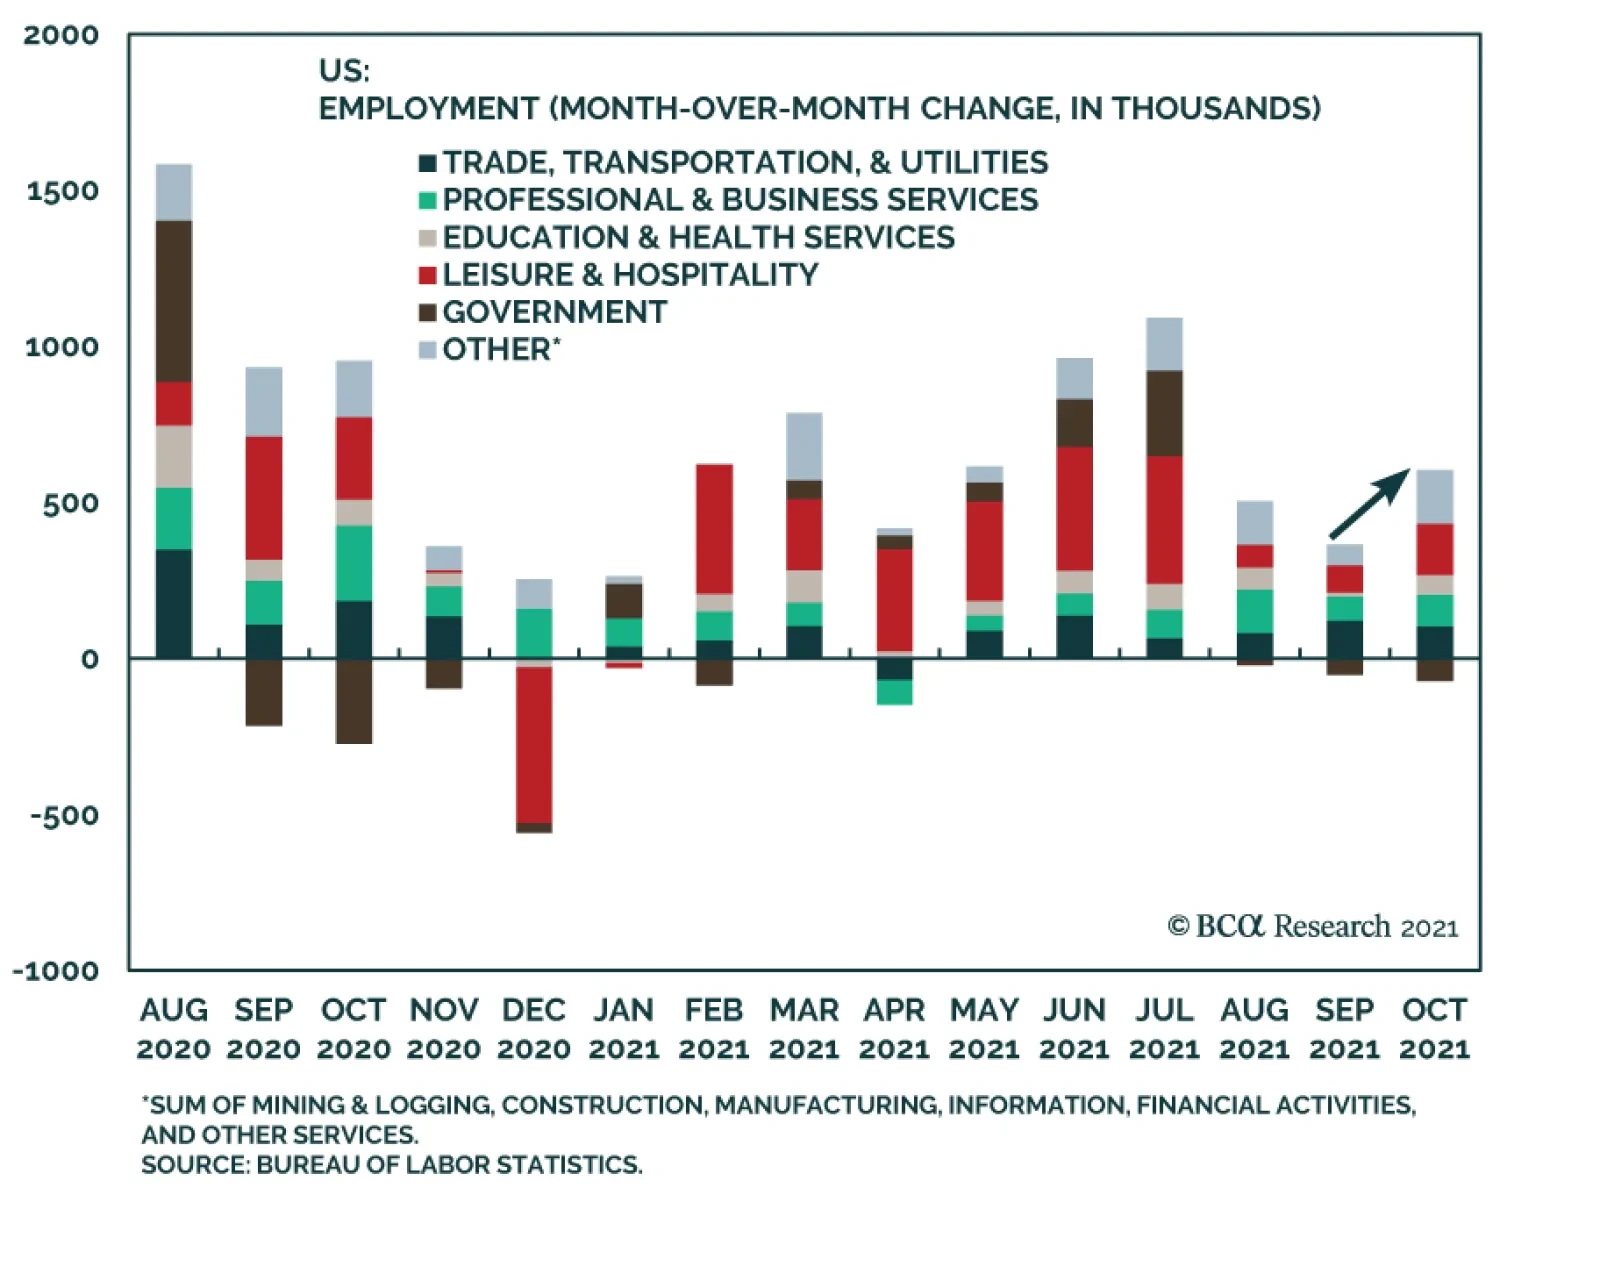
The October jobs report surprised to the upside and suggests that the labor market recovery is reaccelerating following the slowdown in August and September. Nonfarm payroll employment increased by 531 thousand, beating expectations of 450 thousand. Moreover,…
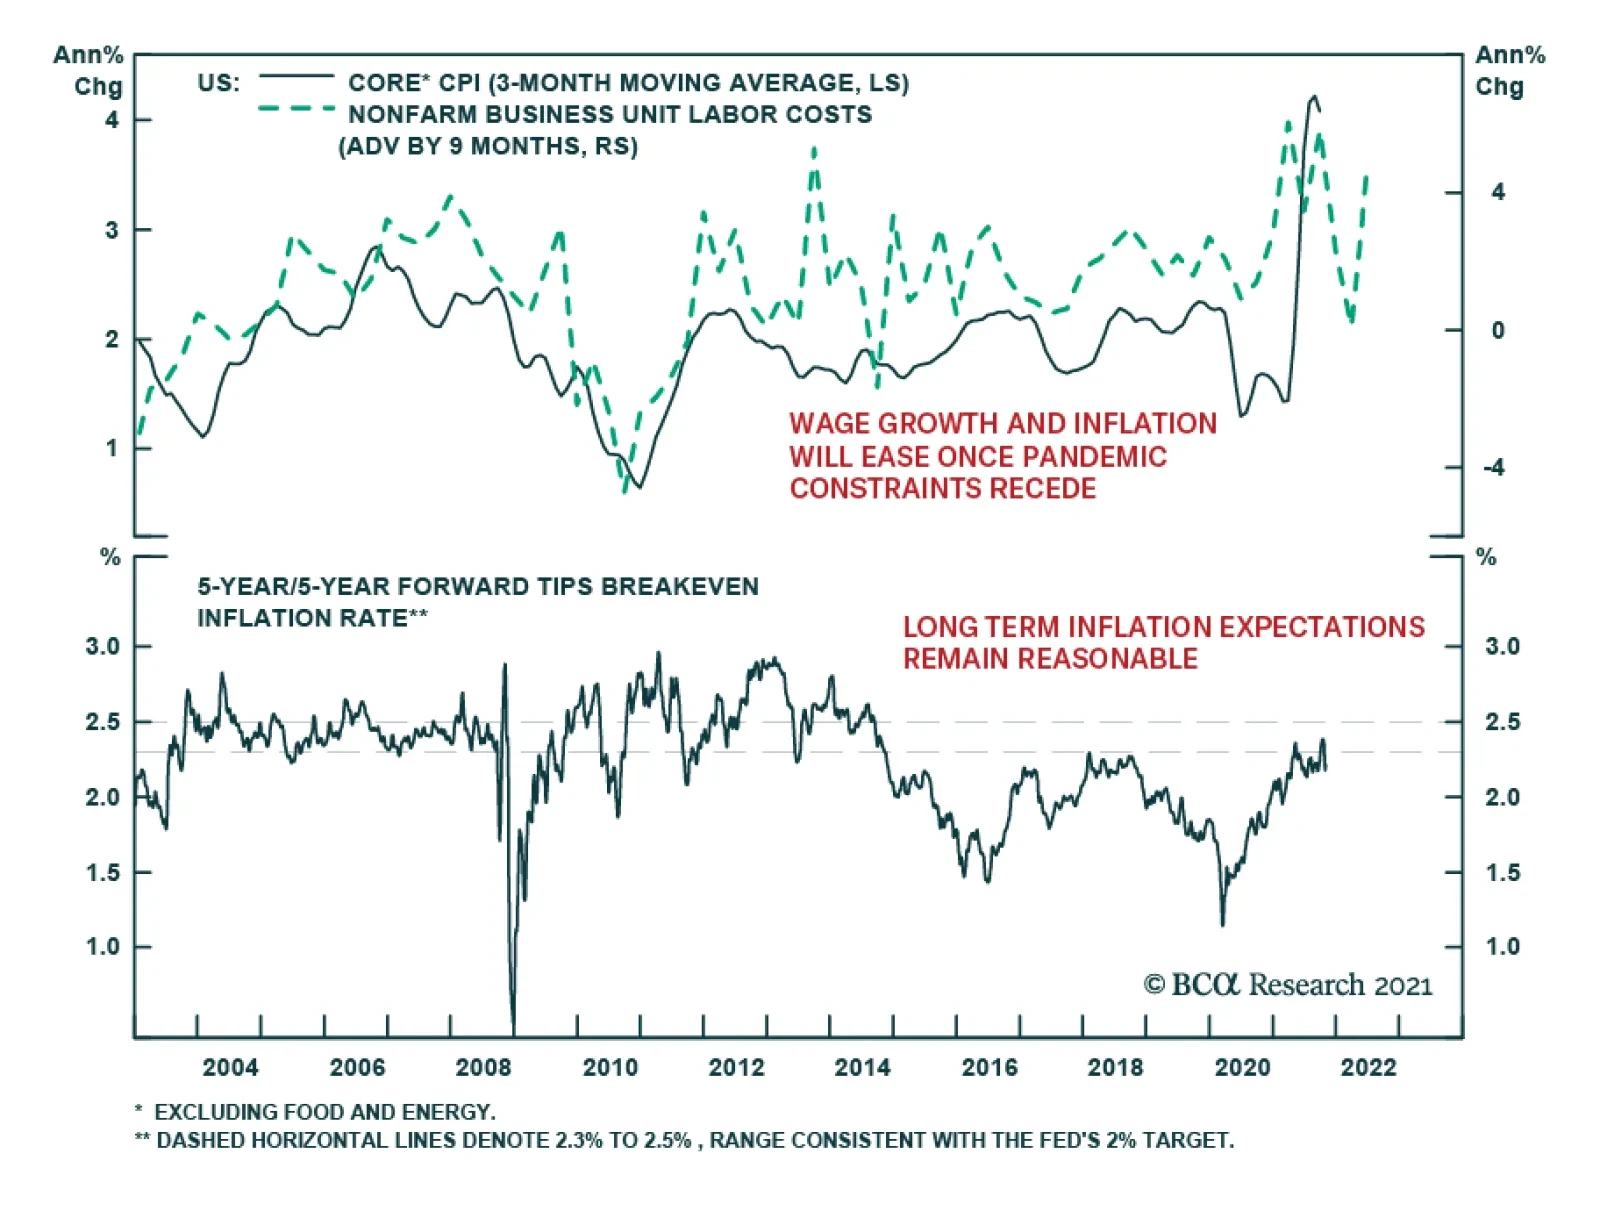
Unit labor costs in the US nonfarm business sector surged 8.3% in Q3 following Q2’s 1.1%, beating expectations of 7.0%. T increase in unit labor costs reflects both lower productivity and higher hourly compensation. Nonfarm productivity fell 5.0% – the…
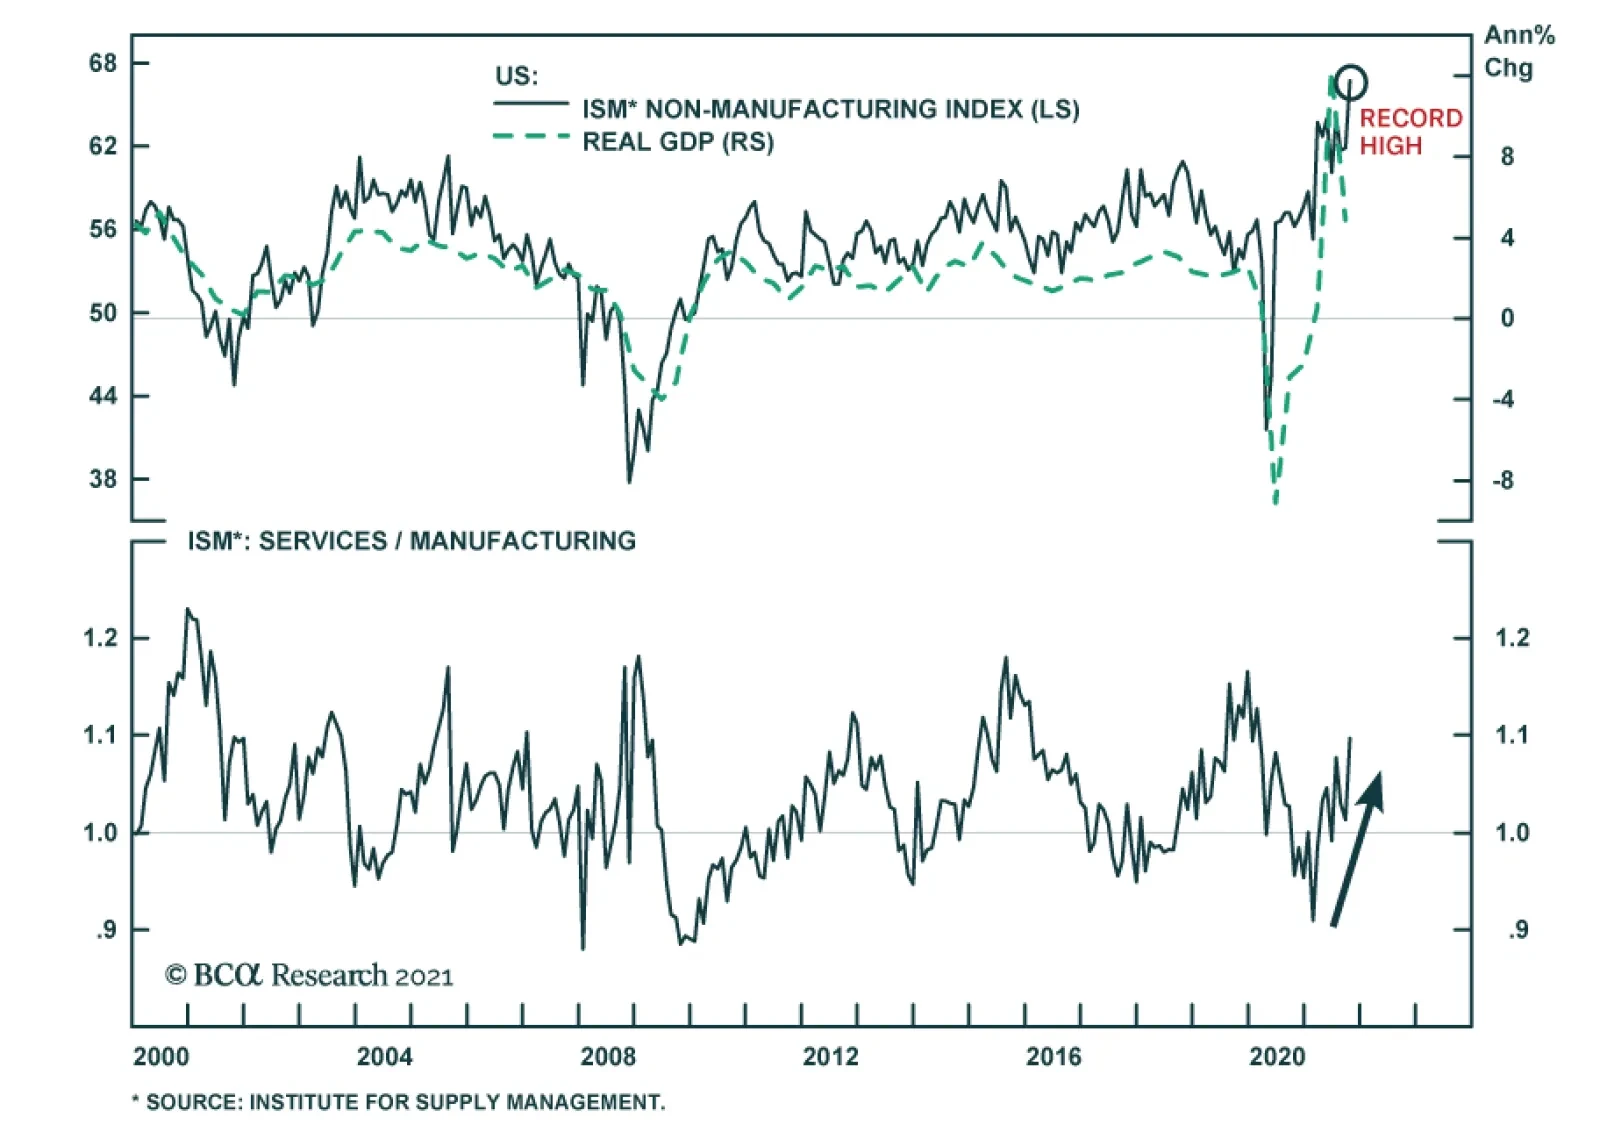
PMIs suggest that service sector activity benefited from a continued improvement in the pandemic situation in October. The US ISM Services PMI gained 4.8 points and reached a new all-time high of 66.7 – beating expectations it would remain broadly unchanged.…
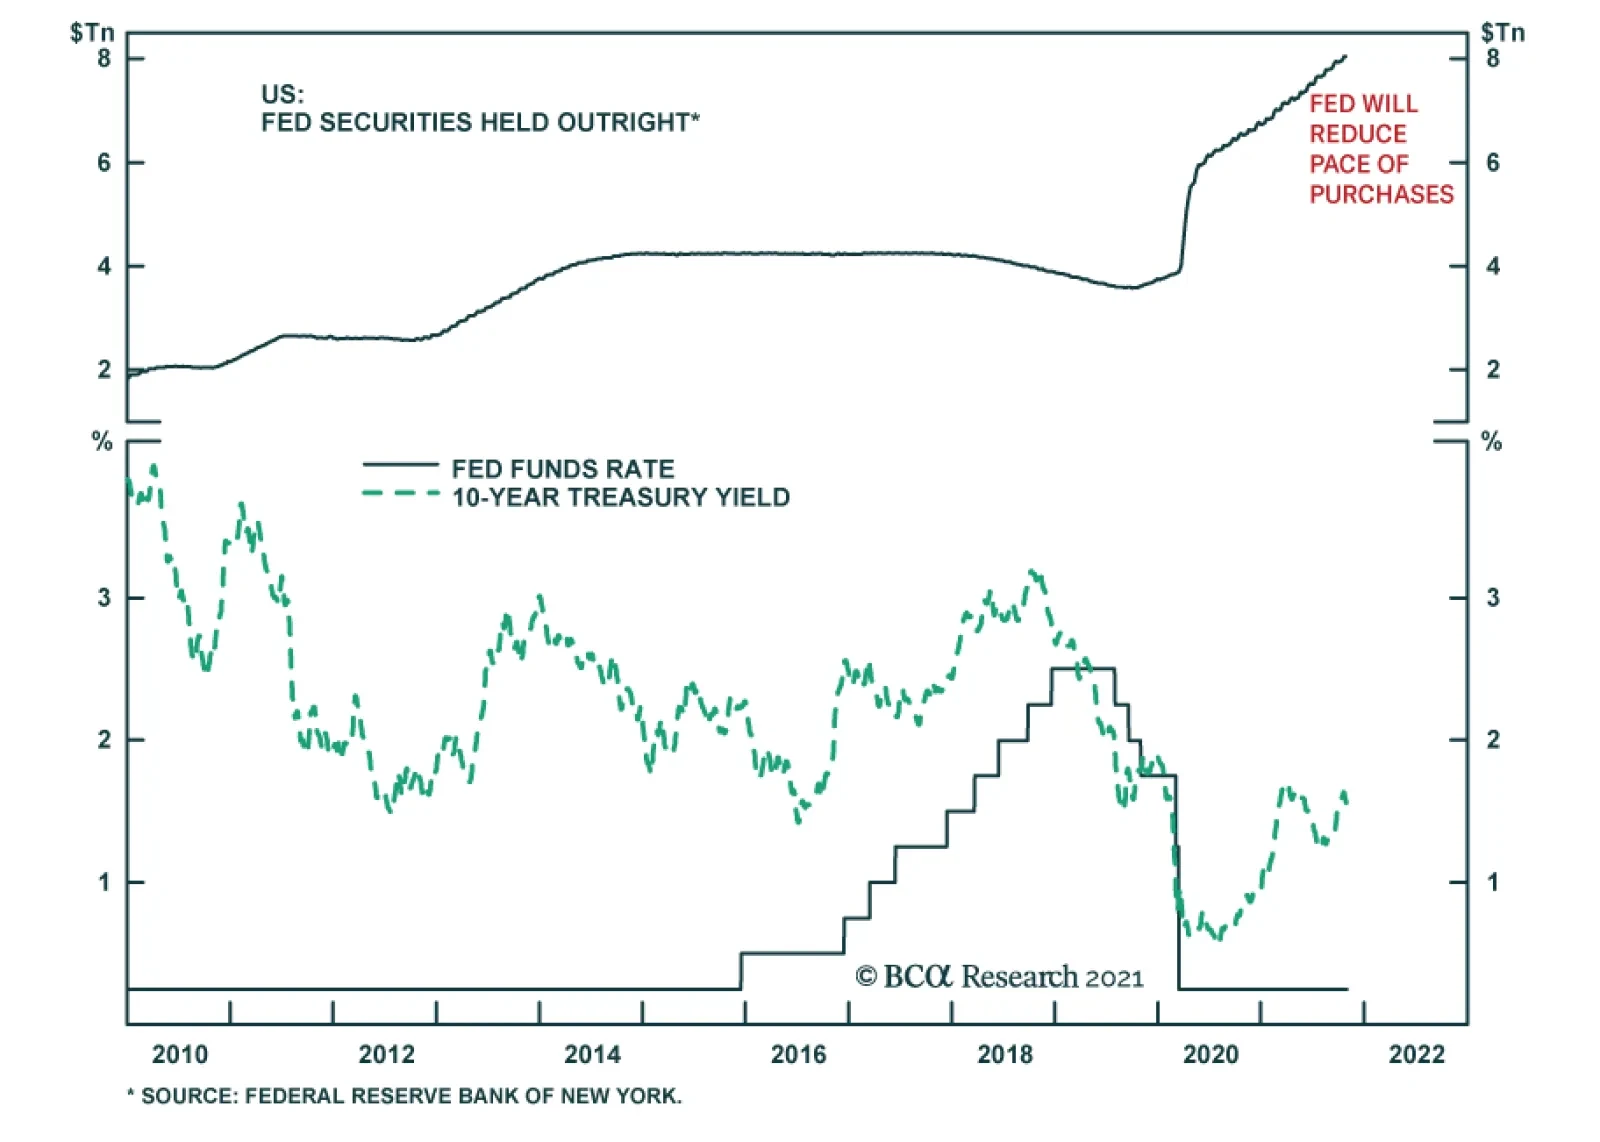
As expected, the Fed announced that beginning later this month, it will start reducing the monthly pace of its asset purchases by $10 billion for Treasury securities and by $5 billion for agency mortgage-backed securities in November and December. The press…
Results from Tuesday’s US special elections are a warning sign to Democrats and reinforce market expectations that the US Congress will return to gridlock with the 2022 midterm elections. Most notably, Republican Glenn Youngkin won Virginia’s governor’s race…

Nearly two-thirds of the S&P 500 companies reported their Q3 earnings, and the earnings season is drawing to a close. 83% of companies have beaten the street expectations with an average earnings surprise standing at 11% (40% earnings growth vs. 29% expected on October 1, 2021). Sales beats are only marginally worse: 77% of the companies have exceeded expectations with an average sales surprise of 3%. Quarter-on-quarter earnings growth is 0.25% exceeding expected 6% contraction. Compared to Q3-2019, eps CAGR is 12%. Chart 1
Approaching The Finish Line
Approaching The Finish Line
Financials, Energy, and Health Care have delivered the largest earnings surprises. Financials have done well on the back of the robust M&A activity, while the unfolding energy crisis has lifted the overall S&P 500 Energy complex. Pent-up demand for the elective medical procedures has translated into strong Health Care earnings. Industrials and Materials were amongst the worst: China-related headwinds continue to weigh on both of these sectors. However, some analysts expect China to ease in Q1-2022, providing a tailwind for these sectors. Most companies commented that supply chain bottlenecks and soaring shipping costs are the major headwinds. However, as we see, most have navigated a challenging economic environment swimmingly. Strong pricing power and operating leverage have preserved margins and earnings so far. Looking ahead, companies’ ability to raise prices further is waning (Chart 1), while costs continue marching up. These factors are the ubiquitous reasons for a negative guidance – 52.6% of companies are guiding lower for Q4-2021 (compare that to 32.7% previous quarter). Bottom Line: Companies are exceeding analysts’ expectations both in terms of sales and earnings growth.
Chart
Highlights The off-year elections confirm that regular political cycles continue to operate in the US despite the chaotic 2020 election. The implication is negative for Democrats, especially House Democrats in the 2022 midterms. The progressives will also lose clout. Yet several factors that hurt Democrats in the off-year elections will improve over the coming year. The pandemic will wane and the economy will recover. Biden now has a framework for passing his two signature legislative bills, the reconciliation bill has been moderated away from radical proposals, and his approval rating will rebound when he signs the bills into law. The Senate is very much up for grabs in 2022 and there is at least a 25% chance Democrats retain control of Congress. Investors can expect gridlock to begin right after the Senate passes Biden’s reconciliation bill. A Republican midterm win would merely formalize it. Fiscal policy will be decided over the next two months, then frozen in place until at least 2025. Financial markets will approve of the drop in uncertainty. We still expect investors to “buy the rumor, sell the news” on Biden’s bills. But the watering down of tax hikes is a positive surprise. Over the long run Biden’s bills are positive for productivity. Feature Democrats suffered negative results in elections on November 2 highlighting that US politics is still very much a two-party game. In Virginia, Republican Glenn Youngkin defeated Democrat Terry McAuliffe by 2%, a substantial swing from the 5%-10% margins with which Democrats have carried the state in recent elections (Chart 1). The Virginia gubernatorial race has limited predictive power for the midterm elections. But the GOP had a good night in general and benefited from national dynamics. Republicans were already widely expected to take the House next year – Tuesday’s results confirm that expectation. But the Senate is still up for grabs, as the midterms are a year away (see Appendix for the latest update of our Senate Election Model).
Chart 1
The Biden administration will benefit over the coming year from passing its signature legislation and presiding over a waning pandemic and recovering economy. Biden now has a framework agreement with Democrats on his infrastructure and social spending bills, discussed below. Gridlock will become the default setting as early as Thanksgiving or Christmas, when Democrats pass Biden’s two bills. A Republican win in the midterms would merely make it official. Gridlock is marginally positive for risk assets as it reduces uncertainty around fiscal policy and economic policy in general. Thus US political and policy risks will subside after the Senate clears Biden’s reconciliation bill and investors will need to turn to other major risks stemming from wages, inflation, eventual rate hikes, and external factors like China’s slowdown. Biden’s Framework Fiscal Agreement President Biden struck a tentative deal with congressional Democratic leaders prior to leaving for his European trip and the COP26 conference on climate change in Glasgow, Scotland. The bipartisan infrastructure deal remains the same but his signature social spending deal – to be pushed through the partisan budget reconciliation process – was cut down to $1.75 trillion. Chart 2 shows the two bills and the sums of spending by category. The Democrats plan to spend $940 billion on social programs (child care, elderly care, Medicare, health care, housing, education). They will spend $481 billion on green energy subsidies and regearing of the energy economy. They will spend $446 billion on traditional infrastructure (with the GOP) and $230 billion on high-tech initiatives. The negotiation is ongoing and there is not yet a settled draft of the reconciliation bill, so surprises are still possible, such as on Medicare negotiation of drug prices or the state and local tax deduction cap.
Chart 2
Senator Joe Manchin of West Virginia is fighting to ensure that the bill will be analyzed and scored by the Congressional Budget Office (CBO) in time for lawmakers to consider its economic impacts before voting on it. But the CBO cannot score a bill that is not yet written down. Nevertheless, the bill has been coming together in recent weeks and the poor election results will push Democrats to a speedy resolution. The progressives are weaker now, as the elections reflected negatively on them, and any last-minute progressive threats in the Senate will be steamrolled by President Biden and party leadership. Table 1 shows our updated scenarios for Biden’s pre-COP26 framework agreement. The impact on the budget ranges from $80 billion dollars in net savings, according to the fictitious headline agreement, to $1 trillion in net deficit spending if we assume that Democrats only realize half of the revenue they hope to raise from a tougher Internal Revenue Service (IRS) and half of the revenue from higher taxes. Table 1US Spending And Taxation Scenarios
Takeaways From The Off-Year Elections
Takeaways From The Off-Year Elections
Table 2 itemizes the actual spending programs in this framework deal along with the bipartisan infrastructure plan, which remains at $550 billion in net deficit spending. The cumulative spending ranges from $1.9 to $2.4 trillion, which will then need to be offset by tax measures. Table 2US Spending Scenarios
Takeaways From The Off-Year Elections
Takeaways From The Off-Year Elections
Table 3 highlights the tax measures and the amount of revenue they are expected to raise. Notice that moderate Democrats have thus far succeeded in striking out the original corporate tax hike and top individual income tax hike. What is left is the minimum corporate rate – in line with Biden’s international agreement – and a series of smaller taxes and surcharges on stock buybacks and the wealthy. Table 3US Taxation Scenarios
Takeaways From The Off-Year Elections
Takeaways From The Off-Year Elections
Table 4 shows an itemized version of the spending programs with annotations for the changes that have occurred so far while the bill is on the chopping block. This is a loose tally of the status of negotiations. Biden’s framework deal is a major liberal spending bill likely to have a net deficit impact of $1-$1.5 trillion (infrastructure plus reconciliation). Yet it is a far cry from his party’s original, visionary proposals. Moderate Democrats succeeded in moderating the ambitions of the democratic socialists. The bill does not constitute a major redistribution of wealth. As it stands, Biden is looking to maintain President Trump’s low tax rates on corporations and high-income earners. Table 4Congressional Democratic Plan Up For Negotiation
Takeaways From The Off-Year Elections
Takeaways From The Off-Year Elections
Off-Year Election Results Tuesday’s elections do not change the balance of power in the House of Representatives. The two House seats in Ohio produced the expected results in the Democratic-leaning eleventh district and the Republican-leaning fifteenth district (Chart 3). Another Democratic-leaning House seat will be determined in Florida in January. The House of Representatives is still very closely divided, with Democrats holding a three-seat de facto majority – meaning that if Democrats lose three votes, they cannot pass legislation. This slim majority is what is forcing them to compromise their spending bills (Chart 4). If the progressives refuse to support the final bills then the party will suffer a disaster in the midterms, so progressives are forced to capitulate.
Chart 3
Chart 4
Republicans not only won the Virginia governor’s seat but could emerge victorious in the New Jersey gubernatorial election, which would be a big surprise (Chart 5). The tight New Jersey race reflects the fact that the Republicans had a good night in general – they also did well in various down-ballot races (Chart 6).
Chart 5
Chart 6
Hence national politics had a substantial impact on these local elections: namely, President Biden’s low approval rating and infighting among congressional Democrats. Democrats suffered from the impacts of the Delta variant of COVID-19 on the economy – the number one issue . Notably President Trump played ball with the GOP: he endorsed Youngkin but Youngkin kept his distance and Trump avoided interfering, sparing Youngkin any controversy. This tactic apparently worked, as white women swung by 15 percentage points in favor of Republicans relative to the 2020 presidential vote in Virginia. Overall the election reinforces the basic historical fact that the US is a two-party system and that the electoral cycle favors the opposition in off-year and midterm elections. Given that Virginia is heavily Democratic these days, only loosely considered a swing state, the victory of a Republican in a statewide race suggests that a non-Trump Republican is capable of winning the presidency, whether in 2024 or thereafter. The idea that Trump’s scandals and the January 6 insurrection disqualify Republicans in voter opinion is contradicted by normal political clockwork. Republicans are back to growing their hold on state governments (Chart 7). The election repudiated left-wing Democrats. McAuliffe’s defeat came on the heels of both national and local controversies over the impact of progressive ideology on the education system. Minneapolis disapproved of the ballot measure to convert its police department into a new department of public safety. The Left is now frantically trying to distance itself from its more radical and unpopular ideas such as Critical Race Theory and “Abolish the Police.” The historic spike in homicide and general crime rates will continue to be a problem for the incumbent Democrats if it does not subside (Chart 8).
Chart 7
Chart 8
Still, the midterms are a year away. Most likely the pandemic will wane and the economy will recover between now and then. Biden’s legislation will probably pass and his approval will then rebound. The new compromise reconciliation bill will be more palatable to the median voter than the original, more radical proposals. As such Biden’s legislation will be a marginal positive for the Democrats in the midterms. Democrats and political independents generally favor the provisions included. The bipartisan infrastructure deal will be especially widely approved. So while Democrats are likely to lose the House, they could still keep the Senate. A lot of surprises can also happen between now and next November that could cut either way for the incumbent party. It is not impossible for Democrats to retain Congress. Given that Biden is keeping Trump’s tax rates, passing an infrastructure deal with Republicans, and maintaining the new hawkish line on China, it turns out that the only major points of distinction are social spending, climate spending, and immigration. Immigration is by far Democrats’ biggest weakness. The US is seeing a historic surge of immigrants on the southern border and the popular backlash will escalate dramatically in the lead-up to the midterms (Chart 9). Chart 9Immigration Crisis Looms On Southern Border
Immigration Crisis Looms On Southern Border
Immigration Crisis Looms On Southern Border
Gridlock will not begin next November but with the passage of Biden’s bills this November or December. With paper thin margins in Congress, and election campaigning taking place all year, it is unlikely that major legislation will pass in 2022. Biden will resort to regulation and foreign policy for most of the year. Congress will effectively be gridlocked already. A likely Republican victory in the House would then formalize it for the 2023-24 period. Investment Takeaways Public investments in infrastructure, tech, and renewable energy should be positive for productivity over the long run. The US economy is already gearing up for what looks likely to be a productivity boomlet based on businesses’ capital spending intentions and core capital goods orders (Chart 10). Chart 10US Productivity Boomlet
US Productivity Boomlet
US Productivity Boomlet
However, inflation is certain to be a risk in the short run and a large new fiscal spending package will increase that risk, given that the output gap is virtually closed. In general US stocks should outperform government bonds in an inflationary environment (Chart 11). Investors may continue to “buy the rumor” of Biden’s legislation. The legislation favors cyclical equities, especially in the context of a new business cycle (Chart 12). But this is a very short term consideration and otherwise cyclicals are looking stretched relative to defensives. Chart 11US Equities Versus Bonds, Total Return
US Equities Versus Bonds, Total Return
US Equities Versus Bonds, Total Return
Chart 12US Cyclicals Versus Defensives
US Cyclicals Versus Defensives
US Cyclicals Versus Defensives
Biden’s agenda has failed to galvanize a long-lasting outperformance of value stocks over growth stocks – though financials are clearly outperforming tech, which should be expected as a result of robust reflationary policies (Chart 13). The abandonment of corporate tax hikes is a positive but we still generally expect investors to “sell the news” once Biden’s bills are signed. US infrastructure stocks are close to pricing the positive news, relative to the broad market, cyclical sectors, and global cyclicals (Chart 14). Chart 13US Value Versus Growth
US Value Versus Growth
US Value Versus Growth
Uncertainty will subside significantly after the Senate passes Biden’s reconciliation bill. From that point investors will have a clear expectation for US fiscal policy through 2025. Impending congressional gridlock will be marginally positive for US risk assets because it will reduce uncertainty around fiscal policy. But investors will turn toward other threatening issues like wage growth and inflation, eventual rate hikes, regulation, and external risks. Chart 14BCA Infrastructure Basket
BCA Infrastructure Basket
BCA Infrastructure Basket
Matt Gertken Vice President Geopolitical Strategy mattg@bcaresearch.com Appendix
Image
Image
Image
Image
Image
Image
Image
Image
Highlights Duration & Country Allocation: Global bond yields have been driven by growth and inflation expectations over the past year, but shifting policy expectations are now the more important driver. Tighter monetary policies will pressure global bond yields higher over the next 6-12 months, but not equally. Stay underweight countries where tapering and rate hikes are more likely (the US, the UK, Canada, New Zealand) relative to countries where policymakers will move much more slowly (euro area, Australia, Japan). Inflation-Linked Bonds: An update of our Comprehensive Breakeven Indicators shows limited scope for a further widening of breakeven inflation rates between nominal and index-linked government bonds in most developed economies, most notably in Europe. Downgrade strategic (6-18 months) exposure to inflation-linked bonds (vs nominals) to underweight in Germany, France and Italy. Feature Chart of the WeekGlobal Bond Yield Drivers: Inflation Now, Labor Later
Global Bond Yield Drivers: Inflation Now, Labor Later
Global Bond Yield Drivers: Inflation Now, Labor Later
“Actually, we talked about inflation, inflation, inflation. That has been a topic that has occupied a lot of our time and a lot of our debates.” – ECB President Christine Lagarde Are you tired of talking about inflation? Central bankers likely are. The only problem is that is the job of monetary policymakers to worry about inflation – and the appropriate policy response – when it is rising as fast as been the case in 2021. The current global inflation surge, on the back of supply squeezes for both durable goods and commodity prices, will ease to some degree in 2022. This does not mean, however, that global bond yields have seen their cyclical peak. The driver of higher yields is already starting to transition from high inflation to tightening labor markets and rising wage costs – more enduring sources of potential inflation that will require monetary tightening in many, but not all, countries (Chart of the Week). This week, we discuss the implications of this shift to more policy-driven yields for the country allocation decisions in a government bond portfolio, for both nominal and inflation-linked debt. Shorter-Term Bond Yields Awaken, Longer-Term Yields Take Notice October represented a shift in the relative performance of developed economy government bond markets compared to the previous three months, most notably at the extremes (Chart 2). UK Gilts were the largest underperformer in Q3, down 1.8% versus the Bloomberg Global Treasury index (in USD-hedged terms, duration-matched to the benchmark), while Spain (+0.7%), Australia (+0.4%) and Italy (+0.3%) were the outperformers. In October, that script was flipped with Gilts being the best performer (+2.3%), Australia being the worst performer (-4.2%) and Spain (-0.6%) and Italy (-1.5%) reversing the Q3 gains.
Chart 2
Those particular swings in relative performance were a result of shifting market views on policy changes in those countries. The UK Gilt rally was largely contained to a single day, and focused at the long-end of the Gilt curve after the Conservative government announced a smaller-than-expected budget deficit on October 26 - with much less issuance of longer-maturity bonds – which triggered a huge -22bps decline in 30-year Gilt yields. The Australian bond selloff was a triggered by a rapid market reassessment of the next move in monetary policy for the Reserve Bank of Australia (RBA) after an upside surprise on Q3 inflation data. Italian and Spanish debt also sold off on the back of growing fears that even the European Central Bank (ECB) would be forced to tighten policy in response to higher inflation. The backup in Australian and European yields ran counter to the latest policy guidance of from the RBA and ECB, indicating speculation of a bond-bearish hawkish policy shift. In countries where policymakers have been more explicit about the need for monetary tightening, like Canada and New Zealand, government bonds performed poorly in both Q3 and October. While US Treasury returns were “flattish” in both Q3 (0.1%) and October (0.1%), the 2-year Treasury yield doubled from 0.27% to 0.52% during October as the market pulled forward the timing and pace of Fed rate hikes starting next year (Chart 3). Shifting views on monetary policy have not only impacted the relative performance of bond markets, but also the shapes of yield curves. The bigger increases seen in shorter-maturity bond yields have resulted in a fairly synchronized global move towards curve flattening (Chart 4). This would not be unusual during an actual monetary policy tightening cycle involving rate hikes. However, within the developed economies, only Norway and New Zealand have seen an actual rate hike. In other words, yield curves have been flattening on the anticipation of a rate hiking cycle – but one that is expected to be relative mild. Chart 3A Bond-Bearish Repricing Of Global Rate Expectations
A Bond-Bearish Repricing Of Global Rate Expectations
A Bond-Bearish Repricing Of Global Rate Expectations
Chart 4Some Violent Repricing Of Policy Expectations
Some Violent Repricing Of Policy Expectations
Some Violent Repricing Of Policy Expectations
Forward interest rates in Overnight Index Swap (OIS) curves are discounting higher rates in 2022 and 2023 across most countries, but with stable rates in 2024 (Chart 5). Yet the cumulative amounts of tightening are very modest, especially when compared to inflation (both realized and expected). Only in New Zealand are policy rates expected to go above 2% by 2023, with the US OIS curve discounting the Fed lifting policy rates to just 1.4%. In the UK, markets are discounting 123bps of hikes by the end of 2022 and a rate cut in 2024 – market pricing that strongly suggests that the Bank of England will make a “policy error” by tightening too much, too quickly, over the next year. Chart 5Markets Still Think Central Banks Will Not Have To Hike Much
Markets Still Think Central Banks Will Not Have To Hike Much
Markets Still Think Central Banks Will Not Have To Hike Much
After the October repricing of rate expectations, and reshaping of yield curves, we see a few conclusions – and investment opportunities – that stand out: US Treasuries With the Fed set to begin tapering asset purchases, the market discussion has moved on to the timing and pace of the post-taper rate hike cycle. The US OIS curve is discounting two Fed hikes in the second half of 2022, starting shortly after the likely end of the Fed taper in June. That timing and pace for 2022 is a bit more aggressive than we are expecting, but a rapidly tightening US labor market and rising wage growth could force the Fed to at least match the market pricing for hikes next year. On that note – the US Employment Cost Index in Q3 rose +1.3%, the fastest quarterly pace since 2001, and +3.7% on a year-over-year basis, the highest since 2004. The greater medium-term risk for the Treasury market is that the Fed starts to signal a need to go higher and faster than the market expects in 2023 and even into 2024. US Treasury yields remain well below levels implied by growth indicators like the ISM index. Thus, there is upside potential as the Fed tightens because of persistent above-trend growth and falling unemployment over the next couple of years (Chart 6). Chart 6Stay Below-Benchmark On US Duration Exposure
Stay Below-Benchmark On US Duration Exposure
Stay Below-Benchmark On US Duration Exposure
We continue to recommend a below-benchmark duration strategic stance for dedicated US bond investors, based on our expectation that US bond yields will climb higher over the next 12-18 months. However, our more preferred way to play this for global investors is as a spread trade versus euro area bond yields – specifically, selling 10-year US Treasury versus 10-year German bunds (Chart 7). Chart 7Position For UST Underperformance Vs. Europe
Position For UST Underperformance Vs. Europe
Position For UST Underperformance Vs. Europe
While headline inflation in the euro area has rapidly converged to the pace of US inflation over the past few months, this is overwhelmingly due to surging European energy costs. The pace of underlying inflation, as proxied by measures like the Cleveland Fed trimmed mean CPI and the euro area trimmed mean CPI constructed by our colleagues at BCA Research European Investment Strategy, has diverged sharply with the latter barely above 0%. The ECB will not follow the Fed into a rate hiking cycle next year, which will push US government yields higher versus European equivalents. Australia Government Bonds Chart 8Fade The RBA 'Rate Shock' In Australia
Fade The RBA 'Rate Shock' In Australia
Fade The RBA 'Rate Shock' In Australia
The RBA fought back against the sharp repricing of Australian interest rate expectations earlier this week by signaling that no rate hikes are expected until 2023. This is a modest change from the previous forward guidance of 2024 liftoff, but a surprisingly dovish message for markets that had rapidly moved to price in rate hikes next year after the big upside surprise on Q3/2021 Australian inflation With underlying trimmed mean inflation now having crept back into the RBA’s 2-3% target range, although just barely at 2.1%, the RBA would be justified in removing some degree of monetary accommodation. The central bank has already been doing so, on the margin, with some earlier tapering of the pace of asset purchases and last week’s decision to formally abandon its yield control target on shorter-dated government bond yields. Per the RBA’s current forward guidance, however, a move to actual rate hikes would require more evidence of tighter labor markets and faster wage growth – and thus, a more sustainable move to the 2-3% inflation target - that is not yet evident in measures like the Wage Cost Index (Chart 8). We plan on doing a deeper dive into Australia for next week’s report, where we’ll more formally evaluate our strategic view on Australian bond markets. For now, we remain comfortable with our overweight stance on Australian government bonds, as the RBA is still projected to be one of the less hawkish central banks in 2022. UK Gilts
Chart 9
The sharp rally in longer-dated UK Gilts seen at the end of October was due to a downside surprise in the expected size of the UK budget deficit next year, and the amount of Gilt issuance that will be needed to finance it. The UK Debt Management Office (DMO) said it planned to issue 194.8 billion pounds ($267.5 billion) of bonds in the current 2021/22 financial year, 57.8 billion pounds less than its previous remit back in March. The pre-budget market expectation was for a far smaller reduction of 33.8 billion pounds. The cut in issuance was most pronounced for longer-dated Gilts, -35% lower than the March budget issuance projection (Chart 9). With longer-maturity Gilts always in high demand from longer-term UK institutional investors, a major “supply shock” of reduced issuance can temporarily boost bond prices and lower yields. This is especially true in the UK where more aggressive rate hike expectations, and more defensive bond market positioning after the August/September selloff, left Gilts vulnerable to a short squeeze. The most important medium-term drivers of Gilt yields are still expectations of growth, inflation and future policy rates. There was very little change in shorter-dated Gilt yields or UK OIS forward rates after last week’s budget announcement – all the price action was the long end of the Gilt yield curve, resulting in an overall bull flattening. As we discussed in last week’s report, we expect the next move in the shape of the Gilt curve will be towards a steeper curve, likely bond-bearishly as long-term yields are still priced too low relative to how high UK policy rates will eventually have to climb in the upcoming BoE hiking cycle. The post-budget flattening has made the valuation of longer-maturity Gilt curve steepeners far more attractive, according to our UK butterfly spread valuation model (Table 1). Table 1UK Butterfly Spread Valuations From Our Curve Models
Transitioning From Inflation To Policy As The Driver Of Bond Yields
Transitioning From Inflation To Policy As The Driver Of Bond Yields
Chart 10A New UK Tactical Trade: Long 10yr Bullet Vs. 7/30 Barbell
A New UK Tactical Trade: Long 10yr Bullet Vs. 7/30 Barbell
A New UK Tactical Trade: Long 10yr Bullet Vs. 7/30 Barbell
The trade that stands out as most attractive is to go long the 10-year Gilt bullet versus selling a 7-year/30-year Gilt curve barbell – a butterfly spread that was last priced this attractively in 2013 (Chart 10). We are adding this as a new recommended trade in our Tactical Overlay portfolio, the details of which (specific bonds and weightings for each leg of the trade) can be found on page 17. Bottom Line: Tighter monetary policies will pressure global bond yields higher over the next 6-12 months, but not equally. Stay underweight countries where tapering and rate hikes are more likely (the US, the UK, Canada, New Zealand) relative to countries where policymakers will move much more slowly (euro area, Australia, Japan). Global Breakevens: How Much More Upside? The surge in global inflation this year has helped boost the performance of inflation-linked government bonds versus nominal equivalents. Yet current breakeven inflation rates have reached levels not seen in some time. Last week, the 10-year US TIPS breakeven hit a 15-year high of 2.7%, the 10-year German breakeven reached a 9-year high of 2.1%, while the 10-year UK breakeven climbed to 4.2% - the highest level since 1996 (!). With market-based inflation expectations reaching such historically high levels, how much more can breakevens widen – especially with central banks incrementally moving towards tighter monetary policies? To answer that question, we turn to our Comprehensive Breakeven Indicators (CBIs). The CBIs measure the upside/downside potential for breakevens for the US, Germany, France, Italy, Japan, the UK, Canada and Australia. The CBIs incorporate the following three measures: The residuals from our 10-year breakeven inflation spread fair value models, as a measure of valuation. The spread between 10-year breakevens and survey-based measures of inflation expectations, as a measure of the inflation risk premium embedded in breakevens The gap between headline inflation and the central bank inflation target, as an indication of the existing inflation backdrop and of future monetary policy moves in response to an inflation trend that can help to reverse that trend. Each of the three measures is standardized and added together to produce a single CBI. A higher reading on CBI suggests less potential for additional increases in breakevens, and vice versa. The latest readings from our CBIs are shown in Chart 11. The red diamonds for each country are the actual CBI, while the stacked bars show the individual CBI components. The highest CBI readings are in Germany and the US, while the lowest are in Canada and France. Importantly, no country has a CBI significantly below zero, indicative of the more limited upside potential for breakevens after the big run-up since mid-2020.
Chart 11
As a way to assess the usefulness of the CBIs as an indicator of the future breakeven moves, we constructed a simple backtest. We looked at how 10-year breakevens performed in the twelve months after the CBI hit certain thresholds (Chart 12). The backtest results show that the CBIs work as intended, signaling reversals of existing trends once the CBIs climb above +0.5 or below -0.5. The average (mean) size of the breakeven reversal gets larger as the CBI moves further to extremes.
Chart 12
Based on the latest reading from the CBIs, we are making significant changes to the recommended allocations (Chart 13) to inflation-linked bonds (ILBs) in our model bond portfolio on pages 14-15: Chart 13No Overweights In Our Revised Allocations To Global Linkers
No Overweights In Our Revised Allocations To Global Linkers
No Overweights In Our Revised Allocations To Global Linkers
Downgrading ILBs to underweight (versus nominal government bonds) in Germany, France, Italy & Spain from the current overweight allocation. The backtested CBI history for those countries suggests breakevens are more likely to fall over the next twelve months. Furthermore, realized euro area inflation is more likely to fall in 2022, given the lack of underlying euro area inflation described earlier in this report. Downgrade Japan ILBs to neutral from overweight. While the CBI is not at a stretched level, realized Japanese core inflation has struggled to stay in positive territory – even in the current environment of soaring commodity and durable goods prices. Upgrade ILBs in Canada and Australia to neutral from underweight. The former has a CBI that is still below zero, while the latter benefits from the lack of RBA hawkishness compared to other central banks. We are maintaining our other ILB allocations in the UK (underweight vs. nominals) and the US (neutral vs. nominals). In the UK, stretched breakevens are at risk from the hawkish turn by the BoE, which is a clear response to the higher UK inflation expectations. While the US CBI is at a high level, we see better value in playing for narrowing TIPS breakevens at shorter maturity points that are even more exposed to a likely slowing of commodity fueled inflation in 2022 than longer maturity TIPS breakevens. In other words, we see a steeper US breakeven curve, but a flatter real yield curve as the Fed tightens. Bottom Line: An update of our Comprehensive Breakeven Indicators shows limited scope for a further widening of breakeven inflation rates between nominal and index-linked government bonds in most developed economies, most notably in Europe. Robert Robis, CFA Chief Fixed Income Strategist rrobis@bcaresearch.co Recommendations Duration Regional Allocation Spread Product Tactical Trades GFIS Model Bond Portfolio Recommended Positioning Active Duration Contribution: GFIS Recommended Portfolio Vs. Custom Performance Benchmark
Image
The GFIS Recommended Portfolio Vs. The Custom Benchmark Index
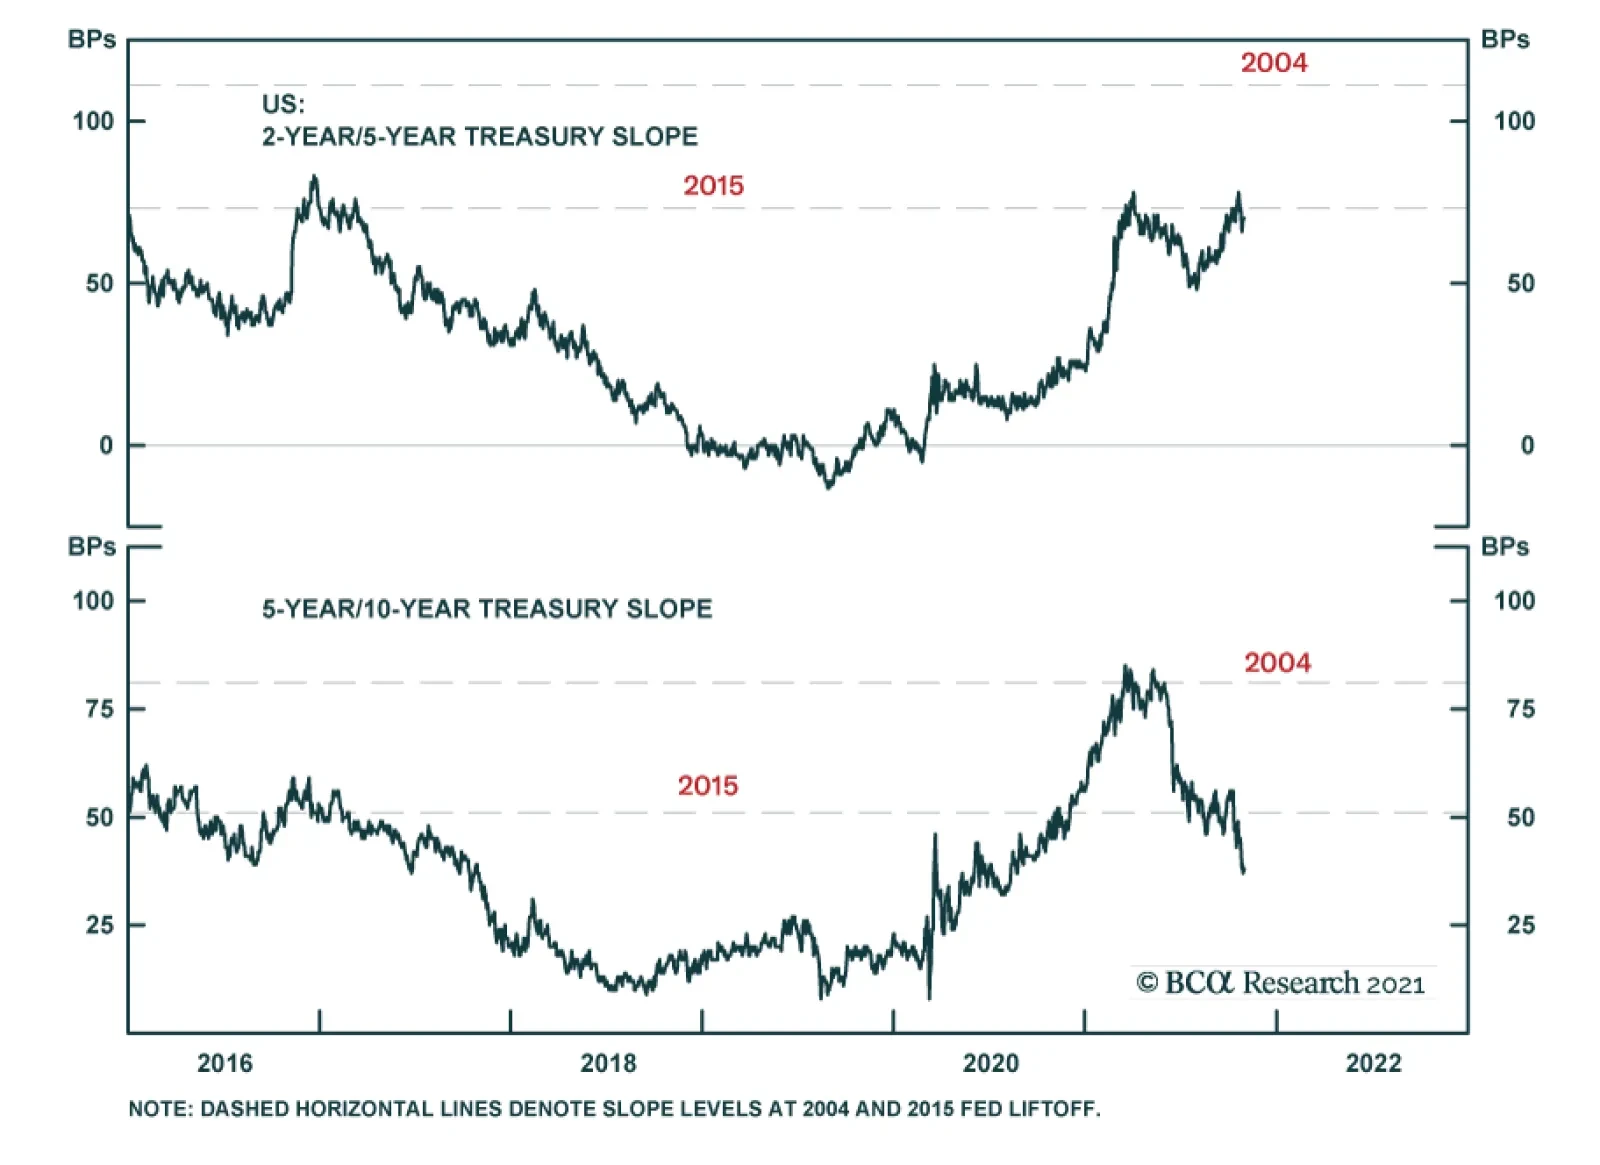
BCA Research’s US Bond Strategy service recommends investors shift out of 2/10 flatteners and into steepeners. The 2/5/10 butterfly spread has risen a lot during the past few weeks and it now looks extremely high, both in absolute terms and relative to…