United States

Highlights Chart 1Buy The 2-Year, Sell The 10-Year
Buy The 2-Year, Sell The 10-Year
Buy The 2-Year, Sell The 10-Year
Treasury yields have been volatile of late, but the biggest move has been a flattening of the yield curve led by a sell-off at the front-end. Our recommended yield curve positioning (short the 5-year bullet / long a duration-matched 2/10 barbell) was well suited to profit from this move but has now run its course. The solid lines in the bottom panel of Chart 1 show the paths discounted in the forward curve for the 2-year and 10-year yields. The dashed lines show the fair value paths for each yield in a scenario where the Fed starts hiking in December 2022 and proceeds at a pace of 100 bps per year until reaching a 2.08% terminal rate. We can see that the 2-year yield looks a bit too high relative to fair value and the 10-year looks too low. Taken together, our fair value estimates show that the 2/10 Treasury slope should flatten during the next 12 months, but not by as much as is currently discounted in the forward curve (Chart 1, top panel). Investors should maintain below-benchmark portfolio duration but should shift out of 2/10 flatteners and into steepeners. Specifically, we close our prior yield curve trade and open a new one: Long the 2-year note, short a duration-matched barbell consisting of cash and the 10-year note. Feature Table 1Recommended Portfolio Specification
Curve Flatteners Are Too Expensive
Curve Flatteners Are Too Expensive
Table 2Fixed Income Sector Performance
Curve Flatteners Are Too Expensive
Curve Flatteners Are Too Expensive
Investment Grade: Neutral Chart 2Investment Grade Market Overview
Investment Grade Market Overview
Investment Grade Market Overview
Investment grade corporate bonds performed in line with the duration-equivalent Treasury index in October, leaving year-to-date excess returns unchanged at +193 bps (Chart 2). The combination of above-trend economic growth and accommodative monetary policy continues to support positive excess returns for spread product versus Treasuries. The recent flattening of the yield curve is a strong reminder that the window of outperformance for corporate bonds will eventually close, but the curve will need to be a lot flatter before we start to worry. Specifically, we are targeting a level of 50 bps for the 3-year/10-year Treasury slope as a level where we will turn more cautious on spread product relative to Treasuries. This slope currently sits at 80 bps and the pace of flattening should moderate during the next few months. A recent report presented the results of a scenario analysis for investment grade corporate bond returns during the next 12 months.1 We concluded that investment grade corporate bond total returns will be close to zero or negative during the next 12 months and that excess returns versus duration-matched Treasuries are capped at 85 bps. With that in mind, we advise investors to seek out higher returns in junk bonds, municipal bonds and USD-denominated Emerging Market sovereign and corporate bonds. We also recommend favoring long-maturity corporate bonds and those corporate sectors with elevated Duration-Times-Spread.2
Chart
Chart
High-Yield: Overweight Chart 3High-Yield Market Overview
High-Yield Market Overview
High-Yield Market Overview
High-Yield outperformed the duration-equivalent Treasury index by 14 basis points in October, bringing year-to-date excess returns up to +572 bps. A recent report looked at the default expectations that are currently priced into the junk index and considered whether they are likely to be met.3 If we demand an excess spread of 100 bps and assume a 40% recovery rate on defaulted debt, then the High-Yield index embeds an expected default rate of 3.1% (Chart 3). Using a model of the 12-month trailing speculative grade default rate that is based on gross corporate leverage (pre-tax profits over total debt) and C&I lending standards, we estimate that the 12-month default rate will fall between 2.3% and 2.8%, below what the market currently discounts. Notably, the corporate default rate is tracking at an annualized rate of roughly 1.6% through the first nine months of the year, well below the estimate generated by our model. Another recent report considered different plausible scenarios for junk bond returns during the next 12 months.4 We concluded that junk bond total returns will fall into a range of -0.29% to +1.80% during the next 12 months and that excess returns versus duration-matched Treasuries will be between +0.94% and +1.84%. MBS: Underweight Chart 4MBS Market Overview
MBS Market Overview
MBS Market Overview
Mortgage-Backed Securities underperformed the duration-equivalent Treasury index by 1 basis point in October, dragging year-to-date excess returns down to -44 bps. The nominal spread between conventional 30-year MBS and equivalent-duration Treasuries tightened 16 bps in October. The spread looks tight relative to levels seen during the past year and relative to the pace of mortgage refinancings (Chart 4). The conventional 30-year MBS option-adjusted spread (OAS) tightened 3 bps in October to reach 29 bps (panel 3). This is only just above the 28 bps offered by Aaa-rated consumer ABS but below the 54 bps offered by Aa-rated corporate bonds and the 30 bps offered by Agency CMBS. In a recent report we looked at MBS performance and valuation across the coupon stack.5 We noted that the higher convexity of high-coupon MBS makes them likely to outperform lower-coupon MBS in a rising yield environment. Higher coupon MBS also have greater OAS than lower coupons. This makes the high-coupon MBS more likely to outperform in a flat bond yield environment as well. Given our view that bond yields will be higher in 6-12 months, we recommend favoring high coupons (4%, 4.5%) over low coupons (2%, 2.5%, 3%) within an overall underweight allocation to Agency MBS. Government-Related: Neutral Chart 5Government-Related Market Overview
Government-Related Market Overview
Government-Related Market Overview
The Government-Related index performed in-line with the duration-equivalent Treasury index in October, leaving year-to-date excess returns unchanged at 68 bps. Sovereign debt outperformed duration-equivalent Treasuries by 23 basis points October, bringing year-to-date excess returns up to -65 bps. Foreign Agencies underperformed the Treasury benchmark by 5 bps on the month, dragging year-to-date excess returns down to +44 bps. Local Authority bonds outperformed by 16 bps in October, bringing year-to-date excess returns up to +423 bps. Domestic Agency bonds underperformed by 15 bps, dragging year-to-date excess returns down to +9 bps. Supranationals underperformed by 11 bps, dragging year-to-date excess returns down to +16 bps. The investment grade Emerging Market Sovereign bond index outperformed the equivalent-duration US corporate bond index by 35 bps in October. The Emerging Market Corporate & Quasi-Sovereign index delivered 8 bps of outperformance versus duration-matched US corporates (Chart 5). Despite this outperformance, both indexes continue to offer significant yield advantages versus US corporate bonds with the same credit rating and duration. We continue to recommend overweighting USD-denominated EM sovereigns and corporates versus investment grade US corporates with the same credit rating and duration.6 Within EM sovereigns, attractive countries include: Russia, Mexico, Indonesia, Saudi Arabia, UAE and Qatar. Municipal Bonds: Overweight Chart 6Municipal Market Overview
Municipal Market Overview
Municipal Market Overview
Municipal bonds outperformed the duration-equivalent Treasury index by 48 basis points in October, bringing year-to-date excess returns up to +341 bps (before adjusting for the tax advantage). The economic and policy back-drop remains favorable for municipal bond performance. Trailing 4-quarter net state & local government savings are incredibly high (Chart 6) and individual tax hikes will only increase the attractiveness of tax-exempt munis if they are included in the upcoming reconciliation bill. Last week’s report showed that the average duration of municipal bond indexes has fallen significantly during the past few decades, a trend that has implications for how we should perceive municipal bond valuation.7 Specifically, the trend makes municipal bonds more attractive relative to both Treasury securities and investment grade corporates. Long-maturity municipal bonds are especially compelling. We calculate that 17-year+ maturity General Obligation Munis offer a before-tax yield pick-up relative to credit rating and duration-matched corporate credit. The same goes for 17-year+ Revenue bonds. High-yield muni spreads are reasonably attractive relative to high-yield corporates (panel 4), but we recommend only a neutral allocation to high-yield munis versus high-yield corporates. The deep negative convexity of high-yield munis makes them susceptible to extension risk if bond yields rise. Treasury Curve: Buy 2-Year Bullet Versus Cash/10 Barbell Chart 7Treasury Yield Curve Overview
Treasury Yield Curve Overview
Treasury Yield Curve Overview
The Treasury curve bear-flattened dramatically in October. The 2-year/10-year Treasury slope flattened 17 bps to end the month at 107 bps. The 5-year/30-year slope flattened 35 bps to end the month at 75 bps. As is mentioned on the first page of this report, the large flattening of the yield curve has led us to take profits on our prior 2/10 flattener (short 5-year bullet versus 2/10 barbell) and to initiate a 2/10 curve steepener (long 2-year bullet versus cash/10 barbell). We also noted on the front page that we still expect the 2/10 slope to flatten during the next 12 months, just not by as much as what is currently priced into the forward curve. The 2/5/10 butterfly spread has risen a lot during the past few weeks and it now looks extremely high, both in absolute terms and relative to our fair value model (Chart 7). The 2/5/10 butterfly spread can rise because of either 2/5 steepening or 5/10 flattening. We contend that the current elevated 2/5/10 butterfly is mostly the result of a 5/10 slope that is too flat, not a 2/5 slope that is too steep. The bottom two panels of Chart 7 show the 2/5 and 5/10 slopes along with dashed lines indicating where those slopes were on prior Fed liftoff dates in 2015 and 2004. We see that the 2/5 slope is not unusually steep compared to those prior liftoff dates, but the 5/10 slope is unusually flat. For this reason, we want long exposure to the 2-year note and short exposure to the 10-year note between now and Fed liftoff in late-2022. The best way to achieve this exposure is to buy the 2-year note and short a duration-matched barbell consisting of the 10-year note and cash. TIPS: Neutral Chart 8TIPS Market Overview
TIPS Market Overview
TIPS Market Overview
TIPS outperformed the duration-equivalent nominal Treasury index by 106 basis points in October, bringing year-to-date excess returns up to +740 bps. The 10-year TIPS breakeven inflation rate rose 15 bps on the month and the 5-year/5-year forward TIPS breakeven inflation rate fell 10 bps. At 2.54%, the 10-year TIPS breakeven inflation rate is now slightly above the 2.3% to 2.5% range that is consistent with inflation expectations being well-anchored around the Fed’s target (Chart 8). Meanwhile, at 2.14%, the 5-year/5-year forward TIPS breakeven inflation rate has dipped below the Fed’s target range (panel 3). The divergence between 10-year and 5-year/5-year breakeven rates underscores the flatness of the inflation curve (bottom panel). Near-term inflation expectations are extremely high, but they decline sharply further out the curve. Our view is that inflationary pressures will wane during the next 6-12 months and this will lead to a steep decline in short-maturity TIPS breakeven inflation rates.8 Breakeven rates at the long-end should remain relatively close to the Fed’s target range. We recommend positioning for this outcome by entering inflation curve steepeners or real yield curve (aka TIPS curve) flatteners. We also advise entering an outright short position in 2-year TIPS. The 2-year TIPS yield has a lot of room to rise as the cost of 2-year inflation compensation falls and the 2-year nominal yield remains close to its fair value. ABS: Overweight Chart 9ABS Market Overview
ABS Market Overview
ABS Market Overview
Asset-Backed Securities underperformed the duration-equivalent Treasury index by 7 basis points in October, dragging year-to-date excess returns down to +35 bps. Aaa-rated ABS underperformed by 8 bps on the month, dragging year-to-date excess returns down to +25 bps. Non-Aaa ABS underperformed by 5 bps, dragging year-to-date excess returns down to +93 bps. The stimulus from last year’s CARES Act led to a significant increase in household savings when individual checks were mailed in April 2020. That excess savings has still not been spent and the most recent round of stimulus checks has only added to the stockpile (Chart 9). The extraordinarily large stock of household savings means that the collateral quality of consumer ABS is also extraordinarily high. Indeed, many households have been using their windfalls to pay down consumer debt (bottom panel). Investors should remain overweight consumer ABS and should also take advantage of the high quality of household balance sheets by moving down the quality spectrum. Non-Agency CMBS: Neutral Chart 10CMBS Market Overview
CMBS Market Overview
CMBS Market Overview
Non-Agency Commercial Mortgage-Backed Securities outperformed the duration-equivalent Treasury index by 1 basis point in October, bringing year-to-date excess returns up to +196 bps. Aaa Non-Agency CMBS underperformed Treasuries by 3 bps in October, dragging year-to-date excess returns down to +93 bps. Non-Aaa Non-Agency CMBS outperformed Treasuries by 17 bps, bringing year-to-date excess returns up to +543 bps (Chart 10). Though returns have been strong and spreads remain attractive, particularly for lower-rated CMBS, we continue to recommend only a neutral allocation to the sector because of the structurally challenging environment for commercial real estate. Agency CMBS: Overweight Agency CMBS outperformed the duration-equivalent Treasury index by 12 basis points in October, bringing year-to-date excess returns up to +105 bps. The average index option-adjusted spread tightened 3 bps on the month. It currently sits at 30 bps (bottom panel). Though Agency CMBS spreads have recovered to well below their pre-COVID levels, they still look attractive compared to other similarly risky spread products. Stay overweight. Appendix A: Butterfly Strategy Valuations The following tables present the current read-outs from our butterfly spread models. We use these models to identify opportunities to take duration-neutral positions across the Treasury curve. The following two Special Reports explain the models in more detail: US Bond Strategy Special Report, “Bullets, Barbells And Butterflies”, dated July 25, 2017, available at usbs.bcaresearch.com US Bond Strategy Special Report, “More Bullets, Barbells And Butterflies”, dated May 15, 2018, available at usbs.bcaresearch.com Table 4 shows the raw residuals from each model. A positive value indicates that the bullet is cheap relative to the duration-matched barbell. A negative value indicates that the barbell is cheap relative to the bullet. Table 4Butterfly Strategy Valuation: Raw Residuals In Basis Points (As Of October 29th, 2021)
Curve Flatteners Are Too Expensive
Curve Flatteners Are Too Expensive
Table 5 scales the raw residuals in Table 4 by their historical means and standard deviations. This facilitates comparison between the different butterfly spreads. Table 5Butterfly Strategy Valuation: Standardized Residuals (As Of October 29th, 2021)
Curve Flatteners Are Too Expensive
Curve Flatteners Are Too Expensive
Table 6 flips the models on their heads. It shows the change in the slope between the two barbell maturities that must be realized during the next six months to make returns between the bullet and barbell equal. For example, a reading of -60 bps in the 5 over 2/10 cell means that we would expect the 5-year to outperform the 2/10 if the 2/10 flattens by less than 60 bps during the next six months. Otherwise, we would expect the 2/10 barbell to outperform the 5-year bullet. Table 6Discounted Slope Change During Next 6 Months (BPs)
Curve Flatteners Are Too Expensive
Curve Flatteners Are Too Expensive
Appendix B: Excess Return Bond Map The Excess Return Bond Map is used to assess the relative risk/reward trade-off between different sectors of the US bond market. It is a purely computational exercise and does not impose any macroeconomic view. The Map’s vertical axis shows 12-month expected excess returns. These are proxied by each sector’s option-adjusted spread. Sectors plotting further toward the top of the Map have higher expected returns and vice-versa. Our novel risk measure called the “Risk Of Losing 100 bps” is shown on the Map’s horizontal axis. To calculate it, we first compute the spread widening required on a 12-month horizon for each sector to lose 100 bps or more relative to a duration-matched position in Treasury securities. Then, we divide that amount of spread widening by each sector’s historical spread volatility. The end result is the number of standard deviations of 12-month spread widening required for each sector to lose 100 bps or more versus a position in Treasuries. Lower risk sectors plot further to the right of the Map, and higher risk sectors plot further to the left.
Chart 11
Ryan Swift US Bond Strategist rswift@bcaresearch.com Footnotes 1 Please see US Bond Strategy Weekly Report, “Expected Returns In Corporate Bonds”, dated September 21, 2021. 2 Please see US Bond Strategy Weekly Report, “The Collapsing Credit Risk Premium”, dated July 20, 2021. 3 Please see US Bond Strategy Weekly Report, “The Post-FOMC Credit Environment”, dated June 29, 2021. 4 Please see US Bond Strategy Weekly Report, “Expected Returns In Corporate Bonds”, dated September 21, 2021. 5 Please see US Bond Strategy Weekly Report, “A New Conundrum”, dated April 20, 2021. 6 For more details please see US Bond Strategy Weekly Report, “Damage Assessment”, dated September 28, 2021. 7 Please see US Bond Strategy Weekly Report, “The Best & Worst Spots On The Yield Curve”, dated October 26, 2021. 8 Please see US Bond Strategy Weekly Report, “Right Price, Wrong Reason”, dated October 19, 2021.
Image
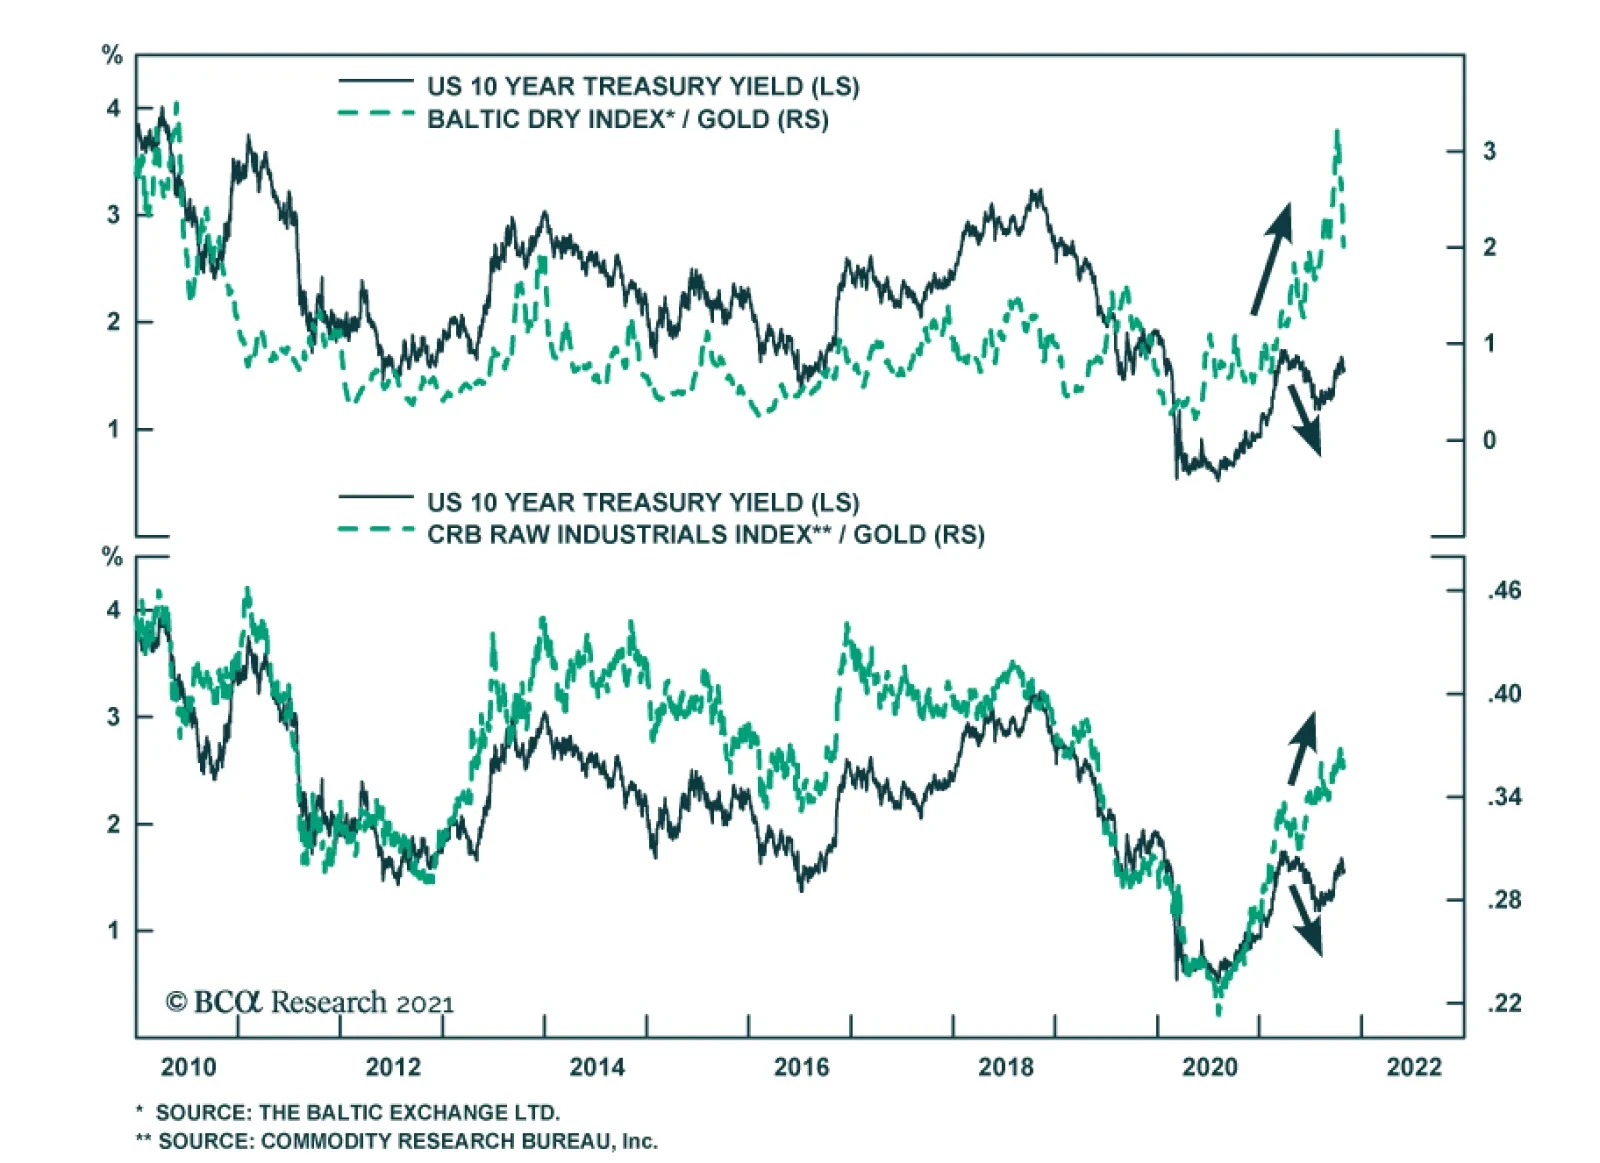
The markets were deluged by a lot of information in late October. Several central banks made surprise moves towards tightening (the Bank of Canada, for example, ended asset purchases, and the Reserve Bank of Australia effectively abandoned its yield-curve control). Inflation continued to surprise on the upside (headline CPI in the US is now 5.4% year-on-year). But, at the same time, there were signs of faltering growth with, for example, US real GDP growth in Q3 coming in at only 2.0% quarter-on-quarter annualized, compared to 6.7% in Q2. This caused a flattening of the yield curve in many countries, as markets priced in faster monetary tightening but lower long-term growth (Chart 1). Nonetheless, equities shrugged off the barrage of news, with the S&P500 ending the month at a new high. All this highlights what we discussed in our latest Quarterly: That the second year of a bull market is often tricky, resulting in lower (but still positive) returns from equities and higher volatility. For risk assets to continue to outperform, our view of a Goldilocks environment needs to be “just right”: The economy must not be too hot or too cold. We think it will be – and so stay overweight equities versus bonds. But investors should be aware of the risks on either side. How too hot? Inflation is broadening out (at least in the US, UK, Australia and Canada, though not in the euro zone and Japan) and is no longer limited to items which saw unusually strong demand during the pandemic but where supply is constrained (Chart 2). Chart 1What Is The Message Of Flattening Yield Curves?
What Is The Message Of Flattening Yield Curves?
What Is The Message Of Flattening Yield Curves?
Chart 2Inflation Is Broadening Out In The US
Inflation Is Broadening Out In The US
Inflation Is Broadening Out In The US
There is a risk that this turns into a wage-price spiral as employees, amid a tight labor market, push for higher wages to offset rising prices. We find that wages tend to follow prices with a lag of 6-12 months (Chart 3). The Atlanta Fed Wage Tracker (good for gauging underlying wage pressures since it looks only at employees who have been in a job for 12 months or more) is already at 3.5% and looks set to rise further. On the back of these inflationary moves, the market has significantly pulled forward the date of central bank tightening. Futures now imply that the Fed will raise rates in both July and December next year (Chart 4) and that other major developed central banks will also raise multiple times over the next 14 months (Table 1). Breakeven inflation rates have also risen substantially (Chart 5). Chart 3Wages Tend To Rise After Prices Rise
Wages Tend To Rise After Prices Rise
Wages Tend To Rise After Prices Rise
Chart 4Will The Fed Really Hike This Soon?
Will The Fed Really Hike This Soon?
Will The Fed Really Hike This Soon?
Table 1Futures Implied Path Of Rate Hikes
Monthly Portfolio Update: The Risks To Goldilocks
Monthly Portfolio Update: The Risks To Goldilocks
Chart 5Breakevens Suggest Higher Inflation
Breakevens Suggest Higher Inflation
Breakevens Suggest Higher Inflation
We think these moves are a little excessive. There are several reasons why inflation might cool next year. Companies are rushing to increase capacity to unblock supply bottlenecks. For example, semiconductor production has already begun to increase, bringing down DRAM prices over the past few months (Chart 6). Another big contributor to broad-based inflation has been a 126% increase in container shipping costs since the start of the year (Chart 7). But currently the number of container ships on order is at a 10-year high; these new ships will be delivered over the next two years. Such deflationary forces should pull down core inflation next year (though we stick to our longstanding view that for multiple structural reasons – demographics, the end of globalization, central bank dovishness, the transition away from fossil fuels – inflation will trend up over the next five years). Chart 6DRAM Prices Falling As Production Ramps Up
DRAM Prices Falling As Production Ramps Up
DRAM Prices Falling As Production Ramps Up
Chart 7All Those Ships On Order Should Bring Down Shipping Costs
All Those Ships On Order Should Bring Down Shipping Costs
All Those Ships On Order Should Bring Down Shipping Costs
The Fed, therefore, will not be in a rush to raise rates. It does not see the labor market as anywhere close to “maximum employment” – it has not defined what it means by this, but we would see it as a 3.8% unemployment rate (the median FOMC dot for the equilibrium unemployment rate) and the prime-age participation rate back to its 2019 level (Chart 8). We continue to expect the first rate hike only in December next year. The Fed will feel the need to override its employment criterion only if long-term inflation expectations become unanchored – but the 5-year 5-year forward breakeven rate is only at 2.3%, within the Fed’s effective CPI target range of 2.3-2.5% (Chart 5). We remain comfortable with our view of only a moderate rise in long-term rates, with the US 10-year Treasury yield at 1.7% by end-2021, and reaching 2-2.25% at the time of the first Fed rate hike. It is also worth emphasizing that even a fairly sharp rise in long-term rates has historically almost always coincided with strong equity performance (Chart 9 and Table 2). This has again been evident in the past 12 months: When rates rose between August 2020 and March 2021, and then from July 2021, equities performed strongly. Chart 8We Are Not Back To "Maximum Employment"
We Are Not Back To "Maximum Employment"
We Are Not Back To "Maximum Employment"
Chart 9Rising Rates Are Usually Accompanied By A Rising Stock Market
Rising Rates Are Usually Accompanied By A Rising Stock Market
Rising Rates Are Usually Accompanied By A Rising Stock Market
Table 2Episodes Of Rising Long-Term Rates Since 1990
Monthly Portfolio Update: The Risks To Goldilocks
Monthly Portfolio Update: The Risks To Goldilocks
But could the economy get too cold? We would discount the weak US GDP reading: It was mostly due to production shortages, especially in autos, which pushed down consumption on durable goods by 26% QoQ annualized, and by some softness in spending on services due to the delta Covid variant, the impact of which is now fading. US growth should continue to be supported by a combination of the $2.5 trillion of excess household savings, strong capex as companies boost their production capacity, and a further 5% of GDP in fiscal stimulus that should be passed by Congress by year-end. Similar conditions apply in other developed economies. Chart 10Real Estate Is A Big Part Of Chinese GDP
Real Estate Is A Big Part Of Chinese GDP
Real Estate Is A Big Part Of Chinese GDP
We see three principal risks to this positive outlook: A new strain of Covid-19 that proves resistant to current vaccines – unlikely but not impossible. Our geopolitical strategists worry about Iran, which may have a nuclear bomb ready by December, prompting Israel to bomb the country. Iran would likely react by hampering oil supplies, even blocking the Strait of Hormuz, through which 25% of global oil flows. Chinese growth has been slowing and the impact from the problems at Evergrande is still unclear. Real estate is a major part of the Chinese economy, with residential investment comprising 10% of GDP (Chart 10) and, broadly defined to include construction and building materials, real estate overall perhaps as much as one-third. Our China strategists don’t expect the government to launch a major stimulus which would bail out the industry, since it is happy with the way that property-related lending has been shrinking in recent years (Chart 11). We expect the slowdown in Chinese credit growth to bottom out over the coming few months, but economic activity may have further to slow (Chart 12), and there is a risk that the authorities are unable to control the fallout from the property market. Chart 11Chinese Authorities Are Happy To See Slowing Property Lending
Chinese Authorities Are Happy To See Slowing Property Lending
Chinese Authorities Are Happy To See Slowing Property Lending
Chart 12When Will Credit Growth Bottom?
When Will Credit Growth Bottom?
When Will Credit Growth Bottom?
Fixed Income: Given the macro environment described above, we remain underweight bonds and short duration. If we assume 1) a Fed liftoff in December 2022, 2) 100 basis points of rate hikes over the following year, and 3) a terminal Fed Funds Rate of 2.08% (the median forecast from the New York Fed’s Survey of Market Participants), 10-year US Treasurys will return -0.2% over the next 12 months, and 2-year Treasurys +0.3%.1 TIPs have overshot fair value and, although we remain neutral since they a tail-risk hedge against high inflation over the next five years, we would especially avoid 2-year TIPS which look very overvalued. We see some pockets of selective value in lower-quality high-yield bonds, specifically US Ba- and Caa-rated issues, which are still trading at breakeven spreads around the 35th historical percentile, whereas higher-rated bonds look very expensive (Chart 13). For US tax-paying investors, municipal bonds look particularly attractive at the moment, with general-obligation (GO) munis trading at a duration-matched yield higher than Treasurys even before tax considerations (Chart 14). Our US bond strategists have recently gone maximum overweight.
Chart 13
Chart 14Muni Bonds Are A Steal
Muni Bonds Are A Steal
Muni Bonds Are A Steal
Equities: We retain our longstanding preference for US equities over other Developed Markets. US equities have outperformed this year, irrespective of whether rates were rising or falling, or how US growth was surprising relative to the rest of the world, emphasizing the much stronger fundamentals of the US market (Chart 15). Analysts’ forecasts for the next few quarters look quite cautious, and so earnings surprises can push US stock prices up further (Chart 16). We reiterate the neutral on China but underweight on Emerging Markets ex-China that we initiated in our latest Quarterly. Our sector overweights are a mixture of cyclicals (Industrials), rising-interest-rate plays (Financials), and defensives (Heath Care). Chart 15US Equites Outperformed This Year Whatever Happened
US Equites Outperformed This Year Whatever Happened
US Equites Outperformed This Year Whatever Happened
Chart 16Analysts Are Pessimistic About The Next Couple Of Quarters
Analysts Are Pessimistic About The Next Couple Of Quarters
Analysts Are Pessimistic About The Next Couple Of Quarters
Currencies: We continue to expect the US dollar to be stuck in its trading range and so stay neutral. Recent moves in prospective relative monetary policy bring us to change two of our currency recommendations. We close our underweight on the Australian dollar. The recent rise in Australian inflation (with both trimmed mean and 10-year breakevens now above 2% – Chart 17) has brought forward the timing of the first rate hike and should push up relative real rates (Chart 18). We lower our recommendation on the Japanese yen from overweight to neutral. The Bank of Japan will not raise rates any time soon, even when other central banks are tightening. This will push real-rate differentials against the yen (Chart 18, panel 2). Chart 17Australian Inflation Is Picking Up
Australian Inflation Is Picking Up
Australian Inflation Is Picking Up
Chart 18Real Rates Moving In Favor Of The AUD And Against The JPY
Real Rates Moving In Favor Of The AUD And Against The JPY
Real Rates Moving In Favor Of The AUD And Against The JPY
Chart 19Chinese-Related Metals' Prices Are Falling
Chinese-Related Metals' Prices Are Falling
Chinese-Related Metals' Prices Are Falling
Commodities: We remain cautious on those industrial metals which are most sensitive to slowing Chinese growth and its weakening property market. The fall in iron ore prices since July is now being followed by aluminum. However, metals which are increasingly driven by investment in alternative energy, notably copper, are likely to hold up better (Chart 19). We are underweight the equity Materials sector and neutral on the commodities asset class. The Brent crude oil price has broadly reached our energy strategists’ forecasts of $80/bbl on average in 2022 and $81 in 2023 (Chart 20). Although the forward curve is lower than this, with December-22 Brent at only $75/bbl, it is a misapprehension to characterize this as the market forecasting that the oil price will fall. Backwardation (where futures prices are lower than spot) is the usual state of affairs for structural reasons (for example, producers hedging production forward). The market typically moves to contango only when the oil price has fallen sharply and reserves are high (Chart 21). We remain neutral on the equities Energy sector. Chart 20Brent Has Reached Our 2022 And 2023 Forecast Level
Brent Has Reached Our 2022 And 2023 Forecast Level
Brent Has Reached Our 2022 And 2023 Forecast Level
Chart 21Lower Oil Futures Don't Mean Oil Price Is Forecast To Fall
Lower Oil Futures Don't Mean Oil Price Is Forecast To Fall
Lower Oil Futures Don't Mean Oil Price Is Forecast To Fall
Garry Evans, Senior Vice President Global Asset Allocation garry@bcaresearch.com GAA Asset Allocation
This week we continue our series of thematic Special Reports. Over the past few months, we have covered the EV Revolution and Generation Z. In this report, we conduct a “deep dive” analysis of Cybersecurity as an investment theme for equity investors. Spoiler Alert: We recommend Cybersecurity as a structural and tactical overweight. For a shorter investment horizon, the recent pullback and deflated valuation premium present a good entry-point. A Primer On Cybersecurity What Is Cybersecurity? Cybersecurity focuses on protecting computers, networks, programs, and data from unauthorized and/or unintended access. A wide range of malicious activities fall under the umbrella of cybercrime: Theft and damage of personal and financial data, theft of money, embezzlement, demands for ransom, theft of intellectual property, and illicit and illegal use of computers' processing power or cloud storage. The methods the hackers use are breaches, phishing, privileged-access credential abuse, and endpoint security attacks. Cybersecurity Index ISE Cyber Security Index (HXR) is a NASDAQ index launched in 2010, that encapsulates publicly traded companies that operate in the Cybersecurity space, whether by providing infrastructure or services. Cybersecurity is a theme that spans several different industries: It is dominated by Software (57%) and Computer Services (29%). The remaining 14% are split between Telecommunications Equipment and Defense (Chart 1). The space includes both legacy providers and aggressive cloud-only newcomers. Cybersecurity Vs Software Services The S&P 500 Software and Services Industry Group Index (Software and Services) is HXR’s best proxy – the correlation of monthly returns is 65%. Compared to Software and Services, HXR index performance has been volatile and more recently underwhelming. Cybersecurity was underperforming for the past six months (Chart 2). There are several reasons for Cybersecurity lagging Software and Services.
Chart 1
Chart 2Cybersecurity Has Underperformed Software And Services
Cybersecurity Has Underperformed Software And Services
Cybersecurity Has Underperformed Software And Services
First, companies in the former are much younger and smaller than in the latter (Chart 3), and the size effect has been at play. Second, the industry composition of the two indexes is different, with HXR's allocations to Telecom and Defense sectors being slightly more defensive in nature. Last, and most important, Cybersecurity stocks surged early in the pandemic on the back of lockdowns and a ubiquitous shift to remote work, and hence some of the performance and profits growth were “borrowed” from the future. Chart 3Cybersecurity Theme Is Exposed To The Size Effect
Cybersecurity Theme Is Exposed To The Size Effect
Cybersecurity Theme Is Exposed To The Size Effect
Cybercrime Statistics Cybercrime statistics are sobering, with the number of occurrences increasing fast, and financial damage reaching catastrophic amounts. Cybercrime will cost the world $6 trillion in 2021, and $10.5 trillion annually by 2025,1 representing one of the greatest transfers of wealth in history. The average total cost of a data breach is $4.24 million in 2021, which is up from $3.86 million in 2020.2 US ransomware attacks cost an estimated $915 million in 2020.3 93% of companies deal with rogue cloud apps usage.4 86.2% of surveyed organizations were affected by a successful cyberattack.5 The cost and damage of cyberattacks underpins why Cybersecurity has risen from being an accessory to becoming a “must-have” for companies’ survival (Charts 4 and 5).
Chart 4
Chart 5Cybercrime Losses Spur Demand For Cybersecurity
Cybercrime Losses Spur Demand For Cybersecurity
Cybercrime Losses Spur Demand For Cybersecurity
Key Cybersecurity Verticals And Companies Cybersecurity has evolved over time. Legacy non-cloud incumbents that used to offer on-premises anti-virus software, such as NortonLifeLock, are morphing into or giving way to cloud-based solutions and software-as-a-service (SaaS) providers. These cutting-edge security players leverage Artificial Intelligence (AI) and Machine Learning (ML) to preempt threats, as opposed to reacting to them. In addition, the advantage of the cloud-based solutions is that there is no hardware to buy or manage. The Cybersecurity universe can be split into three major categories: Physical Network Infrastructure, Digital Network Infrastructure, and Cloud And Data Security. Physical Network Infrastructure Companies in this segment provide a mix of digital and physical solutions including supplying communication appliances such as routers and other network hardware. This segment has two incumbents: Cisco Systems (CSCO) and Juniper Networks (JNPR). Digital Network Infrastructure Companies focus on providing broad server and network security against a wide range of attacks. Product offerings may also include firewalls and AI threat detection. A10 Networks (ATEN) and Akamai Technologies (AKAM) operate in this segment. Cloud And Data Security The key verticals of Cloud And Data Security are Endpoint Protection, Secure Web Gateways, Identity Access Management, and Detection and Blocking of malicious emails. Most companies in this space offer cloud-based solutions and SaaS and have products in each of the four data security categories. Companies that roll up a variety of security software functions into a cloud- based service comprise a broad segment called Secure Access Service Edge, or SASE. Fortinet (FTNT), Check Point Software (CHKP), Palo Alto Networks (PANW), and Zscaler (ZS) are all SASE. These companies replace existing gateways, virtual private networks (VPN), edge routers, and firewalls. SASE is expected to have 57% growth in spending in 2021, with 40% compounded growth through 2024.6 Endpoint Protection Platforms help customers secure end-user devices such as mobile devices, laptops, and servers. To be one step ahead of cyber adversaries, these cloud-based companies offer SaaS that deploys AI and ML algorithms to detect and predict threats based on the analysis of the vast data collected across the entire platform. Crowdstrike, Check Point, and SentinelOne are the segment leaders. Secure Web Gateways prevent unsecured traffic from entering an internal network through external web applications. This is executed by the providers acting as a middleman so that users can bypass their internal networks to connect to the applications by leveraging providers data-cloud. These cloud-only companies’ SaaS and Firewall-as-a-Service secure customer access to internally and externally managed applications, such as email or customer relationship management. Fortinet, Zscaler, Palo Alto Networks (PANW), AvePoint (AVE), and Cloudflare (NET) are the best-of-breed players in this space. Identity Access Management (IAM) focuses on enabling access to networks only to authorized users. Multi-factor authentication, application programming interface (API) access management, and single sign-on (SSO) are a few identity solutions that fall under this vertical. Okta (OCTA) and Ping Identity (PING) are the leading players in this space. Their cloud native solutions offer access to all applications within a single portal using the same authentication. Detection And Blocking Of Malicious Emails – Companies in this segment detect and block emails that include known or unknown malware, malicious URLs, and impersonation of legitimate contacts. Mass and spear phishing is becoming a preferred gateway for cyber criminals and is becoming epidemic – 95% of cyberattacks use email. These providers complement traditional detection techniques with AI to identify fake logos and detect anomalous email patterns and high-risk links. Mimecast (MIME) and Check Point (CHKP) are active in this segment. Key Industry Drivers Digitization, Remote Work, And Shift To Cloud Increase Demand For Cybersecurity The pandemic-driven shift to remote work, broad-based migration to cloud computing, development of the Internet-of-Things – every new digital process and asset create new potential targets for hackers. The sophistication of the attacks is also on the rise, deploying AI, ML, and 5G. There appears also to be cooperation among different hacker groups. This year alone, high-profile data breaches, such as Kaseya, Accellion, Pulse Secure, and Solar Winds, affected universities, defense firms, S&P 500 companies, and government agencies. These developments, as troubling as they are, are a boon for Cybersecurity companies. Cybersecurity is becoming business-critical. Despite its celebrity status, this is an industry that is still in the early innings, and ubiquitous digitization requires increasingly more complex cyber defenses. Cyber-Space: A New Realm Of (Geo)Political Conflict Generally the risk of a major exogenous shock affecting global markets from a cyber incident is underrated (Table 1). The world is inherently an anarchic place because nations are sovereign and there is not a single world government to enforce international law. However, nations periodically work out codes of conduct and norms of behavior to impose limitations on conflict and chaos. The post-WWII and post-Cold War global order is an example. A tolerably functional international order is beneficial for global trade and investment flows. Increasingly international rules and norms are being challenged. The decline of the US and Europe in economic, technological, and military weight – relative to the rest of the world – has given rise to a “multipolar” distribution of power in which the rules of the road are contested. Disputes over sovereignty, territory, maritime rights, and air space have been escalating for over a decade in the areas around Russia, China, and the Mediterranean region. Table 1Cyber Event Underrated In Consensus View Of Global Risks
Cybersecurity: A Must-Have For Survival
Cybersecurity: A Must-Have For Survival
Cyber-space is a new realm or domain of human activity. Because it is international, it is inherently ungovernable, and because it is new, nations have not had decades in which to establish basic rules or norms. It is very close to pure anarchy. Given that overall geopolitical competition is rising in the context of multipolarity, cyber-space is an attractive arena for nations to pursue their objectives because it presents fewer constraints – nations can act more independently and aggressively with limited accountability. Cyber gives nation-states (and their proxy groups) greater anonymity and plausible deniability. Russia can directly intervene in American social and political life through state-backed cyber agents, or it can condone the actions of criminal groups that conduct ransomware attacks. Nations can also use cyber tools to pursue state economic goals that align with broader strategic goals. For example, China can pursue technological upgrades for state-backed industry through cyber-theft. The trend for the foreseeable future is for governments to invest in Cybersecurity and cyber-capabilities in order to fortify this new and lawless realm of competition. Russia and China have attempted to seal off their cyber-space to prevent interference from foreign powers. They have also used cyber capabilities to take advantage of the relatively unregulated cyberspace of the liberal democracies. The democracies are now attempting to increase control over their own cyber domains. They need to protect critical infrastructure but also are increasingly focused on patrolling the ideological space. Finally, while nations are often deterred from aggression by conventional militaries, cyber-space creates an avenue to pursue interests aggressively with minimal risk of physical conflict. The US and Israel will continue to sabotage Iran’s nuclear program. Russia will continue to use cyber tools to try to reclaim dominance in the former Soviet Union. And China could resort to cyber-attacks against Taiwan if it is not yet willing to pursue an extremely difficult and risky amphibious invasion. Governments and corporations will deal with extreme uncertainty in this environment. They will have to invest in Cybersecurity. But they will also run the risk that at some point cyber-meddling will go too far and provoke real-world retaliation. President Biden reflected the sentiment of the US political establishment during a speech in July at the Office of the Director of National Intelligence: “I think it’s more likely we’re going to end up, if we end up in a war – a real shooting war with a major power – it’s going to be as a consequence of a cyber breach of great consequence and it’s increasing exponentially, the capabilities.”7 This risk will reinforce the need for more robust cyber defenses to prevent physical harm to a nation’s people and wealth. Hence what governments will not be able to do is penalize or break up their Cybersecurity corporations. Cyber firms will see strong public and private demand without the regulatory pressure that other tech companies (especially social media) will face. Corporate Spending On Cybersecurity Services Is Soaring According to IDC, the global Cybersecurity market is expected to grow from $125 billion in 2020 to $175 billion by 20248 at an 8.8% CAGR. After all, companies that purchased or implemented automated security features in their businesses can reduce potential cyber-attack losses by more than 50%, making it a worthwhile investment. Both large and small businesses are yet to fully implement Cybersecurity defenses. According to an IDG cybersecurity survey,9 91% of organizations are increasing their Cybersecurity budgets in 2021 (compared to 96% in 2020). Companies invest to prevent malicious attacks, and protect an increasingly distributed IT environment, and securely connect their remote workforce (Chart 6). According to an IBM security survey, only 25% of responders stated that they had fully implemented automated security. Clearly, demand for cyber defenses is poised for strong growth.
Chart 6
Public Spending Commitments Will Fortify Cyber Defenses In response to the numerous breaches, the current US administration is placing a high priority on defensive cyber programs. Within the broader $6 trillion Biden budget request to Congress, $10 billion will be allocated to civilian government Cybersecurity in 2022 (Chart 7), bringing the total federal IT spending to just over $58 billion. Since 2017, US government departments have seen the Cybersecurity share of their basic discretionary funding rise steadily from 1.38% to 1.73%. The Biden administration’s broader legislative agenda includes expanding broadband Internet, building infrastructure, and regearing the US energy grid. New cyber vulnerabilities will emerge and both public and private entities will need to invest in security. Chart 8 further reveals the importance of Federal software spending to Cybersecurity equity performance. Our bet is that increases in Federal software spending outlays will lead to outperformance of HXR relative to the Software and Services index.
Chart 7
Chart 8Stepped Up Government Spending Will Lift Cybersecurity Stocks
Stepped Up Government Spending Will Lift Cybersecurity Stocks
Stepped Up Government Spending Will Lift Cybersecurity Stocks
Key Drivers Of Profitability Sales Growth Cybersecurity sales year-over-year growth is soaring at 40% this year and dwarfs the rate of sales growth of Software and Services (Chart 9). This is consistent with a joint survey by IDC and Bloomberg Intelligence Services, which found that worldwide Cybersecurity spending will outpace general software spending by almost 4.9% annualized from 2020 to 2024 (Chart 10).10 Chart 9Cybersecurity Sales Are Soaring
Cybersecurity Sales Are Soaring
Cybersecurity Sales Are Soaring
Chart 10
R&D Investing Has Slowed Cybersecurity companies have been investing in R&D aggressively prior to the pandemic. Intellectual property is a competitive advantage in this space, and R&D has likely been ramped up in “arms races”, with different industry players building their competitive moats. Recently, spending on R&D has eased. We believe that this slowdown is temporary as companies need to stay competitive and fend off threats from cybercriminals (Chart 11). Earnings Growth Despite robust revenue growth, year-over-year earnings growth has recently slowed (Chart 12). Shift to remote work in 2020 resulted in a demand surge that has pulled profits forward. However, despite economic normalization and a return to the pre-pandemic trends, the structural shifts towards cloud and remote work are here to stay, while cybercriminals are getting increasingly more creative and aggressive. As a result, earnings growth is bound to pick up going forward. Chart 11R&D Investment Has Slowed Down
R&D Investment Has Slowed Down
R&D Investment Has Slowed Down
Chart 12After Lockdown Surge, Earnings Growth Is Normalizing
After Lockdown Surge, Earnings Growth Is Normalizing
After Lockdown Surge, Earnings Growth Is Normalizing
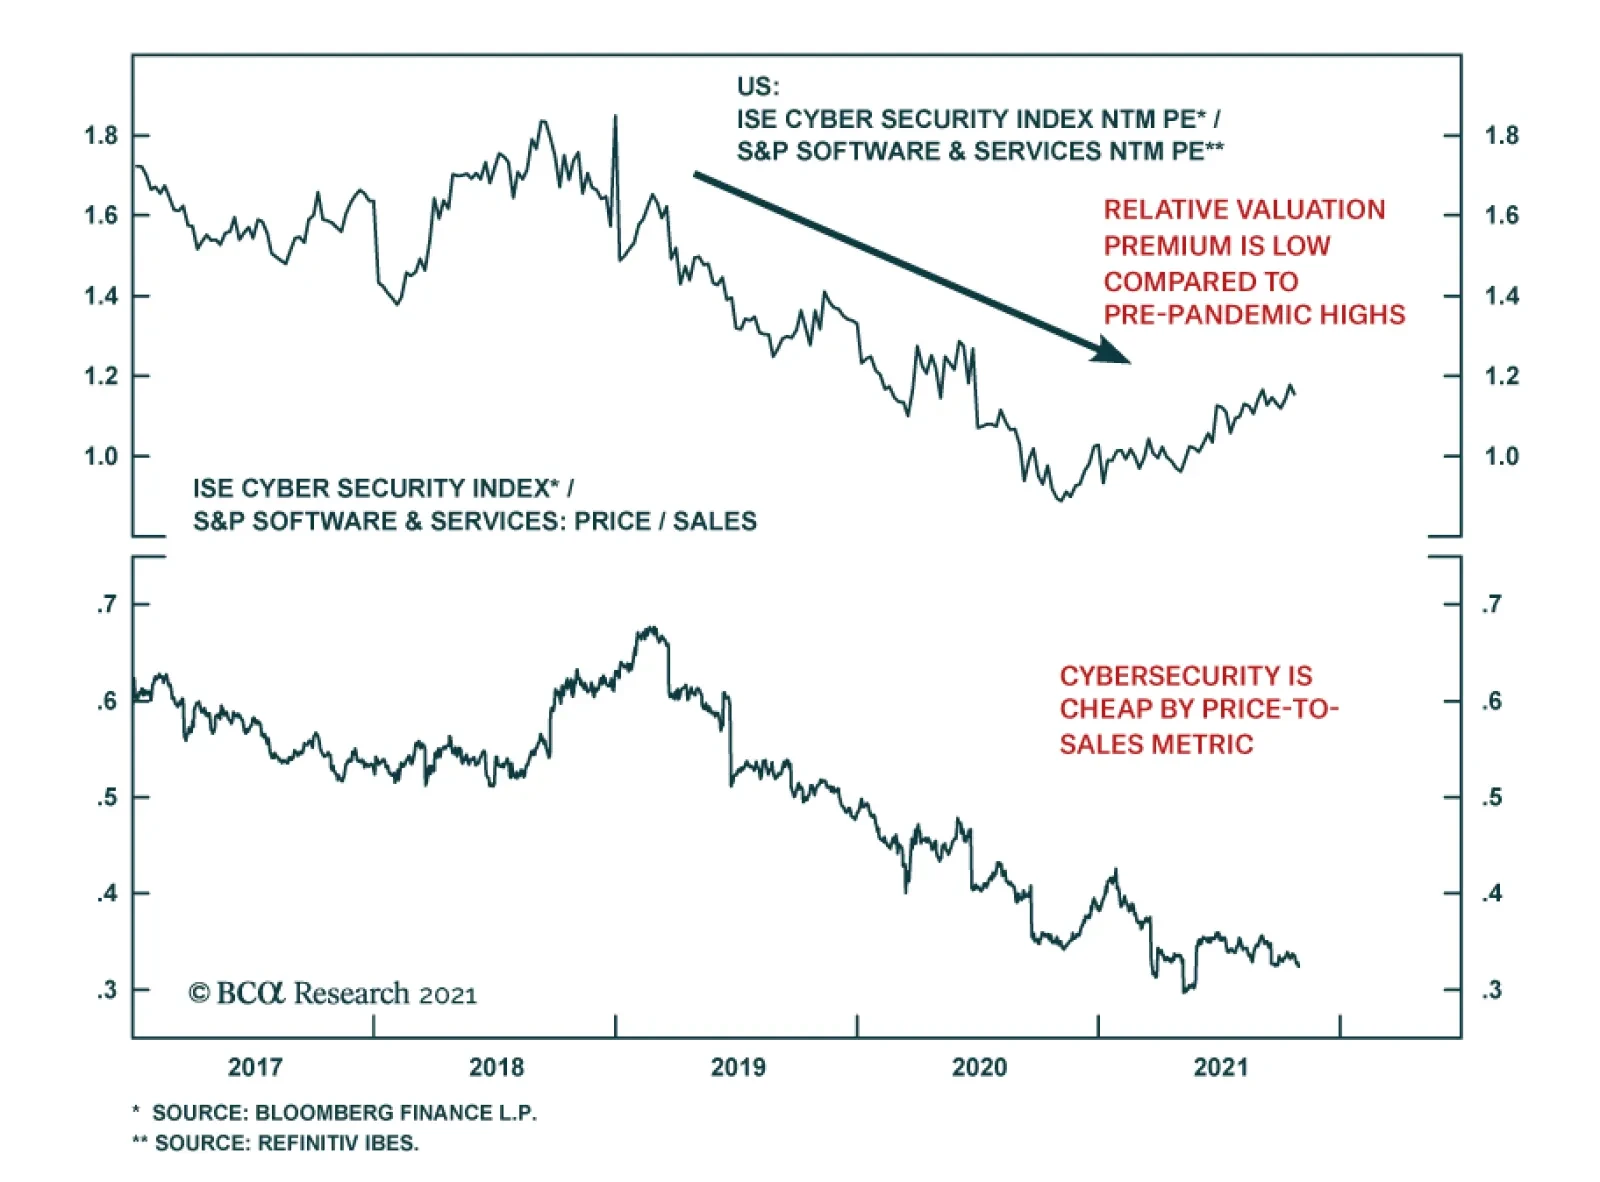
Valuations Currently, HXR is trading at 37x forward earnings, and 104x trailing, which translates into an 13% premium to Software and Services. While this valuation premium appears high, it is low compared to historical values (Charts 13 & 14). The former hefty premium has been deflated by recent underperformance (18%). There is also a meaningful discount to Software and Services when it comes to the Price-To-Sales metric, which is, arguably, the best gauge of value for growing companies. Chart 13Relative Valuation Premium Is Low Compared To Pre-Pandemic Highs
Relative Valuation Premium Is Low Compared To Pre-Pandemic Highs
Relative Valuation Premium Is Low Compared To Pre-Pandemic Highs
Chart 14Cybersecurity Is Cheap By Price-To-Sales Metric
Cybersecurity Is Cheap By Price-To-Sales Metric
Cybersecurity Is Cheap By Price-To-Sales Metric
From a valuation standpoint, Cybersecurity stocks are exorbitantly expensive, yet we can make a case that they are attractive compared to their own history, and these levels signify an opportunity to build a new position in this theme. How To Invest In Cybersecurity ETFs There are a number of highly liquid ETFs, such as CIBR, BUG, and HACK, powered by the Cybersecurity theme, cutting across several industry groups (Table 2 & Appendix). These passively managed funds have relatively high expense ratios. Direct indexing may be preferable as a basket of the Cybersecurity stocks is relatively easy to assemble. Given that the CIBR ETF has predominantly US companies, is most liquid, and has the highest AUM, it is our vehicle of choice for capturing the Cybersecurity theme. Table 2Cybersecurity ETFs
Cybersecurity: A Must-Have For Survival
Cybersecurity: A Must-Have For Survival
S&P 500 Investors with an S&P500-only mandate may create a Cybersecurity basket from five major players spread across several sectors to gain direct exposure to the large-cap Cybersecurity universe: Cisco (CSCO), Juniper (JNPR), Fortinet (FTNT), NortonLifeLock (NLOK), and Akamai (AKAM). These companies represent the entire network security market, with CSCO and JNPR providing exposure to physical network infrastructure, AKAM representing the Digital Network Infrastructure vertical, FTNT covering Digital Data Security, and finally NLOK a legacy player focused on End Point Protection. It is important to note that some of the fastest growing and innovative players, such as Crowdstrike, Okta, and Zscaler, are outside of the S&P 500 as their market capitalizations are too small. Investment Implications Cybersecurity is increasingly important for businesses in the US and abroad, with demand for solutions surging. As a result, Cybersecurity is a structural investment theme, which warrants a long-term position in most equity portfolios. As with any investment into an emerging technology or theme, it is likely to be volatile, but the long-term upside should justify day-to-day jitters. Also, our analysis demonstrates that now is a good time to build a tactical overweight in Cybersecurity stocks. These stocks have been languishing for a few months, losing some of the valuation froth generated by the work-from-home hype. As a result, most of the cybersecurity stocks are attractively valued compared to history and are poised for a rebound on the back of robust demand for their services. Bottom Line Global digital transformation as well as rising geopolitical tensions create fertile ground for attacks by both cyber criminals and malicious state actors. The cyber defenses of most private and public companies are still ill-prepared, and the space is poised for a robust growth since Cybersecurity is a “must have” for survival. This growing market has attracted a plethora of new cybersecurity players which provide cloud-based SaaS solutions, and are well-versed in deploying AI and ML to counter cyber threats. While many of these companies are still young with relatively small capitalization, their potential is enormous. We recommend tactical and structural overweights to the theme. Irene Tunkel Chief Strategist, US Equity Strategy irene.tunkel@bcaresearch.com Matt Gertken Vice President Geopolitical Strategy mattg@bcaresearch.com Arseniy Urazov Senior Analyst ArseniyU@bcaresearch.com Appendix
Image
Image
Footnotes 1 Special Report: Cyberwarfare In The C-Suite, Cybercrime Magazine, Nov 13, 2020. 2 IBM and Ponemon Institute Research 3 Emsisoft 4 Imperva 2019 Cyberthreat Defense Report 5 CyberEdge Group 2021 Cyberthreat Defense Report 6 Barron’s, Security Software Stocks Should Have Strong Q2 Results. Here’s Why, July 12, 2021. 7 Nandita Bose, “Biden: If U.S. has ‘real shooting war’ it could be result of cyber attacks,” Reuters, July 28, 2021, reuters.com. 8 IDC, “Ongoing Demand Will Drive Solid Growth for Security Products and Services, According to New IDC Spending Guide,” Aug 13, 2020. 9 Cybersecurity at a Crossroads: The Insight 2021 Report", IDG Research Services, 2021. Respondents included more than 200 C-level IT and IT security executives in organizations with an average of 21,300 employees across a wide range of industries. 10 Source: Bloomberg Intelligence (Mandeep Singh - Senior Industry Analyst), August 25, 2021 & IDC.
Global bond markets experienced big moves over the past few weeks. Yield curves bear-flattened as investors increasingly priced in the possibility that central banks will bring forward their liftoff dates and potentially commit a policy error. In the US,…
BCA Research’s US Equity Strategy, Geopolitical Strategy & US Political Strategy services recommend Cybersecurity as a structural and tactical overweight. The pandemic-driven shift to remote work, broad-based migration to cloud computing, and the…
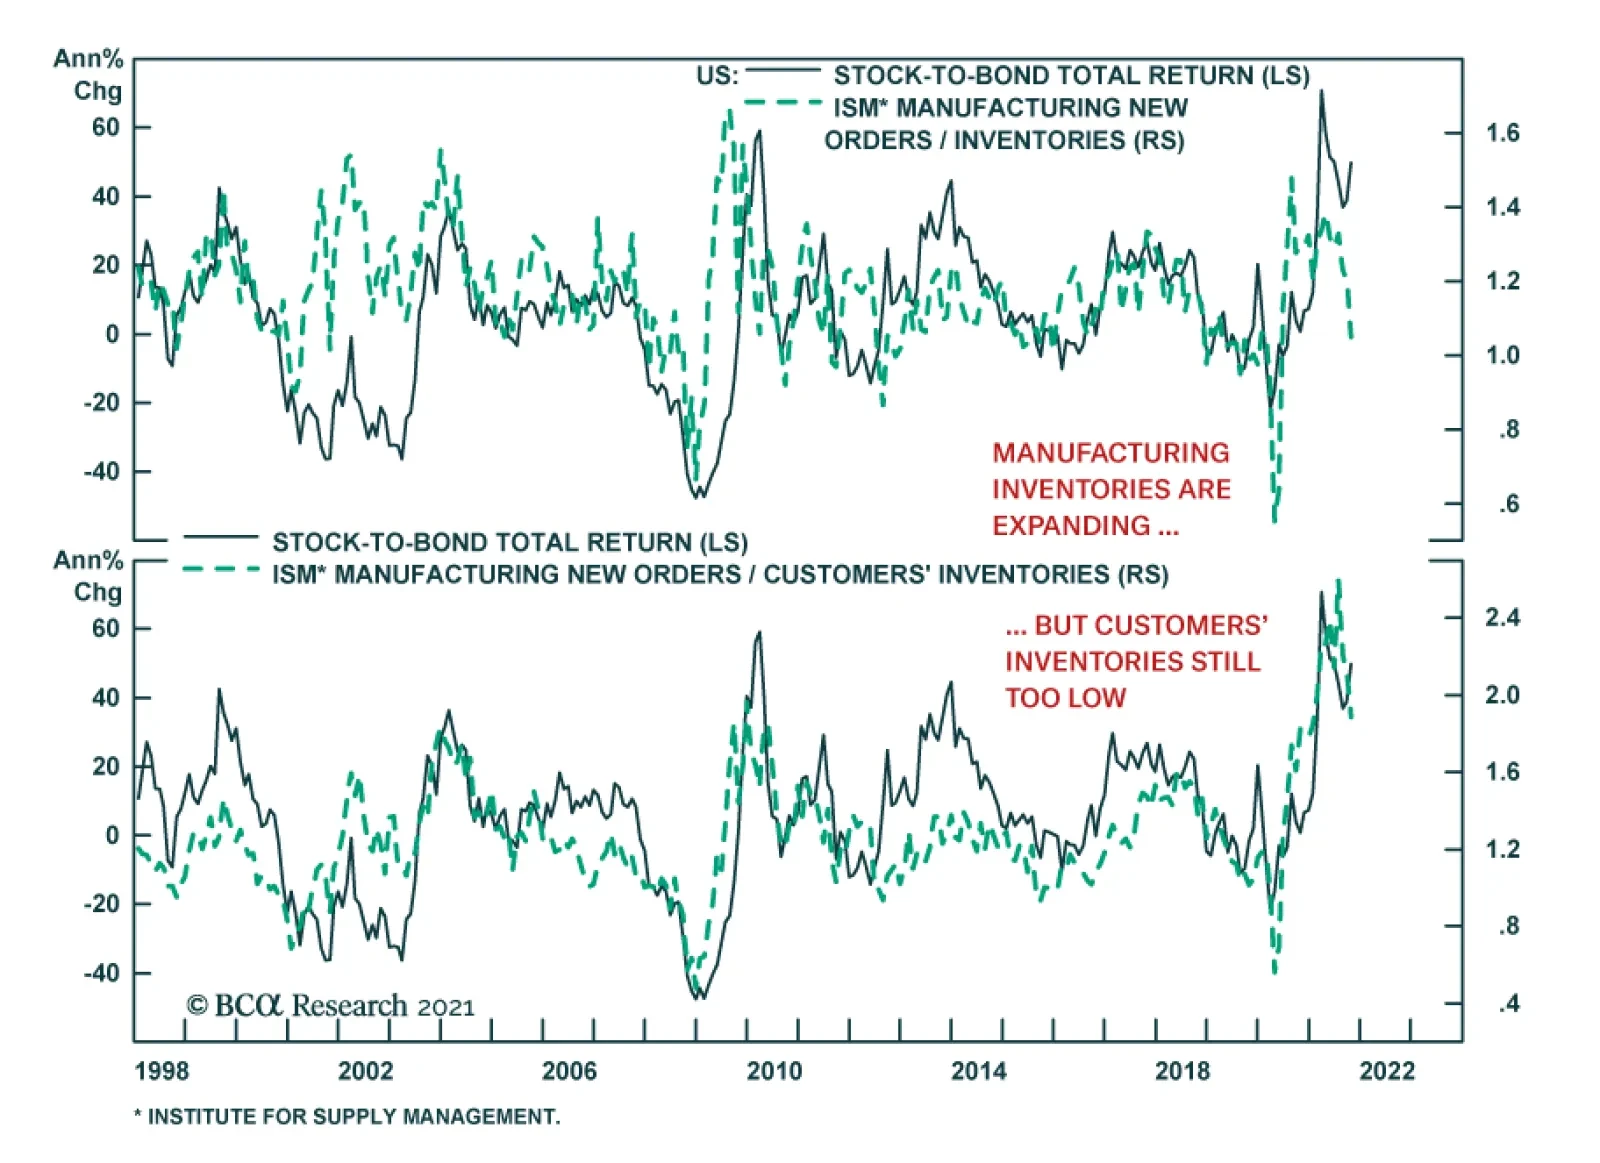
The ISM manufacturing survey suggests that US manufacturing activity decelerated slightly in October. The headline index ticked down to 60.8 from 61.1, slightly above expectations of 60.5. In particular, a nearly seven-point decline in the New Orders…
Highlights Economy – It is more likely that the third quarter slowdown reflected demand deferral than demand destruction: We are not concerned that the lousy third quarter GDP release heralds stagflation. Massive fiscal transfers and an unprecedented increase in household wealth will support consumption and keep the economy from stagnating. Markets – Another quarter, another sizable earnings beat: Despite shortages, bottlenecks and logistics challenges, S&P 500 profit margins held up much better than expected in the third quarter, allowing earnings to maintain their pandemic streak of exceeding the analyst consensus by an unusually wide margin. Strategy – Stay on the right side of the cycles: The business cycle, the credit cycle and the monetary policy cycle all support overweighting equities and underweighting Treasuries and cash. There will be a time to turn defensive, but it’s not here yet. Feature Stagflation, combining stagnant activity and high inflation, is a clever phrase but a deeply unpleasant economic outcome. It is central bankers’ and elected officials’ bête noire because there is no politically palatable way to counter it. Raising rates to throttle inflation risks driving unemployment higher while stimulating the economy to bolster employment risks letting inflation burn out of control. Paul Volcker was hung in effigy for taking the former route, plunging the economy into a painful double-dip recession to shatter the inflationary mindset, while Jimmy Carter saw his re-election prospects evaporate once voters were asked how they’d fared over his stagflation-ridden term. The November edition of the Bank Credit Analyst examines the drivers of the ‘70s/early ‘80s stagflation. After a through then-and-now comparison, it concludes that a stagflationary outcome is unlikely albeit not impossible. We agree, for the simple reason that you can’t have stagflation without stagnating and we expect that the economy will grow well above its trend level all the way through 2022. We expect that sustained nominal GDP growth of 6% or more, in contrast to the 4% rate that has prevailed since 2000, will support risk asset outperformance over the next twelve months. A Discouraging Quarter The rise of the Delta variant cast a pall over the economy in the third quarter, as the first estimate of GDP made clear. A summer that began with great optimism about getting back to normal quickly fizzled in the face of surging infections (Chart 1), stalled vaccinations (Chart 2), spotty supplies and logistical bottlenecks. GDP growth forecasts cratered (Chart 3, top panel) and economists went on to dial back their expectations for next quarter (Chart 3, middle panel) and 2022 (Chart 3, bottom panel). In the end, growth proved to be even worse than expected, falling all the way to 2% with real final domestic demand (GDP after backing out inventory stocking and net exports) growing just 1%. Chart 1So Much For The Summer Of Fun
So Much For The Summer Of Fun
So Much For The Summer Of Fun
Chart 2Grinding To A Halt
Grinding To A Halt
Grinding To A Halt
Chart 3Downward Revisions
Downward Revisions
Downward Revisions
A bear could interpret the decline as evidence that extraordinary policy measures have failed, giving way after just two quarters of Potemkin village growth. We are decidedly bullish, however, and view the third quarter as a stumble that will merely stretch out a consumption-fueled blowout that has already begun. A swoon in motor vehicle purchases lopped off 240 basis points of GDP by itself, while declining residential investment cost 40 basis points. The third quarter’s decline in auto sales was unprecedented during an expansion, however (Chart 4), and we view it as a supply-driven hiccup that will disappear once production revives. (Ford’s double-digit rise after reporting earnings last week suggests the equity market sees it that way, too.) Chart 4An Unprecedented Expansion Event
An Unprecedented Expansion Event
An Unprecedented Expansion Event
As for residential investment, we stand by our view that the housing market has been inadequately supplied for several years.1 Structural issues like tight local zoning rules may be as much of a constraint on supply as cyclical factors, but they are not new and we do not expect that they will thwart builders’ response once the requisite human and material inputs can again be accessed. Like auto sales, residential investment does not typically decline amidst expansions (Chart 5). We attribute the slowdown in services consumption, particularly in food services and accommodations (Chart 6, top panel) and recreation services (Chart 6, bottom panel), to last quarter’s spike in COVID infections. Now that the Delta variant seems to have run its course and 5-to-11-year-olds are poised to become vaccination-eligible, we expect the recovery in discretionary services consumption to return to something between its first half and third quarter pace. Chart 5Residential Investment Looks More Likely To Contribute To Growth Than Detract From It
Residential Investment Looks More Likely To Contribute To Growth Than Detract From It
Residential Investment Looks More Likely To Contribute To Growth Than Detract From It
Chart 6Not So Bad For An Outbreak
Not So Bad For An Outbreak
Not So Bad For An Outbreak
The Creeping Menace The Delta variant upended a quarter’s output, but inflation could prove to be a more durable threat. Nominal GDP growth in the third quarter (7.8%) slowed considerably from the first half (12.1%), but the decline in real growth to 2% from 6.5% was much worse. If inflation doesn’t come down more rapidly than it did last quarter – as measured by the GDP deflator, it was 6.1% in 2Q and 5.7% in 3Q – it threatens to swallow up much of the quickened nominal growth pace. If upward price pressures are not as transitory as they first appeared, the expansion may fail to live up to its hype. The good news from our perspective is that long-run inflation expectations remain muted. Neither consumer surveys nor market-based measures suggest that a potentially self-fulfilling inflationary mindset has taken hold. The University of Michigan’s consumer confidence survey reveals that households’ inflation expectations curve is sharply inverted, with inflation over the next five to ten years, 2.8%, expected to be two percentage points lower than next year’s 4.8% rate (Chart 7). The market-based inflation expectations curve is not so steeply negative – investors aren’t as gloomy about the near-term outlook – but it is decidedly inverted and reinforces the transitory narrative (Table 1). Chart 7Households Think Inflation's Transitory ...
Households Think Inflation's Transitory ...
Households Think Inflation's Transitory ...
We (and the Fed) focus so much attention on the inflation expectations curve because high inflation will not become self-sustaining until economic actors – workers, businesses, consumers and lenders – begin to expect it will persist into the future and change their behavior accordingly. When inflation is expected to be persistently high, workers insist on higher wages to maintain purchasing power, businesses demand higher prices to preserve their margins, consumers accelerate their big-ticket purchases to get the most bang for their buck and lenders require higher nominal pro forma returns. The resulting feedback loops help inflation become entrenched in the same way that expectations of falling prices have enabled the deflationary mindset that continues to grip Japan. As long as households and investors expect inflation to decelerate over time, the inflation genie will not have gotten out of the bottle. Table 1... And So Do Financial Markets
Half-Empty Or Half-Full?
Half-Empty Or Half-Full?
Households Have A Great Deal Of Dry Powder We have closely monitored US households’ pandemic savings ever since the CARES Act payments began to flow. We viewed the growing pile of excess savings – aggregate household savings above the level that would have accumulated if pre-pandemic income and consumption trends had continued – as a proxy for households’ ability to make up for foregone consumption once COVID-19 loosened its grip on economic activity. Our running tally, now $2.2 trillion, has stabilized since the final round of economic impact payments was distributed this spring: spending caught up to its pre-pandemic trajectory in August and income slipped below its pre-COVID trend last month upon the expiration of federal supplemental unemployment insurance benefits. Households flexed their formidable spending capacity in the first half of the year, when consumption grew at a whopping 11.7% annualized real rate even while excess savings continued to grow. The experience of the first half testifies to the force of pent-up demand, the magnitude of fiscal support extended to households and the staggering wealth gains that have resulted from the appreciation of home prices and financial assets. As our Global Investment Strategy colleagues highlighted in their latest report, since the end of 2019, household net worth as a share of GDP has grown at its highest rate on record (Chart 8). Citing empirical studies finding that households spend 5 to 8 cents of every incremental dollar of housing wealth and 2 to 4 cents of every incremental dollar of stock market gains, they estimate that the wealth effect will support about $600 to $900 billion of consumption. Chart 8A Wealth Surge For The Books
A Wealth Surge For The Books
A Wealth Surge For The Books
We have lauded excess savings as the primary support for elevated consumption, but those numbers suggest that household net worth gains deserve nearly equal billing. Our ballpark assumption has been that households will spend around one half of their excess savings, or $1.1 trillion, equivalent to nearly 5% of GDP. $600 to $900 billion of wealth effect consumption would tack on another 2.5 to 4%, bringing the total incremental spending capacity to 7 to 9% of GDP. Though these estimates are imprecise and should not be viewed as predictions, they testify to the force of the consumption tailwinds available to support the US economy. Another Robust Quarter For S&P 500 Earnings Amazon’s sizable third quarter earnings miss and stark fourth quarter guidance banished the budding sense of celebration surrounding the current reporting season, but it has nonetheless been exceptional by pre-COVID standards. Through the first three weeks, with 279 companies having reported results, third quarter earnings are projected to be 7.4% ahead of the final consensus estimate (Chart 9). Though it will fall short of the two- and three-standard-deviation level the index has reached the previous five quarters, this quarter is on track to top the maximum 6% beat recorded from 2012 through 2019 (Chart 10).
Chart 9
Chart 10
Possibly the most surprising factor within the bottom-line EPS data has been the magnitude and breadth of margin surprises. Through last Friday, revenues had surprised to the upside by 2% while earnings had beaten by 11%. The 9-percentage-point spread reveals how much margins have surpassed expectations in the face of upward wage and other input cost pressures. Breadth has also been impressive, with every sector but Materials achieving wider-than-expected margins (Table 2). Table 2Margins Positively Surprised Nearly Across The Board
Half-Empty Or Half-Full?
Half-Empty Or Half-Full?
We do not know why margins fared better in the real world than they did in analyst models – it was presumably a combination of increased operating leverage and an ability to continue to reduce or eliminate some costs – but we expect margins will contract in subsequent quarters, as per our US Equity Strategy team’s recent detailed analysis. In this regard, perhaps the reduced magnitude of this quarter’s earnings beat heralds a return to the pre-pandemic pattern in which companies were not able to achieve unanticipated efficiency gains quarter after quarter. For the last two quarters, we have been highlighting that expectations were very low because the consensus was calling for highly unusual quarter-over-quarter declines in earnings. If those laughably easy comparisons go away, the path may become a little rockier for equities. For the next twelve months, however, we expect gale-force consumption tailwinds will allow equities to continue to generate positive excess returns over Treasuries and cash. Doug Peta, CFA Chief US Investment Strategist dougp@bcaresearch.com Footnotes 1 Please see the July 12, 2021 US Investment Strategy Special Report, "The US Housing Market: Déjà Vu All Over Again?" available at usis.bcaresearch.com.
Highlights The market pricing of the ECB is too aggressive. More so than in the US, temporary factors explain the European inflation surge. Energy, taxes, and base effects account for the bulk of the price increases. In contrast to supply shortages, European labor shortages are small and slack will limit wage growth. Despite the lack of near-term inflation risks, European growth prospects are significantly stronger than last decade. As a result, European inflation will settle at a higher level than in the 2010s and will increase durably in the second half of the 2020s. The inflation curve will steepen, as will the yield curve. Banks will continue to outperform, especially compared to the insurance sector. A tactical opportunity to buy European high-yield corporates has emerged. In France, Macron remains the favorite for the 2022 presidential election. Feature Last week’s ECB meeting did nothing to curb the impression among traders that the ECB will start removing monetary accommodation in 2022. The implied policy rate stands at -0.25% one year from now and -0.08% in two years. Meanwhile, Italian 10-year spreads over Germany have increased to 127bps, their highest level since November 2020. This market action rests on the perception that inflationary pressures in the Euro Area are durable. While this line of reasoning may have credence in the US, it is weaker across the Atlantic where the economy shows fewer signs of genuine inflationary pressure. Moreover, the deterioration in peripheral financial conditions further limits the ability of the ECB to withdraw accommodation without a financial accident. Meanwhile, the NGEU program has created a climate where the likelihood of a premature and excessive fiscal tightening is low. Thus, the weak European growth of the past decade will not be repeated. When considering these inflationary and fiscal views, it becomes apparent that the European yield curve has room to steepen further. Consequently, European banks remain attractive and should be bought on dips, especially relative to insurance companies. The EONIA Curve Is Too Aggressive The sudden increase in interest rate hikes priced in the EONIA curve is a consequence of the rapid acceleration in European realized inflation and CPI swaps. Neither are durable. Headline HICP has surged to 4.1% and core CPI towers at 2.1%, their highest reading in 13 and 19 years, respectively. These surges are the reflection of transitory factors: Chart 1The Energy Path-Through
The Energy Path-Through
The Energy Path-Through
Energy prices are lifting HICP and are sipping through to core CPI. Inflation for electricity, gas, and fuel has reached 14.7% and the energy CPI is at 23.5%. Both are moving in line with headline and core CPI (Chart 1). Now that Brent oil and natural gas have increased four and twenty folds since Q2 2020, respectively, their ability to contribute as much to overall inflation has decreased because they are unlikely to appreciate as much again. While oil prices may rise again here, European natural gas will decline meaningfully in the coming months. Tax increases are another important driver of core CPI. Core inflation with constant taxes stand at 1.37%, which is 0.67% below core CPI. In other words, while core CPI is high by the standard of the past decade, once we adjust for tax increases, it stands at normal levels (Chart 2). Base-effects are another dominant ingredient of the surge in European core CPI. The annualized two-year rate of change of the Eurozone’s core CPI stands at 1.11%, which is within the norm of the past seven years and below the rates experienced prior to 2014. In comparison, the annualized two-year core inflation in the US is 2.87%, well outside the range of the past decade (Chart 3). Chart 2Death And Taxes
Death And Taxes
Death And Taxes
Chart 3Controlling For The Base Effect
Controlling For The Base Effect
Controlling For The Base Effect
Inflation remains narrowly based. The Euro Area trimmed-mean CPI stands at 0.22%, or 1.82% below core CPI. Meanwhile, in the US, trimmed-mean CPI has reached 3.5% or 0.5% below core CPI (Chart 4). These figures confirm that the Eurozone inflation increase is more muted and narrower than that of the US. Wages are not experiencing any meaningful shock so far. Negotiated wages are growing at a 1.7% annual rate; meanwhile, the Atlanta Fed Wage Tracker is expanding at 3.6% and is rising even more steadily for low-skill jobs (Chart 5). Chart 4Much More Narrow Than In The US
Much More Narrow Than In The US
Much More Narrow Than In The US
Chart 5Limited Wage Pressures
Limited Wage Pressures
Limited Wage Pressures
Continental Europe’s more limited inflationary pressures compared to the US are a consequence of policy decisions during the crisis. The Euro Area fiscal stimulus in 2020 and 2021 amounted to 11% of 2019 GDP, but output declined by 15% in Q2 2020 and suffered a second dip in Q1 2021. Meanwhile, US fiscal packages amounted to 25% of 2019 GDP, while GDP declined by 10% in Q2 2020. Consequently, the Eurozone’s output gap is -4.1% of GDP, while that of the US has essentially closed. The contrasting nature of the stimuli accentuated the different outcomes created by their respective size. In Europe, governmental support focused on keeping people at work, which left aggregate supply unchanged. In the US, public programs allowed jobs to disappear, but they placed money directly in the pockets of consumers, which caused aggregate demand to rise relative to aggregate supply. In this context, a wage-price spiral is unlikely to develop in Europe as long as the energy crisis does not continue through 2022.
Chart 6
First, the labor shortage problems are less acute in the Eurozone than in the US or the UK. Chart 6 highlights the factors limiting production in various industries. In the industrial sector, the “labor shortages” category has grown, but pale compared to the role of “material and equipment shortages” as a problem. In the services sector, the “weak demand” and “other” categories are greater obstacles to production than the “labor” factor, which remains at Q1 2020 levels (Chart 6, middle panel). Only in the construction sector are “labor shortages” the chief problem, but they still hurt production less than “insufficient demand” did in February 2021, when real estate prices were already strong (Chart 6, bottom panel). Second, labor market slack remains comparable to 2011 levels, when the ECB erroneously increased interest rates to fight energy-driven inflation (Chart 7). Additionally, the rise in persons available to work but not currently seeking employment represent 75% of the increase in labor market slack since Q4 2019. At the crisis peak in Q2 2020, this category accounted for 105% of the increase in labor market slack. This suggests that, as the vaccination campaign continues to progress across the continent; as households use up their savings; and as government supports ebb across Europe, a large share of those who are a part of the labor market slack will start looking for jobs again, which will increase the supply of workers and limit wage pressures. If traders are overly worried about realized inflation remaining high in Europe, they are also over-emphasizing some CPI swap measures that trade above 2%. CPI swaps only tell one part of the inflation expectations story, because they are one and the same as energy prices. Elevated energy prices sap spending power in the rest of the economy, if other inflation expectation measures remain well anchored; thus, rising energy inflation rarely translates into broad-based pricing pressure. For now, our Common Inflation Expectation measure for the Eurozone, based on the New York Fed’s method for the US, is still toward the low-end of its distribution, even though it includes CPI swaps (Chart 8). This confirms that the energy crisis remains a relative-price shock and that it is unlikely to lead to a generalized inflation outburst in the Euro Area.
Chart 7
Chart 8Different Inflation Expectations
Different Inflation Expectations
Different Inflation Expectations
Bottom Line: Markets expect a first 10bps ECB rate hike by June 2022 and the deposit rate to be 25bps higher by September 2023. However, unlike in the US, there are few signs that European inflation reflects anything more than higher energy prices, rising taxes, and base effects. Moreover, the stories in the press of labor shortages are exaggerated, while broad-based inflation expectations are not unmoored. In this context, we lean against the EONIA pricing and expect the ECB to increase rates in 2024, at the earliest. Fiscal Policy Unlike Last Decade The 2010s were a lost decade for Europe. GDP only overtook its 2008 peak in 2015. Today, GDP is recovering much faster from the recession than it did twelve years ago, and it is unlikely to relapse as it did back then. Chart 9A Lost Decade
A Lost Decade
A Lost Decade
The European economic underperformance last decade was rooted in fiscal policy. As the top panel of Chart 9 highlights, the fiscal thrust during the GFC was minimal, at 1.3% of GDP, and was rapidly followed by a negative fiscal thrust. Moreover, the ECB unduly tightened policy in 2011 and left peripheral spreads fester at elevated levels between 2011 and 2014. This combination substantially hurt demand, especially in the European periphery. Capex proved particularly vulnerable. It is derived demand and therefore adds considerable variance to GDP. Faced with strong policy headwinds, its share of GDP plunged for most of the decade, which greatly contributed to the European economic malaise (Chart 9, bottom panel). According to the IMF, the Eurozone fiscal thrust will not exert the same drag as it did last decade; hence, capex is also unlikely to repeat its mediocre performance. Instead, the poorer Eastern and Central European economies as well as the weaker peripheral nations will receive a significant fillip from the NGEU program (Chart 10). When the NGEU grants and loans as well as the EU’s Multiannual Financial Framework funds are aggregated together, the EU will provide EUR1.9 trillion funding (adjusted for inflation) to member states over the next five years (Table 1). These sums will prevent any meaningful fiscal retrenchment from taking place.
Chart 10
Table 1Bigger Spending
To Hike Or Not To Hike?
To Hike Or Not To Hike?
The NGEU funds will be particularly supportive for capex. The Recovery and Resilience Facility (RRF), which will be the main instrument to deliver funds across Europe, is heavily weighted toward green transition, reskilling, and digital transformation (Chart 11, top panel). Practically, this spending focuses on electrical, power, water, and broadband infrastructures, as well as renovation and modernization projects (Chart 11, bottom panel). This reinforces the notion that capex is unlikely to follow the same trajectory it did last decade.
Chart 11
The implication of more accommodative fiscal policy and more robust capex is that the European output gap will close much faster than it did after the GFC. Hence, even if we expect the current inflation spike to pass next year, inflation will ultimately settle higher than it did last decade. Moreover, in the second half of the 2020s, European inflation will trend higher as full employment will be achieved. Bottom Line: The Euro Area is unlikely to experience another lost decade like the previous one. European trend growth remains low, but fiscal policy will not be as tight. Consequently, capex will not be as depressed, especially because the NGEU grants will greatly incentivize investments in certain sectors of the economy. As a result, the output gap will close much faster than it did in the 2010s. Moreover, once the current pandemic-driven inflation surge passes, CPI will settle at a higher level than it did last decade and will trend higher durably in the second half of the 2020s. Investment Implications Three main conclusions can be derived from our expectation on European inflation and growth dynamics over the coming decade. First, the inflation yield curve will steepen meaningfully. Today, near-term CPI swaps are lifted by energy markets and 2-year CPI swaps are 20bps above 20-year CPI swaps (Chart 12). From 2012 to 2020, 20-year CPI swaps stood between 30 bps and 150 bps above short maturity ones. Second, a steeper inflation curve, along with greater inflation risk toward the end of the decade will cause the European term premium to normalize from its -1.21% level. This will allow German 10-year yields to rise and the European yield curve to steepen (Chart 13). Chart 12Long-Term Inflation Expectations Have Upside
Long-Term Inflation Expectations Have Upside
Long-Term Inflation Expectations Have Upside
Chart 13A Steeper German Yield Curve
A Steeper German Yield Curve
A Steeper German Yield Curve
Third, higher German yields and a steeper curve will greatly benefit European banks (Chart 14, top panel). This pattern will be especially evident against insurance firms, which have massively outperformed deposit-taking institutions over the past seven years as yields fell (Chart 14, bottom panel). Additionally, banks’ balance sheets have become more robust than they once were and NPLs are unlikely to rise meaningfully as a result of government guarantees and easy fiscal policy (Chart 15). Investors should go long bank/short insurance on a cyclical basis. Chart 14Long Bank / Short Insurance
Long Bank / Short Insurance
Long Bank / Short Insurance
Chart 15Imporving Balance Sheets
Imporving Balance Sheets
Imporving Balance Sheets
A Tactical Buying Opportunity In European High-Yield Corporate Bond Market Chart 16Tactical Buying Opportunity
Tactical Buying Opportunity
Tactical Buying Opportunity
The 40 basis points widening in European high-yield spreads has created a tactical buying opportunity. Inflation fears spurred by rising energy prices and by input prices are the likely culprit behind the recent spread widening (Chart 16). Although US junk spreads have already narrowed significantly, European high-yield corporate bond spreads are still 40 bps wider than at the beginning of September. The 12-month breakeven spread, which measures the degree of spread widening required over a 12-month period for corporate bond returns to break even with a duration-matched position in government bond securities, now ranks at its 20th percentile, from 10th (Chart 16, second panel). Spreads will narrow back to near post-crisis lows before year-end on both an absolute and breakeven basis: First, monetary and fiscal policy remain very accommodative. Importantly, Spain and Italy will receive large shares of the NGEU funds until 2026. Second, growth will remain above trend despite recent inflation worries. Third, the European default rate is still falling, leaving the worst of the default cycle behind (Chart 16, third panel). Finally, our bottom-up Corporate Health Monitor signals improving corporate health, which historically coincides with narrowing spreads (Chart 16, bottom panel). Bottom Line: The recent widening in European high-yield spreads represents a short window of opportunity to buy the dip. Beyond this timeframe, a more cautious approach toward European credit is appropriate, as the ECB will become less active in the bond market. A French Update
Chart 17
Last month, French President Emmanuel Macron unveiled a EUR30 billion investment plan aimed at supporting and fostering industrial and tech “champions of the future.” This new plan comes on top of the EUR100 billion recovery package that was announced in September 2020 to face the pandemic. While these investments will be made across many sectors of the French economy, the focus will be the French tech and energy sectors (Chart 17, top panel). This announcement comes six months before the next presidential election and amid the emergence of Eric Zemmour as a potential far-right candidate. However, Zemmour’s candidacy is unlikely to alter our expectation that Macron will be re-elected in 2022. Recent polls that include Zemmour as a potential candidate in the first-round show that he is appealing to Marine Le Pen’s voter base (Chart 17, bottom panel). Meanwhile, former Prime Minister Edouard Philippe—who would have made a formidable opponent to Macron had he decided to run—announced the creation of his own party with the objective of supporting Macron’s re-election campaign. Chart 18Recent Developments Support These Trades
Recent Developments Support These Trades
Recent Developments Support These Trades
These political developments come as the French health and economic picture keeps improving. Although the vaccination pace has slowed in France, 68% of the population is fully vaccinated and 76% of the population has received at least one dose. Thus, the healthcare system continues to weather well recent COVID waves. Moreover, business confidence remains robust and reached its highest reading since July 2007, despite supply issues holding back production. The French jobs market is also recovering, with the unemployment rate expected to fall to 7.6% in Q3 from 8% in Q2. The introduction of a new investment plan, the emergence of a far-right candidate and Edouard Philippe’s newfound support, and the COVID-19 and economic developments bode well for President Macron’s chances at re-election. This implies additional French reforms over the next five years that aim to suppress unit labor costs and to make French exports more competitive vis-à-vis their main competitor, Germany. As a result, investors should overweight French industrial stocks relative to German ones (Chart 18, top panel). Meantime, additional investment in the French tech is bullish for a sector that is inexpensive relative to its European peers. Overweight French tech equities relative to European ones (Chart 18, panel 2 and 3). Mathieu Savary, Chief European Strategist Mathieu@bcaresearch.com Jeremie Peloso, Associate Editor JeremieP@bcaresearch.com Tactical Recommendations
To Hike Or Not To Hike?
To Hike Or Not To Hike?
Cyclical Recommendations
To Hike Or Not To Hike?
To Hike Or Not To Hike?
Structural Recommendations
To Hike Or Not To Hike?
To Hike Or Not To Hike?
Closed Trades
Image
Currency Performance Fixed Income Performance Equity Performance
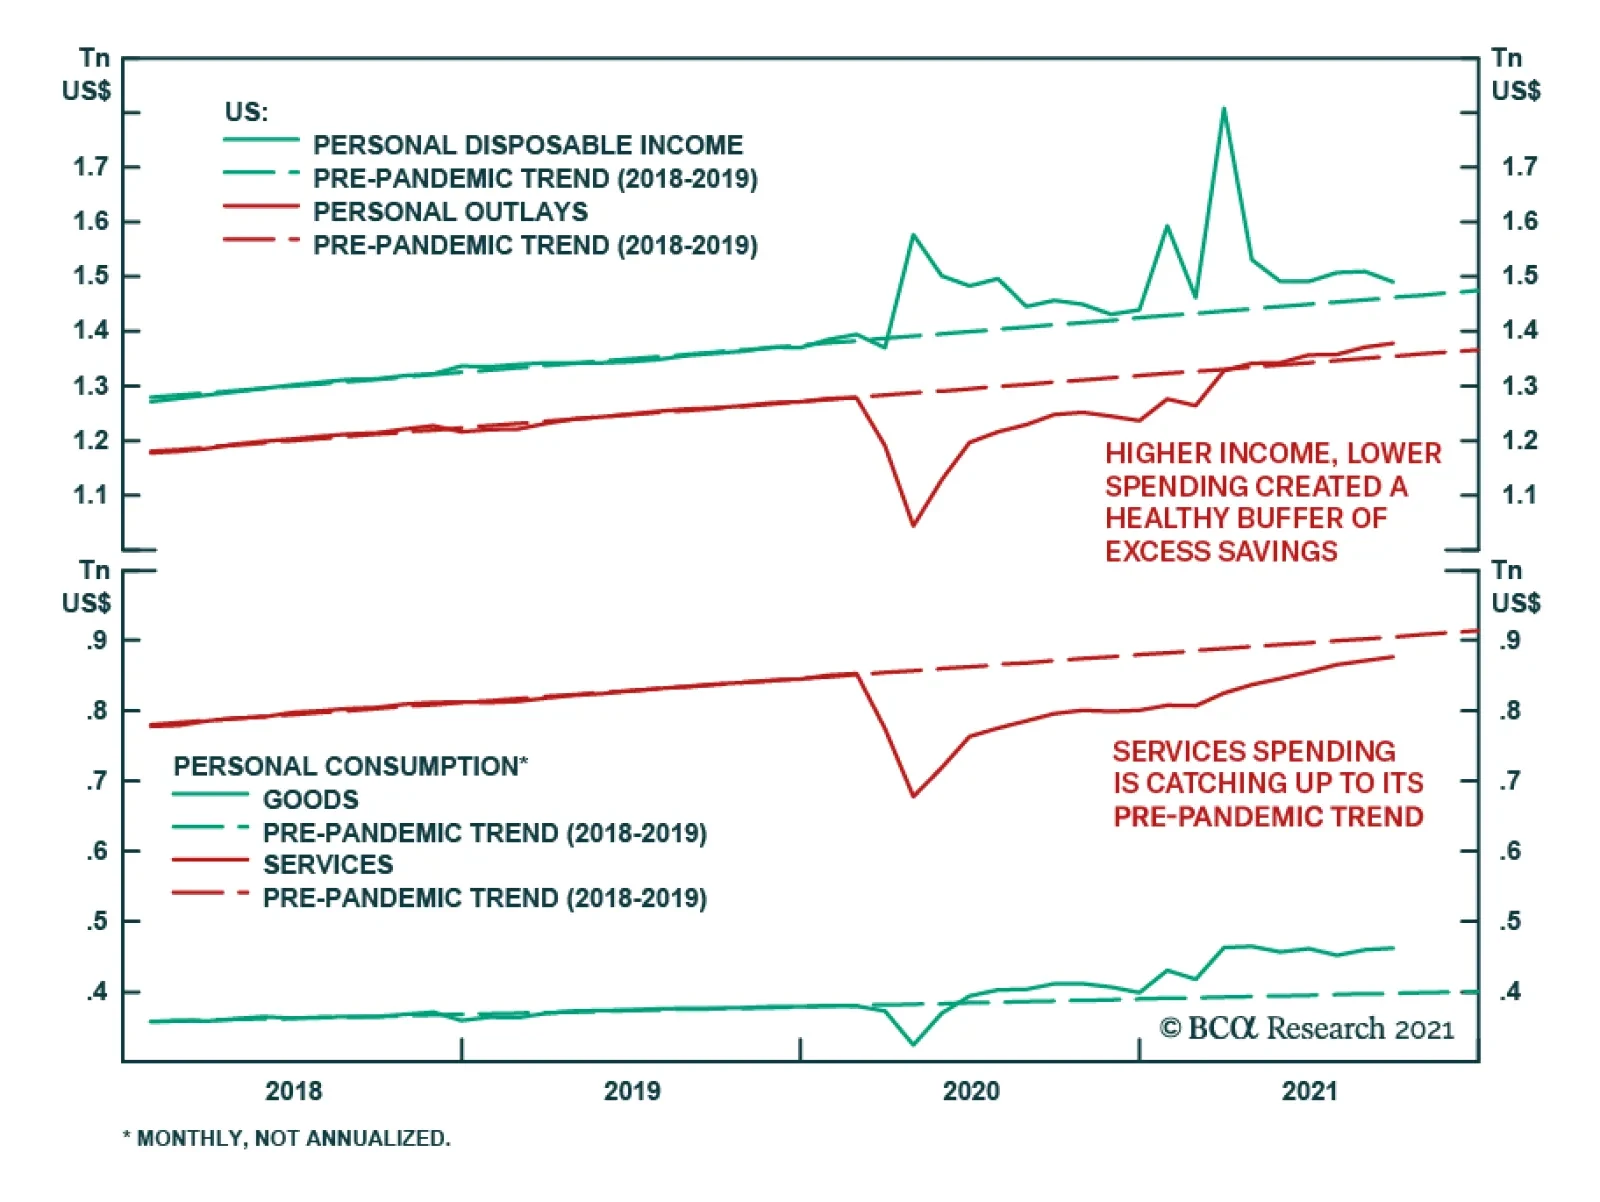
US Personal Spending rose 0.6% in September, in line with expectations and easing from August’s 1.0% increase. Goods as well as services spending both increased. However, among goods, spending on durable goods fell 0.2% m/m which was more than offset by the…
Overweight BCA house view is for the US yields moving higher, with Treasury 10-year yields reaching 1.7-1.9% by the year-end. Ever since the GFC, Financials and Banks equities relative performance has been tied to US yields, and these two sectors remain the most direct way to express a bearish bond bias within the US equity universe. Consistent with that, our S&P Financials and S&P Banks overweight calls are currently up 4% and 8% in relative to SPX terms, respectively, since the position inception. Two factors support further above benchmark allocation to the S&P Financials and the S&P Banks indexes. First, imminent tapering will propel yields higher. Second, the broader economic revival and the accompanying easing in lending conditions will ensure a healthy demand pipeline for the US banks’ loans. Bank of America’s CEO, Brian Moynihan confirmed our view in his most recent earnings call citing that: “Deposit growth was strong and loan balances increased for the second consecutive quarter, leading to an improvement in net interest income even as interest rates remained low.” Bottom Line: We continue to recommend an above benchmark allocation in the S&P financials and the S&P banks indexes.
An Update On Financials
An Update On Financials