United States

Who Likes A Flattening Yield Curve?
Who Likes A Flattening Yield Curve?
In a recent daily report, we analyzed relative performance of the S&P 500 sectors and styles under different US 10-year Treasury yield (UST10Y) regimes. Today we expand our analysis and map relative performance of the S&P 500 sectors and styles under the distinct US Treasury yield curve regimes, defined as a three-months change between 10-year and 2-year yields. To analyze sector and style performance by regime, we calculate contemporaneous three-months relative returns of sectors and styles. To summarize the results, we calculate median relative return of each sector/style in each regime. We subtract total period median to remove the sector and style biases in the long-term performance. In a flattening yield curve environment, Defensives, Quality, and Growth tend to outperform, as it indicates scarcity of growth. Accordingly, Real Estate, Technology, Utilities, and Communications Services also outperform. Yield curve steepening is usually associated with growth acceleration. This regime gives boost to more economically sensitive and capex intensive sectors and styles: Value, Small caps, and Cyclicals. Bottom Line: The shape of the US Treasury yield curve will be an important variable to monitor going forward, as it has a substantial effect on relative sector and style performance.
Highlights Energy Prices & Bond Yields: Surging energy prices are lifting inflation expectations in the US and Europe, while at the same time dampening consumer confidence amid diminished perceptions of real purchasing power. These conflicting trends are putting central banks in a tricky spot in the near-term, but tightening labor markets will force a more enduring need for dialing back global monetary accommodation in 2022, led by the Fed and the Bank of England. Stay below-benchmark on global duration exposure, favoring euro area government debt over US Treasuries and UK Gilts. High-Yield: Trans-Atlantic junk bond performance has diverged of late, with euro area spreads widening versus the US. This is a temporary distortion created by the pop in oil prices, with the Energy sector that benefits from higher oil prices representing a far greater share of the high-yield universe in the US compared to Europe. Maintain an overweight stance on European high-yield corporates. Feature Chart of the WeekGlobal Bond Yield Breakout?
Global Bond Yield Breakout?
Global Bond Yield Breakout?
It is not easy being an inflation-targeting central bank these days. Soaring energy prices, with the Brent crude benchmark price climbing to a 3-year high of $86/bbl last week and natural gas prices up nearly four-fold year-to-date in Europe. These moves are adding upward pressure to inflation rates already elevated because of disrupted supply chains and rising labor costs. Government bond yields in the developed markets are moving higher in response, driven by rising inflation breakevens and increasing central bank hawkishness that is causing a stir in negative real yields (Chart of the Week). Among the three most important developed economy central banks - the Fed, the ECB and the Bank of England (BoE) – the most forceful signaling of a need for tighter policy is surprisingly coming from Threadneedle Street in London, home to one of the most dovish central banks since the 2008 crisis. Numerous BoE officials, including Governor Andrew Bailey, have strongly hinted that UK rate hikes could begin as soon as next month’s policy meeting. Fed officials have suggested a similar timetable for the start of the QE taper. By contrast, members of the ECB Governing Council have paid lip service to the recent sharp pickup in euro area inflation but, for the most part, have stuck to the view that it will not last long enough to justify a policy response. The relative hawkishness among “The Big Three” central banks fits with our current recommended strategy on global duration exposure, staying below-benchmark, and country allocation, with the largest underweights to US Treasuries and UK Gilts. Should Central Banks Focus More On Inflation Or Growth? Monetary policymakers are in a difficult spot at the moment. Rising energy prices have breathed new life into inflation, and inflation expectations, even as global growth momentum has cooled off somewhat. Given the magnitude and breadth of the global energy price surge – even coal prices in China have shot up 120% since late August - it will be difficult for central bankers to “see through” the inflationary implications and worry more about growth (Chart 2). Rising energy prices are likely to extend the current global inflation upturn that has already gone on for longer than expected because of supply-chain disruptions. This raises the risk that consumers could turn more cautious on spending behavior if they have to devote more of their incomes just to fuel their cars or heat their homes. In the US, this dynamic already appears to be playing out. The acceleration of inflation has broadened out, with the Cleveland Fed’s trimmed mean CPI inflation measure (which removes the most volatile components of the CPI) rising to 3.5% in September (Chart 3, top panel). With US consumers seeing higher prices on a wider range of goods and services, they have raised their inflation expectations. The preliminary October University of Michigan US consumer confidence survey showed that 1-year-ahead inflation expectations rose to a 13-year high of 4.8% (middle panel). Chart 2Pouring Gas On Global Inflation
Pouring Gas On Global Inflation
Pouring Gas On Global Inflation
The New York Fed’s consumer survey showed a similar 1-year-ahead inflation forecast (5.3%), which is well above the forecast for income growth in 2022 (2.9%). Combining those two measures shows that US consumers implicitly see a contraction in their real incomes over the next 12 months. Chart 3US Consumers Expect A Sharp Decline In Real Purchasing Power
US Consumers Expect A Sharp Decline In Real Purchasing Power
US Consumers Expect A Sharp Decline In Real Purchasing Power
This has likely played a big role in the sharp fall in the University of Michigan consumer confidence index since the peak back in June (bottom panel), despite favorable US labor market conditions. US consumer perceptions of inflation appear much greater than the reality of inflation evident in the official price indices. The New York Fed survey also asks US consumers what their 1-year-ahead expectations are for major spending categories, like food or rent (Chart 4). Consumers expect somewhat slower inflation for food (7.0%) and gasoline (5.9%) over the next year, yet they also expect much higher medical care costs (9.4%) and rent (9.7%). For the latter two, those are considerably higher than the latest actual inflation rates seen in the US CPI (2.4% for rent, 0.4% for medical care) or PCE deflator (2.1% for rent, 2.4% for medical care). Taking these survey results at face value, it is likely that US consumers are overestimating how much their real incomes will suffer next year from higher inflation. This is especially true as US household income growth will likely surpass the 2.9% estimate seen in the New York Fed survey. Yet that does not preclude the Fed from starting to turn more hawkish. Central bankers are always on the lookout for signs that higher realized inflation is feeding through into rising inflation expectations, which could require a policy tightening response to prevent an overshoot of inflation targets. The Fed has given itself a bit more leeway in that regard by altering their policy framework to allow temporary deviations of inflation from the central bank targets. The BoE, however, has not given itself the same sort of flexibility, which is why it is now signaling an imminent rate hike in response to survey-based inflation expectations, and breakeven inflation rates on longer-dated index-linked Gilts, climbing to close to 4% (Chart 5). Yet even the Fed, with its Average Inflation Targeting framework, has signaled that a tapering of its bond purchases will likely begin by year-end. Chart 4US Consumer Inflation Expectations Well Above Actual Inflation
US Consumer Inflation Expectations Well Above Actual Inflation
US Consumer Inflation Expectations Well Above Actual Inflation
Markets are looking at the persistence of high inflation and have priced in a more hawkish trajectory for interest rates in the US, UK and even Europe over the next 12-24 months (Chart 6, bottom panel). Chart 5Inflation Weighing On UK & European Consumer Confidence
Inflation Weighing On UK & European Consumer Confidence
Inflation Weighing On UK & European Consumer Confidence
Real bond yields in those regions are also starting to move higher in response to rising rate expectations (third panel) - a bond-bearish dynamic that we have discussed at length in recent reports.1 Between those three, the BoE’s hawkish turn has hammered the Gilt market the hardest. Yet there has definitely been a spillover into rate expectations and bond yields in other countries on the back of the BoE guidance. We have already seen rate hikes from smaller developed market central banks, Norway and New Zealand, over the past month. If a major central bank like the BoE soon follows suit because of overshooting inflation expectations, then markets are justified in thinking that the Fed or even the ECB could be next. Of those “Big 3” central banks, we see the ECB as being the least likely to respond to the current inflation upturn with rate hikes in 2022. There is simply not enough evidence suggesting that the energy/supply-chain driven inflation in the euro area is broadening out into other parts of the economy on a sustainable basis. Furthermore, there is already some degree of monetary tightening “scheduled” in 2022 when the ECB’s pandemic bond purchase program expires in March. The ECB will not want to compound that by moving into rate hiking mode soon after. On the other hand, the Fed will likely see enough further tightening of US labor market conditions to begin hiking rates in the fourth quarter of 2022 (Chart 7). In the UK, After next month’s likely rate hike, the BoE will need to deliver at least another 50-75bps of additional hikes in 2022 and likely more in 2023 with real policy rates already well below neutral before the latest spike in energy prices. Chart 6Expect Higher Real Yields As Central Banks Turn More Hawkish
Expect Higher Real Yields As Central Banks Turn More Hawkish
Expect Higher Real Yields As Central Banks Turn More Hawkish
Chart 7Labor Markets, Not Commodities, Will Dictate Monetary Policy In 2022
Labor Markets, Not Commodities, Will Dictate Monetary Policy In 2022
Labor Markets, Not Commodities, Will Dictate Monetary Policy In 2022
With the Fed and BoE set to be far more hawkish than the ECB next year, we see greater risks of government bond yields rising faster, and higher than current forward rates, in the US and UK compared to the euro area (Chart 8). This justifies an overall cautious strategic stance on duration exposure in global bond portfolios. With regards to inflation-linked bonds, however, we recommend only a neutral overall stance. Elevated inflation breakevens have converged to, or even above, central bank inflation targets in all developed market economies (excluding Japan). 10-year UK breakevens, in particular, look very expensive on our fair value model (Chart 9). Chart 8Our Recommended "Big 3" Country Allocations
Our Recommended 'Big 3' Country Allocations
Our Recommended 'Big 3' Country Allocations
Chart 9Maintain An Overall Neutral Stance On Inflation-Linked Bonds
Maintain An Overall Neutral Stance On Inflation-Linked Bonds
Maintain An Overall Neutral Stance On Inflation-Linked Bonds
Bottom Line: Our view on the policy decisions of the Big 3 central banks in 2022 informs our strategic (6-18 months) investment strategy within those markets. Stay below-benchmark on overall global duration exposure, favoring euro area government debt over US Treasuries and UK Gilts. Fade The Recent Backup In European High Yield Spreads Chart 10A Slight Pickup In European Junk Spreads
A Slight Pickup In European Junk Spreads
A Slight Pickup In European Junk Spreads
Corporate credit markets in the US and Europe have calmed down since the July/August “Delta fueled” selloff with one notable exception – European high-yield (HY). The Bloomberg European HY index spread now sits 39bps above the September low, noticeably diverging from the US HY index spread (Chart 10). We view those wider spreads as a tactical buying opportunity for European junk bonds, both in absolute terms and versus US junk bonds. The recent underperformance appears rooted in soaring European energy prices. The spread widening has been concentrated in European consumer sectors (both cyclicals and non-cyclicals) that would be more exposed to the drain on real incomes from booming natural gas prices. Energy is also a smaller part of the European high-yield index (2%) compared to the US HY index (13%), which helps explain the performance gap with the US – the US index is more exposed to companies that benefit from higher energy prices (Chart 11). Chart 11Sectoral Breakdown Of US & Euro Area High-Yield Indices
Central Banks Backed Into A Corner
Central Banks Backed Into A Corner
Over a more medium-term perspective, there is little reason why there should be a meaningful performance difference between US and European HY. The path of spreads and excess returns (versus duration-matched government debt) for the two markets have been highly correlated in recent years (Chart 12). When adjusting European HY returns to allow a proper apples-to-apples comparison to US HY – by hedging European returns into US dollars and controlling for duration differences between the two markets – there has been little sustained difference in returns dating back to 2018. Chart 12Euro Area HY Has Closed The Gap Vs. The US
Euro Area HY Has Closed The Gap Vs. The US
Euro Area HY Has Closed The Gap Vs. The US
Chart 13Junk Default Rates Will Stay Low In 2022
Central Banks Backed Into A Corner
Central Banks Backed Into A Corner
More fundamentally, there is little difference in default rates that would justify a major divergence of HY spreads on both sides of the Atlantic. Moody’s is forecasting a HY default rate for a rate of 2% in both the US and Europe for 2022 (Chart 13). Such similar default rate expectations make sense with economic growth likely to remain well above trend in 2022 in both the US and Europe. Higher inflation will also boost nominal GDP growth, helping lift corporate revenues and the ability to service debt. From a valuation perspective, there is also little to choose from between European and US HY: The default-adjusted spread, which takes the current HY index spread and subtracts expected default losses over the next twelve months, is 196bps in Europe and 166bps in the US (Chart 14). While those spreads are below the post-2000 mean in both markets, they are still above past valuation extremes. The percentile ranking of 12-month breakeven spreads (the amount of spread widening over one year that would eliminate the yield advantage of HY over duration-matched government bonds) are also similar, 25% for European HY and 26% for US HY (Chart 15). These suggest HY spreads are not particularly “cheap”, from a historical perspective, in either market, but they could move lower to reach previous historical extremes. Chart 14Low Expected Default Losses Supporting HY Valuations
Low Expected Default Losses Supporting HY Valuations
Low Expected Default Losses Supporting HY Valuations
Chart 15Overall HY Spreads Are Tight In The US & Europe
Overall HY Spreads Are Tight In The US & Europe
Overall HY Spreads Are Tight In The US & Europe
Chart 16Euro Area Ba-Rated HY Spreads Look More Attractive
Central Banks Backed Into A Corner
Central Banks Backed Into A Corner
Summing it all up, there is no discernable reason why European HY should trade at a sustainably wider spread to US HY, outside of the compositional issue related to the weight of the Energy sector in both markets. When breaking down the two markets by credit rating buckets, European Ba-rated corporates even look more attractive versus similarly-rated US corporates, based on 12-month breakeven spread percentile rankings (Chart 16). Bottom Line: Maintain a strategic overweight stance on European high-yield corporates, and tactically position for some relatively better performance of European junk bonds versus US equivalents. Robert Robis, CFA Chief Fixed Income Strategist rrobis@bcaresearch.com Footnotes 1 Please see BCA Research Global Fixed Income Strategy Report, "What If Higher Inflation Is Not Transitory?", dated September 23, 2021, available at gfis.bcaresearch.com. Recommendations Duration Regional Allocation Spread Product Tactical Trades GFIS Model Bond Portfolio Recommended Positioning Active Duration Contribution: GFIS Recommended Portfolio Vs. Custom Performance Benchmark
Central Banks Backed Into A Corner
Central Banks Backed Into A Corner
The GFIS Recommended Portfolio Vs. The Custom Benchmark Index
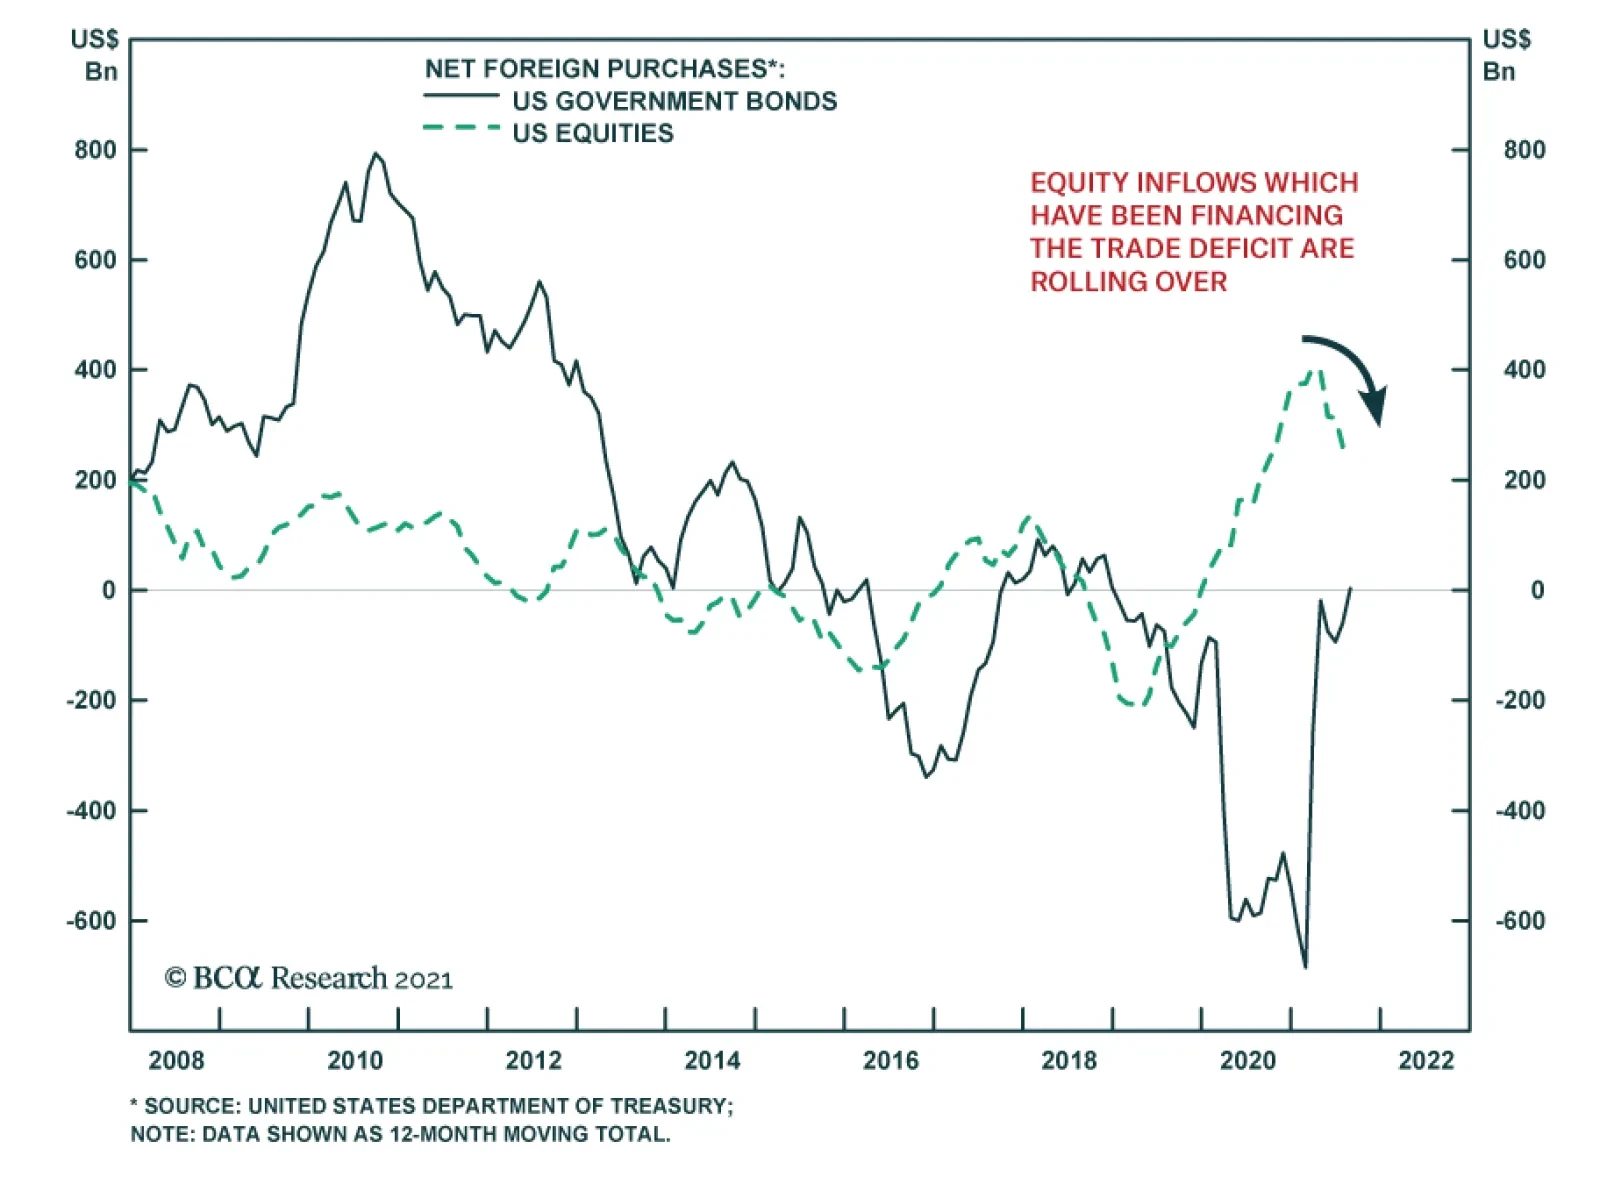
Last year, foreign purchases of US equities helped finance the US’s widening trade deficit. However, these net equity inflows have been on a downtrend since early this year. The latest TIC data reveals that net inflows into US equities stood at minus $0.14 bn…
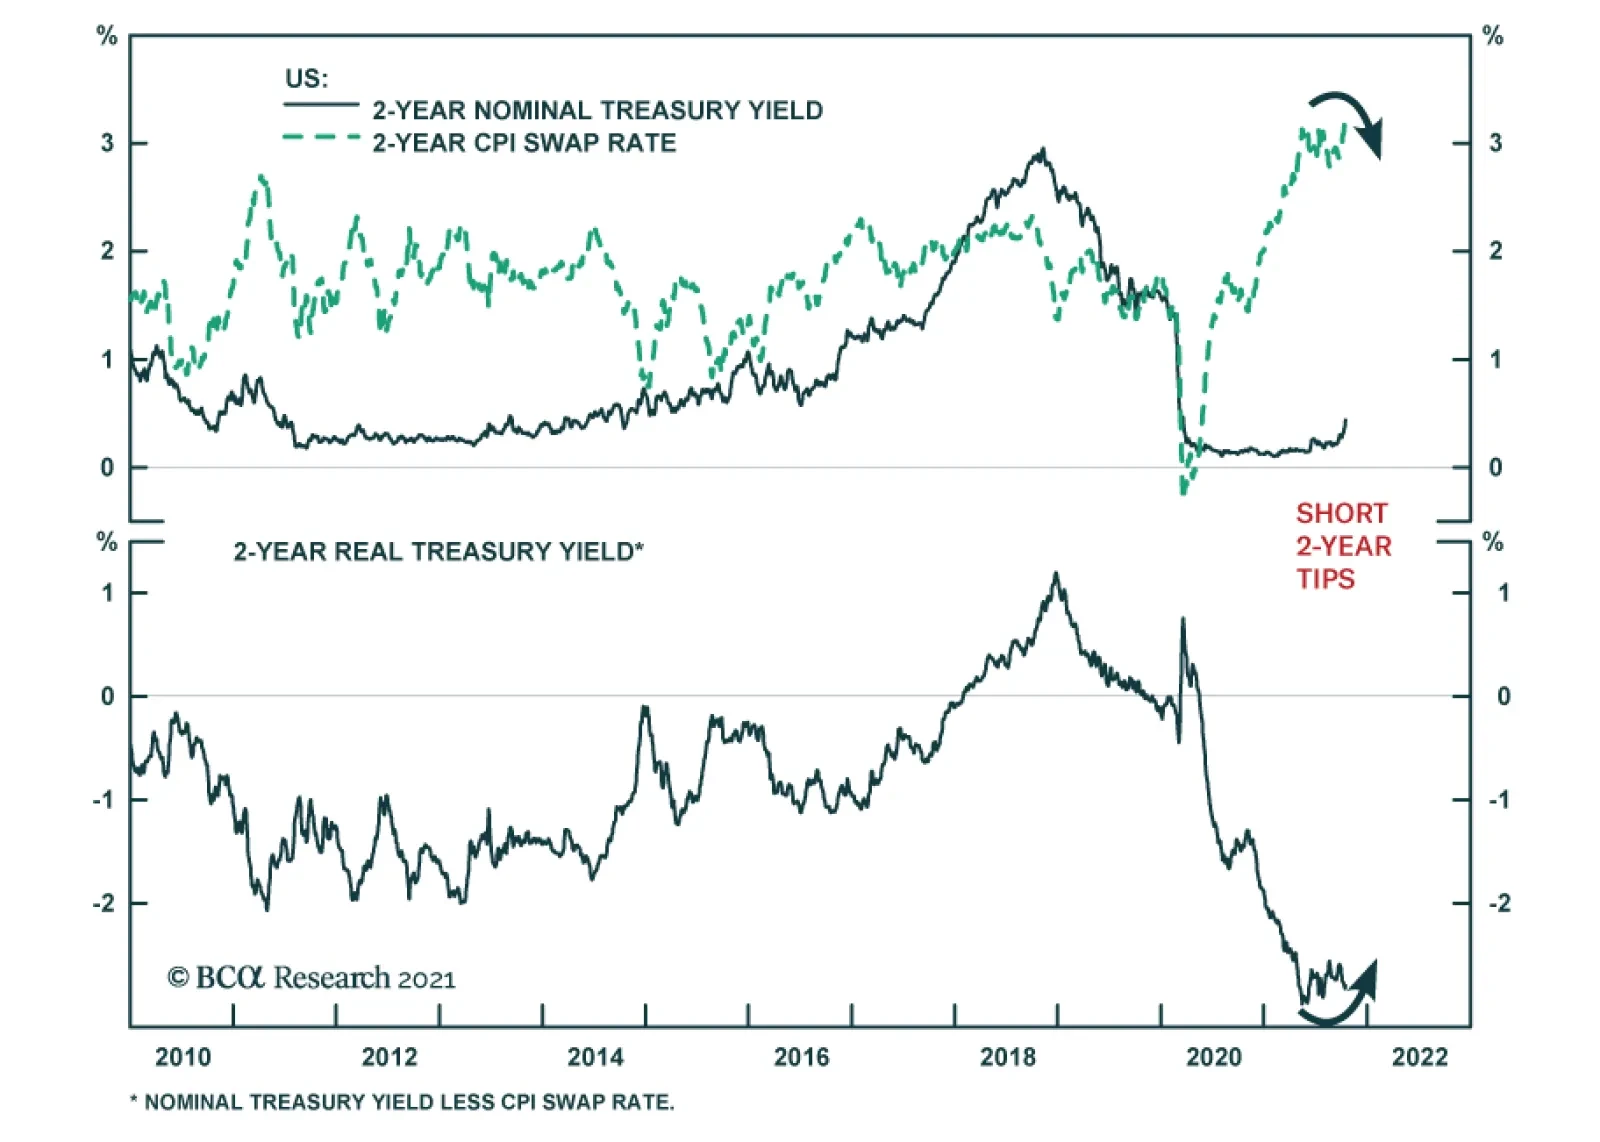
BCA Research’s US Bond Strategy service concludes that investors should position for higher short-maturity real yields. The market’s near-term rate expectations have risen considerably during the past few weeks. While our colleagues think that pricing looks…
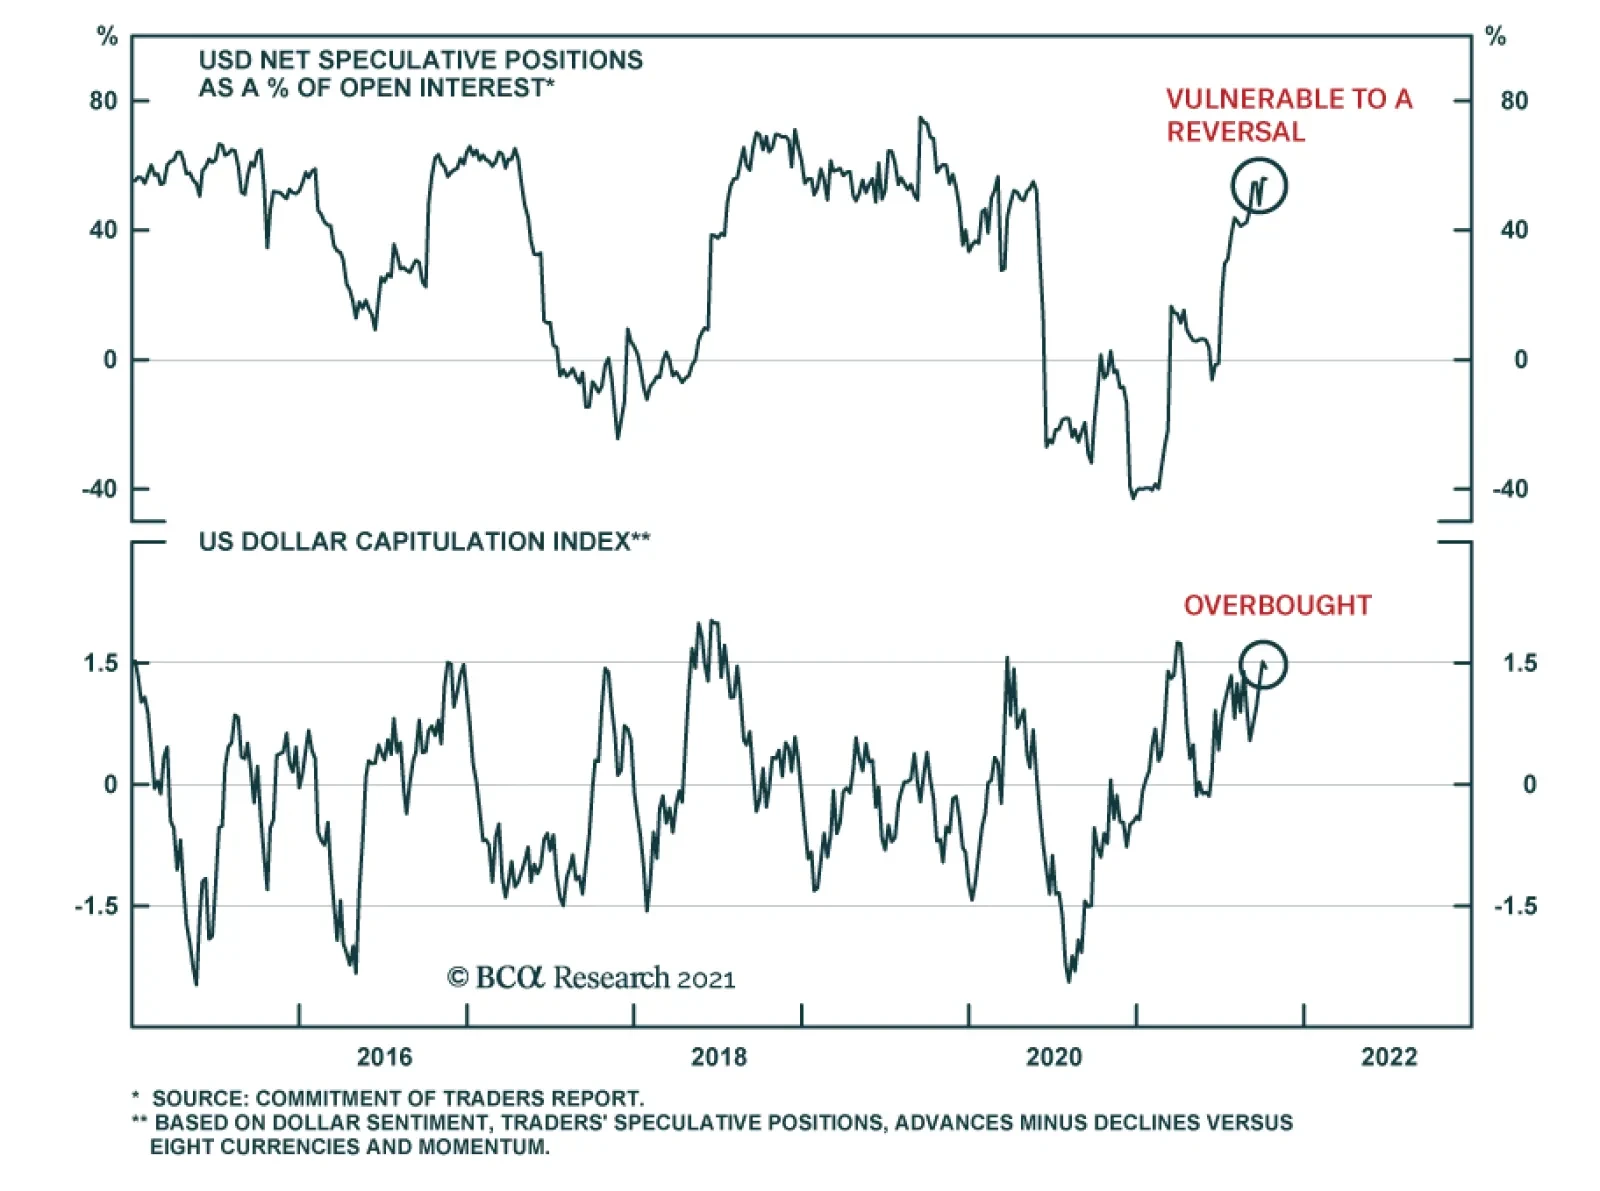
Our foreign exchange strategists have held the view that the DXY will fail to break above the 94-95 level and will ultimately move lower over a cyclical investment horizon. Last week the DXY hit a 13-month high of 94.5 but failed to break above this…
Highlights Duration: We recommend that investors run below-benchmark portfolio duration in US bond portfolios on the expectation that the Treasury curve will bear-flatten between now and Fed liftoff in December 2022. Nominal Treasury Curve: We recommend positioning for curve flattening by going short the 5-year Treasury note versus a duration-matched barbell consisting of the 2-year and 10-year notes. TIPS: Investors should position for higher short-maturity real yields. This can be done through an outright short position in 2-year TIPS, an inflation curve steepener or a real yield curve flattener. The Long And Short Of It Chart 1Short-End Joins The Selloff
Short-End Joins The Selloff
Short-End Joins The Selloff
It’s still a bit early for a 2021 retrospective, but unless something dramatic happens during the next 2 ½ months it’s likely that the year will go into the books as a bad one for US bonds. Looking back, we can identify three phases of bond market performance in 2021. First, a selloff in long-dated bonds early in the year driven by economic re-opening and fiscal stimulus. Second, a partial reversal of this long-end selloff that lasted through the spring and early summer. Finally, a renewed selloff involving both the long and short ends of the yield curve (Chart 1). The Long End Looking first at the long end of the curve, we don’t see any immediate signs that yields have risen too far. Estimates of the 10-year term premium created by taking the difference between the spot 10-year Treasury yield and survey estimates of the future 10-year average fed funds rate show that the term premium is not as elevated as it was when yields peaked last March or when they peaked in 2018 (Chart 2). The 25-delta risk reversal on 30-year Treasury futures – a technical indicator with a strong track record of calling turning points in the 30-year yield – also remains below the 1.5 level that has historically signaled a peak in the 30-year yield (Chart 3). Table 1 shows that while it is rare for the risk reversal to rise above 1.5, such a move usually indicates that yields have risen too far, too fast Chart 210-Year Term Premium Still Low
10-Year Term Premium Still Low
10-Year Term Premium Still Low
Chart 3Technicals Not Stretched
Technicals Not Stretched
Technicals Not Stretched
Table 1Track Record Of Risk Reversal Indicator
Right Price, Wrong Reason
Right Price, Wrong Reason
Finally, we look at the 5-year/5-year forward Treasury yield relative to a range of survey estimates of the long-run neutral fed funds rate (Chart 4). At 2.09%, the 5-year/5-year yield is close to median survey estimates of the long-run neutral fed funds rate.1 We take this to mean that the 5y5y yield has limited upside. Further increases in yields will take the form of the rest of the curve catching up to the 5y5y. Put differently, further increases in yields are more likely to coincide with curve flattening, not steepening.2 Chart 45y5y Is At Its Fair Value
5y5y Is At Its Fair Value
5y5y Is At Its Fair Value
The Short End While long-maturity bond yields have moved up during the past few months, it is the breakout in short-maturity Treasury yields that has been the most notable feature of the recent bond selloff (Chart 1, bottom panel). In particular, near-term interest rate expectations have adjusted sharply higher since the September FOMC meeting (Chart 5). Prior to the September FOMC meeting, the overnight index swap (OIS) market was priced for Fed liftoff in February 2023 and for a total of 80 bps of rate hikes by the end of 2023. Now, the OIS curve is priced for Fed liftoff in September 2022 and for a total of 113 bps of rate hikes by the end of 2023. Chart 5Fed Funds Rate Expectations
Fed Funds Rate Expectations
Fed Funds Rate Expectations
We continue to view the December 2022 FOMC meeting as the most likely date for the first rate hike. We also think it’s reasonable to expect the Fed to lift rates at a pace of 75-100 bps per year once tightening begins. In other words, we view fair pricing at the front-end of the curve as consistent with liftoff in December 2022 and a total of 100-125 bps of rate hikes by the end of 2023. The recent selloff has made front-end pricing more consistent with our assessment of fair value. Therefore, we don’t see any huge opportunities for directional bets on short-dated nominal yields. That said, we also contend that the bond market has arrived at the correct conclusion about the near-term pace of Fed tightening, but for the wrong reason. As is discussed in the next section of this report (see section titled “Massive Upside In Short-Maturity Real Yields”), this presents some attractive opportunities to trade short-maturity real yields and short-maturity inflation breakevens. One other observation from Chart 5 is that the market’s expected pace of Fed tightening flattens off considerably in 2024 and beyond. The market is priced for a mere 34 bps of tightening in 2024 and 2025 and the fed funds rate is still expected to be below 1.6% by the end of 2025. This highlights that, while pricing at the front-end of the yield curve looks reasonable, yields with slightly longer maturities remain too low. Bottom Line: We recommend that investors run below-benchmark portfolio duration in US bond portfolios on the expectation that the Treasury curve will bear-flatten between now and Fed liftoff in December 2022. We recommend positioning for curve flattening by going short the 5-year Treasury note versus a duration-matched barbell consisting of the 2-year and 10-year notes. Massive Upside In Short-Maturity Real Yields Table 2Yield Changes Since September FOMC (BPs)
Right Price, Wrong Reason
Right Price, Wrong Reason
The prior section noted that the market’s near-term rate expectations have risen considerably during the past few weeks. While we think that pricing looks reasonable compared to our own monetary policy expectations, we alluded to the idea that the market has brought forward its rate hike expectations for the wrong reason. Table 2 illustrates what we mean. Practically all the increase in nominal Treasury yields since the September FOMC meeting has been driven by a rising cost of inflation compensation. Real yields, on the other hand, have either been relatively stable (for long maturities) or have fallen massively (at the short-end of the curve). In fact, the 2-year real yield has declined 34 bps since the September FOMC meeting even as the 2-year nominal yield has increased by 16 bps. What the stark divergence between real yields and the cost of inflation compensation tells us is that the market is concerned that inflation may not fall as much as was previously assumed and the Fed may be forced to tighten more quickly in response. First off, we think concerns about persistently high inflation are a tad overblown. It’s certainly true that 12-month headline and core CPI inflation remain extremely high, at 5.4% and 4.0% respectively, but 3-month rates of change have moderated during the past few months and the 12-month figures will soon follow suit (Chart 6). Second, even if inflation is slow to moderate, the composition of what is driving that high inflation has implications for how the Fed will respond. Specifically, if elevated inflation continues to be driven by extreme readings from a few sectors that have been inordinately impacted by the pandemic, the Fed will be inclined to write-off that inflation as “transitory” while it awaits more broad-based inflationary pressures driven by tight labor markets and accelerating wages. It continues to be worth noting that after stripping out COVID-impacted services and cars, core inflation remains well contained near levels consistent with the Fed’s target (Chart 7). Chart 6Inflation Is Falling
Inflation Is Falling
Inflation Is Falling
Chart 7Inflation Pressures Are Narrow
Inflation Pressures Are Narrow
Inflation Pressures Are Narrow
In a speech last week, Atlanta Fed President Raphael Bostic said that the Fed should use the word “episodic” instead of “transitory” to describe the nature of the current inflationary shock.3 The problem with the word “transitory” is that it is linked to a notion of time. It implies that inflation pressures are expected to fade quickly, but this is not the message that the Fed meant to convey with that word. Rather, in Bostic’s words, the Fed meant to convey that “these price changes are tied specifically to the presence of the pandemic and, once the pandemic is behind us, will eventually unwind, by themselves, without necessarily threatening longer-run price stability.” In other words, the Fed will not tighten policy to lean against narrow inflationary pressures driven by a few sectors that can easily be traced back to the pandemic. Rather, the Fed will only respond if inflationary pressures are sufficiently broad and/or if long-run inflation expectations become un-anchored to the upside. On the first point, there is some evidence that inflation pressures are broadening. As of September, 49% of the CPI index was growing at a 12-month rate above 3%, up from a 2021 low of 22% (Chart 8). However, long-run inflation expectations remain well-anchored near the Fed’s target levels (Chart 9). Chart 8CPI Breadth Indicator
CPI Breadth Indicator
CPI Breadth Indicator
Chart 9Long-Term Inflation Expectations
Long-Term Inflation Expectations
Long-Term Inflation Expectations
Our sense is that inflationary pressures will fade during the next 12 months as pandemic fears abate. Long-dated inflation expectations will remain close to current levels, but short-dated inflation expectations will fall. The Fed will start to lift rates in December 2022 as broad-based inflationary pressures emerge, but inflation will be only slightly above the Fed’s target by then. The best way to position for this outcome is to go short 2-year TIPS. The cost of 2-year inflation compensation will fall as inflation moderates during the next 12 months, but the nominal 2-year yield will rise modestly as we advance toward a Fed tightening cycle. These two factors will combine to drive the 2-year real yield sharply higher (Chart 10). If you prefer not to put on an outright short 2-year TIPS position, there are a few other ways to position for the same trend. First, investors could position for a steeper inflation curve. Chart 11 shows that the cost of short-maturity inflation compensation is much further above the Fed’s target level than the cost of long-maturity inflation compensation. Further, Table 3 shows that monthly changes in the cost of short-maturity inflation compensation are more sensitive to CPI than are changes in the long-maturity cost of inflation compensation. This means that the inflation curve will steepen during the next 12 months as inflation moderates and the short-term cost of inflation compensation falls. Chart 10Short 2-Year TIPS
Short 2-Year TIPS
Short 2-Year TIPS
Chart 11Position For Inflation Curve Steepening...
Position For Inflation Curve Steepening...
Position For Inflation Curve Steepening...
Table 3Regression of Monthly Changes In CPI Swap Rate Versus Monthly Changes In 12-Month Headline CPI Inflation (2010 - Present)
Right Price, Wrong Reason
Right Price, Wrong Reason
Second, you could also position for a flatter TIPS yield curve (Chart 12). The combination of inflation curve steepening and nominal curve flattening will lead to a supercharged flattening of the real yield curve during the next 12 months. Chart 12... And Real Yield Curve Flattening
... And Real Yield Curve Flattening
... And Real Yield Curve Flattening
Bottom Line: Investors should position for higher short-maturity real yields. This can be done through an outright short position in 2-year TIPS, an inflation curve steepener or a real yield curve flattener. Ryan Swift US Bond Strategist rswift@bcaresearch.com Footnotes 1 The median response from the New York Fed’s Survey of Market Participants pegs the long-run neutral fed funds rate at 2.0%. The same measure from the Survey of Primary Dealers sits at 2.25%. 2 For more details on the relationship between the proximity of the 5-year/5-year yield to its fair value range and the slope of the yield curve please see US Bond Strategy Weekly Report, “A Bump On The Road To Recovery”, dated July 27, 2021. 3 https://www.atlantafed.org/news/speeches/2021/10/12/bostic-the-current-inflation-episode.aspx Recommended Portfolio Specification Other Recommendations Treasury Index Returns Spread Product Returns
Highlights Economy – Everyone from banks to households to businesses is swimming in cash: The Fed’s asset purchases will continue until the middle of next year, but banks, households and businesses already have more cash than they know what to do with. Markets – The flood of liquidity may limit how much rates can rise: The biggest banks have positioned themselves to benefit from rising rates and they are all waiting for somewhat higher yields to begin deploying their excess reserves. Strategy – From the biggest banks’ perspective on the economy, risk assets look like the only place to be: Bank stocks’ relative outlook may be meh, but there’s an enormous amount of dry powder available to support economic activity, credit performance and financial asset prices. What The Banks See The SIFI banks (BAC, C, JPM and WFC) and USB got the third quarter earnings season off to a good start last week. The stock market wasn’t impressed – the stocks were mixed-to-weaker after reporting – but the big banks handily beat expectations. We think the market got it right, as they didn’t offer much of a reason to be excited about net interest income in the coming quarters, but we don’t study their results and their calls to assess the outlook for their own stocks. We do so to use the banks’ privileged vantage point to gain insight into the broad macro backdrop as revealed by the actions and intentions of households and businesses, borrower performance, lender willingness and the overall state of the financial system. They told a uniformly consistent story this quarter about copious liquidity, which is driving record low credit losses and fueling potent economic growth while continuing to weigh on consumer lending volumes. Difficulty replenishing inventories and a welcoming reception for debt and equity issues have been holding back business borrowing as well. The banks nonetheless saw some signs of life for loan demand in the last month of the quarter and they are optimistic about the consumption outlook. They are eager to lend their still growing hoard of deposits though they are unwilling to direct much of it to securities, preferring to wait for more appealing yields, which they expect are on the way. We heard plenty to affirm our constructive take on the economy through at least the end of next year. Households are spending at a rate that validates our time-release view of fiscal transfers and their incomes are rising enough to keep their checking account balances elevated even though the fiscal flows have largely ceased. Businesses remain flush and can be expected to restock depleted inventories once production and transportation logjams can be untangled. M&A activity is surging, underwriting calendars are full and trading desks have been very busy. When it comes to the banks themselves, the analyst community was focused on net interest income (NII). NII is a function of lending volumes, which will remain subdued in the near term even if they have begun to turn up, and lending margins. The latter can’t expand unless rates rise but the latest yield backup appears to have run its course with the 10-year Treasury yield easing ten basis points to 1.5% in just four sessions last week. An outward shift in the yield curve is what the banks need to outperform the S&P 500 over the rest of the year but their own opportunistic deployment of idle capital as rates rise may prove to be self-limiting. Households Are Spending (Chart 1) … Chart 1Snapback
Snapback
Snapback
[Bank of America consumer customers’ spending] was robust, … up 23% over 2019[.] September was the best month of the year and we’ve seen that spending rate continue through the first part of October. (Moynihan, BAC CEO) [C]ombined debit and credit [card] spend was up 24% versus the third quarter of 2019. Within that data, travel and entertainment spend was up 8% versus 3Q19 and very closely tracked the patterns of the Delta variant …, softening in August and early September, and reaccelerating in recent weeks. (Barnum, JPM CFO) Consumer credit card spending activity continued to increase, up 18% in the third quarter compared to 2019 and 24% compared to 2020. [T]ravel-related spending … remains the only category that has not yet fully rebounded to 2019 levels. (Scharf, WFC CEO) Sales volumes [in credit and debit cards] have been quite strong relative to 2019 and that’s driven by consumer spend. … [S]ales were about 5% higher than 2019 in merchant processing. … Looking at merchant as an example, airline, travel and entertainment are still down quite a bit and probably … flattened a bit in the third quarter, simply because of the Delta variant. But … as [Delta] kind of subsides a bit, we would expect that to start to accelerate again. (Dolan, USB CFO) … And Paying Their Bills, … Net charge-offs this quarter fell again to … 20 basis points of average loans[,] … the lowest loss rate in 50 years. … [The] continued low level of late-stage delinquency loans (Chart 2) … drives the expectation that card losses could decline yet again in Q4 before leveling off. (Donofrio, BAC CFO) [C]onsistent with last quarter, credit continues to be quite healthy. In fact, net charge-offs are the lowest we’ve experienced in recent history. (Barnum, JPM) Chart 2Net Charge-Off Rates May Not Have Bottomed Yet
The Big Bank Beige Book, October 2021
The Big Bank Beige Book, October 2021
[C]onsumer balance sheets remain unusually strong on the back of the increase in consumer net worth during the pandemic. (Fraser, C CEO) Consumers’ financial condition remains strong with leverage at its lowest level in 45 years and the debt burden below its long-term average. (Scharf, WFC) Consumer credit performance continued to improve with strong collateral values for homes and autos and consumer cash reserves remaining above pre-pandemic levels. Net [consumer] loan charge-offs declined to 23 basis points. (Santomassimo, WFC CFO) [O]ur net charge-off ratio hit a record low of 20 basis points. … [W]e expect it’s probably going to stay at these lower levels for a few quarters, and then it’s going to start to normalize. [It] probably doesn’t get back to what we would … define as normal, which is kind of 45 to 50 basis points overall, until at least the end of 2022 and probably sometime in 2023. (Dolan, USB) … But They Don’t Yet Need To Borrow (Chart 3) Chart 3US Households Have Built Up A Mountain Of Excess Savings ...
US Households Have Built Up A Mountain Of Excess Savings ...
US Households Have Built Up A Mountain Of Excess Savings ...
[C]hecking customers that had maybe $2,000 or $3,000 in balances with us, they’re sitting with three times what they had before the [pandemic] (Chart 4). … They will spend some of that, I assume, but interestingly enough [their balances have] been growing month-over-month for the last few months. [They’re] not going down even though the stimulus payments … other than childcare stopped. So one thing that bodes well for the economy … is consumer[s] still ha[ve] a lot of money in their accounts and they’re going to spend it. (Moynihan, BAC) Chart 4... And Most Of Them Are Sitting In Checking Accounts
... And Most Of Them Are Sitting In Checking Accounts
... And Most Of Them Are Sitting In Checking Accounts
[W]e expect deposit growth to continue, although it’s going to be likely at a slower rate than … so far this year. … You got to remember that … tapering is still QE. So the deposits are not likely to decline until many quarters after QE ends, if they ever do, because as the economy expands, the multiplier effect [could drive] growth in deposits, even though the money supply is coming down. (Donofrio, BAC) [W]hile the [credit card] payment rate is still very elevated, it’s come down from the highs and revolving balances have stabilized. And when we look inside our data, we see evidence of excess deposits starting to normalize in segments of the population that traditionally revolve. So … we’re optimistic about the growth prospects of revolving card balances. (Barnum, JPM) [W]e are encouraged by our household growth and balance sheet trends. However, we expect it to take some time for revolving credit card balances to return to pre-pandemic levels (Chart 5), given the amount of liquidity in the system. (Barnum, JPM) Chart 5A Direct Hit To Net Interest Margins
A Direct Hit To Net Interest Margins
A Direct Hit To Net Interest Margins
[H]ealthy consumer balance sheets and persistently elevated payment rates did mean that loan growth remained under pressure. (Fraser, C) [O]ur customers have significant liquidity, … [with] consumer median deposit balances … up 48% for customers who received federal stimulus and 40% for those who did not. (Scharf, WFC) While payment rates remain high, average [card] balances grew 3% from the second quarter, the first time [they’ve] grown since the fourth quarter of 2020. (Santomassimo, WFC) [W]e’re actually seeing ... credit card balances … start to grow and possibly accelerate as we get into 2022. When you think about customers that are kind of revolving type of customers, … with government stimulus starting to dissipate , … they are going to be looking to credit products … to support their [spending]. … [O]verall, we’re fairly bullish on consumer lending. (Cecere, USB CEO) Ditto Businesses [E]xcluding PPP loans, total … commercial loans grew [at an annualized rate of 11% on a quarter-over-quarter basis] …, but global banking utilization rates are still 700 basis points [below] 2019 [levels]. (Donofrio, BAC) C[ommercial]&I[ndustrial] loans were down 3% [quarter-on-quarter], but up 1% excluding PPP, driven by higher originations. … [C]onsistent with last quarter, we are seeing a slight uptick in utilization rates in middle market and those among larger corporates seem to have stabilized, albeit at historically low levels[,] … consistent with the theme … that the smaller you are and the less likely you are to have benefited from the wide-open capital markets, the more likely you are to be borrowing. We do hear a lot about supply-chain issues from that customer segment [though]. (Barnum, JPM) Corporate client sentiment remains very positive with healthy cash flows and liquidity driving M&A activity and deleveraging. (Fraser, C) Commercial banking loans were up slightly at the end of the third quarter, while line utilization was stable at historic lows. Supply chain difficulties and labor shortages continued to represent significant challenges for our client base. (Scharf, WFC) Commercial credit performance continued to improve and net loan charge-offs declined to 3 basis points. … The commercial real estate [CRE] portfolio has continued to perform well. The recovery in retail and hotel properties reflected increased liquidity and improved valuations. While we have not seen any widespread stress in office, we continue to watch this sector closely and believe that any impact … will take time to play out. (Santomassimo, WFC) [T]he principal challenge in [C&I] is that we continue to see a fair amount of payoffs[.] Where we are seeing nice areas of opportunity … is in asset-backed securitization type of lending [like] warehouse mortgage lines, [and] some supply chain financing activities. … [In the middle-market space,] we are seeing lots of [customer] confidence and relatively strong pipelines. (Cecere, USB) Banks Have Tons Of Dry Powder (Chart 6) And Want To Put It To Work (Chart 7) Chart 6All Dressed Up And Nowhere To Go
All Dressed Up And Nowhere To Go
All Dressed Up And Nowhere To Go
Chart 7Borrowers Wanted
Borrowers Wanted
Borrowers Wanted
[Lending] is a customer-driven business and so $900 billion-odd of loans against $2 trillion of deposits is largely driven by customer activity. The good news is you can see in [breakouts of lending by category] what I call the smile chart that the other half of the smile is coming up, meaning that customers are starting to draw on credit and use it and that will bode well for [them] growing their businesses and stuff[.] (Moynihan, BAC) [I]n CRE, we see quite a robust origination pipeline, as we’ve sort of fully removed any pandemic-related credit pullbacks and we’re leaning into that. (Barnum, JPM) [L]ine utilizations remained low and [commercial] loan demand continued to be impacted by low client inventory levels and strong client cash positions. However, there was some increase in demand late in the quarter and period-end balances increased … 1% from the second quarter. (Santomassimo, WFC) [W]e actually saw some growth [quarter-over-quarter] in CRE. The project level, pipelines, things like that are reasonably strong. As we kind of think about the next couple of quarters, though, what we are seeing in the marketplace is pretty strong competition. (Cecere, USB) All Together Now [W]e have a lot of excess liquidity right now, so there’s always an opportunity to deploy some of that in the future. (Donofrio, BAC) [A]t the highest level, … nothing has really changed, meaning we’re still happy to be patient [about deploying excess liquidity into securities.] (Dimon, JPM CEO) [W]e’ve got a lot of liquidity that’s available for us to invest as we see rates increase[.] (Mason, C CFO) As we think about redeployment, we’re still being pretty patient. … [W]e still think that there is more risk to the upside on rates than there is downside at this point. … [W]hen opportunities present themselves, we’ll take advantage of them, … but we’re going to be patient as we see how things develop over the coming months. (Santomassimo, WFC) [We expect] that rates are going to start moving up, at least on the long end, and so we’re trying to be patient and be in a position to be opportunistic when rates are in the right spot. (Dolan, USB) Investment Implications We remain constructive on markets and the economy over the next six to twelve months because of the fundamental support provided by consumers’ embarrassment of riches and our expectation that a meaningful portion of the money sloshing around the economy will bolster financial markets. In keeping with the theme of this Beige Book report, we let participants in last week’s earnings calls make the points in their own words: first, Bank of America CEO Brian Moynihan with the fundamental argument and then an analyst with an insightful question about supply and demand dynamics in the rates market. [The US economy] is led by the American consumer … [and] spending levels are growing at [a] 10% [rate]. That is a tremendous amount of spending that’s going on and it’s accelerating, even as the stimulus is in the rearview mirror by quite a [few] months. So as people get back to work [with] higher wages … , there’s just more money to spend. (Moynihan, BAC) [T]here’s a significant amount of liquidity on bank balance sheets that’s waiting to be put to work, and I’m wondering if that doesn’t put [something of a] cap on how much rates can rise. And then you’re going to have some decline in Treasury issuance because of a declining budget deficit. And then you’re still going to have QE through the first half of next year. So you’ve got a lot of demand for a shrinking supply on the Treasury side. That’s why I’m curious what sort of rate structure you’re anticipating going forward. (Charles Peabody, Portales Partners) Doug Peta, CFA Chief US Investment Strategist dougp@bcaresearch.com
The University of Michigan’s preliminary sentiment gauge declined unexpectedly in October. The headline index lost 1.4 points and settled at 71.4 – just above August’s decade low. Both current conditions and expectations deteriorated – a negative surprise to…
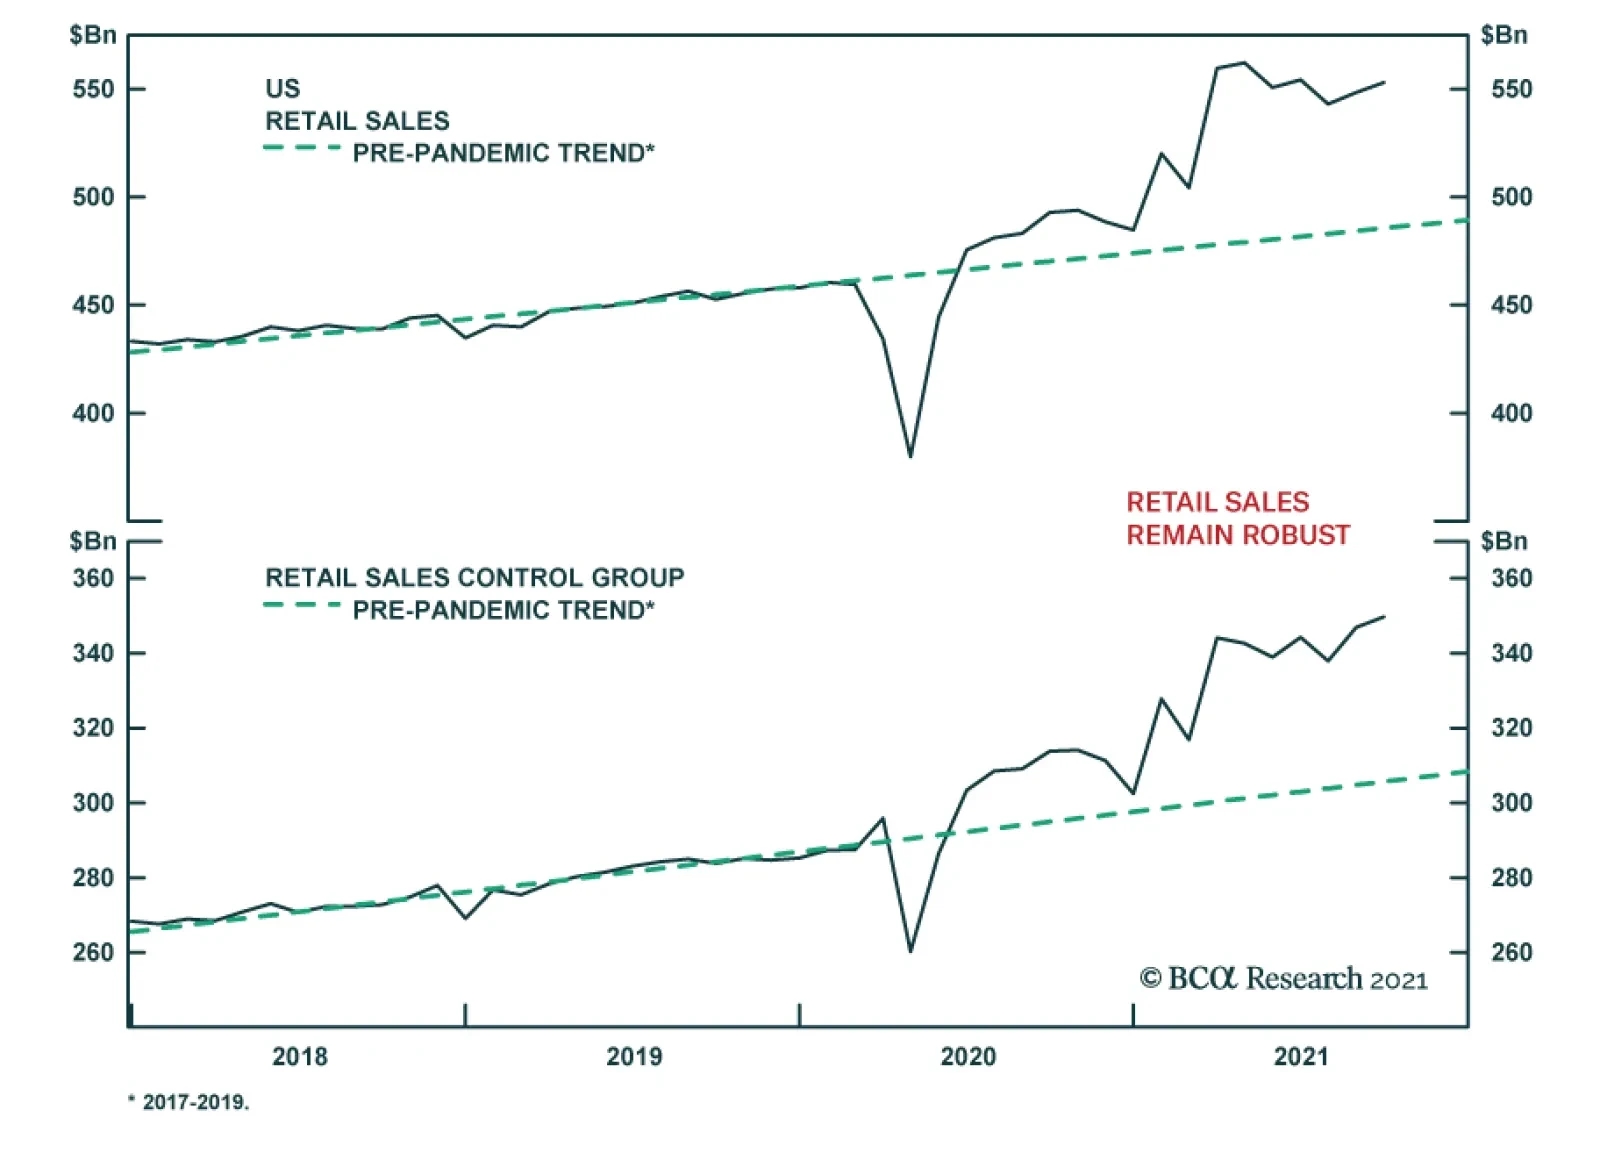
The US retail sales report for September suggests that US household spending remains robust. Aggregate retail sales increased 0.7% m/m – a positive surprise to expectations of a 0.2% m/m decline. Moreover, the August figure was revised up to 0.9% m/m from…
Recent Portfolio Moves
Recent Portfolio Moves
Next week we will be holding our quarterly webcast discussing the US equity market outlook. As a brief prologue to the webcast, the following Insight report provides a summary of our recent moves and views. In our latest Strategy Report we posited a cautious outlook for the US margins into the year end. While margins are likely to contract, we don’t expect a bear market in equities. Instead, equities are likely to print pedestrian single digit returns on the back of high valuations, and multiple expansion that “borrowed” returns from the future over the course of 2020. However, the TINA theme is still at play and excess liquidity will hold off a bear market. Even if top line S&P 500 returns remain paltry, money can still be made by granular sector selection and rotation (see chart). Specifically, we recently went overweight Small Caps at the expense of Large Caps as this asset class tends to outperform in a rising rates environment. Bottom Line: While S&P 500 returns are likely to remain in single digits over the coming months, there are plenty of opportunities on the sector level.