United States

Having worked as an economist for close to 50 years, the current strange and uncertain environment seems a good time to look back and consider some of the lessons I have learned. An additional reason for writing this rather personal report is that, after 34 exciting and interesting years, I will retire from BCA at the end of this month. Over the ages, there has been an insatiable demand for predictions – seeking those who are believed to have a window into the future, whether it be the Oracle of Delphi or the proverbial guru on the mountaintop. Surely, someone somewhere must know what is going to happen? Unfortunately, my almost half century in the forecasting business has highlighted that the future is essentially unknowable, and I have not come across anyone with a consistently good track record. Fortunately, all is not lost because forecasting errors can be minimized by following some basic rules and practices. Dealing With Shocks Chart 1My First Forecasting Shock
My First Forecasting Shock
My First Forecasting Shock
My career as an economist began in January 1973 when I joined the Forecasting Division within the Corporate Planning Department of British Petroleum in London. At the time, this seemed a strange move to friends who had entered the booming financial sector. The oil industry was regarded as incredibly dull with the crude price averaging $2.50 a barrel during the previous five years and no expectations of a major change in the foreseeable future (Chart 1). Of course, industry experts did not foresee the October 1973 war in the Middle East and OPEC’s resulting embargo of oil deliveries to the US. The crude price spiked above $15 a barrel in early 1974 and remained in double digits even after the embargo ended. This was my first lesson in the power of unforeseen shocks to destroy the basis of current forecasts and force a complete rethink of the outlook. A problem in dealing with major shocks is that some are transitory (e.g. natural disasters such as Japan’s devastating Fukushima earthquake) and some reflect a structural shift in the outlook. The oil shock was clearly in the latter category. OPEC suddenly became aware of its power to influence the market and from that time on, it took a more aggressive role in setting prices. At BP, long-run planning could not assume a return to pre-1974 prices and that was a game changer. In practice, most shocks are transitory, even if it is not evident at the time. And I believe that is true of the Covid-19 pandemic. Even if the virus cannot be eradicated, treatments will improve and we will learn to live with it, just as we live with the common cold and seasonal flu. There may be a lasting impact on some areas such as increased working from home, but I am skeptical that there will be any major change to the underlying drivers of economic growth. At most, it may encourage some trends that are already underway. However, the extreme policy response to the crisis will have some important effects and I will return to that later. Catching Structural Shifts Many economists spend much of their time making detailed economic forecasts for the coming one and two years. That may have great value in helping firms plan production schedules but is of limited value in helping investors time the market. As I have noted in previous reports, economists have done a poor job of forecasting recessions, which is the most important thing to get right from a planning point of view. Table 1 shows the recession forecasting record of the Federal Reserve, an institution that has tremendous economic brainpower and resources at its disposal. The Fed staff failed to predict any of the recessions in the past 50 years and other official and private sector forecasters were no better. Table 1Fed Economic Forecasts vs. Outcomes
Perspectives From A Long Career
Perspectives From A Long Career
BCA has wisely eschewed short-term economic forecasts. You would never read in a BCA publication a statement such as “we have revised next year’s GDP growth from 3.2% to 2.7%”. That does not mean we don’t care about the short-run economic outlook: we believe it is necessary to have a view about whether the consensus on economic trends is likely to be disappointed - either on the upside or downside. However, it is more important to focus on catching the long-term structural shifts in economic trends. Looking back over the past 50 years, the most important economic development for investors to get right was the rising inflation of the 1970s and its subsequent multi-decade decline. Any investors smart enough to be on the right side of the long-run inflation cycle would have avoided stocks and bonds and embraced commodities in the 1970s and done the reverse thereafter. While BCA’s track record was not perfect, it generally was on the right side of these trends. Another long-run trend that investors needed to identify was the surge in global trade and interdependence, beginning in the 1990s as former-communist countries and China embraced more market-friendly policies. This not only reinforced global disinflation but also shifted economic power from labor to capital, driving profit margins to record levels. Chart 2The Retreat From Globalization
The Retreat From Globalization
The Retreat From Globalization
Turning to the current environment, another structural shift is underway. Several years ago, we noted that the tide was turning against globalization. This showed up in a decline in cross-border capital flows, political and popular antipathy to large-scale immigration, and a flattening in the ratio of global trade to production (Chart 2). Recent developments have exacerbated these trends. Notably, the Covid-related disruptions to supply chains has forced a rethink about the wisdom of relying so heavily on foreign production facilities. The shift away from globalization is likely to persist for some time. This will support the case for a structural increase in inflation, a development underpinned by other forces. For example, the pendulum is swinging away from capital back to labor, central banks are setting themselves up to stay too easy for too long and crushing public sector debt burdens will make policymakers more willing to tolerate inflation overshoots. A structural increase in inflation (albeit nowhere near 1970’s levels) means that investors should expect a further decline in profit margins, higher interest rates and gains in inflation hedges. This will be a gradual shift with price pressures likely to moderate in the coming year as supply chain disruptions ease. Ignore Monetary Policy At Your Peril The level of interest rates is the single most important driver of asset prices which means that investors must pay close attention to central bank policy. During my career I have had a lot of contact with central bankers, not least because I was fortunate enough to attend the Federal Reserve’s Jackson Hole symposium for 18 years. Central bankers tend to be treated with great professional reverence. Every statement is examined for nuances about their views and there seems to be an implicit assumption that superior access to information and market intelligence gives them an edge when it comes to understanding economic trends and developments. Sadly, this is not the case. My many discussions with senior policymakers have made it abundantly clear that regarding the big questions about the outlook, they are no better placed than the rest of us. For example, like forecasters in general, they are struggling to know whether the recent rise in inflation is temporary, when supply chain disruptions will end and what will happen to resource prices. This is rather disconcerting as it would be desirable if those twiddling the policy dials were more informed than us outside observers. Chart 3Low Rates Underpin the Bull Market
Low Rates Underpin the Bull Market
Low Rates Underpin the Bull Market
Regardless of whether policymakers fully understand the long-run implications of their policies, the actions of central bankers have major market effects. One might reasonably have thought that the adverse economic impact of the pandemic would seriously damage the stock market, but the hit was short-lived with the MSCI All-Country Index currently 27% above its end-2019 level and close to its all-time high. This can be attributed to the fact that short-term interest rates in the major developed economies have been kept close to zero for more than a year (Chart 3). In 1852, the eminent financial journalist Walter Bagehot famously quipped that “John Bull can stand many things, but he can’t stand 2%”. In other words, a world of low interest rates is anathema to investors, forcing them to take greater risks in order to secure higher returns. What was true then remains true today. Low rates have driven investors into stocks as an explicit objective of central bank policy. Chart 4Inflation Undershoots For Two Decades
Inflation Undershoots For Two Decades
Inflation Undershoots For Two Decades
In the 1960s and 1970s, central bankers erred by keeping policy too easy for too long. Their formative years as policymakers were in the earlier decades when deflation was seen as a much bigger threat than inflation. This dulled their perception about the inflation risks of their policies. In contrast, the policymakers in charge during the 1980s to 2000s were fiercely anti-inflationary as they had experienced the inflationary consequences of their predecessors. Now the pendulum has swung back again because inflation has underperformed central bank expectations for the past 20 years, a period that also saw some severe deflationary shocks (Chart 4). In other words, the scene is setting up again for policy errors on the side of too much monetary stimulus and higher inflation. The high inflation of the 1970s was grim for financial assets with both equities and bonds delivering negative real returns. Bond investors underestimated the persistence and level of inflation which means they accepted ex-ante negative real yields. On the equity side, higher inflation did tremendous damage to corporate finances because of rising costs and the failure of companies to set aside enough for depreciation. Inflation accounting did not exist in those days and corporate restructuring had yet to occur. There is now much more awareness of inflation risks and accounting is better. Thus, inflation will be much less damaging to equities than before. However, we have returned to negative bond yields, largely as a result of policy-imposed financial repression rather than investor complacency. In other words, a new inflation cycle likely will be more damaging to bonds than stocks. What About Debt? On joining BCA, I had to learn about “The Debt Supercycle”, a term the company developed in the 1970s to describe the role of policy in feeding a seemingly never-ending cycle of increased leverage, resulting financial vulnerability and ever-desperate measures by policymakers to keep things afloat. This was well highlighted by the Fed’s response to the bursting of the tech bubble in the early 2000s when it kept interest rates at historically low rates even as the economy recovered. This helped create the conditions for the subsequent debt-driven housing bubble which led to an even greater policy response when that blew up in 2007-08. The essential message from BCA’s Debt Supercycle thesis is that investors should never underestimate the lengths to which policymakers will go to keep the economic/financial ship afloat. The Debt Supercycle primarily referred to the trend in private sector indebtedness in the US, although it applied to other countries. For example, in 2012, ECB President Mario Draghi noted that he was prepared “to do whatever it takes to preserve the euro”. Chart 5A Shift in the Debt Supercycle
A Shift in the Debt Supercycle
A Shift in the Debt Supercycle
To all intents, the financial crisis of 2007-09 effectively ended the private sector Debt Supercyle in the US. Despite keeping interest rates at extremely low levels, the Fed has been unable to trigger a new upturn to household sector leverage (Chart 5). Corporate debt burdens have risen, but largely for financial engineering purposes (equity buybacks and M&A) rather than capital spending. With the private sector no longer willing or able to go on another debt-fueled spending spree, the public sector has had to take its place. The past decade has witnessed an unprecedented peacetime increase in government deficits and debt. Inevitably, the surge in government debt has fueled bearish predictions of looming financial disaster. However, the same lessons apply regarding private sector excesses: the authorities will go to extreme lengths to prevent financial and economic chaos. The solution to excessive government debt is not to pursue even greater fiscal stimulus. Instead, the solution will be a mix of financial repression, higher inflation and eventually renewed fiscal discipline. That will not rule out periodic crises to force necessary policy actions, but investors should not assume that current high levels of government debt will inevitably lead to financial Armageddon. I apologize if that sounds complacent and I know that our long-standing client Mr. X would take a very different view. Who Is Mr. X? I have been asked countless times over the years whether Mr. X is a real person and, if so, who he is. I have always refused to answer this question, just as Coca Cola Inc. would never reveal the recipe for its drink. After all, it’s interesting to have a little mystery in an otherwise strait-laced business. What I can say is that our end-year conversations with Mr. X have proved invaluable in clarifying our thinking as we prepare our Annual Outlook report. It highlights the need to avoid groupthink and take account of a wide range of views. Mr. X is an interesting character in that he views the world through an Austrian School perspective. This means he favors free market solutions over aggressive policy interventions and has a healthy distrust of both politicians and central bankers. He does not like debt and fears inflation. All this has given him a bearish bias toward risk assets over the past few decades and it has been a perpetual struggle for us to convince him to adopt a more pro-growth investment strategy. That said, he was correctly more bearish than us in late 2007 and while we were not optimistic at that time, we should have paid more attention to his views. We recently held our annual discussion with Mr. X, along with his daughter Ms. X who joined his family office a couple of years ago. She does not share his Austrian School perspective and is much more inclined to take risks, given her hedge fund background. You will discover their latest thinking in our new Outlook report, due to be published next month. Timing The Markets The Bank Credit Analyst began publication in 1949 and it was years ahead of its time in understanding the role of money and credit in driving the economy and asset markets. Its founder, Hamilton Bolton, developed a series of monetary indicators that enabled him to make very prescient market calls and that is what put the company on the map. The focused monetary approach worked very well until the end of the 1970s because banks were the dominant financial intermediary, creating a relatively stable and predictable relationship between trends in money and the financial markets. It all changed with financial deregulation and innovation, beginning in the 1980s. BCA’s monetary indicators no longer worked so well, and we had to adopt a more comprehensive approach. Timing the markets is as much art as science but I would make the following observations: The stance of monetary policy remains the most important factor to consider, despite the less stable relationship between money flows and markets. Current negative real interest rates at a time when the economy is expanding are a powerful incentive to favor risk assets. Valuation is poor indicator of near-run trends. As Keynes famously noted “the stock market can stay irrational longer than you can remain solvent”. I learned that painful lesson in the late 1990s when I advocated caution in the Bank Credit Analyst yet the markets marched ever higher, until they finally broke in early 2000. Not a happy time! Yet, there is a well-established correlation between starting valuations and long-run returns so they cannot be completely ignored (Chart 6). Chart 6Valuation Matters for Long-Run Returns
Perspectives From A Long Career
Perspectives From A Long Career
Chart 7Technicals Still Positive For Stocks
Technicals Still Positive For Stocks
Technicals Still Positive For Stocks
Technical indicators can provide useful information around major turning points, although they are prone to false signals. Investor sentiment typically is at a bullish extreme at market tops and vice versa at bottoms. Also, I remember reading a large tome that reviewed every technical indicator known to man and it concluded that the most reliable one was the humble moving average crossover. Following a simple rule such as acting when the index crosses its 200-day average will keep you out of the market for the bulk of a bear phase and in for the bulk of a bull run. Of course, by definition, it will be a bit late and there will be many whipsaws. Currently, the stock market is above its rising 200-day average and investor sentiment is far from a bullish extreme (Chart 7). Don’t base your market expectations on consensus forecasts for the economy. The economy is a lagging not leading indicator of the markets. However, if your economic view is very different from the consensus, then that should impact your strategy. The bottom line is that there is no magic solution to consistently successful market timing. This explains why 86% of US active equity managers underperformed the benchmark index over the past 10 years, according to S&P Dow Jones data.1 At BCA, we follow a disciplined comprehensive approach that has served us well over the years, but inevitably we also suffer the occasional wobble. Concluding Thoughts Within BCA I have developed a reputation of being the resident bear and that does not bother me at all. It suits my Scottish temperament (probably weather-related), and anyway, I think it is more fun to be bearish. The language of the dark side is very rich and descriptive and it is not a surprise that bad news sells more newspapers than good news. To be bullish when there always are many problems around just makes one sound complacent and out-of-touch. Of course, it is important to get the markets right and I would never take a bearish view just to be different. In practice, I have generally been positive on risk assets, but that has not stopped me from pointing out the downside risks along the way. Perhaps, I have spent too much time talking to Mr. X! I have had much to be thankful for during my career. It has been a great privilege to interact with so many very smart and interesting people and a constantly changing economic and financial environment has kept me fully engaged. Whenever I was foolish enough to think I had things figured out, events taught me otherwise. I may be leaving BCA but will continue to follow economic and market developments with keen interest. Martin H. Barnes, Senior Vice President Chief Economist mbarnes@bcaresearch.com mhbarnes15@gmail.com Footnotes 1Detailed data on the performance of active managers are available at https://www.spglobal.com/spdji/en/research-insights/spiva/
BCA Research’s Global Fixed Income Strategy service initiated a new tactical trade to position for more persistent ECB dovishness and a more hawkish Fed. The team continues to see no reason for the ECB to follow the Fed’s path towards imminent tapering and…
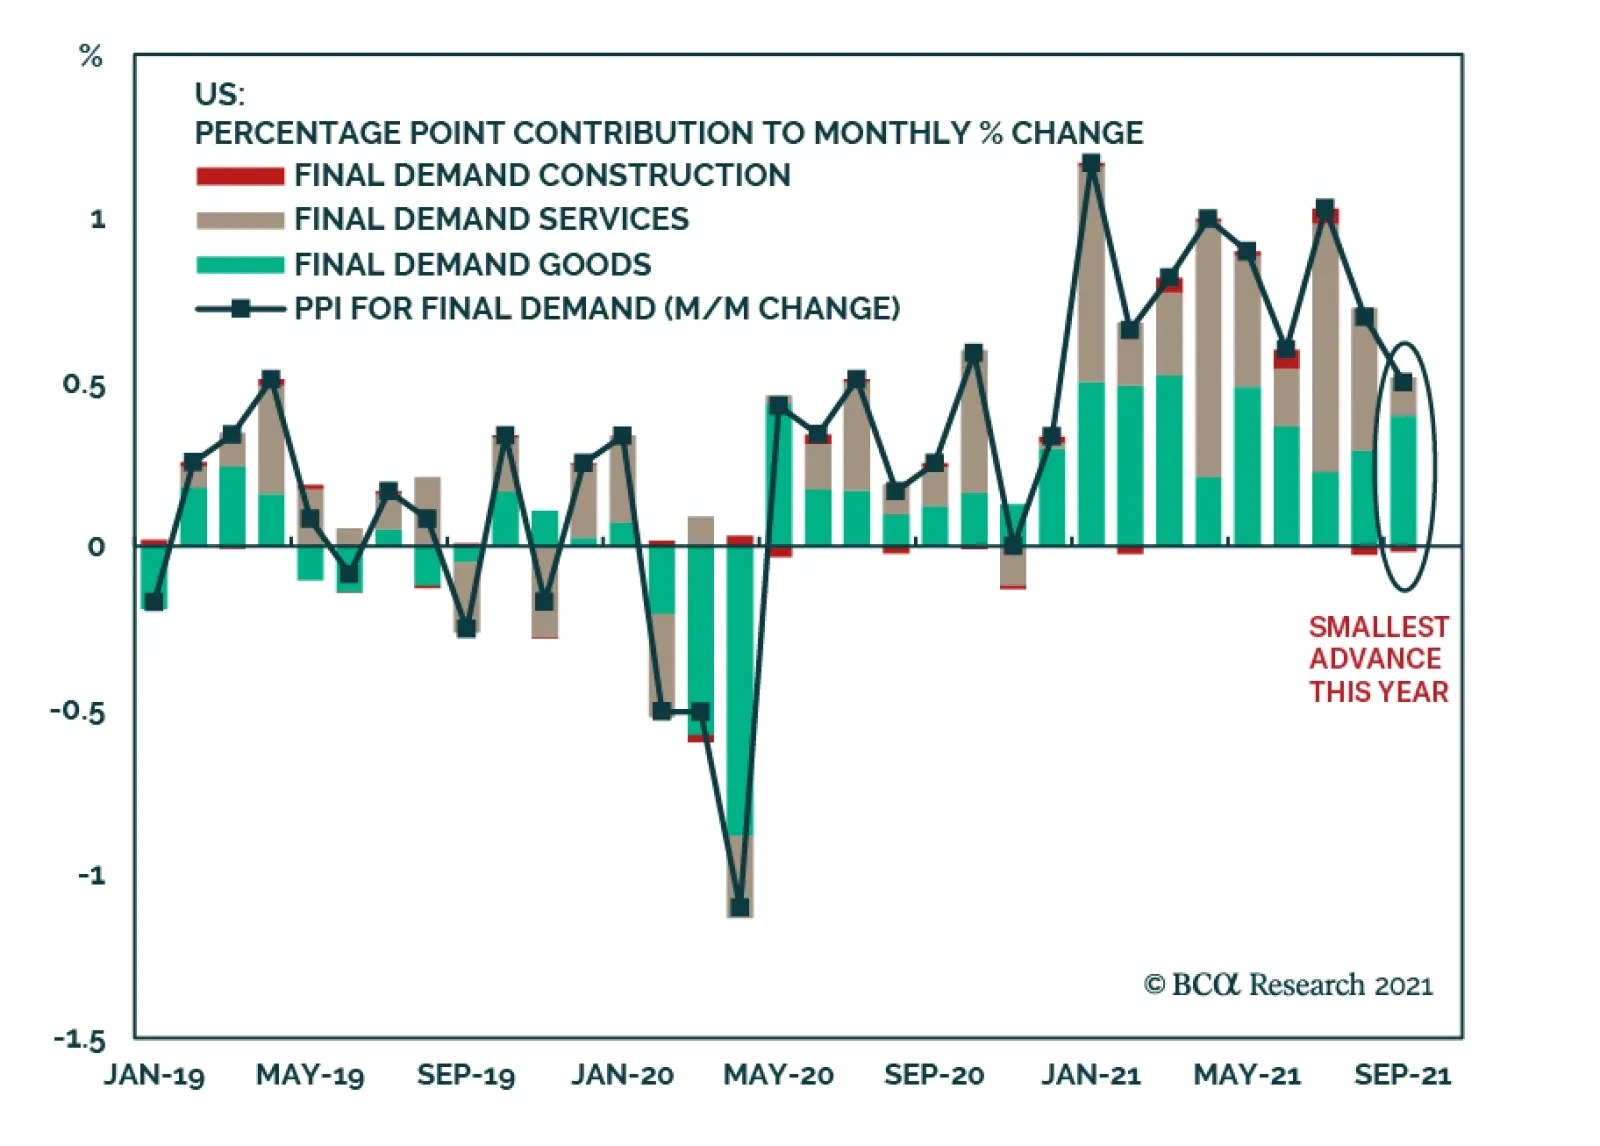
The US September producer price index (PPI) report suggests that pipeline inflationary pressures are easing. The PPI for final demand decelerated from 0.7% m/m to 0.5% m/m. The latest reading marks the smallest advance this year and falls below the…
Highlights The surge in energy prices going into the Northern Hemisphere winter – particularly coal and natgas prices in China and Europe – will push inflation and inflation expectations higher into the end of 1Q22 (Chart of the Week). Over the medium-term, similar excursions into the far-right tails of price distributions will become more frequent if capex in hydrocarbon-based energy sources continues to be discouraged, and scalable back-up sources of energy are not developed for renewables. It is not clear China will continue selectively relaxing price caps for some large electricity buyers, which came close to bankrupting power utilities this year and contributed to power shortages. The current market set-up favors long commodity index products like the S&P GSCI and the COMT ETF. We remain long both. Higher energy and metals prices also will work in favor of long-only commodity index exposure over the medium term. Longer-term supply-chain issues will be sorted out. Still, higher costs will be needed to incentivize production of the base metals required to decarbonize electricity production globally, and to keep sufficient supplies of fossil fuels on hand to back up renewable generation. This will cause inflation to grind higher over time. Feature Back in February, we were getting increasingly bullish base metals on the back of surging demand from China. Most other analysts were looking for a slowdown.1 The metals rally earlier this year drew attention away from the fact that China had fundamentally altered its energy supply chain, when it unofficially banned imports of Australian thermal coal. It also altered global energy flows and will, over the winter, push inflation higher in the short run. Building new supply chains is difficult under the best of circumstances. But last winter had added dimensions of difficulty: A La Niña drawing arctic weather into the Northern Hemisphere and driving up space-heating demand; flooding in Indonesia, which limited coal shipments to China; and a manufacturing boom that pushed power supplies to the limit. Over the course of this year, Chinese coal inventories fell to rock-bottom levels and set off a scramble for liquified natural gas (LNG) to meet space-heating and manufacturing demand last winter (Chart 2).2 Chart of the WeekEnergy-Price Surge Will Lift Inflation
Energy-Price Surge Will Lift Inflation
Energy-Price Surge Will Lift Inflation
Chart 2Coal Shortage China
China Power Outages: Another Source Of Downside Risk Coal Shortage China
China Power Outages: Another Source Of Downside Risk Coal Shortage China
While this was evolving, the volume of manufactured exports from China was falling (Chart 3), even while the nominal value of these exports was rising in USD terms (Chart 4). This is a classic inflationary set-up: More money chasing fewer goods. This is occurring worldwide, as supply-chain bottlenecks, power rationing and shortages, and falling commodity inventories keep supplies of most industrial commodities tight. China's export volumes peaked in February 2021, and moved lower since then. This likely persists going forward, given the falloff of orders and orders in hand (Chart 5). Chart 3Volume Of China's Exports Falls …
Inflation Surges, Slows, Then Grinds Higher
Inflation Surges, Slows, Then Grinds Higher
Chart 4… But The Nominal USD Value Rises
Inflation Surges, Slows, Then Grinds Higher
Inflation Surges, Slows, Then Grinds Higher
Chart 5China's Official PMIs, Export And In-Hand Orders Weaken
Inflation Surges, Slows, Then Grinds Higher
Inflation Surges, Slows, Then Grinds Higher
Space-heating and manufacturing in China are both heavily reliant on coal. Space-heating north of the Huai River is provided for free, or is heavily subsidized, from coal-fired boilers that pump heat to households and commercial establishments. This is a practice adopted from the Soviet Union in the 1950s and expanded until the 1980s, according to Fan et al (2020).3 Manufacturing pulls its electricity from a grid that produces 63% of its power from coal. China's coal output had been falling since December 2020, which complicated space heating and electricity markets, where prices were capped until this week. This meant electricity generators could not recover skyrocketing energy costs – coal in particular – and therefore ran the risk of bankruptcy.4 The loosening of price caps is now intended to relieve this pressure. Competition For Fuels Will Continue Europe was also hammered over the past year by a colder-than-normal winter brought on by a La Niña event, which sharply drew natgas inventories. The cold weather lingered into April-May, which slowed efforts to refill storage, and set off a scramble to buy up LNG cargoes (Chart 6). Chart 6The Scramble For Natgas Continues
Inflation Surges, Slows, Then Grinds Higher
Inflation Surges, Slows, Then Grinds Higher
This competition has lifted global LNG prices to record levels, and continues to drive prices higher. Longer-term, the logic of markets – higher prices beget higher supply, and vice versa – virtually assures supply chains will be sorted out. However, the cost of energy generally will have to increase to incentivize production of the base metals needed to pull off the decarbonization of electricity production globally, and to keep sufficient supplies of fossil fuels on hand to back up renewable generation. This will cause inflation to grind higher over time. Decarbonization is a strategic agenda for leading governments, especially China and the European Union. China is fully committed to renewables for fear of pollution causing social unrest at home and import dependency causing national insecurity abroad. In the EU, energy insecurity is also an argument for green policy, which is supported by popular opinion. The US has greater energy security than these two but does not want to be left behind in the renewable technology race – it is increasing government green subsidies. The current set of ruling parties will continue to prioritize decarbonization for the immediate future. Compromises will be necessary on a tactical basis when energy price pressures rise too fast, as with China’s latest measures to restart coal-fired power production. The strategic direction is unlikely to change for some time. Investment Implications Over time, a structural shift in forward price curves for oil, gas and coal – e.g., a parallel shift higher from current levels – will be required to incentivize production increases. This would provide hedging opportunities for the producers of the fuels used to generate electricity, and the metals required to build the infrastructure needed by the low-carbon economies of the future. We continue to expect markets to remain tight on the supply side, which will make backwardation – i.e., prices for prompt-delivery commodities trade higher than those for deferred delivery – a persistent feature of commodities for the foreseeable future. This is because inventories will remain under pressure, making commodity buyers more willing to pay up for prompt delivery. The current market set-up favors long commodity index products like the S&P GSCI and the COMT ETF. We remain long both, given our expectation. Over the short term, inflation will be pushed higher by the rise in coal and gas prices. Robert P. Ryan Chief Commodity & Energy Strategist rryan@bcaresearch.com Commodities Round-Up Energy: Bullish According to the Energy Information Administration (EIA), industrial consumption of natgas in the US is on track to surpass its five-year average this year. Over the January-July period, US natgas consumption average 22.4 BCF/d, putting it 0.2 BCF/d over its five-year average (2016-2020). US industrial consumption of natgas peaked in 2018-19 at just over 23 BCF/d, according to the EIA (Chart 7). The EIA expects full-year 2021 industrial consumption of natgas to be 23.1 BCF/d, which would tie it with the previous peak levels. Base Metals: Bullish Following a sharp increase in refined copper usage in China last year resulting from a surge in imports, the International Copper Study Group (ICSG) is expecting a 5% decline this year on the back of falling imports. Globally, the ICSG expects refined copper consumption to be unchanged this year, and rise 2.4% in 2022. Refined copper production is expected to be 25.9mm MT next year vs. 24.9mm MT this year. Consumption is forecast to grow to 25.6mm MT next year, up to 700k MT from the 24.96mm MT usage expected this year. Precious Metals: Bullish Lower-than-expected job growth in the US pushed gold prices higher at the end of last week on the back of expectations the Fed will continue to keep policy accessible as employment weakened. All the same, gold prices remain constrained by a well-bid USD, which continues to act as a headwind, and only minimal weakening of the 10-year US bond yield, which dipped slightly below the 1.61% level hit earlier in the week (Chart 8). Ags/Softs: Neutral This week's USDA World Agricultural Supply and Demand Estimates (WASDE) were mostly neutral for grains and bearish for soybeans. Global ending bean stocks are expected to rise almost 5.4% in the USDA's latest estimate for ending stocks in the current crop year, finishing at 104.6mm tons. Corn and rice ending stocks were projected to rise 1.4% and less than 1%, ending the crop year at 301.7mm tons and 183.6mm tons, respectively. According to the department, global wheat ending stocks are the lone standout, expected to fall 2.1% to 277.2mm tons, the lowest level since the 2016/17 crop year. Chart 7
Inflation Surges, Slows, Then Grinds Higher
Inflation Surges, Slows, Then Grinds Higher
Chart 8
Uncertainty Weighs On Gold
Uncertainty Weighs On Gold
Footnotes 1 Please see Copper Surge Welcomes Metal Ox Year, which we published on February 11, 2021. It is available at ces.bcaresearch.com. 2 China’s move to switch to Indonesian coal at the beginning of this year to replace Aussie coal was disruptive to global markets. As argusmedia.com reported, this was compounded by weather-related disruptions in Indonesian exports earlier this year. It is worthwhile noting, weather-related delays returned last month, with flooding in Indonesia's coal-producing regions again are disrupting coal shipments. We expect these new trade flows in coal will take a few more months to sort out, but they will be sorted. 3 Please see Maoyong Fan, Guojun He, and Maigeng Zhou (2020), " The winter choke: Coal-Fired heating, air pollution, and mortality in China," Journal of Health Economics, 71: 1-17. 4 In August and September, the South China Morning Post reported coal-powered electric generators petitioned authorities to relax price caps, because they faced bankruptcy from not being able to recover the skyrocketing cost of coal. Please see China coal-fired power companies on the verge of bankruptcy petition Beijing to raise electricity prices, published by scmp.com on September 10, 2021. This month, Shanxi Province, which provides about a third of China's domestically produced coal, was battered by flooding, which forced authorities to shut dozens of mines, according to the BBC. Please see China floods: Coal price hits fresh high as mines shut published by bbc.co.uk on October 12, 2021. Power supplies also were lean because of the central government's so-called dual-circulation policies to reduce energy consumption and the energy intensity of manufacturing. This is meant to increase self-reliance of the state. Please see What is behind China’s Dual Circulation Strategy? Published by the European think tank Bruegel on September 7, 2021. Investment Views and Themes Strategic Recommendations
Dear client, Next week, instead of sending you a Strategy Report, we will be hosting our quarterly webcast “Taper Tantrum 2.0” on Monday, October 18 at 10 am EDT and 9 pm EDT, addressing the recent market moves and discussing the US equity market outlook. Kind Regards, Irene Tunkel
How Much Fuel Is Left In Energy Equities?
How Much Fuel Is Left In Energy Equities?
Only time will tell how long the current energy crisis and the resulting bull market in energy equities will last, but a violent snapback is in the cards for crude oil once supply challenges dissipate. Crude oil and the US dollar have historically enjoyed a tight negative correlation (oil, like other commodities, is priced in USD). This relationship has broken down only five times since 2004, with the latest occurrence unraveling right now (see chart, the US dollar shown on an inverted scale). Each break down in the correlation was followed by a correction in energy prices in excess of more than 20% on average. The resolution of the crisis is likely to follow a familiar pattern: Shale producers will ramp up capex spending and drill more wells, which are profitable at the current price level. It is also unlikely that the divergence will close with a downward move in the US dollar, given the Fed’s imminent tapering and rising Treasury rates. Given the explosive spike in energy prices and lack of visibility as to when the crisis will be resolved, we have recently downgraded the S&P energy index from overweight to neutral. Bottom Line: The longer the crisis lasts, the more violent the snapback in WTI and energy equities will be.
Highlights As US inflation proves to be not-so-transitory, US interest rate expectations will rise. Slowing Chinese domestic demand and rising US interest rate expectations will support the US dollar. The net impact from China’s slowdown and higher US interest rate expectations on mainstream EM will be currency depreciation. Rising mainstream EM nominal and real (inflation-adjusted) interest rates do not often lead to domestic currency appreciation A strengthening dollar vis-à-vis EM currencies is bad news for EM fixed-income markets – both local currency bonds and credit markets. Feature This report discusses EM local currency (domestic) bonds and US dollar bonds (credit markets). To begin with, we reiterate our main macro themes since January this year: (1) a slowdown in China and (2) rising US inflationary pressures and higher US bond yields. These macro themes will create tailwinds for the US dollar, at least for the next several months. A strengthening dollar is bad news for EM fixed-income markets. China’s Slowdown China’s slowdown will continue to unfold. China’s credit (TSF1 excluding equity) growth has slowed further in September (Chart 1, top panel). Similarly, household mortgages are also decelerating sharply (Chart 1, bottom panel). Chart 1China's Money And Credit Are Decelerating
China's Money And Credit Are Decelerating
China's Money And Credit Are Decelerating
Chart 2Curtailed Financing For Property Developers = Less Construction Activity
Curtailed Financing For Property Developers = Less Construction Activity
Curtailed Financing For Property Developers = Less Construction Activity
China's ever-important property market and construction activity will contract in the months ahead. Property sales were down by 20% in September from a year ago. Property developers in recent years have been relying on pre-construction sales as a major source of financing. With pre-sales drying up and borrowing restrained by both government regulations and creditors’ unwillingness to lend, property developers will be unable to sustain the current pace of construction and completion (Chart 2). Chart 3Red Flags For EM ex-TMT Stocks
Red Flags For EM ex-TMT Stocks
Red Flags For EM ex-TMT Stocks
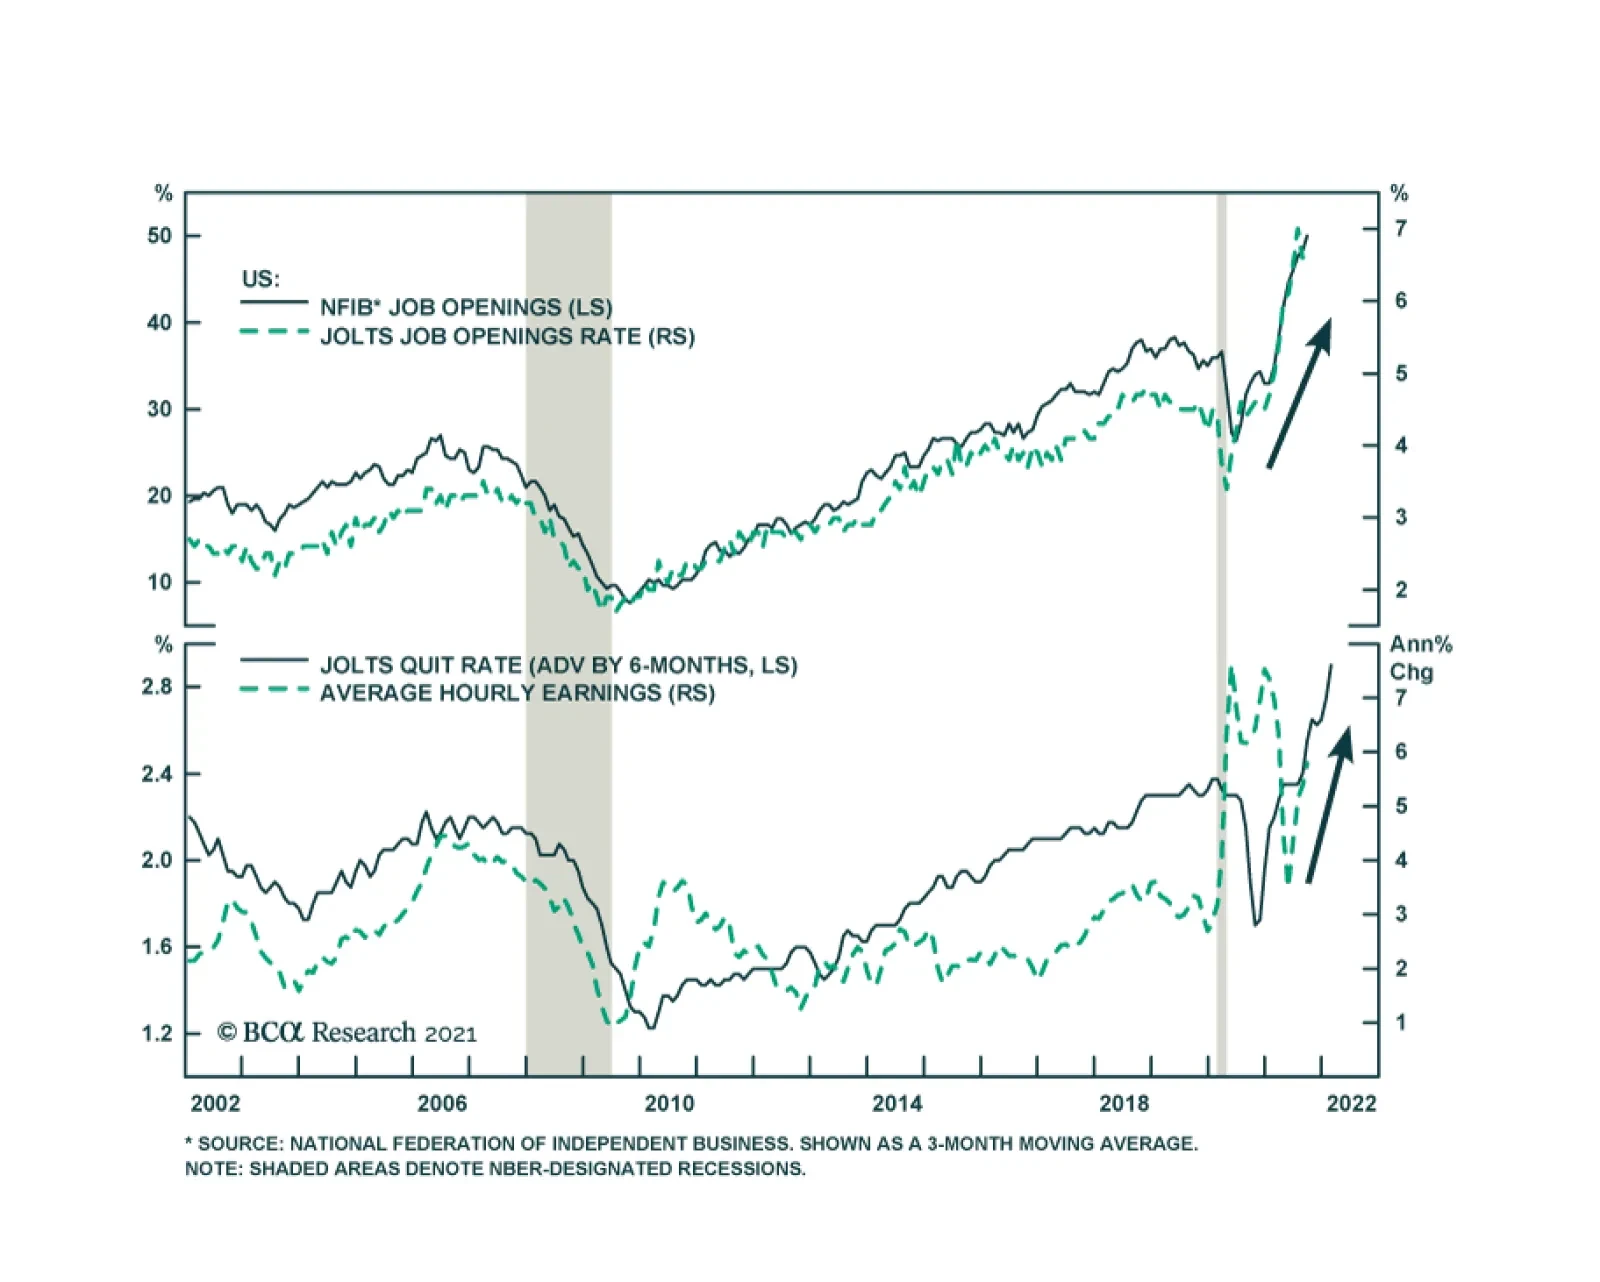
For the same reason, property developers have curtailed their purchases of land. Land sales have been a major source of local government revenues – it is estimated to account for 45% of local government revenues including managed (off-balance sheet) funds. The upshot will be that local governments will be unable to ramp up their infrastructure spending to offset shrinking property construction. Altogether, these will have negative implications for the mainland’s industrial economy and raw materials. Notably, global material stocks have rolled over decisively even though CRB Raw Materials price index has yet to peak (Chart 3, top panel). Global industrial stocks in general and machinery stocks in particular have also relapsed. Finally, Chinese non-TMT share prices have dropped by 20% from their February high and EM ex-TMT equity prices have formed a head-and-shoulder pattern, which often precedes a major gap down (Chart 3, bottom panel). These equity market signals are foreshadowing a slowdown in China’s “old economy”. Bottom Line: The shockwaves emanating from the slowdown in China will hinder growth in Asia and commodity-producing economies in the rest of EM. This is positive for the US dollar because among major economic blocks, the US economy is the least exposed to the mainland economy. US Interest Rates Will Be Repriced US bond yields will continue marching higher, supporting the US dollar. The reasons for higher bond yields are as follows: Investors and commentators can differ on their assessment of the US inflation outlook. However, one thing that we should all agree on is that uncertainty over the US inflation outlook is extraordinarily high. Heightened uncertainty requires a higher risk premium in bonds, i.e., a wider bond term premium. Surprisingly, until August, the term premium on US bonds was very subdued (Chart 4). In brief, the US bond term premium will rise to reflect uncertainty around the inflation outlook, which will push bond yields higher. US wages hold the key to the inflation outlook. We believe that wage growth will surprise to the upside as many companies have strong order books but are struggling to hire. As people gradually return to the labor force, employers have a once in a decade chance to attract qualified employees. Hence, companies will likely compete with one another by offering higher wages to attract the most qualified candidates. The job quit rate is the highest it has been since the early 2000s. This rate also points to higher wages (Chart 5). Chart 4High Inflation Uncertainty Heralds Higher Bond Term Premium And Yields
High Inflation Uncertainty Heralds Higher Bond Term Premium And Yields
High Inflation Uncertainty Heralds Higher Bond Term Premium And Yields
Chart 5US Wage Growth Will Accelerate
US Wage Growth Will Accelerate
US Wage Growth Will Accelerate
Three factors that had suppressed US bond yields will likely be reversing: US commercial banks have been major buyers of US Treasurys and agency securities; the US Treasury has depleted its account at the Fed due to the debt ceiling but will now begin issuing more bonds to fill in this account; the Fed has been purchasing $80 billion of US government bonds each month; however, the Fed is preparing to taper and therefore reduce these purchases. Chart 6US Banks Have Been Buying Bonds En Masse
US Banks Have Been Buying Bonds En Masse
US Banks Have Been Buying Bonds En Masse
US commercial banks’ holdings of US government and agency securities has risen to 19% of their total assets – on par with their early 1990s all-time high (Chart 6, top panel). In turn, the share of loans and leases has fallen to an all-time low (Chart 6, middle panel). As US banks begin to expand their lending, they will likely reduce the pace of their buying of US Treasurys. This along with the US Treasury issuing more paper to increase its depleted Treasury General Account at the Fed (Chart 6, bottom panel) and the Fed’s tapering will likely push up US bond yields. Current shortages are the result of excessive demand, rather than producers operating below capacity.2 The fact is that the supply/shipment of goods is booming, at least from Asia/China to the US. This will prove to be inflationary, and therefore lead to higher bond yields. Chinese shipments to the US continue to thrive – in September, export values were up by 30.5% from a year ago (Chart 7, top panel). Given that US import prices from China are rising at an annual rate of 3.8%, China’s export volume to the US has grown to about 26.7% from last September when it was already booming. Consistently, inbound containers unloaded at the Long Beach and LA ports have surged to all-time highs (Chart 7, bottom panel). Hence, US ports are not operating below capacity, it is excessive demand for goods that has created these bottlenecks. Finally, concerning semiconductors, shortages are due to excessive demand not a failure to produce. Global semiconductor production has been growing rapidly over the past two years. A silver lining is that a capitalistic system will eventually expand production and meet demand. Although we broadly agree with this expectation, it will take a couple of years for this to take place. In the interim, we can expect to see higher prices, at least for goods, and rising inflation expectations. Bottom Line: As US inflation proves to be not-so-transitory, US interest rate expectations will rise, which will support the US dollar. The broad-trade weighted US dollar has been correlated with US TIPS yields (Chart 8). Chart 7Shipments From Asia To The US Have Been Booming
Shipments From Asia To The US Have Been Booming
Shipments From Asia To The US Have Been Booming
Chart 8High US Rates Will Support The Dollar
High US Rates Will Support The Dollar
High US Rates Will Support The Dollar
EM Domestic Bonds Chart 9EM Inflation Has Been Spiking
EM Inflation Has Been Spiking
EM Inflation Has Been Spiking
EM domestic bond yields have been rising as inflation in EM ex-China, Korea, Taiwan (herein referred as mainstream EM) has been surging (Chart 9). Even if commodity prices roll over, EM interest rate expectations will likely continue rising for now because of higher US bond yields and EM currency weakness. Many clients have been asking whether rising mainstream EM policy rates and local bond yields will support EM currencies. We do not think so. In high-yielding interest rate markets such as Brazil, Mexico, South Africa, Russia and Turkey, neither short- nor long-term rates have been positively correlated with the value of their currencies (Chart 10 and 11). Chart 10Higher Bond Yields Do Not Lead To Currency Appreciation In Brazil And Mexico
Higher Bond Yields Do Not Lead To Currency Appreciation In Brazil And Mexico
Higher Bond Yields Do Not Lead To Currency Appreciation In Brazil And Mexico
Chart 11Higher Bond Yields Do Not Lead To Currency Appreciation In Russia And South Africa
Higher Bond Yields Do Not Lead To Currency Appreciation In Russia And South Africa
Higher Bond Yields Do Not Lead To Currency Appreciation In Russia And South Africa
Chart 12Higher EM Inflation-Adjusted Bond Yields Do Not Lead To EM Currency Appreciation
Higher EM Inflation-Adjusted Bond Yields Do Not Lead To EM Currency Appreciation
Higher EM Inflation-Adjusted Bond Yields Do Not Lead To EM Currency Appreciation
Further, in these markets real (inflation-adjusted) rates also have not been positively correlated with their currencies (Chart 12). As illustrated in Charts 11, 12 and 13, there has been no positive correlation between both EM nominal and real (inflation-adjusted) interest rates and their currencies. Rather, there has often been a negative correlation. The basis is that exchange rates drive interest rate expectations, not vice versa. Currency depreciation leads to higher inflation expectations and rising interest rates. Conversely, exchange rate appreciation dampens inflation expectations paving the way for declining interest rates. Bottom Line: The net impact China’s slowdown and higher US interest rate expectations on mainstream EM domestic bonds will be currency depreciation with little room for their central banks to cut rates. As a result, local bonds’ risk-reward factor remains an unattractive tradeoff. EM Credit Markets As we laid out in A Primer on EM USD Bonds report on April 29, EM exchange rates and their business cycle are the key drivers of EM sovereign and corporate credit spreads. If EM currencies drop, EM sovereign and corporate credit spreads will widen (Chart 13). The basis is that foreign currency debt servicing will become more expensive as EM currencies depreciate. As EM growth disappoints, EM credit spreads will widen too (Chart 14). Chart 13EM Credit Spreads And EM Currencies
EM Credit Spreads And EM Currencies
EM Credit Spreads And EM Currencies
Chart 14EM Profit Expectations And EM Corporate Spreads
EM Profit Expectations And EM Corporate Spreads
EM Profit Expectations And EM Corporate Spreads
In addition, the continuous carnage in Chinese offshore corporate bonds will heighten odds of a material selloff in this EM credit. Chinese property companies’ USD bonds make up a more than half of China’s offshore USD corporate bond index and a large part of the EM corporate bond index. Poor performance of the EM corporate bond index could trigger outflows from this asset class. Investment Recommendations Slowing Chinese domestic demand and rising US interest rate expectations will support the US dollar. As the interest rate differential between China and the US narrows, the CNY will likely experience a modest setback versus the greenback (Chart 15). Even small RMB weakness could produce a non-trivial depreciation in EM exchange rates. The latter is negative for EM local currency bonds and EM credit markets. Absolute-return investors should stay on the sidelines of EM domestic bonds. For dedicated investors in this asset class, our recommended overweights are Mexico, Russia, Korea, India, China, Korea, Malaysia and Chile. EM credit markets will continue to underperform their US counterparts (Chart 16). Credit investors should continue underweighting EM credit versus their US counterparts, a strategy we have been recommending since March 25, 2021. Chart 15CNY/USD And The Interest Rate Differential
CNY/USD And The Interest Rate Differential
CNY/USD And The Interest Rate Differential
Chart 16EM Credit Markets Are Underperforming Their US Peers
EM Credit Markets Are Underperforming Their US Peers
EM Credit Markets Are Underperforming Their US Peers
Finally, EM ex-TMT share prices correlate with inverted EM USD corporate bond yields (Chart 17). Higher EM corporate bond yields (shown inverted in Chart 17) entail lower EM ex-TMT share prices. Chart 17High EM USD Bond Yields Herald Lower Share Prices
High EM USD Bond Yields Herald Lower Share Prices
High EM USD Bond Yields Herald Lower Share Prices
In turn, China’s TMT stocks remain vulnerable as we have argued in past reports. Arthur Budaghyan Chief Emerging Markets Strategist arthurb@bcaresearch.com Footnotes 1 Total Social Financing. 2 We made a similar case for Chinese electricity shortages in last week’s report. Equities Recommendations Currencies, Credit And Fixed-Income Recommendations
Highlights Cross-Atlantic Policy Divergence: A steadily tightening US labor market means that the Fed remains on track to formally announce tapering next month. Meanwhile, the ECB is signaling that they are in no hurry to do the same given scant evidence that surging energy prices are seeping into broader European inflation. This leads us to make the following changes to our tactical trade portfolio – taking profits on the 10-year French inflation breakeven spread widener; while switching out of the long December 2023 Euribor futures trade into a 10-year US Treasury-German Bund spread widening trade. Surging Antipodean Inflation: Australia and New Zealand are both seeing higher realized inflation, but market-based inflation expectations are falling in the former and rising in the latter. This leads us to make the following changes to our tactical trades: taking profits on the Australia-US 10-year spread widener; entering a new 10-year Australia inflation breakeven spread widener; and closing the underwater 2-year/5-year New Zealand curve flattening trade. Feature This week, we present a review of the shorter-term recommendations currently in our list of Tactical Overlay trades. These are positions that are intended to complement our strategic Model Bond Portfolio, with shorter holding periods – our goal is no longer than six months - and sometimes in smaller markets that are outside our usual core bond market coverage. As can be seen in the table on page 17, we typically organize these ideas by the type of trade (i.e. yield curve flatteners or cross-country spread wideners). Yet for the purposes of this review, we see two interesting themes that better organize the current trades and help guide our decision to keep them or enter new ones. Playing A Hawkish Fed Versus A Dovish ECB Federal Reserve officials have spent the past few months signaling that a tapering of bond purchases was increasingly likely to begin before year-end given the steadily improving US labor market. The September payrolls report released last Friday, even with the headline employment growth number below expectations for the second consecutive month, does not change that trajectory. Chart of the WeekCyclical UST Curve Flattening Pressures
Cyclical UST Curve Flattening Pressures
Cyclical UST Curve Flattening Pressures
The US unemployment rate fell to 4.8% in September, continuing the uninterrupted decline from the April 2020 peak of 14.8% (Chart of the Week). The pace of that decline has accelerated in recent months, although the Delta variant surge in the US has created distortions in both the numerator and denominator of the unemployment rate. Now that the US Delta wave has crested and case numbers are falling, growth in both employment and the labor force should start to accelerate in the next few payrolls reports. This will result in a faster pace of US job growth, albeit with a slower decline in the unemployment rate, likely starting as soon as the October jobs report. The US Treasury curve has already been reshaping in preparation for a less accommodative Fed, with flattening seen beyond the 5-year point (middle panel). We have positioned for a more hawkish Fed, and a flatter Treasury curve, in our Tactical Overlay via a butterfly trade. Specifically, we are short a 5-year Treasury bullet versus a long position in a 2-year/10-year barbell, all using on-the-run cash Treasuries. That trade was initiated on June 22, 2021 and has so far generated a small profit of +0.27%. Our butterfly spread valuation model for that 2/5/10 Treasury butterfly shows that the 5-year bullet has not yet reached an undervalued extreme versus the 2/10 barbell (Chart 2). We are keeping this trade in our Tactical Overlay, as the current 2/5/10 butterfly spread of 23bps is still 6bps below the +1 standard deviation level implied by our model. Chart 2Stay In Our 2/5/10 UST Butterfly Trade
Stay In Our 2/5/10 UST Butterfly Trade
Stay In Our 2/5/10 UST Butterfly Trade
Moving across the Atlantic, our trades have been the mirror image of our Fed recommendations, positioning for a continued dovish, reflationary ECB policy bias. We have expressed that via two trades: long 10-year French inflation breakevens and long December 2021 Euribor futures. We continue to see no reason for the ECB to follow the Fed’s path towards imminent tapering and signaling future rate hikes. Growth momentum has cooled in the euro area, with both the Markit composite PMI and the ZEW growth expectations index having peaked in June (Chart 3). At the same time, inflation expectations have picked up. The 5-year/5-year forward CPI swap rate has risen to 1.8%, still below the ECB’s 2% inflation target but well above the 2020 low of 0.7% (middle panel). Markets are focusing on the higher inflation and not the slowing growth, with the EUR overnight index swap (OIS) curve now pricing in 12bps of rate hikes in 2022 (bottom panel). We see that as a highly improbable outcome. There is little evidence that the latest pickup in euro area realized inflation is broadening out beyond surging energy price inflation and supply-constrained goods inflation (Chart 4). Euro area headline CPI inflation hit a 13-year high of 3.0% in August, with the “flash” estimate for September showing a further acceleration to 3.4%. Yet core inflation only reached 1.6% in August - a month when the trimmed mean euro area CPI inflation rate calculated by our colleagues at BCA Research European Investment Strategy was a scant 0.2%. Chart 3ECB Will Not React To This Cyclical Bout Of Inflation
ECB Will Not React To This Cyclical Bout Of Inflation
ECB Will Not React To This Cyclical Bout Of Inflation
Chart 4Euro Area Inflation Upturn Is Not Broad-Based
Euro Area Inflation Upturn Is Not Broad-Based
Euro Area Inflation Upturn Is Not Broad-Based
While the September flash estimate of core inflation did perk up to 1.9%, the trimmed mean measure shows that the rise in euro area inflation to date has not been broad based. Like the Fed, ECB officials have indicated that they view this pick-up in inflation as “transitory”, fueled by soaring energy costs and base effect comparisons to low inflation in 2020. Signs that higher inflation was feeding into “second round” effects like rising wage growth might change the ECB’s thinking. From that perspective, the recent increase in labor strike activity in Germany is a potentially worrisome sign, but the starting point is one of low wage growth – the latest available data on euro area wage costs showed a -0.1% decline during Q2/2021. Chart 5Close Our Long Dec/23 Euribor Futures Trade
Close Our Long Dec/23 Euribor Futures Trade
Close Our Long Dec/23 Euribor Futures Trade
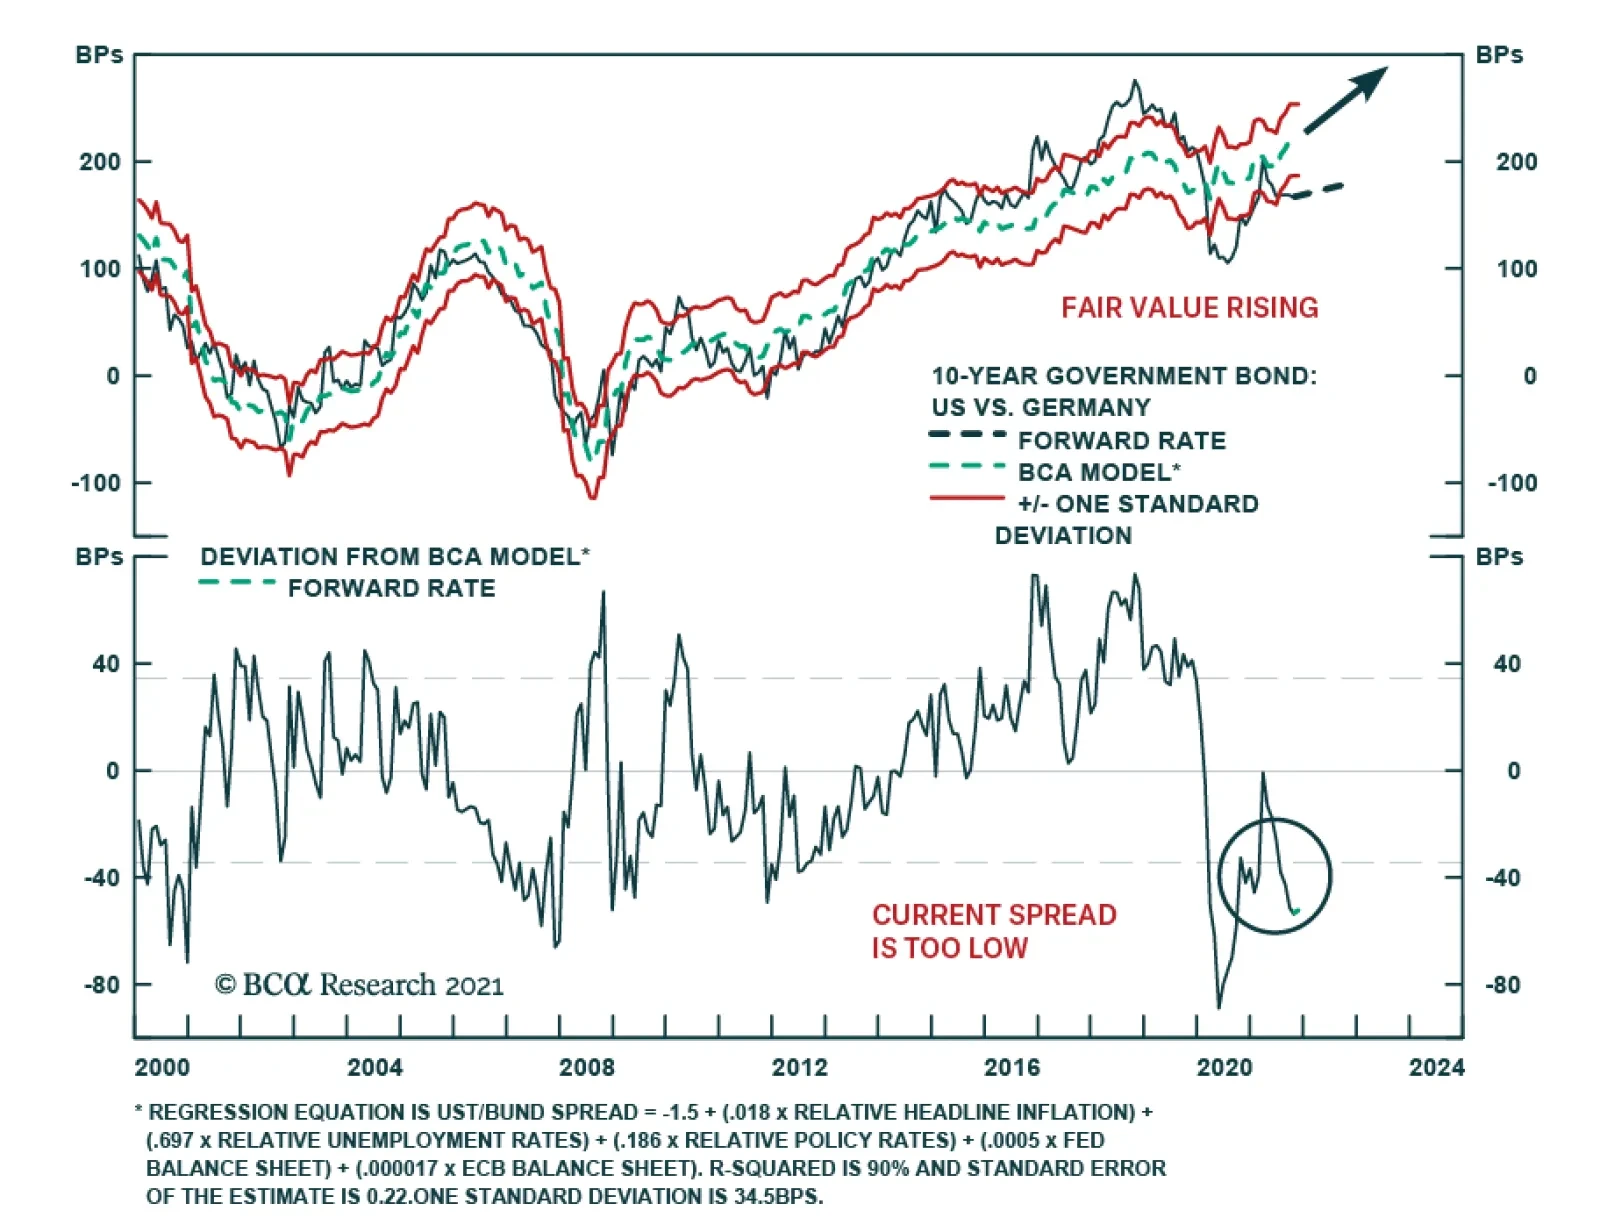
We have been trying to fade ECB rate hike expectations via our long December 2023 Euribor futures trade. That position, initiated on May 18, 2021 has generated a small loss of -0.11% (Chart 5). We still expect the ECB to keep rates on hold in 2022, and most likely 2023, so there is the potential for that trade to recover that underperformance. However, that position has now reached the six-month holding period “re-evaluation” limit that we have imposed on our Tactical Overlay trades. Thus, we are closing that trade this week. In its place, we are initiating a new tactical trade to position for not only persistent ECB dovishness but a more hawkish Fed – a US Treasury-German Bund spread widening trade using 10-year bond futures. The specific details of the trade (futures contracts, duration-neutral weightings on each leg of the trade) can be found in the table on page 17. This new UST-Bund trade is attractive for three reasons: Our valuation model for the Treasury-Bund spread - which uses relative policy interest rates, relative unemployment, relative inflation and the relative size of the Fed and ECB balance sheets as inputs – shows that the spread is currently undervalued by more than one full standard deviation, and fair value is rising (Chart 6). The technical backdrop for the Treasury-Bund spread has turned more favorable for wideners, with the spread having fallen back to its 200-day moving average and the 26-week change in the spread now down to levels that preceded past turning points in the spread (Chart 7). Chart 6Enter A New 10yr UST-Bund Spread Widening Trade
Enter A New 10yr UST-Bund Spread Widening Trade
Enter A New 10yr UST-Bund Spread Widening Trade
Relative data surprises are pointing to relatively higher US yields and a wider Treasury-Bund spread, with the Citigroup Data Surprise Index for the US now rising and the euro area equivalent measure falling (Chart 8). Chart 7UST-Bund Technical Backdrop Positioned For Widening
UST-Bund Technical Backdrop Positioned For Widening
UST-Bund Technical Backdrop Positioned For Widening
Chart 8Relative Data Surprises Favor Wider UST-Bund Spread
Relative Data Surprises Favor Wider UST-Bund Spread
Relative Data Surprises Favor Wider UST-Bund Spread
While we are entering a new trade to play for a relatively dovish ECB, we are also choosing to take the substantial profit in our tactical trade in French inflation breakevens. Specifically, we are closing our 10-year French inflation breakeven spread widening position – long a 10-year cash OATi bond, short 10-year French bond futures – with a solid gain of +6.3%. Chart 9Take Profits On Our Long 10yr French Breakevens Trade
Take Profits On Our Long 10yr French Breakevens Trade
Take Profits On Our Long 10yr French Breakevens Trade
We have held this trade for nine months, a bit longer than our typical tactical trade holding period. We did so because French 10-year breakevens continued to look cheap on our valuation model. Now, the breakeven spread has risen to fair value (Chart 9), prompting us to take our gains and move on. Diverging Inflation Expectations In Australia & New Zealand Playing Fed/ECB policy divergence was the first main theme of this Tactical Overlay trade review. The second broad theme is also a divergence, between inflation expectations in New Zealand (which are rising) and Australia (which are falling). This trend leads us to close two existing trades and enter a new position. Chart 10An Inflation-Induced Bear Steepening Of Yield Curves
An Inflation-Induced Bear Steepening Of Yield Curves
An Inflation-Induced Bear Steepening Of Yield Curves
In New Zealand, we are closing out our 2-year/5-year government bond yield curve flattener trade, initiated on July 21, for a loss of -0.32%. While we were correct in our expectation of ramped-up hawkishness from the Reserve Bank of New Zealand (RBNZ), we were caught offside by persistently sticky inflation which has become a headache for global central bankers. With supply squeezes and high commodity prices not going away anytime soon, sovereign curves have bear-steepened across developed markets, driven by rising long-dated inflation expectations (Chart 10). This global steepening pressure also hit the New Zealand curve, to the detriment of our domestic RBNZ-focused flattener trade. There was also a technical component to the steepening in the New Zealand 2-year/5-year curve (Chart 11). With the 2-year/5-year curve having dipped far below its 200-day moving average and the 26-week rate of change at stretched levels, the flattener was already “overbought” when we entered the trade. Despite a steady stream of hawkish messaging from the RBNZ, leading to an actual rate hike last week, technicals did win out in the short term as the 2-year/5-year spread steepened back up towards the 200-day moving average. Chart 11The NZ 2s/5s Curve Has Also Steepened Due To Technical Factors
The NZ 2s/5s Curve Has Also Steepened Due To Technical Factors
The NZ 2s/5s Curve Has Also Steepened Due To Technical Factors
On the positive side, our decision to implement this trade as a duration-neutral “butterfly”, selling a 2-year bond, and using the proceeds to buy a weighted combination of a 5-year bond and a 3-month treasury bill with an equivalent duration to the 2-year bond, worked as intended with the butterfly underperforming as the underlying 2-year/5-year curve steepened. Looking forward, technicals are still some distance from turning favorable and will remain a headwind for the flattener trade. Implied forward rates are also not in our favor, with markets already pricing in some flattening, making this a negative carry trade. Over a cyclical horizon – i.e. beyond our normal six-month holding period for tactical trades - we still expect the shorter-end of the New Zealand to flatten. The experience of past hiking cycles shows that the 2-year/5-year curve tends to continue flattening during policy tightening, usually leveling out at 0bps before re-steepening (Chart 12). Considering that we have already been in this trade for three months, however, we do not believe our initial curve flattening bias will play out successfully over the remainder of our six-month tactical horizon. While we are closing out our flattener trade, we will investigate ways to better express our bearish cyclical view on New Zealand sovereign debt in a future report. Turning to Australia, we are closing out our long Australia/short US spread trade, implemented using 10-year bond futures, taking a healthy profit of +2.1%. We have held this trade for longer than our typical six-month holding period (the trade was initiated on January 26, 2021) because our Australia-US 10-year spread valuation model has continued to flash that the spread was too wide to its fair value (Chart 13). The model has been signaling that the spread should be negative, yet Australian yields have been unable to trade below US yields for any sustained length of time in 2021. Furthermore, the model-implied fair value is now starting to bottom out, suggesting a diminishing tailwind from the relative fundamental drivers of the spread embedded in our model. Chart 12The NZ 2s/5s Curve Will Flatten Over A Cyclical Horizon
The NZ 2s/5s Curve Will Flatten Over A Cyclical Horizon
The NZ 2s/5s Curve Will Flatten Over A Cyclical Horizon
Chart 13Take Profits On Our 10-Yr Australia-US Spread Narrowing Trade
Take Profits On Our 10-Yr Australia-US Spread Narrowing Trade
Take Profits On Our 10-Yr Australia-US Spread Narrowing Trade
Chart 14Inputs Into Our Australia-US Spread Model
Inputs Into Our Australia-US Spread Model
Inputs Into Our Australia-US Spread Model
The inputs into our 10-year spread model are relative policy interest rates, core inflation, unemployment and the size of central bank balance sheets (to incorporate QE effects) for Australia and the US. Of these variables, the biggest drivers of the decline in the fair value since the start of the COVID pandemic in 2020 have been relative inflation and the relative size of the Fed and Reserve Bank of Australia (RBA) balance sheets as a percentage of GDP (Chart 14). Both of those trends are related. Persistently underwhelming Australian inflation – despite accelerating inflation in the US and other developed economies over the past year – has forced the RBA into a pace of asset purchases relative to GDP that exceeded even what the Fed has done since the pandemic started (bottom panel). However, Australian inflation finally began catching up to the rising trends seen elsewhere in the spring of this year, with headline CPI inflation jumping from 1.1% to 3.8% on a year-over-year basis during Q2. Australian bond yields have traded more in line with US yields since that mid-year pop in inflation, preventing the Australia-US spread from narrowing below zero and converging to our model-implied fair value. This is despite a severe COVID wave that forced much of Australia into the kind of severe lockdowns that the nation avoided during the worst of the global pandemic in 2020. With Australian inflation now moving higher and converging towards US levels, economic restrictions starting to be lifted thanks to a rapid vaccination campaign, and the RBA having already done some tapering of its asset purchases before the Fed, the fundamental rationale for holding our Australia-US trade is no longer valid, leading us to take profits. The convergence to fair value in our spread model is now more likely to come from fair value rising rather than the actual spread falling. The pickup in Australian inflation also leads us to enter a new trade Down Under. This week, we are initiating a new trade, going long 10-year Australia inflation breakevens, implemented by going long a 10-year cash inflation-linked bond and selling 10-year bond futures. The details of the new trade are shown in the table on page 17. Despite the uptick in realized Australian inflation, breakevens have actually been declining over the past several months, falling from a peak of 247bps on May 13 to the current 208bps. That move has accelerated more recently due to a rise in Australian real yields that has coincided with markets pricing in more future RBA rate hikes. Our 24-month Australia discounter, which measures the total amount of tightening over the next two years discounted in the AUD OIS curve, now shows that 104bps of rate hikes are expected by the fourth quarter of 2023 (Chart 15, bottom panel). This has occurred despite Australian wage growth remaining well below the 3-4% range that the RBA believes is consistent with underlying Australian inflation returning sustainably to the RBA’s 2-3% target band (top two panels). Chart 15Market Expectations For The RBA Are Too Hawkish
Market Expectations For The RBA Are Too Hawkish
Market Expectations For The RBA Are Too Hawkish
Chart 16Go Long 10-Yr Australian Inflation Breakevens
Go Long 10-Yr Australian Inflation Breakevens
Go Long 10-Yr Australian Inflation Breakevens
Australian real bond yields have begun to move higher in response to this more hawkish market policy expectation that seems overdone, helping push breakeven inflation even lower more recently. This has helped unwind some of the overvaluation of 10-year inflation breakevens from earlier in 2021. Our fundamental model for the 10-year Australian breakeven showed that the spread was over two standard deviations above fair value to start 2020 (Chart 16). The decline in the spread since that has largely eliminated that overvaluation, providing a better entry point for a new breakeven spread widening trade. With survey-based measures of inflation expectations rising even as breakevens fall back to fair value (bottom panel), we see a strong case for adding a new Australian inflation trade to our Tactical Overlay. Robert Robis, CFA Chief Fixed Income Strategist rrobis@bcaresearch.com Shakti Sharma Senior Analyst ShaktiS@bcaresearch.com Recommendations The GFIS Recommended Portfolio Vs. The Custom Benchmark Index
A Thematic Update Of Our Tactical Trades
A Thematic Update Of Our Tactical Trades
Duration Regional Allocation Spread Product Tactical Trades Yields & Returns Global Bond Yields Historical Returns
The pace of US consumer price growth climbed in September and was slightly above expectations. Headline CPI accelerated to 5.4% y/y versus consensus estimates it would remain at August’s 5.3% y/y. Similarly, the monthly pace moved up a tenth of a percentage…
The US NFIB Small Business Optimism Index slipped one point in September to 99.1 from 100.1. Although the share of small business owners planning to create new jobs in the next three months fell six points from August, labor market conditions remain…
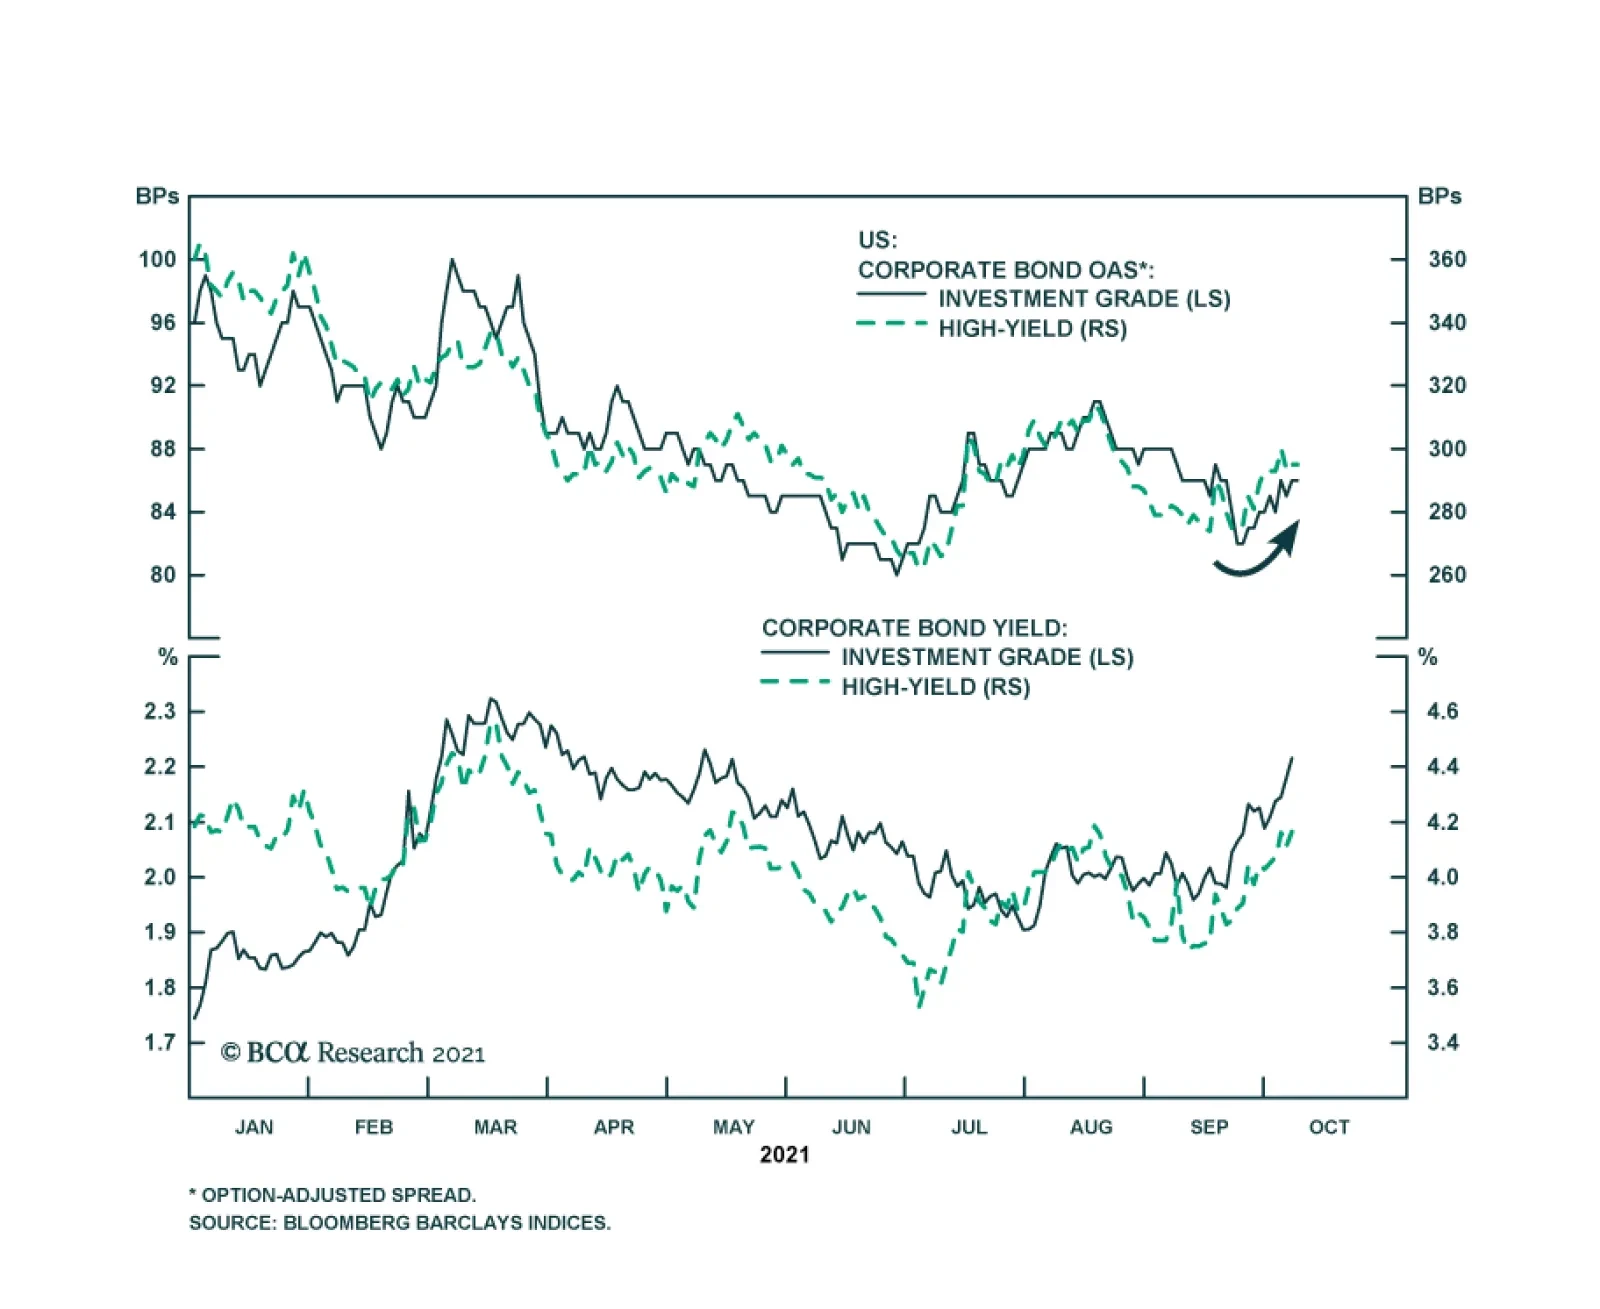
US corporate bond spreads have been widening recently and have underperformed duration-matched Treasuries so far in October. Notably, these moves are occurring against a backdrop of rising Treasury yields – marking a break in the typically negative…