United States

Highlights Spread Product: Investors should stay overweight spread product versus Treasuries for now (with a preference for high-yield corporates over investment grade). But recent shifts in the yield/spread correlation suggest that the credit cycle is getting a bit long in the tooth. We will be quick to recommend a reduction in spread product exposure once the monetary tightening cycle is more advanced and the 3-year/10-year Treasury slope flattens to below 50 bps. We expect this could occur in the first half of 2022. Labor Market & Fed: September’s employment report likely doesn’t alter the Fed’s timeline. The Fed is still on track to announce a tapering of its asset purchases next month and we expect employment growth will be sufficiently strong for the Fed to start hiking rates in December 2022. The Treasury curve will bear-flatten as that outcome is priced in. Duration: Investors should maintain below-benchmark portfolio duration with an expectation that the 10-year Treasury yield will reach a range of 2%-2.25% by the time of Fed liftoff in December 2022. Feature Chart 1A December Debt Ceiling Debate
A December Debt Ceiling Debate
A December Debt Ceiling Debate
The creditors of the United States government can breathe a little easier, at least for a couple of months, as Congress reached an agreement last week to punt debt ceiling negotiations until December. T-bills maturing this month reacted sharply to price-out the risk of technical default, though December bill yields have already started to push higher in anticipation of more turmoil (Chart 1). Of course, the political incentives to lift the debt ceiling will be the same in December as they are today, and Congress will ultimately act to avert economic disaster.1 Financial markets seem to realize this, and Treasury note and bond yields have been unphased by the drama. Instead, Treasury yields have moved higher in recent weeks alongside other indicators of optimism surrounding economic reflation and re-opening (Chart 2). However, there is one troubling signal from financial markets that warrants further investigation. Corporate bonds (both investment grade and high-yield) have underperformed duration-matched Treasuries so far in October, even as Treasury yields have moved higher (Chart 3). Typically, Treasury yields and corporate bond spreads are negatively correlated – spreads tighten as Treasury yields rise, and vice-versa – so it is notable when the correlation flips. Chart 2The Reflation Trade Is Back
The Reflation Trade Is Back
The Reflation Trade Is Back
Chart 3Bad Times For Bonds
Bad Times For Bonds
Bad Times For Bonds
The next section of this report explores the economic drivers of the yield/spread correlation and considers whether the flip to a positive yield/spread correlation signals anything about future corporate bond performance. An Examination Of The Yield/Spread Correlation The simple economic explanation for the negative yield/spread correlation is that an improved economic outlook leads to both a better environment for credit risk (i.e. tighter corporate bond spreads) and the expectation that higher interest rates will be needed to cool the economy in the future (i.e. higher Treasury yields). With that in mind, when spreads and yields both rise at the same time it usually means that the Fed is “over-tightening”. That is, tightening monetary policy so much that the near-term credit environment is deteriorating. This could be because the Fed is making a policy mistake – tightening into an economic slowdown – or because inflation is high enough that the Fed is deliberately slowing growth in an effort to bring down prices. A Technical Examination Looking at the history of monthly changes in Treasury index yields and High-Yield index spreads since 1994, we see that it is quite unusual for yields and spreads to both rise in the same month (Chart 4). In fact, monthly yield and spread changes are negatively correlated 65% of the time and have only risen together in 15% of the months since 1994. Chart 4Monthly Junk Spread Changes Versus Monthly Treasury Yield Changes Since 1994
An Early Warning Sign For Spreads
An Early Warning Sign For Spreads
Second, we observe in Chart 4 that almost all months of large spread widening or tightening occur against the back-drop of a negative yield/spread correlation. This shouldn’t be too surprising. The worst months for corporate bond performance occur during economic recessions when the Fed is cutting interest rates. Conversely, the best months for corporate bond performance occur just after the recession-peak in spreads when the Fed has finished cutting rates and the economic recovery is starting up. Tables 1A and 1B delve deeper into the return numbers. Table 1A shows average High-Yield excess returns over different investment horizons following a signal from the yield/spread correlation. For example, the second row shows that after a month when both Treasury yields and junk spreads rise, high-yield bonds deliver average excess returns of 24 bps during the following 3 months, 116 bps during the following 6 months and 75 bps during the following 12 months. Table 1B provides even more detail by showing 90% confidence intervals for each number. Table 1AAverage High-Yield Excess Returns After A Signal From Yield/Spread Correlation
An Early Warning Sign For Spreads
An Early Warning Sign For Spreads
Table 1BHigh-Yield Excess Returns After A Signal From Yield/Spread Correlation: 90% Confidence Intervals
An Early Warning Sign For Spreads
An Early Warning Sign For Spreads
We draw two conclusions from this analysis. First, a month when spreads widen and yields fall sends the worst signal for near-term (3-month) corporate bond performance, though a month where both yields and spreads rise is a close second. Second, and most relevant for the current market, a month when yields and spreads rise together sends the worst signal for junk bond performance over the following 12 months. In fact, it is the only signal where the 90% confidence interval shows the chance of negative excess returns during the following 12 months. This second conclusion aligns with our intuition. A period of both rising Treasury yields and junk spreads likely signals that the market is pricing-in some move toward a tighter monetary policy stance, though not a severe enough move to send long-maturity Treasury yields down. This is most likely to occur in the very early stages of a monetary tightening cycle, when monetary conditions are still accommodative but recent shifts in Fed policy suggest that they will become more restrictive down the road. A Historical Examination A look back through history confirms our analysis of when yields and spreads tend to rise concurrently. The solid line in the third panel of Chart 5 shows the number of months when both junk spreads and Treasury yields rose out of the most recent trailing 12-month period. The dashed line shows the same measure over the trailing 3-month period, multiplied by 4 to put it on the same scale as the solid line. A spike in these lines indicates that Treasury yields and junk spreads were rising at the same time. Chart 5Rising Yields And Spreads Is A Warning Signal For Monetary Tightening
Rising Yields And Spreads Is A Warning Signal For Monetary Tightening
Rising Yields And Spreads Is A Warning Signal For Monetary Tightening
We identify four relevant historical periods. First, yields and spreads rose concurrently during the 1999/2000 Fed tightening cycle. Specifically, yields and spreads rose together in the early stages of the tightening cycle, then spreads continued to widen as yields fell during the 2001 recession. Second, our indicator showed a couple blips higher during the 2004/06 tightening cycle, though corporate bond returns were solid during this period, at least until after the tightening cycle ended and the recession began. Third, the 2013 taper tantrum coincided with a temporary increase in both yields and spreads as investors worried that the Fed was moving too quickly toward rate hikes. Fourth, yields and spreads both moved higher in 2015 as the Fed was heading toward a December 2015 rate hike against a back-drop of slowing economic growth. Turning to today, we view the recent jump in our indicator as similar to the jump seen during the 2013 taper tantrum. Not only is the Fed once again about to taper asset purchases, but the tapering of asset purchases suggests that the Fed’s next move will be a rate hike at some point down the road. We view this as an early warning sign for corporate bond spreads. While the monetary environment remains supportive for positive corporate bond returns for now, this may not be true by this time next year when the Fed is that much closer to liftoff. Bottom Line: Investors should stay overweight spread product versus Treasuries for now (with a preference for high-yield corporates over investment grade). But recent shifts in the yield/spread correlation suggest that the credit cycle is getting a bit long in the tooth. We will be quick to recommend a reduction in spread product exposure once the monetary tightening cycle is more advanced and the 3-year/10-year Treasury slope flattens to below 50 bps. We expect this could occur in the first half of 2022. Labor Market Update: Still On Track For November Taper And December 2022 Liftoff Chart 6Employment Growth Slowed in September
Employment Growth Slowed in September
Employment Growth Slowed in September
September’s employment report delivered a disappointing headline number, with nonfarm payrolls growing only 194 thousand on the month compared to a consensus estimate of 500k (Chart 6). The details of the report were slightly better: August’s nonfarm payroll growth number was revised higher, our measure of the unemployment rate adjusted for distortions in the number of people employed but absent from work fell from 5.5% to 4.9% (Chart A1) and average hourly earnings rose at an annualized monthly rate of 7.7% (Chart 6, bottom panel). Expect A November Taper For bond investors, the most pressing question is whether the report is bad enough to delay the Fed’s tapering announcement past November. We doubt it. The Fed’s test for when to taper asset purchases, that it gave itself last December, is “substantial further progress” back to pre-COVID levels of employment. Since December 2020, total nonfarm payroll employment is 50% of the way back to its February 2020 level (Chart 7) and there are several good reasons to believe that employment growth will be much stronger in October and November. First, the delta wave of COVID cases clearly weighed on employment growth in September, much like it did in August. The Leisure & Hospitality sector only added 74 thousand jobs in September, compared to an average monthly pace of 349 thousand jobs between February and July of this year before the delta wave struck. With a shortfall of almost 1.6 million Leisure & Hospitality jobs compared to pre-COVID levels (Table 2), job growth in this sector will bounce back sharply during the next few months now that new COVID cases are receding (Chart 8). Chart 7"Substantial Further Progress" Has Been Made
"Substantial Further Progress" Has Been Made
"Substantial Further Progress" Has Been Made
Chart 8Delta Wave Has Crested
Delta Wave Has Crested
Delta Wave Has Crested
Second, the last column of Table 2 shows that the government sector accounted for net job loss of 123 thousand in September. This negative number was driven by state & local government education jobs and is almost certainly a statistical artifact. According to the Bureau of Labor Statistics’ release notes: Recent employment changes [in state & local government education] are challenging to interpret, as pandemic-related staffing fluctuations in public and private education have distorted the normal seasonal hiring and layoff patterns. Table 2Employment By Industry
An Early Warning Sign For Spreads
An Early Warning Sign For Spreads
Expect December 2022 Liftoff As for what this labor market report means for when the Fed will start lifting rates, we believe that we are still on track for liftoff in December 2022. The Appendix to this report updates our scenarios that show the average monthly nonfarm payroll growth that is required to reach different combinations of the unemployment and labor force participation rates by specific future dates. If we use the median assumption from the New York Fed’s Survey of Market Participants that the Fed will lift rates when the unemployment rate is 3.5% and the participation rate is 63%, we calculate that average monthly nonfarm payroll growth of +453k is required to reach those targets by the end of 2022. We see that threshold as eminently achievable.2 Bottom Line: September’s employment report likely doesn’t alter the Fed’s timeline. The Fed is still on track to announce a tapering of its asset purchases next month and we expect employment growth will be sufficiently strong for the Fed to start hiking rates in December 2022. Investors should maintain below-benchmark portfolio duration and hold Treasury curve flatteners in anticipation of that outcome. Ryan Swift US Bond Strategist rswift@bcaresearch.com Appendix: How Far From “Maximum Employment” And Fed Liftoff? Chart A1Defining “Maximum Employment”
Defining "Maximum Employment"
Defining "Maximum Employment"
The Federal Reserve has promised that the funds rate will stay pinned at zero until the labor market returns to “maximum employment”. The Fed has not provided explicit guidance on the definition of “maximum employment”, but we deduce that “maximum employment” means that the Fed wants to see the U3 unemployment rate within a range consistent with its estimates of the natural rate of unemployment, currently 3.5% to 4.5%, and that it wants to see a significant increase in the labor force participation rate (Chart A1). Alternatively, we can infer definitions of “maximum employment” from the New York Fed’s Surveys of Primary Dealers and Market Participants. These surveys ask respondents what they think the unemployment and labor force participation rates will be at the time of Fed liftoff. Currently, the median respondent from the Survey of Market Participants expects an unemployment rate of 3.5% and a participation rate of 63%. The median respondent from the Survey of Primary Dealers expects an unemployment rate of 3.8% and a participation rate of 62.8%. Tables A1-A4 present the average monthly nonfarm payroll growth required to reach different combinations of unemployment rate and participation rate by specific future dates. For example, if we use the definition of “maximum employment” from the Survey of Market Participants, then we need to see average monthly nonfarm payroll growth of +453k in order to hit “maximum employment” by the end of 2022. Table A1Average Monthly Nonfarm Payroll Growth Required For The Unemployment Rate To Reach 4.5% By The Given Date
An Early Warning Sign For Spreads
An Early Warning Sign For Spreads
Table A2Average Monthly Nonfarm Payroll Growth Required For The Unemployment Rate To Reach 4% By The Given Date
An Early Warning Sign For Spreads
An Early Warning Sign For Spreads
Table A3Average Monthly Nonfarm Payroll Growth Required For The Unemployment Rate To Reach 3.5% By The Given Date
An Early Warning Sign For Spreads
An Early Warning Sign For Spreads
Table A4Average Monthly Nonfarm Payroll Growth Required To Reach “Maximum Employment” As Defined By Survey Respondents
An Early Warning Sign For Spreads
An Early Warning Sign For Spreads
Chart A2 presents recent monthly nonfarm payroll growth along with target levels based on the Survey of Market Participants’ definition of “maximum employment”. This chart is to help us track progress toward specific liftoff dates. For example, if monthly nonfarm payroll growth prints +400k per month going forward, we would expect Fed liftoff between December 2022 and June 2023. We will continue to track these charts and tables in the coming months, and will publish updates after the release of each monthly employment report. Chart A2Tracking Toward Fed Liftoff
Tracking Toward Fed Liftoff
Tracking Toward Fed Liftoff
Footnotes 1 For more details on the politics of the debt ceiling please see US Political Strategy Weekly Report, “The House Ways And Means Tax Plan”, dated September 15, 2021. 2 For a discussion about what unemployment and participation rate targets to use in this analysis please see US Bond Strategy Weekly Report, “2022 Will Be All About Inflation”, dated September 14, 2021. Recommended Portfolio Specification Other Recommendations Treasury Index Returns Spread Product Returns
Highlights In this report, we take a close look at corporate margins by analyzing their key drivers: The general level of economic activity, trends in labor costs and productivity, borrowing costs, tax rates, depreciation charges, the exchange rate, and corporate pricing power. The likely contraction of margins next year will be driven by a combination of factors: First and foremost, a slowdown in top-line growth and a decline in corporate pricing power. In the meantime, the tight labor market is putting upward pressure on wage growth despite a peak in productivity improvement. Input costs are also on the rise with PPI soaring, cutting into corporate profitability. Depreciation is already rising on the back of the recent recovery in capex. Interest expense has bottomed in the face of rising rates, and the potential healing of corporate balance sheets is leading to re-leveraging to raise capital for capex and buybacks. The US corporate tax rate is bound to increase based on news from Capitol Hill. The model above encapsulates all of these moving parts (Chart 1) and reiterates that the path of least resistance is lower for US corporate margins. S&P 500 operating margins are likely to contract in 2022. Feature Profits Have Rebounded S&P 500 earnings growth has rebounded vigorously from the pandemic low. Operating earnings-per-share stand 32% YoY above the January 2020 pre-pandemic high (Chart 2). Margins have also exceeded pre-pandemic levels of 11.7% reaching 14.4% in September (Chart 3). The basic story behind a rebound in profitability is well understood: Companies have cut costs aggressively, productivity has improved, lower interest rates have reduced debt servicing burdens, a weaker dollar has boosted overseas earnings, and corporate pricing power has strengthened. Gauging the direction of change for each of these various factors will help us assess whether profits can continue growing, and whether operating margins can continue expanding. Chart 1After An Impressive Surge, Margins Are Set To Decline
Marginally Worse
Marginally Worse
Chart 2Profits Have Rebounded Vigorously
Profits Have Rebounded Vigorously
Profits Have Rebounded Vigorously
Chart 3Margins Are Above Pre-pandemic High
Margins Are Above Pre-pandemic High
Margins Are Above Pre-pandemic High
Sneak Preview: We expect profit margins to contract in 2022 NIPA Operating Margins vs S&P 500 Operating Margins The market tends to focus on S&P 500 earnings and these can be measured on a reported or operating basis, with the latter removing the effects of one-off charges. In order to better understand the path of S&P 500 margins, we aim to relate profits to the economic cycle; to do so, we analyze the data from the national income and product accounts (NIPA) because they are fully integrated with GDP and any related series. National non-financial after-tax profits without the inventory valuation adjustment (IVA) and the capital consumption adjustment (CCAdj)1 are conceptually closest to S&P 500 profits as they measure the after-tax worldwide earnings of US corporations. Fortunately, the S&P and equivalent national income measures of operating profits broadly track each other over the long run, although the S&P data display greater volatility. The NIPA profit margin series is 70% correlated with S&P 500 operating profit margins. While this level of correlation indicates that long-term trends in NIPA profits and S&P earnings are broadly similar, short-term annual and quarterly growth rates can differ dramatically. The Key Drivers Of Profitability A number of factors can influence the path of profits: The general level of economic activity, including trends in borrowing costs, tax rates, depreciation charges, the exchange rate, productivity, and corporate pricing power. It clearly would be most bullish if productivity had been the main driver because any future benefits from the other four sources will be limited. Interest rates will normalize at some point, and effective tax rates seem more likely to rise than fall from current levels, and we should hope for faster depreciation in line with increased capital spending. In addition, the downside in the dollar is constrained by the desire of other countries to maintain competitive exchange rates. Corporate pricing power is the sole mitigating factor against these cost pressures. In this report, we will methodically go through and assess the outlook for each of these profit drivers, and their cumulative effect on profit margins for the next year or so. Revenue Growth Is A Key To Margin Expansion The EBITD measure of domestic non-financial profits excludes the impact of changes in taxes, interest rates and depreciation charges and is thus the series that is most directly affected by the underlying economic cycle and by productivity. Moreover, because it covers only domestic profits, it is not overly influenced by exchange-rate movements. GDP growth and NIPA EBITD margin expansion move in tandem. The post-pandemic rebound in economic growth has underpinned margin recovery (Chart 4). However, real GDP forecasts have recently been cut from 6.5% to just under 6% for 2021, and to 4% in 2022 (Chart 5). Slower growth suggests that the pace of margin expansion will also slow. Chart 4EBITD Margins Usually Track GDP
EBITD Margins Usually Track GDP
EBITD Margins Usually Track GDP
Chart 5GDP Growth Is Expected To Slow
GDP Growth Is Expected To Slow
GDP Growth Is Expected To Slow
Cost Drivers Of Profits Labor Expense As Percentage Of Sales Has Been Falling Looking at the expense side of the NIPA Income Statement, we note that labor costs are singlehandedly the largest expense, hovering around 50% of sales, dwarfing all the other expense items (Chart 6). The NIPA EBITD margin allows us to gauge the effect of changes in labor costs on the bottom line. Chart 6Labor Costs Are The Largest Expense
Labor Costs Are The Largest Expense
Labor Costs Are The Largest Expense
After the initial spike to 54% of sales at the beginning of the pandemic, explained by rapidly falling sales and an inability of companies to rapidly reduce employee numbers, labor costs as a percentage of sales have been reverting to historical levels. This is a curious phenomenon as wages have recently been on the rise: The number of open positions has been exceeding the number of job seekers by over a million, indicating that jobs are plentiful. As a result, the quit rate has exploded (Chart 7). To attract and retain workers, businesses have been raising compensation, leading to average weekly earnings rising by more than 5% year over year. As a result, wages-to-sales have been trending up (Chart 8). Chart 7Quit Rate Exploded Pushing Wages Up
Quit Rate Exploded Pushing Wages Up
Quit Rate Exploded Pushing Wages Up
Chart 8Wages-to-Sales Have Been Trending Up
Wages-to-Sales Have Been Trending Up
Wages-to-Sales Have Been Trending Up
If companies must pay more for labor, why has the labor expense as percentage of sales fallen? To answer this question, we will look at the selling prices over unit labor costs as a proxy for the EBITD margin (Chart 9) to examine the underlying profitability as a function of labor costs. However, since the beginning of the pandemic, this stable relationship has broken down, with selling prices falling over unit labor costs, while margins have been expanding. Digging deeper, we notice that NIPA sales prices have rebounded (Chart 10) due to a surge in inflation and a rise in a corporate pricing power (Chart 11), while unit labor costs dived. This can be attributed to a pandemic productivity surge (Chart 12), making it cheaper to produce each additional unit. Chart 9A Proxy For EBITD Margin
A Proxy For EBITD Margin
A Proxy For EBITD Margin
Chart 10Sales Prices Are Up, Unit Labor Costs Are Down
Sales Prices Are Up, Unit Labor Costs Are Down
Sales Prices Are Up, Unit Labor Costs Are Down
Chart 11US Corporate Power Is Waning
US Corporate Power Is Waning
US Corporate Power Is Waning
Chart 12Productivity Has Peaked
Productivity Has Peaked
Productivity Has Peaked
However, after rising for months, the ability of companies to raise prices further has been diminished by consumers’ income increasing slower than inflation, reducing their purchasing power. Improvements in productivity have also peaked and are unlikely to propel margins higher. Input Costs Are Soaring While cost of goods sold (COGS) is not one of the lines in the NIPA income statement, we would be remiss not to mention that input costs have been on the rise. The most recent reading in PPI was up 8.3% YoY (Chart 13). The price of oil has been surging as well. An increase in the cost of materials definitely has an adverse effect on corporate margins. We will quantify the effects of the year-on-year percentage of PPI on margins later in this report. Chart 13Input Prices Have Soared
Input Prices Have Soared
Input Prices Have Soared
Other Drivers Of Profitability: Depreciation, Interest And Taxes Switching gears to other costs, interest, taxes, and depreciation expenses are likely to increase going forward. Capex Is Rising, So Will Depreciation Expense Depreciation expense is the second largest expense in the cost structure, constituting some 15% of sales. Between mid-2009 and mid-2012, depreciation charges fell sharply, curtailed by weak investment growth during the Global Financial Crisis (GFC) economic downturn. Similarly, the same story unfolded during the 2015 manufacturing slowdown, and the pandemic-induced recession (Chart 14). Today, growth in US domestic fixed investment has rebounded at rates comparable to the 2000 and 2010 recoveries. The trend will continue: According to the Philly Fed Manufacturing Survey, capex intentions have been rising (Chart 15). As a result, depreciation expense is set to climb, cutting into margins and earnings. Chart 14Capex Surge Will Lead To Higher Depreciation
Capex Surge Will Lead To Higher Depreciation
Capex Surge Will Lead To Higher Depreciation
Chart 15More Capex Is Under Way
More Capex Is Under Way
More Capex Is Under Way
Interest Costs Set To Increase With Rising Rates Interest charges are small compared to other expenses, never rising above 5% of sales. There has been quite a lot of variability in interest charges in recent years, reflecting swings in both interest rates and the level of corporate borrowing (Chart 16). Falling interest costs provided a boost to profits between 2008 and 2010, as well as during the trade war and the pandemic. Also, corporations have been de-leveraging, but this trend is about to turn: As the corporate sector heals, it is likely to re-leverage, whether to finance capex or buybacks. With interest rates set to rise, interest costs are likely to become a drag on profits (Chart 17). Chart 16Higher Rates And Corporate Re-Leveraging Will Push Interest Costs Up
Higher Rates And Corporate Re-Leveraging Will Push Interest Costs Up
Higher Rates And Corporate Re-Leveraging Will Push Interest Costs Up
Chart 17Corporate Debt Has Bottomed
Corporate Debt Has Bottomed
Corporate Debt Has Bottomed
Effective Tax Rates Are Likely To Increase Effective tax rates have fallen from about 18% in 2014-2017 to 12% in January 2018 because of the Trump Administration’s tax reform and remain low by historical standards (Chart 18). Meanwhile, taxes paid have also been hit by the 2020 downturn thanks to temporary tax breaks, and have not yet rebounded to pre-pandemic levels, thereby aiding margin expansion. However, given the Biden Administration’s push to increase the US corporate tax rate and eliminate loopholes, chances are that tax expenses will rise. Chart 18Effective Tax Rates Are Low By Historical Standards
Effective Tax Rates Are Low By Historical Standards
Effective Tax Rates Are Low By Historical Standards
Overseas Profits So far, we have focused on the domestic drivers of changes in margins. Yet for many US corporations, especially the ones in the S&P 500, overseas profits are a key source of profits. Many industries derive a substantial share of sales from abroad, and for Technology, this number stands as high as 58%. Historically, overseas profits have been a tremendous source of growth (Chart 19) thanks to rising exposure to fast-growing emerging economies, a weaker dollar, and the transfer of operations to low-tax regimes. However, recently this trend has turned due to closing loopholes allowing companies to locate headquarters in lower tax regime jurisdictions, tax reform, foreign profits amnesty, and unified global pressure to tax US multinationals. Onshoring of manufacturing production is another emerging trend that is likely to improve the efficiency of supply chains but will add to production expenses, chipping away at corporate profitability. The US dollar has been weakening during the pandemic, giving a boost to profits thanks to both lower prices of the American goods and translation effects (Chart 20). Chart 19Overseas Profits Are Trending Down
Overseas Profits Are Trending Down
Overseas Profits Are Trending Down
Chart 20USD TRW Is Strengthening
USD TRW Is Strengthening
USD TRW Is Strengthening
Hence, we conclude that the share of overseas profits is unlikely to change and is not going to become an engine for profit growth for US corporations. Where Next For Profits? The clear implication from the above analysis is that profits have ceased to benefit from earlier benign trends in depreciation charges, interest costs, and tax rates. Looking ahead, these factors, are destined to become modest headwinds for profit growth. Sales growth is also likely to slow as GDP growth returns to trend, with overseas profits less of a source of growth. And importantly, productivity growth and pricing power have peaked and turned, depriving the economy of its key drivers of margin expansion. S&P 500 The obvious question is how all the factors affecting NIPA margins translate into the forecast for change in S&P 500 operating margins. S&P 500 margins are subject to the same profit drivers as the NIPA accounts. In order to forecast the effect of these factors on the year-on-year changes in operating margins, we have built a simple regression model that uses year-on-year changes in average hourly earnings (AHE) to capture the cost of labor; high-yield option-adjusted spreads (OAS) to capture the cost of borrowing; year-on-year PPI as a change in cost of input materials; the trade-weighted USD as an indicator capturing change in foreign profits; and, lastly, the BCA pricing power indicator to measure companies’ ability to pass on these costs to their customers (Table 1). Table 1Regression To Predict Operating Margins YoY%
Marginally Worse
Marginally Worse
The model forecast of margin growth peaked in August 2021 and is about to slow into the balance of the year (Chart 21). Margins will contract outright in December 2021-January 2022. The growth rate for margins in January 2022 is -65% year on year. In January 2021, operating margins were 7.2%. Incorporating a negative year-on-year growth rate, we arrive at margins of only 2.6%, which is certainly very low. The caveat here is that our objective is to predict the direction of change as opposed to working out a point estimate of future margins. In other words, there is a wide confidence interval around any forecast of earnings given the unpredictability of movements in the exchange rate, productivity and the general level of economic activity. However, our assumptions are conservative, and the model clearly points to a margin contraction in 2022. Chart 21After An Impressive Surge, Margins Are Set To Decline
Marginally Worse
Marginally Worse
And lastly, why will margins contract? What is the main culprit that would make things worse? The answer is an increase in input and labor costs (PPI and AHE), both of which are no longer being offset by a corporate pricing power: The ability of corporations to pass on their costs to customers has diminished, and margins are going to take a hit (Chart 22 & Table 2). Chart 22Increase In Costs Is No Longer Offset By Pricing Power
Marginally Worse
Marginally Worse
Table 2Contributions To Margins Growth
Marginally Worse
Marginally Worse
Bottom Line Earnings growth and profit margins are of paramount importance to the performance of equities – as we wrote in a report in August, the key driver of returns has shifted from multiple expansion to earnings growth. Despite the recent pullback, the S&P 500, trading at 20.5x forward multiples, is still expensive. Our analysis shows that S&P 500 operating margins are likely to contract in 2022 because of rising wages, a slowdown in productivity, increases in interest and depreciation expenses, and potential tax hikes. On the revenue side, US GDP growth is slowing, and corporate pricing power is waning, making it difficult to pass on rising costs to customers. Impending margin contraction does not bode well for the strong performance of US equities in the year ahead. Irene Tunkel Chief Strategist, US Equity Strategy irene.tunkel@bcaresearch.com Footnotes 1 Profits before tax reflect the charges used in tax accounting for inventory withdrawals and depreciation. The inventory valuation adjustment (IVA) and the capital consumption adjustment (CCAdj) are used to adjust before-tax profits to NIPA asset valuation concepts. The IVA adjusts inventories to a current-cost basis, which is similar to valuation of inventory withdrawals on a last-in/first-out basis. The CCAdj adjusts tax-reported depreciation to the NIPA concept of economic depreciation (or “consumption of fixed capital”), which values fixed assets at current cost and uses consistent depreciation profiles based on used asset prices. Recommended Allocation
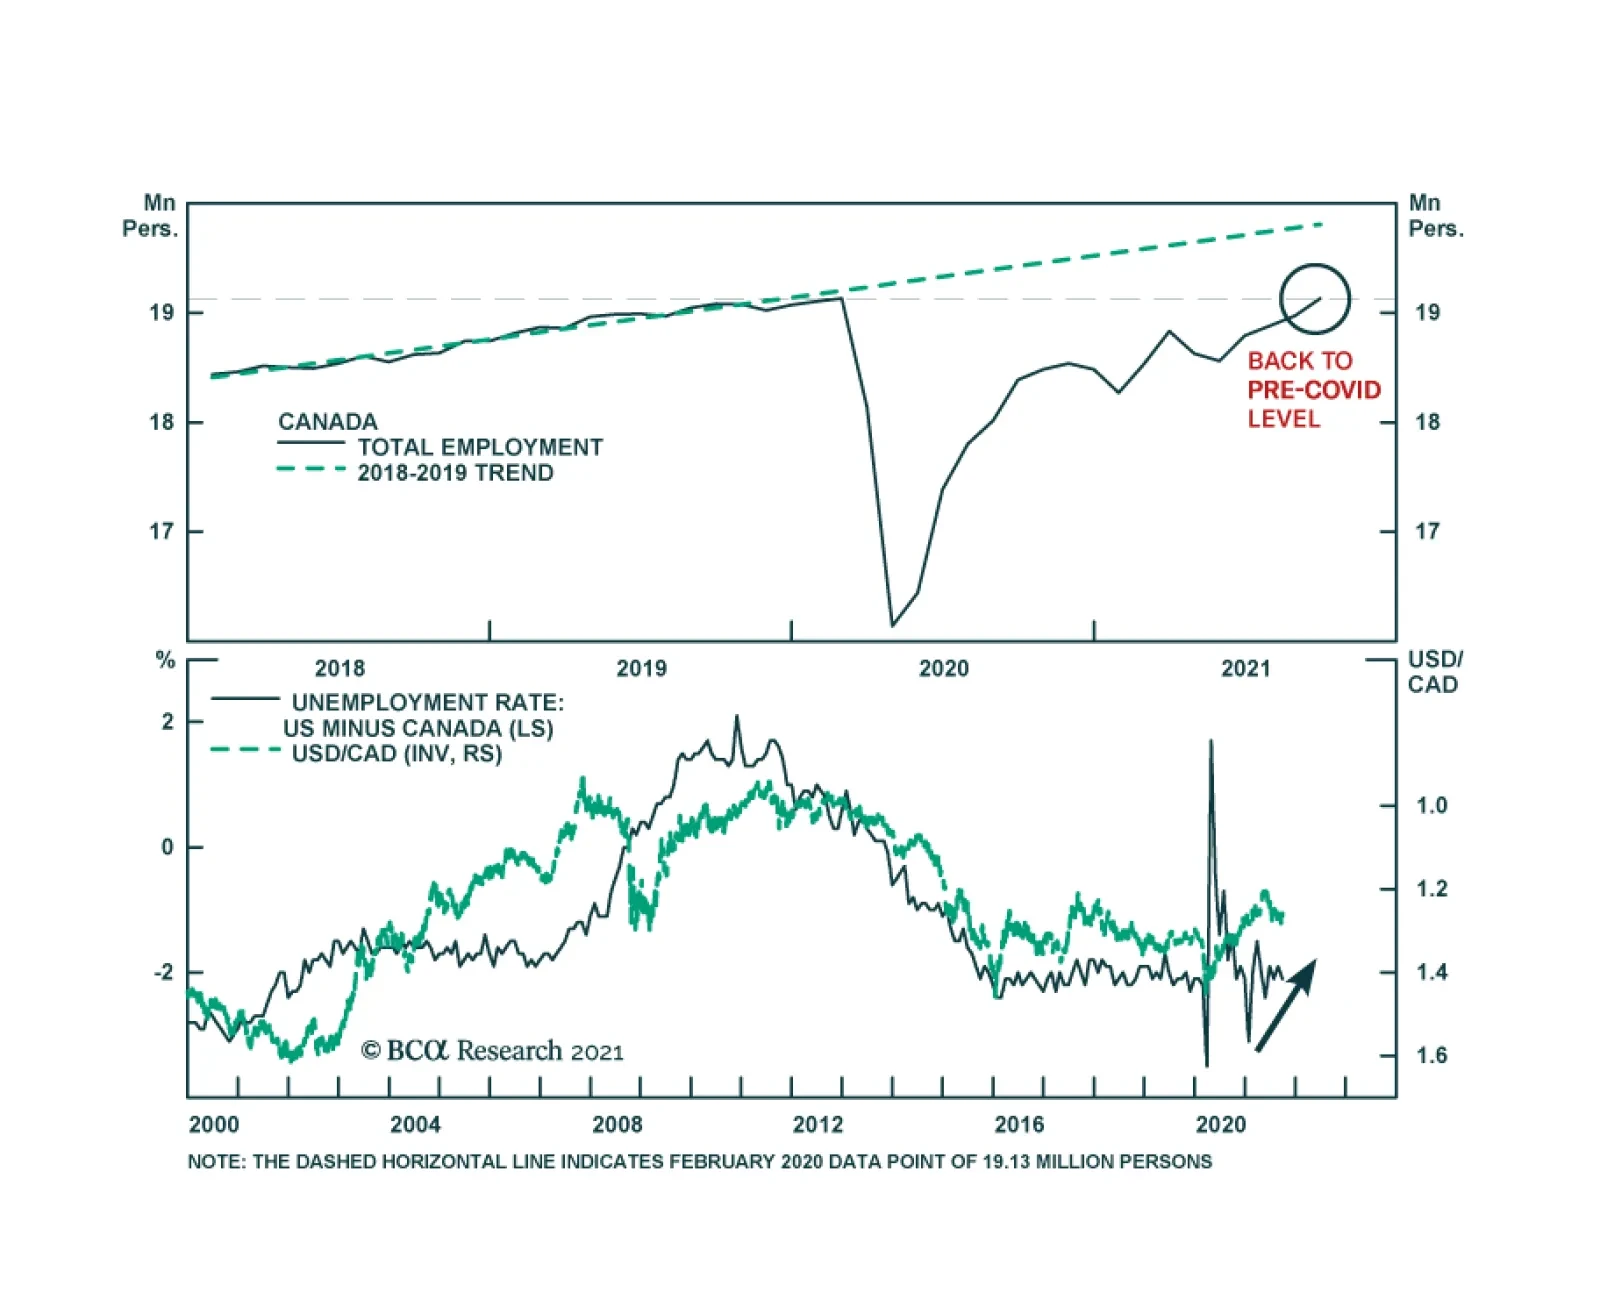
The Canadian economy is reaping the rewards of the country’s swift vaccination campaign. Employment rose by 157 thousand and reached its February 2020 pre-pandemic level in September. Importantly, the increase reflects a nearly 200 thousand jump in full time…
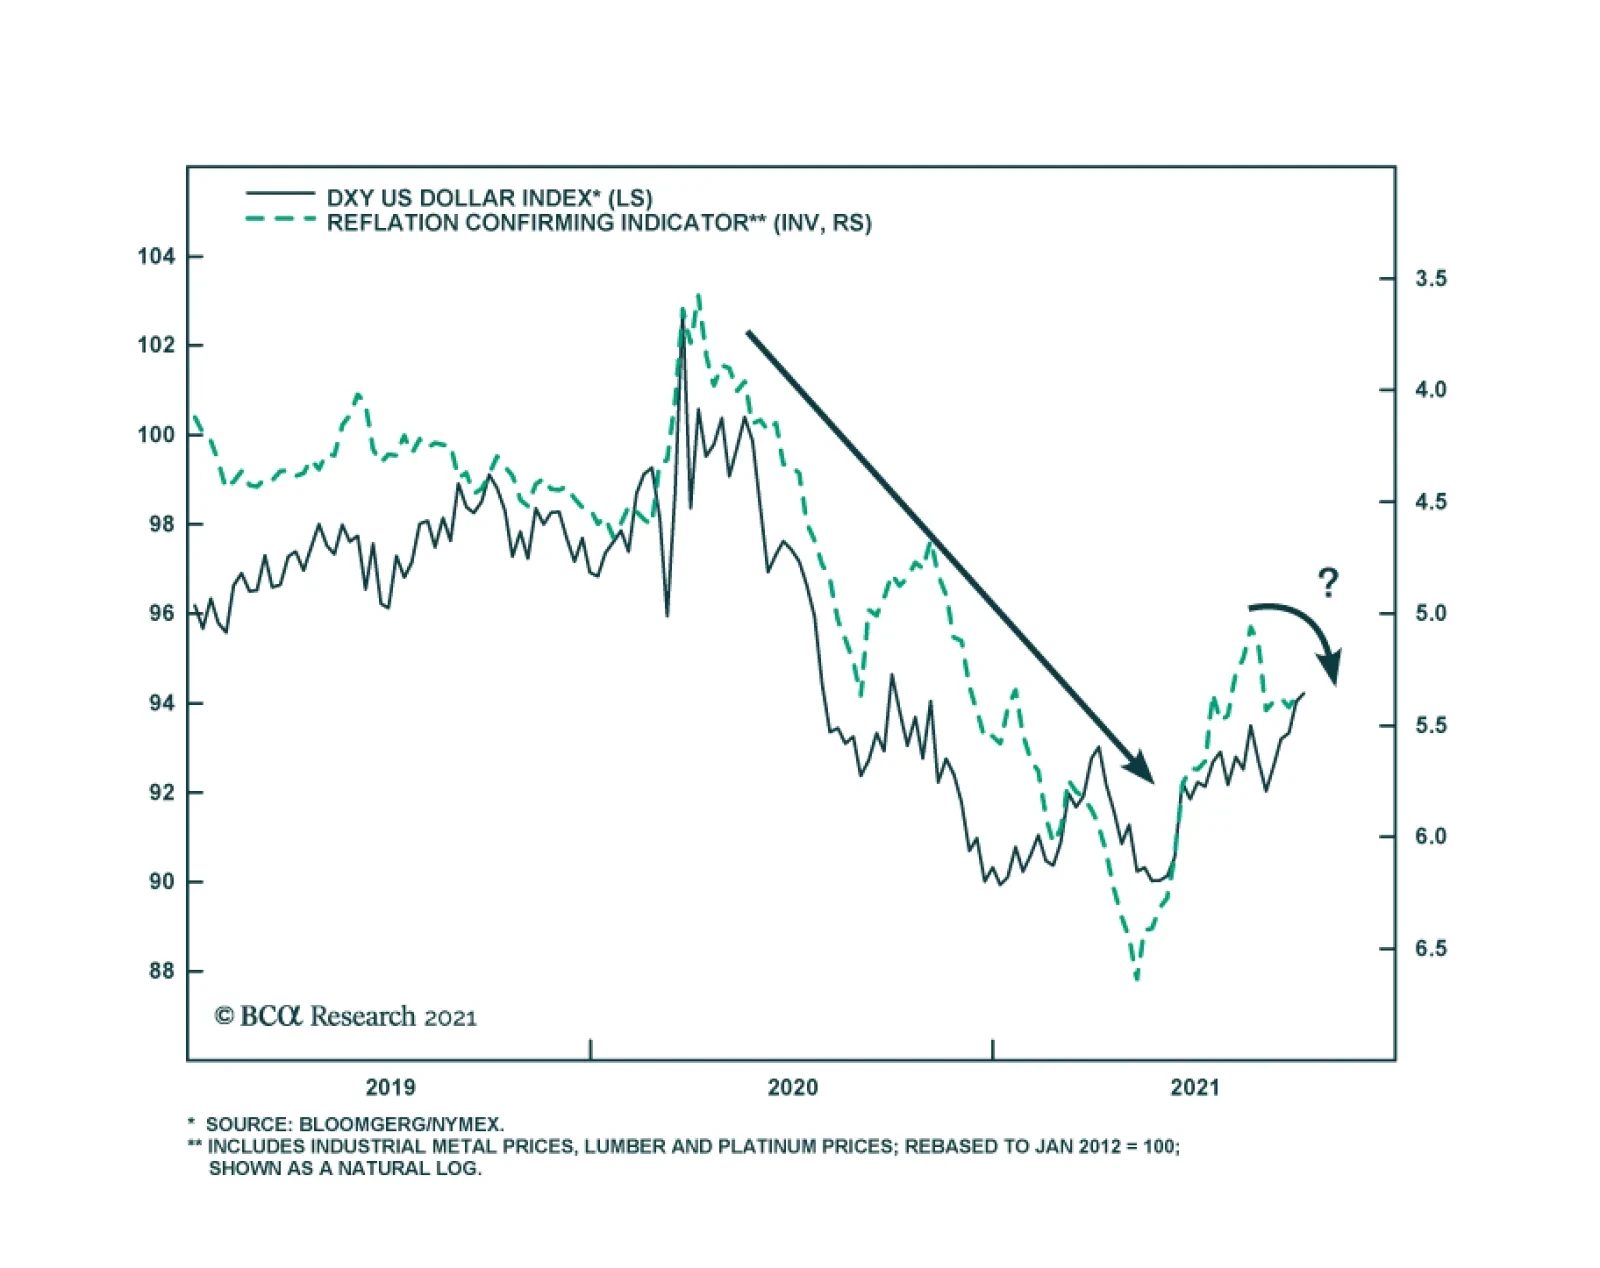
Our Reflation Confirming Indicator is sending a bearish signal for the dollar. It recently started picking up after collapsing over the summer. The reflation gauge is based on the prices of lumber, industrial metals, and platinum. An improvement in this…
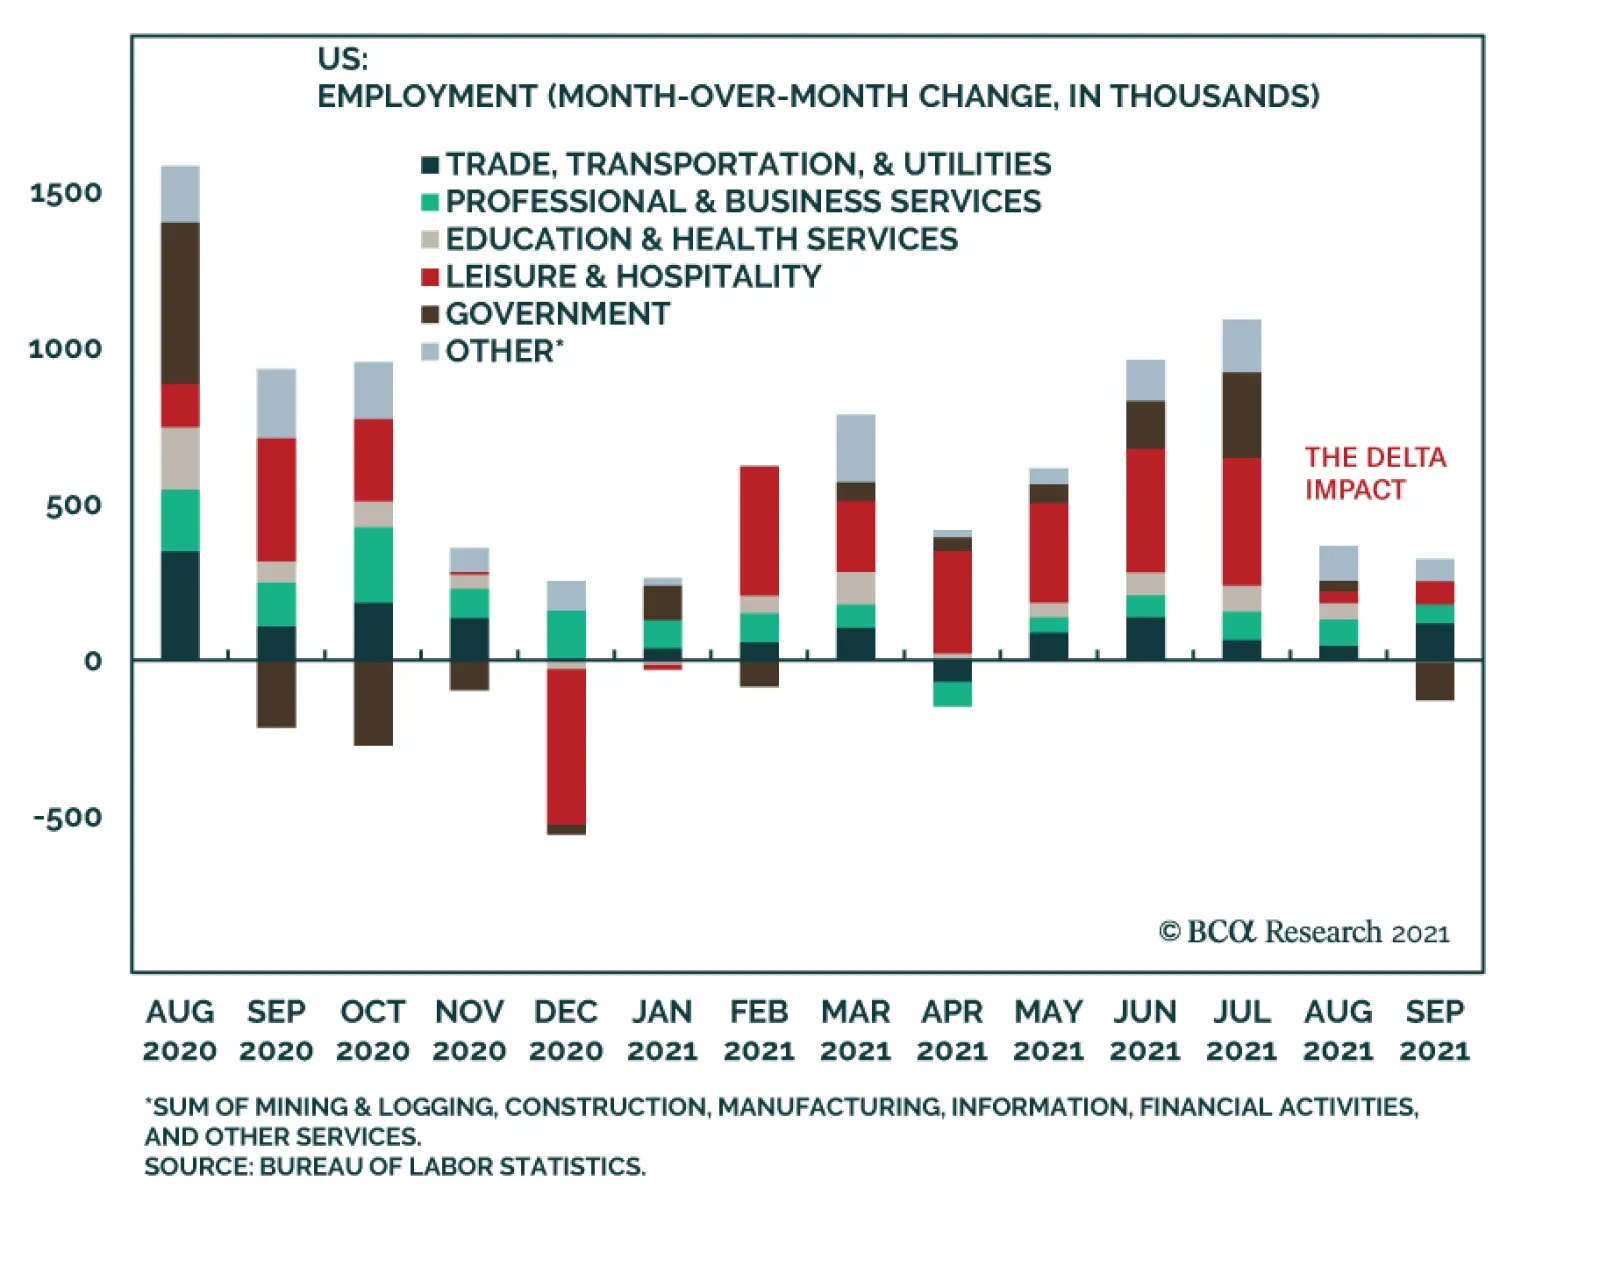
US Nonfarm Payrolls produced another large downside miss in September. Job creation grew by 194 thousand – significantly below the 500 thousand expected. The participation rate slipped 0.1 percentage points to 61.6% versus an anticipated tick up to 61.8%.…
The unfolding energy crises coupled with rising wages on the back of companies struggling to fill job openings, compelled to take a close look at US margins. In order to forecast effects of these factors on the YoY changes in S&P operating margins, we built a simple regression model that uses YoY changes in AHE to capture the cost of labor, high yield OAS to capture the cost of borrowing, PPI YoY as a proxy for the change in costs of input materials, USD TRW as an indicator capturing changes in foreign profits, and finally the BCA pricing power indicator to measure companies’ ability to pass on these costs to their customers (Table 1). Table 1
Margins Trouble Ahead
Margins Trouble Ahead
The model predicts that margins’ growth has already peaked and is due for a slowdown into the balance of the year (see Chart 1). Margins will likely contract in December 2021-January 2022 printing a negative 65% YoY number. Translating YoY growth into the headline margins number we arrive at 2.6%, which is certainly very low. A caveat here is that our objective is to predict the direction of change as opposed to work out a point estimate of the future margins. In other words, there is a wide confidence interval around any forecast of earnings given the unpredictability of moves in the exchange rate, productivity and the general level of economic activity. However, our assumptions are conservative, and the model clearly points to a margin contraction in 2022. Chart 1
Margins Trouble Ahead
Margins Trouble Ahead
Bottom Line: S&P margins have likely peaked and will head lower over the coming several quarters. Please stay tuned for more details in the upcoming Strategy Report.
Highlights Taiwan remains the epicenter of global geopolitical risk, as highlighted by the past week’s significant increase in saber-rattling around Taiwan and across East Asia and the Pacific. Tensions may subside in the short run, as the US and China resume high-level negotiations. But then again they may not. And they will most likely escalate over the long run. Investors should judge the Taiwan scenario based on China’s capabilities rather than intentions. China’s intentions may never be known but it is increasingly capable of prevailing in a war over Taiwan. Before then, economic sanctions and cyber attacks are highly likely. The US has a history of defending Taiwan from Chinese military threats. Washington is trying to revive its strategic commitment to Asia Pacific. But US attempts to increase deterrence could provoke conflict. The simplest solution to Taiwan tensions is for a change of party in Taiwan. This would require an upset in the 2022 and especially 2024 elections. China may try to arrange that. Otherwise the risk of conflict will increase. A sharp economic slowdown in China is the biggest risk for investors, as it would not only be negative for the global economy but also would threaten domestic political stability, discredit the gradual and non-military approach to incorporating Taiwan, and boost nationalist and jingoistic pressures directed against Taiwan. Feature Chart 1China's Confluence Of Internal And External Risks
China's Confluence Of Internal And External Risks
China's Confluence Of Internal And External Risks
China faces a historic confluence of internal and external political risks. This was our key view for 2021 and it continues to be priced by financial markets (Chart 1). The latest example of these risks is the major bout of saber-rattling over Taiwan. The US sent two aircraft carriers, and the UK one carrier, to the waters southwest of Okinawa for naval drills with Japan, Canada, the Netherlands, and New Zealand. Related drills are occurring across Southeast Asia, including Vietnam, Singapore, Malaysia, and others. Meanwhile the Chinese air force let loose its largest yet intrusion into Taiwan’s air defense identification zone (Chart 2). The US assured Japan that it would defend the disputed Senkaku islands, while Japan said that it would seek concrete options – beyond diplomacy – for dealing with Chinese pressure. Chart 2China’s Warning To Taiwan
Biden, Xi, And Taiwan
Biden, Xi, And Taiwan
Chart 3Market Response To Saber-Rattling Over Taiwan Strait
Market Response To Saber-Rattling Over Taiwan Strait
Market Response To Saber-Rattling Over Taiwan Strait
Yet, at the same time, a diplomatic opening emerged between the US and China. A virtual summit is expected to be scheduled between Presidents Joe Biden and Xi Jinping. The Biden administration unveiled its review of US trade policy toward China, with mixed results (i.e. imply a defensive rather than offensive trade policy). China offered to join the Trans-Pacific Partnership trade deal (the CPTPP). All sides exchanged prisoners, with Huawei’s Meng Wanzhou back in China. In the short run global investors will cheer attempts by the US and China to stabilize relations. But over the long run tensions over Taiwan suggest the underlying US-China strategic confrontation will persist. We do not doubt that global risk appetite will improve marginally on the news, including toward Chinese and Taiwanese assets (Chart 3). But investors should not mistake summitry for diplomacy, or diplomacy for concrete and material strategic de-escalation. The geopolitical outlook is gloomy for China and Taiwan. Grand Strategies Collide US grand strategy forbids countries from creating regional empires lest they challenge the US for global empire. China has the long-term potential to dominate the eastern hemisphere. The US now quite explicitly seeks to counter China’s growing economic, technological, military, and political influence. China’s grand strategy forbids countries from interfering in its domestic affairs and undermining its economic and political stability. This could include eroding its territorial integrity, jeopardizing its supply security, or denying its maritime access. The US still has considerable capabilities on this front, particularly due to its control of the oceans and special relationship with Taiwan, the democratic island that China claims as a province but that the US supplies with arms. Historically, the Kingdom of Tungning (1661-83) exemplifies that a rival political and naval power rooted in Taiwan can jeopardize the security of southern China and hence all of China (Map 1). Taiwan’s predicament is geopolitically unsustainable and the difference between the past 72 years and today is that Beijing increasingly has the military means of doing something about it. Map 1Why Taiwan’s Status Quo Is Geopolitically Unsustainable
Biden, Xi, And Taiwan
Biden, Xi, And Taiwan
China seeks to establish maritime access, expand its navy, and improve supply security. This process points toward turf battles with the US and its allies and could easily lead to conflict over Taiwan, the East and South China Seas, and other strategic approaches to China. It could also lead to conflict over technological access. The latter is an economic and supply vulnerability that relates directly to Taiwan, which produces the world’s most advanced computer chips. The Chinese strategy since the Great Recession, under two presidents of two different factions, has been to take a more assertive stance on domestic and foreign policy, economic policy, territorial disputes, and supply security. This hawkish turn occurred in response to falling potential GDP growth, which ultimately threatens social stability and the survival of the political regime. Hong Kong was long the symbol that the western liberal democracies could coexist with the Chinese Communist Party. China’s reduction of Hong Kong’s political autonomy over the past decade violated this understanding. Taiwan is now increasingly concerned about its autonomy while the West is looking to deter China from attacking Taiwan. China is willing to wage war if the West attempts to make Taiwan’s autonomous status permanent through increased military support. The US strategy since the Great Recession, under three presidents of two different parties, has been to raise the costs on China for its increasingly assertive policies, particularly in acquiring technology and using economic and military coercion against neighbors. The US is increasing its use of sanctions, secondary sanctions, tariffs, export controls, cyber warfare, and regional strategic deterrence. Hence the policy consensus in both the US and China is more confrontational than cooperative. The Biden administration is largely maintaining President Trump’s punitive measures toward China while trying to build an international coalition to constrain China more effectively. Meanwhile the Xi administration is refusing to hand over power to a successor in 2022, so there will not be a change in Chinese strategy. The US is politically divided, a major factor in Beijing’s favor. China is politically unified, particularly on the question of Taiwan. But one area of national consensus in the US is the need to become “tougher” with respect to China. President Trump’s policies and the COVID-19 pandemic reinforced this consensus. The number of Americans who would support sending US troops to Taiwan if China invaded has risen from 19% in 1982 to 52% today – meaning that the country is divided but fear of China is driving a shift in opinion.1 Chart 4Taiwan Strait Risk Shoots Up To 1950s Levels And Beyond
Biden, Xi, And Taiwan
Biden, Xi, And Taiwan
The China Cross-Strait Academy, a new think tank with pro-mainland sympathies, has produced a Cross Strait Relations Risk Index that goes back to 1950 and utilizes 59 factors ranging from politics and diplomacy to military and economics. It suggests that tensions have reached historically high levels, comparable to the 1950s, when the first and second Taiwan Strait crises occurred (Chart 4). Beware Chinese Economic Crisis – Or Concerted US Action Tensions across the Taiwan Strait began to rise in 2012 when the Communist Party adopted a more hawkish national policy in response to potential threats to its long-term rule arising from the Great Recession. The 2014 “Sunflower Protests” in Taiwan and “Umbrella Protests” in Hong Kong symbolized the rise in tension as Beijing sought to centralize control across Greater China. Support for the political status quo in Taiwan peaked around this time, although most Taiwanese still prefer the status quo to any final decision on the island’s status, which could trigger conflict (Chart 5). China’s militarization of rocks and reefs in the South China Sea throughout the 2010s gave it greater control over the strategic approaches to Taiwan. Since 2016, we have argued that geopolitical risk in the Taiwan Strait would rise on a structural, long-term basis for the following reasons: (1) China’s economic downshift triggered power consolidation and outward nationalism (2) Taiwanese opinion was shifting away from integration with the mainland (3) the US was attempting a strategic shift of focus back to Asia and countering China. Underlying this assessment was the long-running trend of rising support for independence and falling support for unification with China (Chart 6). Chart 5Taiwanese Favor Status Quo Indefinitely
Biden, Xi, And Taiwan
Biden, Xi, And Taiwan
Chart 6Very Few Taiwanese Favor Reunification, Now Or Later
Biden, Xi, And Taiwan
Biden, Xi, And Taiwan
China’s crackdown on Hong Kong from 2016-19 escalated matters further as it removed the “one country, two systems” model for Taiwan (Chart 7). China continues to insist on this solution. In 2013 and again in 2019, Xi Jinping declared that the Taiwan problem cannot be passed down from one generation to another, implying that he intended to resolve the matter during his tenure, which is expected to extend through 2035. Whether Xi has formally altered China’s cross-strait policy is debatable.2 But his use of military intimidation is not. The US policy of “strategic ambiguity” is debatable but the historical record is clear. In the three major crises in the Taiwan Strait (1954-55, 1958, and 1995-96), the US has sent naval forces to the area and clearly signaled that it would defend Taiwan against aggression.3 However, in diplomatic matters, the US has constantly downgraded Taiwan: for instance, transferring its United Nations seat to China in 1971, revoking its mutual defense treaty in 1980, and prioritizing economic cooperation with China in recent decades. The implication is that the US will not stand in the way of unification unless Beijing attempts to achieve it through force of arms. China’s conclusion from US behavior must be that it can definitely overtake Taiwan by means of economic attraction and diplomacy over time. For example, Beijing’s assertion of direct control over Hong Kong took 20 years and ultimately occurred without any resistance from the West. By contrast, a full-scale attack poses major logistical and military risks and potentially devastating costs if the US upholds its historic norm of defending Taiwan. China’s economy and political system could ultimately be destabilized, despite any initial nationalistic euphoria. Taiwan’s wealth (and semiconductor fabs) would be piles of ash. Of course, Taiwan is different from Hong Kong. The Taiwanese people can believe realistically that they have an alternative to direct rule from Beijing. If mainland China’s economic trajectory falters then the option of absorbing Taiwan gradually will fall away. Today about 30%-40% of Taiwanese people believe cross-strait economic exchange should deepen (Chart 8). Only one period of Taiwanese policy since 1949, the eight years under President Ma Ying-jeou (2008-16), focused exclusively on cross-strait economic integration and deemphasized the tendency toward greater autonomy. If China’s economic prospects dim, then Beijing will become more inclined toward the military option, both to distract from domestic instability and to prevent Taiwan from entertaining independence. Chart 7Taiwanese Oppose "One Country, Two Systems"
Biden, Xi, And Taiwan
Biden, Xi, And Taiwan
Chart 8Taiwanese Not Enthusiastic About Cross-Strait Economic Integration
Biden, Xi, And Taiwan
Biden, Xi, And Taiwan
Chart 9Taiwanese Identify Exclusively As Taiwanese, Not Chinese
Biden, Xi, And Taiwan
Biden, Xi, And Taiwan
Most likely China already has the capability to fight and win a war within the “first island chain,” including over Taiwan, especially if US intervention is hesitant or limited. But any doubts will likely be dispelled in the coming years. As long as China’s military advantage continues to grow, Beijing will increasingly view Taiwan as an object that it can take at will, regardless of whether economic gradualism would eventually work. The Taiwanese increasingly view themselves as distinctly Taiwanese – not Chinese or a mix of Taiwanese and Chinese (Chart 9). The implication is that it may be too late for China to win over hearts and minds. However, Beijing will presumably want to see whether Taiwan’s pro-independence Democratic Progressive Party (DPP) can be dislodged from power in the 2024 elections before making a drastic leap to war. Taiwan, like the US and other democracies, is internally divided. President Tsai Ing-wen’s narrative of Taiwan’s democratic triumph over authoritarianism is not only applied to the mainland but also directed against Taiwan’s own Kuomintang (KMT).4 The country is unified on its right to expand economic and diplomatic cooperation with the West but it is starkly divided on whether the US should formally ally with Taiwan, sell it arms, and defend it from invasion (Chart 10A). Kuomintang supporters say they are not willing to fight and die for Taiwan in the face of any invasion (Chart 10B). American policymakers complain that Taiwan’s military structure and policies – long managed by the KMT – are not seriously aimed at preparing for asymmetric warfare against Chinese invasion. Chart 10ATaiwan Divided On Whether US Should Increase Military And Strategic Support
Biden, Xi, And Taiwan
Biden, Xi, And Taiwan
Chart 10BTaiwan Divided On War Sacrifice
Biden, Xi, And Taiwan
Biden, Xi, And Taiwan
The international sphere also matters for Beijing’s calculus. If the US remains divided and distracted – and allies curry favor with China – then China will presumably continue the gradualist approach. But if the US unifies at home and forges closer ties with allies, aiming to curb China’s economy and defend Taiwan’s democracy, then China may be motivated to take military action sooner. If the US and allies want to deter an attack on Taiwan, they need to signal that war will exact profound costs on China, such as crippling economic sanctions, a full economic blockade, or allied military intervention. But the West’s attempts to increase deterrence could spur China to take action before the West is fully prepared. Unlike the US in the Cuban Missile Crisis, China cannot accept a defeat in any showdown over arms sales to Taiwan. Its own political legitimacy is tied up with Taiwan, contrary to that of the US with Cuba. Given the lack of American willingness to fight a nuclear war over a non-treaty ally, the probability of China launching air strikes would be much higher (Diagram 1). Diagram 1Game Theory Of A Fourth Taiwan Strait Crisis
Biden, Xi, And Taiwan
Biden, Xi, And Taiwan
The US is not trying to give Taiwan nuclear arms, or other game-changing offensive systems, although the US has sent marines and special operations forces to help train Taiwanese troops. It is up to Beijing when to make an ultimatum regarding US military support.5 Ultimately the US still controls the seas and China depends on the Persian Gulf for nearly half of its oil imports. This is a good reason for China not to invade Taiwan. But if the US imposes an oil blockade, then the US and China will go to war – this is how the US and Japan came to blows in World War II. The danger is that China assesses that the US will not go that far. Will Biden-Xi Summit Reduce Tensions? Not Over The Long Run True, strategic tensions could be calmed in the short run. The US is restarting talks with China and setting up a bilateral summit between Presidents Biden and Xi. The two sides have exchanged prisoners (e.g. Meng Wanzhou), held climate talks, and Beijing has offered to join the Trans-Pacific Partnership. The US Trade Representative is suggesting it could ease some of President Trump’s tariffs under pressure from corporate lobbyists. The Biden administration is also likely to seek Beijing’s cooperation in other areas, such as North Korea and Iran. Biden has an urgent problem with Iran and may need China’s help constraining Iran’s nuclear program. However, none of the current initiatives change the underlying clash of grand strategies outlined above. A fundamental US-China reengagement is not in the cards. China is adopting nationalism and mercantilism to deal with its slowing potential growth, while China-bashing is one of the few areas of US national consensus. Specifically: Democracy over autocracy: The Biden administration cannot afford to be seen as smoothing the way for Xi Jinping to restore autocracy in the twentieth National Party Congress 12 months from now. China doubles down on manufacturing: China is not making liberal reforms to its economy to lower trade tensions but rather doubling down on state-led manufacturing and technological acquisition, according to the US Trade Representative.6 The US trade deficit is surging due to US fiscal stimulus. Biden will maintain or even expand high-tech export controls. Climate cooperation is limited: The US public does not agree that it should exchange its homegrown fossil fuels for Beijing’s renewable energy equipment, and the US and EU are flirting with “carbon adjustment fees,” which would be tariffs on carbon-intensive goods imports from places like China. Meanwhile China just told its state-owned enterprises to do everything in their power to secure coal for electricity and ordered banks to lend more to coal companies. North Korea is already a nuclear-armed state, which China condoned, despite multiple rounds of negotiations with the West. No agreement on Iran: If China helps force Iran to accept restrictions on its nuclear program, then that could mark a substantial improvement. But China has made long term commitments to Iran recently and probably will not backtrack on them unless the US makes major concessions that would undermine its attempts to counter China. The Taiwan conundrum undermines trust. If China can be brought to help the US with historic deals on North Korea or Iran, it will expect the US to stand back from Taiwan. The US may not see it that way. A failure to do so will appear a betrayal of trust. Consider China’s bid to join the Trans-Pacific Partnership. China’s state-driven economic model is fundamentally at odds with the TPP. It only takes one member to veto China’s membership, and Australia and Japan would defer to the US on this issue. The US is only likely to rejoin the TPP, which requires Republican support in Congress, on the basis that it is a vehicle for countering China. Even if the TPP members could be convinced to accept China, they would also want to accept Taiwan, which Beijing would refuse. Ultimately if China’s membership is vetoed, then it will conclude that the West is not serious about economic integration. China will be excluded and will be more inclined to pursue its own solutions to problems. China possesses or is close to possessing the capability of taking Taiwan by force today. We cannot rule it out. Taiwanese Defense Minister Chiu Kuo-cheng just claimed it could be attempted as early as 2025. Other estimates point to important Chinese calendar dates as deadlines for Taiwan’s absorption: 2027 (centenary of the People’s Liberation Army), 2035 (Xi Jinping’s long-term policy program), and 2049 (centenary of the People’s Republic of China). The truth is that any attack on Taiwan would not be based on symbolic anniversaries but on maximizing the element of surprise, China’s military capabilities, and foreign lack of readiness and coordination. Given that China’s capabilities are in place, or nearly in place, and nobody can predict such things precisely, investors should be prepared for conflict at any time. Investment Takeaways Chart 11Taiwanese Dollar Strengthened Since Trump
Taiwanese Dollar Strengthened Since Trump
Taiwanese Dollar Strengthened Since Trump
The Taiwanese dollar has rallied since the escalation of US-China strategic tensions in 2016. The real effective exchange rate is now in line with its historic average after a long period of weakness (Chart 11). The trade war and COVID-19 have reinforced Taiwan’s advantage as a chokepoint for semiconductors and tech exports. If we thought there was no real risk of a war, we would not stand in the way of this rally. But based on geopolitical assessment above, the rally could be cut short at any time. Taiwanese equities have also rallied sharply for the same reasons – earnings have exploded throughout the pandemic and semiconductor shortage (Chart 12). Equities are not overly expensive on a cyclically adjusted price-to-earnings basis. But they are meeting resistance at a level that is slightly above fair value. Again, the macro and market fundamentals are positive but geopolitics is deeply negative. We remain underweight Taiwan. China’s willingness to try to stabilize relations with the US is an important positive sign that global investors will cheer in the short run. However, with the US economy fired up, and China’s export machine firing on all cylinders, Chinese authorities apparently believe they can maintain relatively tight monetary, fiscal, and regulatory policy, according to our Emerging Markets Strategy and China Investment Strategy. This will lead to negative outcomes in China’s economy and financial markets. The domestic economy is weak and animal spirits in the private sector are depressed. Retail sales, for example, have dropped far beneath their long-term trend (Chart 13). Chart 12Taiwanese Stocks Not Exactly Cheap
Taiwanese Stocks Not Exactly Cheap
Taiwanese Stocks Not Exactly Cheap
Chart 13China: Consumer Sentiment Weak
China: Consumer Sentiment Weak
China: Consumer Sentiment Weak
The regulatory crackdown on the property sector could trigger an economic and financial crisis (Chart 14). Chinese onshore equity markets were ultimately not able to sustain the collapse in sentiment this year that hit offshore equities even harder. China’s technology sector will continue to struggle under the burden of hawkish regulation, while Chinese stocks ex-tech have long underperformed the broad market (Chart 15). Chart 14China's Huge Property Sector Looking Wobbly
China's Huge Property Sector Looking Wobbly
China's Huge Property Sector Looking Wobbly
Chart 15Beware Financial Turmoil In Mainland China
Beware Financial Turmoil In Mainland China
Beware Financial Turmoil In Mainland China
We maintain the view that Chinese authorities will ease policy when necessary to try to prevent deleveraging in the property sector from triggering a crisis ahead of the twentieth national party congress. A look at past five-year political rotations suggests that bank loans will be flat-to-up over the coming 12 months and that fixed asset investment will tick up (Chart 16). But as long as policymakers are reluctant, risks lie to the downside for Chinese assets and related plays. Chart 16National Party Congress 2022 Requires Overall Stability
National Party Congress 2022 Requires Overall Stability
National Party Congress 2022 Requires Overall Stability
Chart 17GeoRisk Indicators Flash Warnings
GeoRisk Indicators Flash Warnings
GeoRisk Indicators Flash Warnings
China’s shift from “consensus rule” to “personal rule,” i.e. reversion to strongman rule or autocracy, permanently increases the risk of policy mistakes. This could apply to fiscal and regulatory policy as much as to cross-strait policy or foreign policy. It is appropriate that our geopolitical risk indicators for China and Taiwan are rising, signaling that equities are not yet out of the woods (Chart 17). Over the long run China is capable of staging a surprise attack and defeating Taiwan. We have argued that the odds are small this year but that some crisis is imminent – and that the risk of war will rise in the coming years. This is especially true if China cannot engineer a recession to get the Kuomintang back into power in 2024. However, from a fundamentally geopolitical point of view, any attack is bound to be a surprise and hence investors should be prepared. The three main conditions for a conflict over Taiwan are: (1) Chinese domestic instability (2) an American transfer of game-changing offensive weapon systems to Taiwan (3) a formal Taiwanese movement toward independence. The likeliest of these, by far, is Chinese instability. Matt Gertken Vice President Geopolitical Strategy mattg@bcaresearch.com Footnotes 1 See Dina Smeltz and Craig Kafura, "For First Time, Half Of Americans Favor Defending Taiwan If China Invades," Chicago Council on Global Affairs, August 26, 2021, thechicagocouncil.org. 2 See Lu Hui, "Xi says ‘China must be, will be reunified’ as key anniversary marked," Xinhua, January 2, 2019, Xinhuanet.com. For a less alarmist reading of Xi’s recent speeches, see David Sacks, "What Xi Jinping’s Major Speech Means For Taiwan," Council on Foreign Relations, July 6, 2021, cfr.org. 3 See Ian Easton, "Will America Defend Taiwan? Here’s What History Says," Strategika, Hoover Institution, June 30, 2021, hoover.org. 4 See Tsai Ing-wen, "Taiwan and the Fight for Democracy," Foreign Affairs, November/December 2021, foreignaffairs.com. 5 See Gordon Lubold, "U.S. Troops Have Been Deployed In Taiwan For At Least A Year," Wall Street Journal, October 7, 2021, wsj.com. 6 Office of the US Trade Representative, "Fact Sheet: The Biden-Harris Administration’s New Approach To The U.S.-China Trade Relationship," October 4, 2021, ustr.gov.
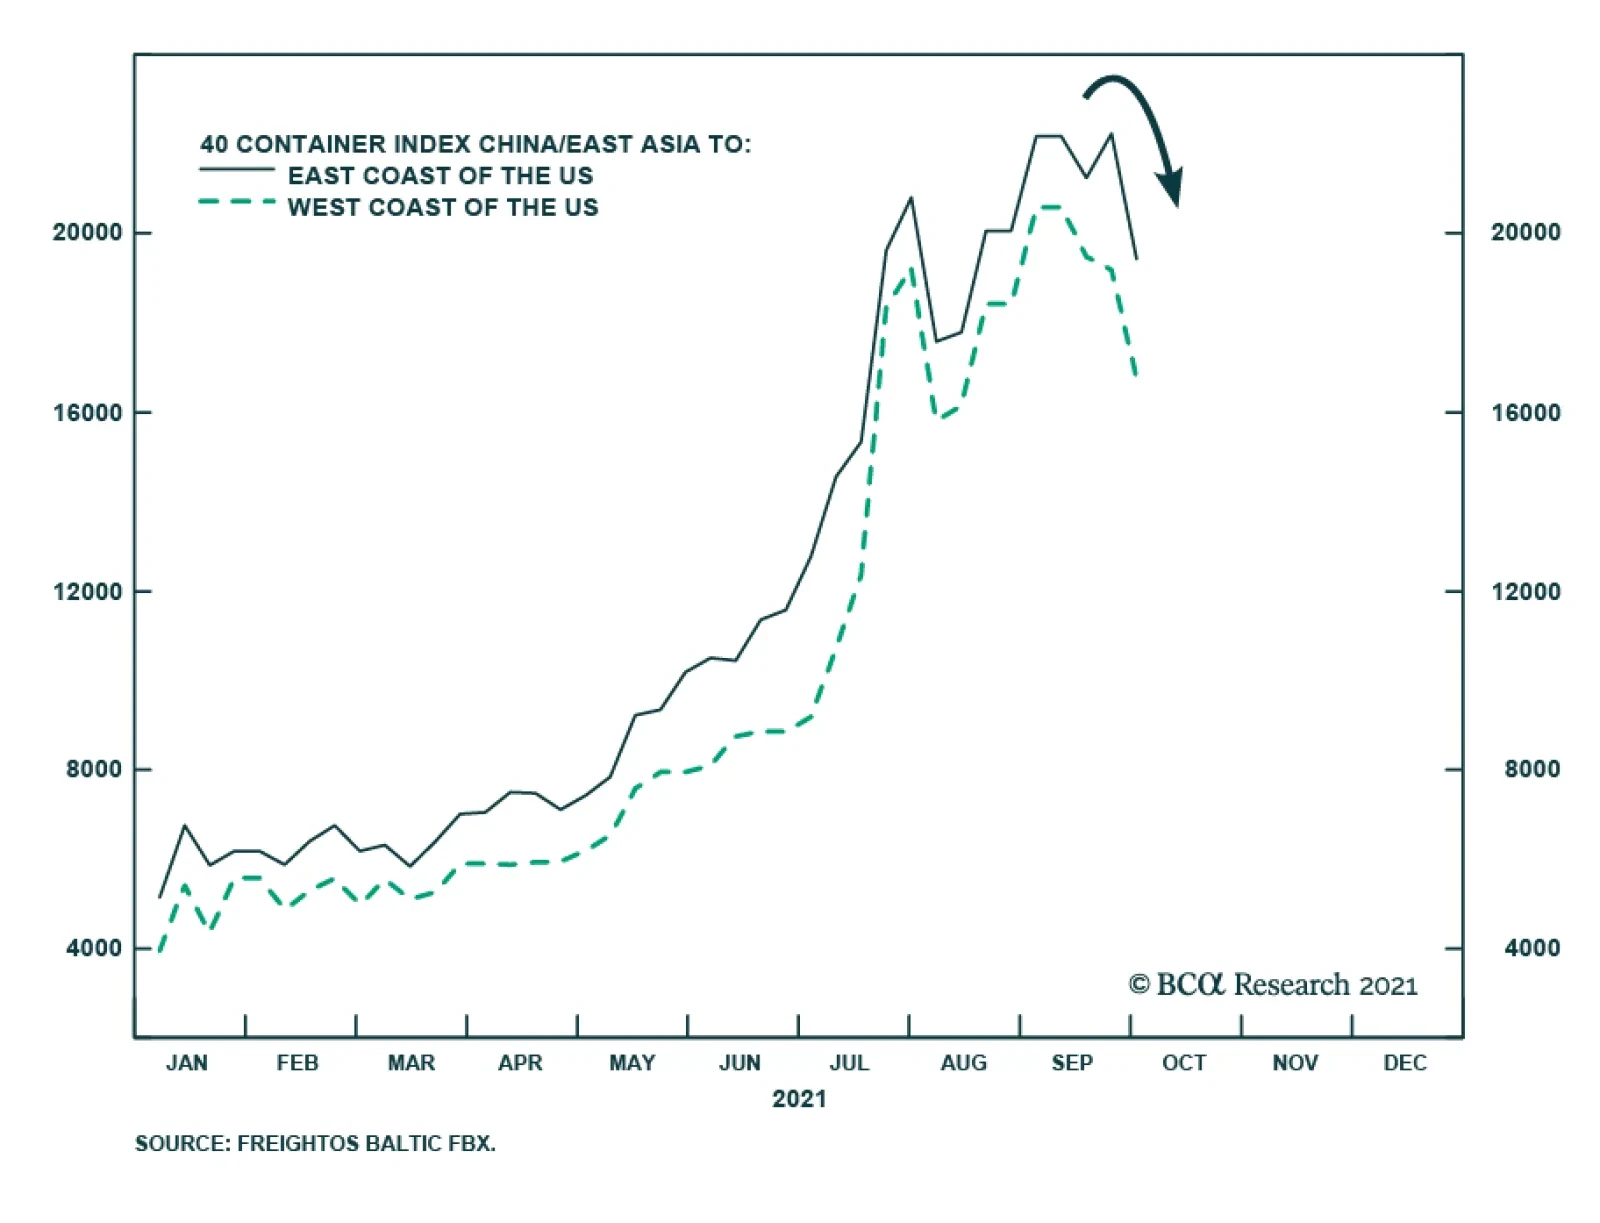
Following an eye-popping 313% rally in the Baltic Dry Index this year, there is some sign of reprieve. Shipping costs for the China – US route appear to be in the process of peaking. The latest weekly data show that the price fell to the lowest since…
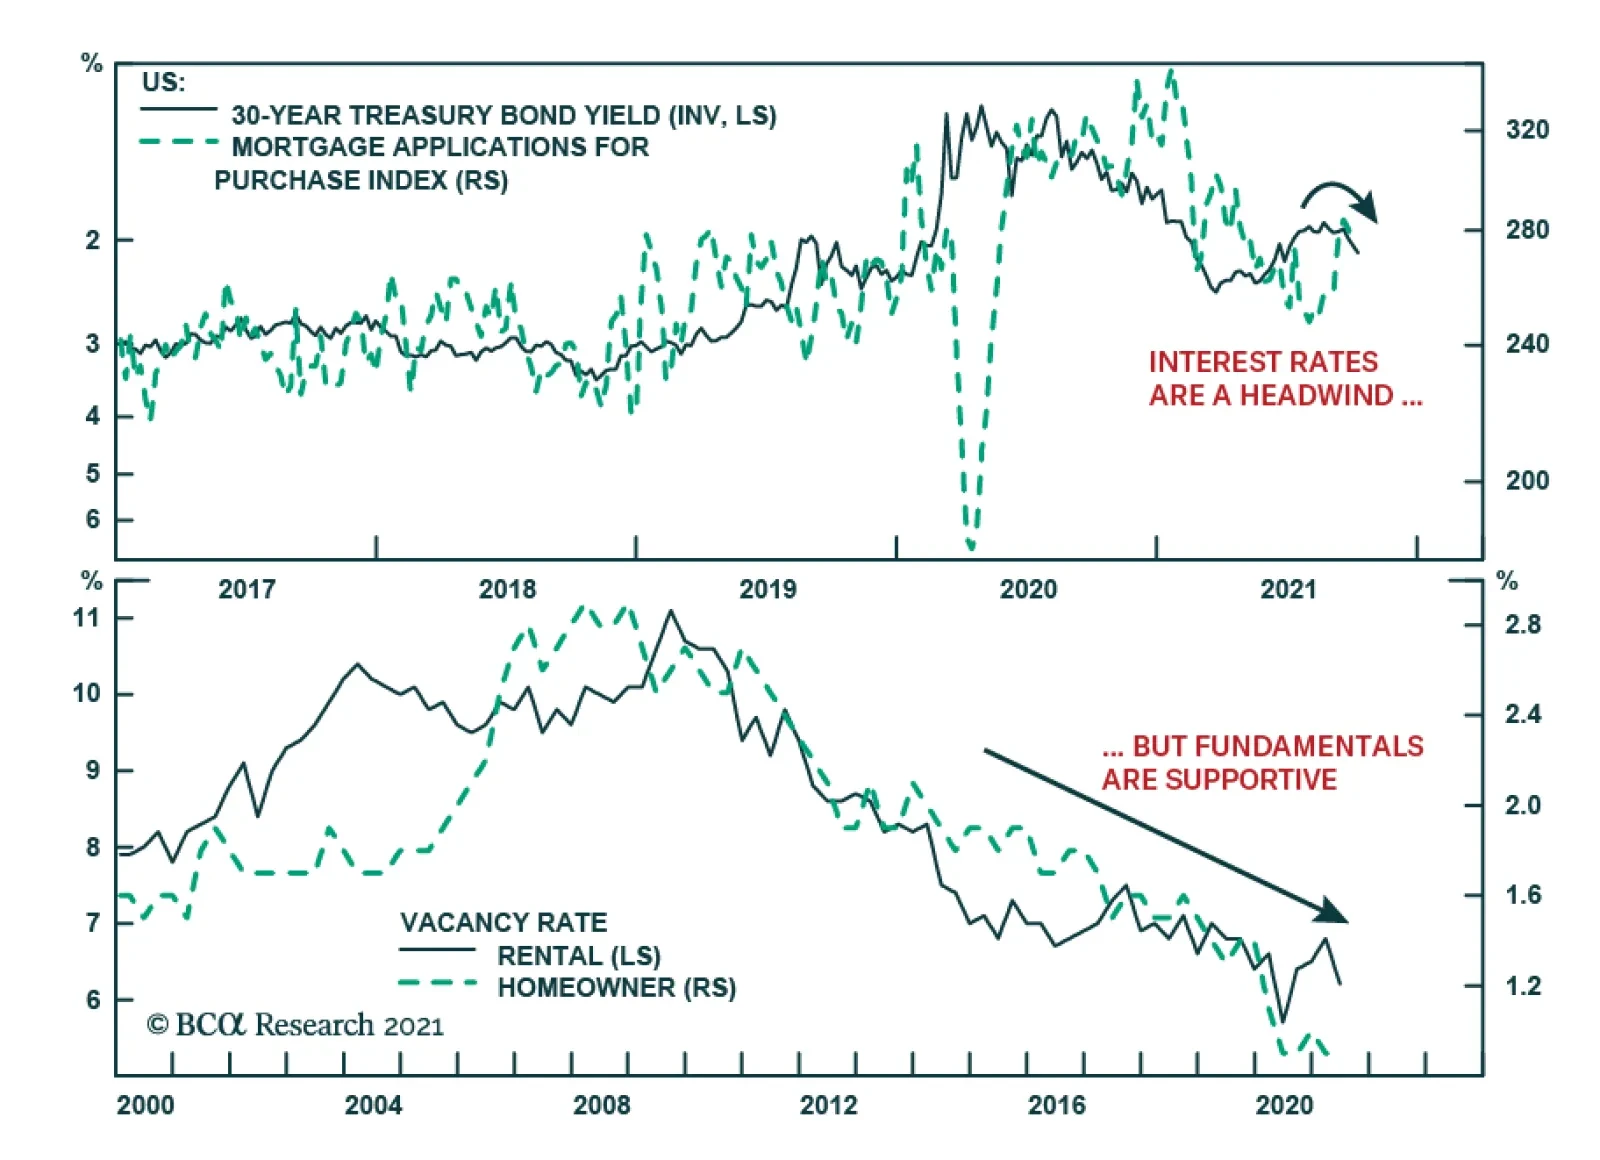
The US MBA mortgage applications index declined 6.9% in the week ending October 1. The decline occurred in both the purchases index as well as refinancing. The deterioration is not surprising. Mortgage applications tend to track bond yields quite closely…
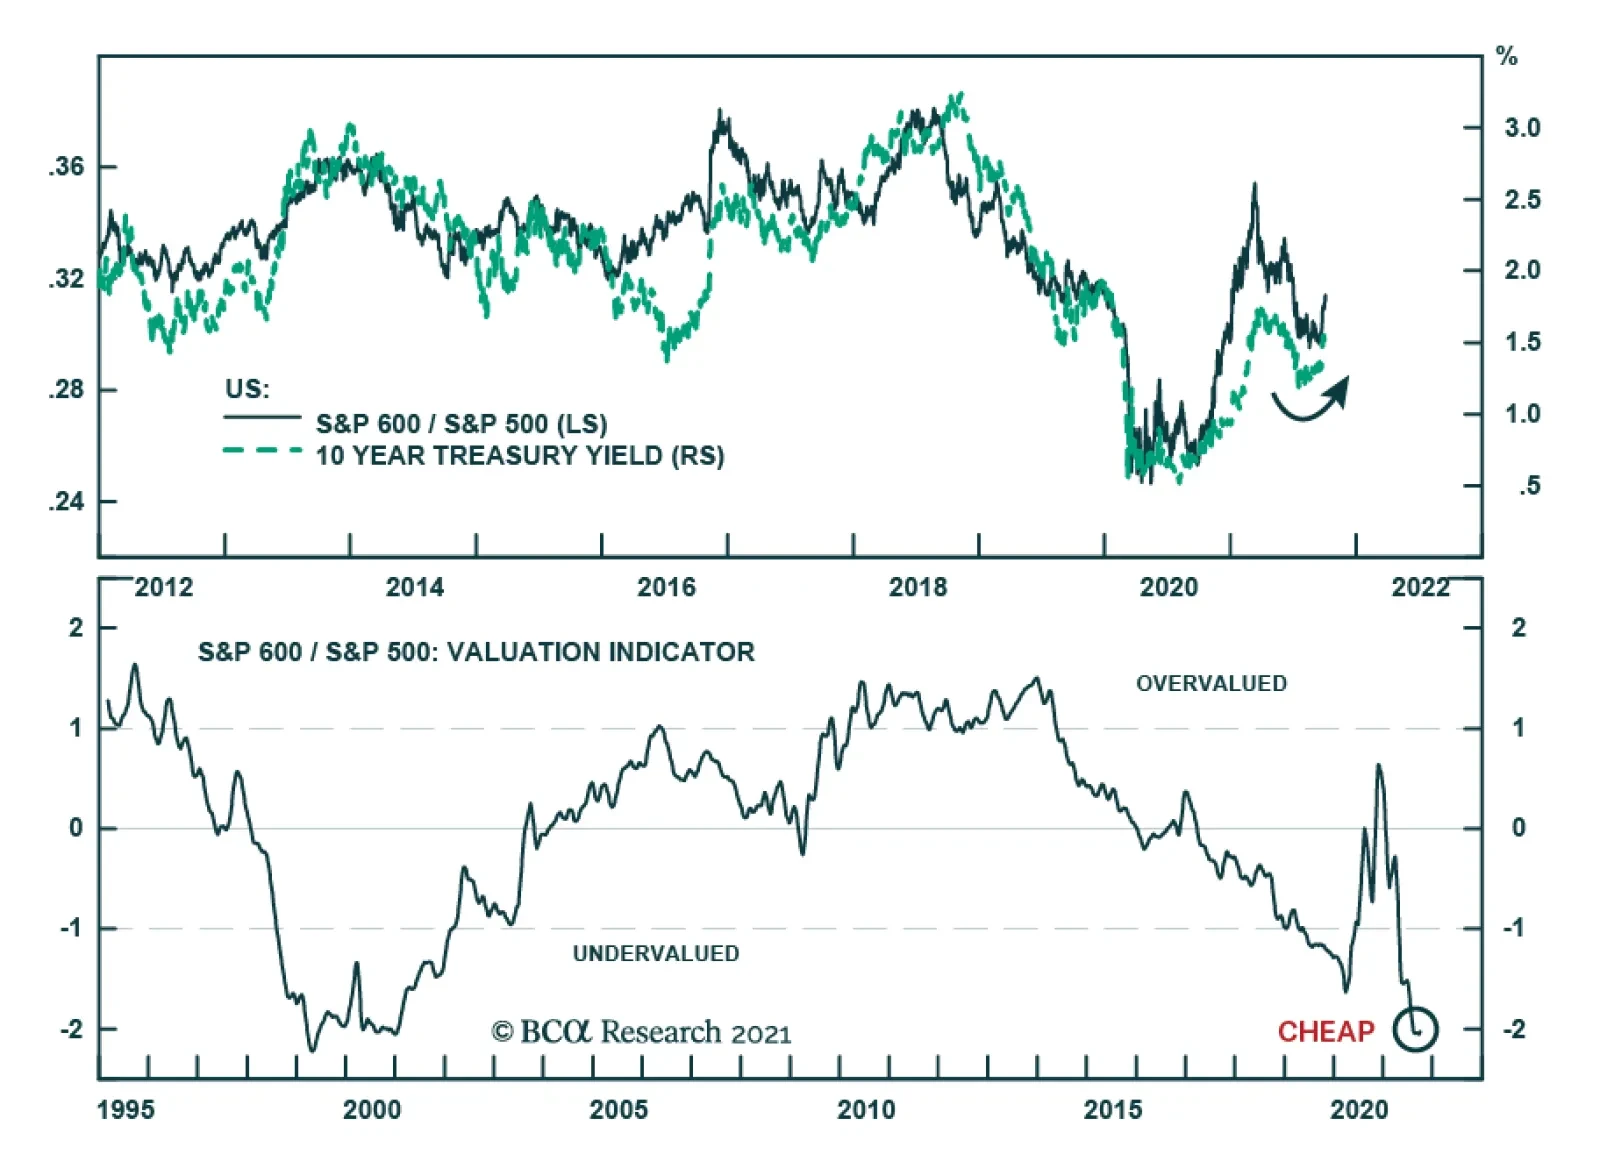
The past two weeks have been characterized by a rotation in US equities. Sectors and styles that are sensitive to rising interest rates such as real estate, tech, and growth stocks have been underperforming. Meanwhile, less rate-sensitive equities –…