United States

Highlights Monetary Policy: Last week’s numerous central bank meetings across the world confirmed that the overall direction for global monetary policy is shifting in a more hawkish direction. The main reason: growing fears that elevated inflation will persist for much longer than expected, even with global growth having lost some momentum. Country Allocation: The relative degrees of central banker hawkishness support our current government bond country allocation strategy. Stay underweight the US, UK, Canada, New Zealand and Norway where markets are discounting a path for future policy rates over the next two years that is too flat. Remain overweight countries where there is less need for a more aggressive tightening response: the euro area (both the core and periphery), Australia, Sweden and Japan. Still The Only Game In Town Last week was a busy one for global bond markets, with no fewer than 14 central banks within both the developed markets (DM) and emerging markets (EM) holding policy meetings. The results were eventful: Within EM, Brazil and Hungary lifted policy rates. Norway followed suit to become the first G-10 central bank to hike during the COVID era. The Fed teed up a formal announcement on tapering asset purchases at the next FOMC meeting in November. The Bank of England (BoE) gave strong hints that rate hikes could come sooner than expected, perhaps even before year-end. Chart of the WeekMonetary Policy Backdrop Turning More Bond-Bearish
Monetary Policy Backdrop Turning More Bond-Bearish
Monetary Policy Backdrop Turning More Bond-Bearish
Global bond yields in the developed markets took notice of the change in central bank guidance, especially from the Fed and BoE. The benchmark 10-year US Treasury yield rose from a pre-FOMC low of 1.30% to an intraday high of 1.57% yesterday – a level last seen late June. Longer-dated yields in the UK also rose significantly, with the 30-year Gilt yield rising from a pre-BoE meeting low of 1.11% to an intraday high of 1.40% yesterday – also the highest level since June. The pull on yields extended to other countries, as well, with 10-year yields in Germany, Canada and Australia climbing to three-month highs. The overall message from all of those policy meetings was one of an incremental shift toward less accommodative policies, even as the pace of global economic growth has slowed in recent months. Policymakers are growing more concerned that higher inflation could linger for longer (Chart of the Week). At the same time, loose policy settings have fueled a boom in asset markets that supports growth through easy financial conditions, but also raises future stability risks that worry the central banks. The number of countries seeing actual rate hikes is growing. Our Global Monetary Policy Tightening Indicator shows that just over one-quarter of G-10 and EM central banks have lifted rates over the past three months (Chart 2). All but one (Norway) are in EM, where policymakers have had to act more mechanistically in response to high inflation, even with softening economic growth momentum. While the slower pace of growth is more visible in EM relative to DM, when looking at cyclical indicators like manufacturing PMIs, inflation rates are simply too high around the world for inflation-targeting central banks to ignore (Chart 3). Chart 2Our Global Monetary Policy Indicator Shows A More Hawkish Turn
Our Global Monetary Policy Indicator Shows A More Hawkish Turn
Our Global Monetary Policy Indicator Shows A More Hawkish Turn
Chart 3Global CBs Growing More Worried About Inflation Risks
Global CBs Growing More Worried About Inflation Risks
Global CBs Growing More Worried About Inflation Risks
Within the major DM countries, there has been a notable shift in interest rate expectations in a more hawkish direction. Interest rate markets are, for the most part, still underestimating the potential for tighter monetary policies over the next couple of years. This is the main reason why we continue to recommend an overall below-benchmark strategic stance on global duration exposure. However, the relative expected pace of rate hikes also informs our views on country allocation. In Table 1, we show expectations for the timing of the next rate hike, as well as the cumulative amount of rate increases to the end of 2024, that are currently discounted in DM overnight index swap (OIS) curves. We present the latest level for both, as well as the reading from earlier this month to see how expectations have changed. Table 1Markets Still Pricing Very Modest Tightening Cycles
Marking-To-Market Our Bond Calls After "Central Bank Week"
Marking-To-Market Our Bond Calls After "Central Bank Week"
The so-called “liftoff date” for the first rate hike has been most notably pulled forward in the UK from January 2023 to May 2022, while other countries have seen more modest shifts in the timing of the next rate increase. More importantly, the discounted pace of rate hikes to end-2024 for all countries shown in the table has increased since early September (including Norway, factoring in last week’s tightening move by the Norges Bank). In our view, the biggest driver of relative government bond market yield movements and returns over the next 6-12 months will be the relative adjustments in the expected pace of rate hikes. On that front, the biggest shift higher in cumulative tightening has occurred in countries where we are more pessimistic on government bond performance on a relative basis to the global benchmark: the US, Canada, the UK and Norway. The smaller increases in the pace of hikes have occurred in our more preferred markets – Australia, Sweden, the euro area, and Japan. Assessing Our Two Biggest Government Bond Underweights: The US & UK For last week’s Fed meeting, a new set of economic and interest rate projections from the FOMC members (“the dots”) were presented (Chart 4). Compared to the forecasts from the June meeting, US real GDP growth expectations for 2021 were revised down (5.9% vs 7.6%) but were boosted for 2022 (3.8% vs 3.3%) and 2023 (2.5% vs 2.4%). A new forecast for 2024 was added, coming in at 2.0%. Importantly, none of those growth forecasts was below the median FOMC estimate of the longer-run real GDP growth rate of 1.8% (top panel). In other words, the Fed is not anticipating below-trend growth anytime in the next three years. Chart 4The Fed’s Rate Projections Look Too Low
Marking-To-Market Our Bond Calls After "Central Bank Week"
Marking-To-Market Our Bond Calls After "Central Bank Week"
The same conclusion goes for the US unemployment rate (second panel), with the median FOMC projection for 2022 (3.8%), 2023 (3.5%) and 2024 (3.5%) all below the median longer-run “full employment” estimate of 4.0%. The forecasts for US inflation (third panel) reflect that persistent low level of unemployment. Headline PCE inflation is expected to end 2021 at 4.2%, to be followed by a somewhat slower pace – but still above the 2% Fed inflation target – in 2022 (2.2%), 2023 (2.2%) and 2024 (2.1%). Yet despite these forecasts that show US growth and inflation exceeding its longer-run estimates for the next few years, the FOMC is projecting a relatively slow upward path for interest rates. The median dot now calls for the Fed to hike the funds rate once in 2022 and three more times in both 2023 and 2024. This would bring the funds rate to 1.75% by the end of 2024 – still 75bps below the Fed’s estimate of the longer-run “neutral” funds rate of 2.5% (bottom panel). That projected path for the funds rate is higher than the June dots, which only called for 75bps of cumulative hikes to the end of 2023. There is a wide divergence of opinions on the future path of rates within the FOMC, but the hawks appear to be winning the internal battle (Chart 5). There is now a 9-9 split of FOMC members who are calling for a rate hike in 2022, compared to a 7-11 split back in June, while the number of those projecting a funds rate above 1% in 2023 rose from 5 to 9. Chart 5A Wide Dispersion Of FOMC Interest Rate Views For 2023/24
A Wide Dispersion Of FOMC Interest Rate Views For 2023/24
A Wide Dispersion Of FOMC Interest Rate Views For 2023/24
One area where there does appear to be a consensus is on the timing and pace of tapering. Fed Chair Powell noted at his post-FOMC press conference that an announcement on the reduction of Fed asset purchases could come as soon as the next FOMC meeting on November 6. Powell also signaled that there was general agreement on the FOMC that the taper should end by mid-2022, barring any economic setbacks. That would likely open the door to a rate hike in the latter half of next year, given the Fed’s longstanding view that lifting the funds rate should only occur after tapering is complete, to avoid sending conflicting signals about the Fed’s policy bias. It is clear that the Fed’s policy guidance has shifted incrementally in a more hawkish direction, and confirms our long-held expectation that tapering would be announced by year-end, with rate hikes to begin in late 2022. This dovetails with our recommended investment positioning in the US Treasury market for the next 12-18 months. Maintain a below-benchmark US duration exposure, with a curve-flattening bias, while staying underweight US Treasuries in global (USD-hedged) fixed income portfolios (Chart 6). Our other high-conviction underweight government bond call is in the UK. The BoE’s recent messaging has turned more hawkish in a very short period of time, justifying our decision to downgrade our recommended UK Gilt exposure to underweight last month.1 The BoE Monetary Policy Committee had already sharply upgraded its inflation forecast for the end of 2021 to just above 4% at the last policy meeting in August. That was categorized as just a temporary surge due to rising energy prices and goods prices elevated by shorter-term global supply chain bottlenecks. At last week’s meeting, however, the MPC noted that +4% UK inflation could persist into Q2 2022 because of the current surge in wholesale natural gas prices that has driven many UK gas suppliers out of business (Chart 7). Chart 6Our Recommended Strategy For US Treasuries
Our Recommended Strategy For US Treasuries
Our Recommended Strategy For US Treasuries
Chart 7BoE Growing More Worried About Inflation
BoE Growing More Worried About Inflation
BoE Growing More Worried About Inflation
Chart 8Our Recommended Strategy For UK Gilts
Our Recommended Strategy For UK Gilts
Our Recommended Strategy For UK Gilts
The official view of the BoE has been like that of other central banks, that much of the current high inflation is supply driven and, hence, will not last. Yet within the MPC, there is clearly some growing nervousness about high realized inflation becoming more embedded in longer-term inflation expectations, which are moving higher. BoE Governor Andrew Bailey has noted in recent speeches that there was a growing case for interest rate hikes because of stubbornly higher inflation. Two members of the MPC even voted last week to reduce the size of the BoE’s QE program that is already set to end in just three months. The markets have begun to heed the more hawkish signals from the BoE. Our 24-month UK discounter, measuring the amount of rate hikes priced into the UK OIS curve, has jumped 24bps since September 7 (Chart 8). Over that same period, UK Gilts have underperformed the Bloomberg Barclays Global Treasury index by 108bps (on a USD-hedged and duration-matched basis). We are sticking with our underweight recommendation on UK Gilts, as there are still too few rate hikes priced into the UK curve relative to the BoE’s guidance and upside inflation risks. What About The BoJ? Same Old, Same Old Chart 9Reasons Why JGBs Will Outperform
Reasons Why JGBs Will Outperform
Reasons Why JGBs Will Outperform
Lost amid the hawkish din from the Fed and BoE meetings last week was the Bank of Japan (BoJ) meeting. The message from policymakers in Tokyo was predictably dovish, as Japan has not seen anything resembling the high inflation that has pushed central bankers elsewhere in a more hawkish direction. Japanese growth has also not seen the same magnitude of recovery from the pandemic shock as the other major developed markets, despite suffering comparable losses during the 2020 recession (Chart 9). One of the main reasons has been that Japan’s vaccine rollouts were much slower than those of other major countries. This forced an extension of emergency lockdowns and other economic restrictions that depressed domestic demand and delayed a return to normal economic activity (second panel). COVID outbreaks even cost Japan the one-time economic windfall from hosting an Olympics, with the Tokyo Games first delayed by a year and then taking place with no fans. Japan has also not suffered any of the higher inflation rates witnessed elsewhere over the past year, despite presumably facing many of the same inflationary forces from global supply chain disruption (third panel). Both headline and core CPI inflation are now in deflation. Governor Haruhiko Kuroda stated last week that it will take longer for Japan to see inflation return back to its 2% target than other developed countries, with the official BoJ forecast calling for that level to be reached by 2023 – a forecast that appears too optimistic. We continue to view Japanese government bonds (JGBs) as a relative safe haven during the period of rising global bond yields that we expect over the next 6-12 months. The BoJ is nowhere close to seeing the conditions necessary to begin exiting its Yield Curve Control and negative interest rate policies, both of which have crushed JGB volatility and kept longer-term bond yields hovering near 0%. We continue to recommend a moderate overweight stance on Japan in global government bond portfolios, particularly on a USD-hedged basis to make the yields more attractive. The Scandinavian Policy Divergence Last week, the Norges Bank raised its benchmark interest rate from 0% to 0.25% (Chart 10), stating that a normalizing economy requires a gradual normalization in monetary policy. The bank’s decision reflects idiosyncratic factors unique to the Norwegian economy, but also some of the same broader themes that are forcing other central banks in a more hawkish direction. As a small economy driven heavily by oil exports, both the Norwegian krone and the price of oil weigh heavily on the policy decisions of the Norges Bank. On that front, the rise in energy prices since the crisis has outpaced the appreciation in the krone (Chart 10, top panel). With this relative weakness in the krone comes higher import price inflation and increased export competitiveness, both of which mean that the Norges Bank must pull forward its path of rate hikes to compensate. As opposed to other G10 central banks, the Norges Bank clearly believes a pre-emptive move on rates is necessary to nip future inflation risk in the bud. The bank expects that increased capacity utilization and wage growth will help push up underlying inflation to approximately 1.9% by the end of 2024, with the ongoing supply chain disruptions creating additional upside risk to that forecast. Like other G10 banks, however, the Norges Bank is concerned about increasing financial imbalances. The Norwegian house price-to-disposable income ratio is now at all-time highs and the Norges Bank expects it to remain elevated to the end of its forecast horizon (Chart 10, bottom panel). With the growth in house prices substantially outpacing income growth during the pandemic, housing market vulnerabilities have increased as households have taken on greater leverage to enter the market. In contrast to the Norges Bank, the other major Scandinavian central bank, Sweden’s Riksbank, has hewed more closely to the prevailing global monetary policy orthodoxy – avoiding pre-emptive policy tightening in order to boost inflation. The central bank chose to hold its repo rate at 0% at last week’s policy meeting, even with a Swedish economy that has recovered the 2020 pandemic losses and is projected to return to pre-COVID growth rates in 2022 (Chart 11). In its decision, the Riksbank mirrored rhetoric from the Fed and ECB, citing that high inflation was driven by rising energy prices and supply logjams, both factors which are expected to subside over the coming year (Chart 11, middle panel). Both headline and core versions of the bank’s favored CPI-F (CPI with Fixed Interest Rate) measure are projected by the Riksbank to remain below target in 2022, reaching 2% only in 2024. Chart 10The Norges Bank Isn't Waiting Around...
The Norges Bank Isn't Waiting Around...
The Norges Bank Isn't Waiting Around...
Chart 11...But The Riksbank Will Remain Patient
...But The Riksbank Will Remain Patient
...But The Riksbank Will Remain Patient
Chart 12The Central Bank Story Will Further Widen The Norway-Sweden Spread
The Central Bank Story Will Further Widen The Norway-Sweden Spread
The Central Bank Story Will Further Widen The Norway-Sweden Spread
The Riksbank is less willing than the Norges Bank to respond to temporarily higher inflation because of the former’s growing reluctance to return to negative nominal interest rates in response to an economic shock. The Riksbank would likely be more comfortable in lifting nominal rates only when real rates were significantly lower than current levels, which requires higher inflation. In contrast to the neighboring Norges Bank, the Riksbank has an additional tool which it can use to express shifts in monetary policy—the size of its balance sheet. The bank forecasts that holdings of securities will remain unchanged in 2022 (Chart 11, bottom panel), implying that purchases, net of redemptions, will be drawn down roughly to zero. However, the bank does believe that the existing stock of purchases will continue to support financial conditions. Chart 12 shows the impact of the Norges Bank’s relatively hawkish reaction function. Despite relatively similar underlying growth and inflation profiles, sovereign debt from Norway has markedly underperformed Swedish counterparts, a dynamic that has been even more obvious since the pandemic. On the currency side, the NOK/SEK cross has recovered much of the losses from 2020, and will likely rally further as Norway-Sweden rate differentials will turn even more favorable for the NOK. Relative to the global benchmark on a currency-hedged and duration-matched basis, Norwegian government debt has underperformed much more than Sweden following the pandemic. We see these tends continuing over the next 6-12 months, with the Norges Bank likely to remain far more hawkish than the Riksbank. Our bias is to favor Swedish sovereign debt over Norwegian government bonds. Robert Robis, CFA Chief Fixed Income Strategist rrobis@bcaresearch.com Shakti Sharma Senior Analyst ShaktiS@bcaresearch.com Ray Park, CFA Research Analyst ray@bcaresearch.com Footnotes 1 Please see BCA Research Global Fixed Income Strategy/European Investment Strategy Report, "The UK Leads The Way", dated August 11, 2021, available at gfis.bcaresearch.com. Recommendations The GFIS Recommended Portfolio Vs. The Custom Benchmark Index
Marking-To-Market Our Bond Calls After "Central Bank Week"
Marking-To-Market Our Bond Calls After "Central Bank Week"
Duration Regional Allocation Spread Product Tactical Trades Yields & Returns Global Bond Yields Historical Returns
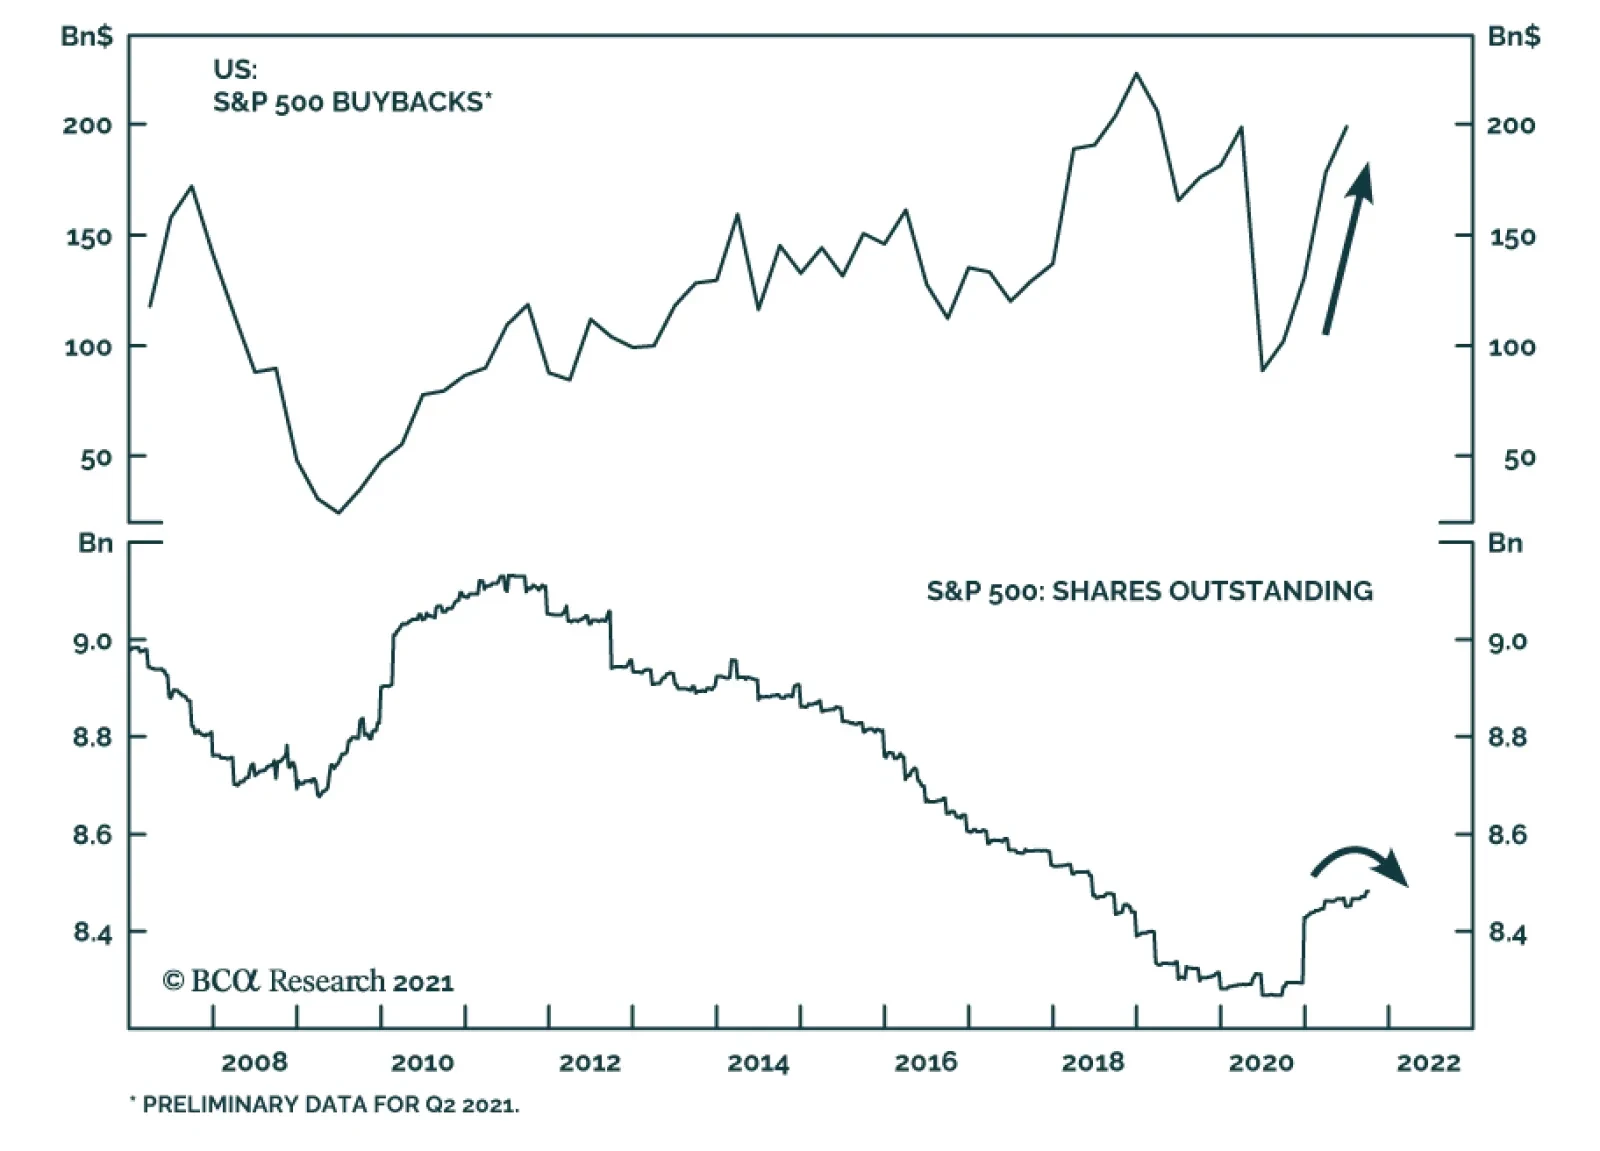
Market moves since the beginning of September have been characterized by a selloff in US Treasurys and a deterioration in US equity returns. The spectacular performance of US stocks thus far during the pandemic has stretched multiples to an extreme. These…
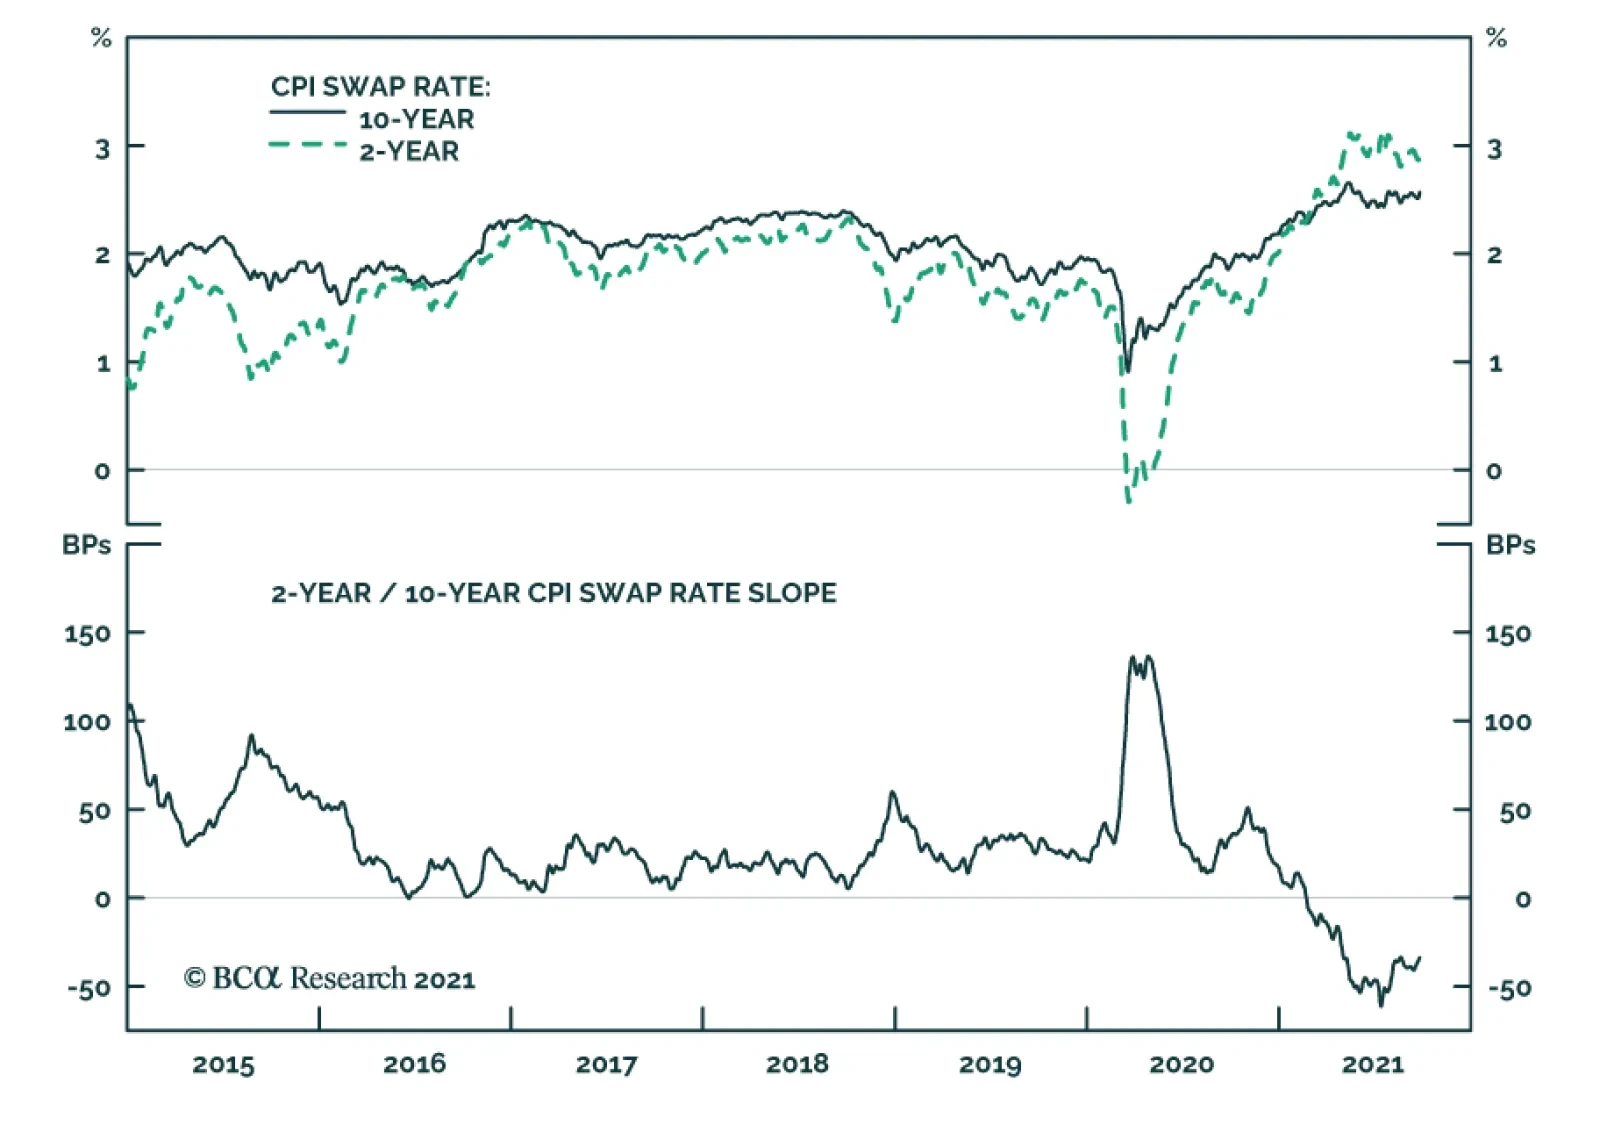
BCA Research’s US Bond Strategy services recommends investors enter 2/10 steepeners on the inflation compensation curve and/or 2/10 flatteners on the real (TIPS) curve. The increase in the 10-year nominal yield since last Wednesday was roughly evenly split…
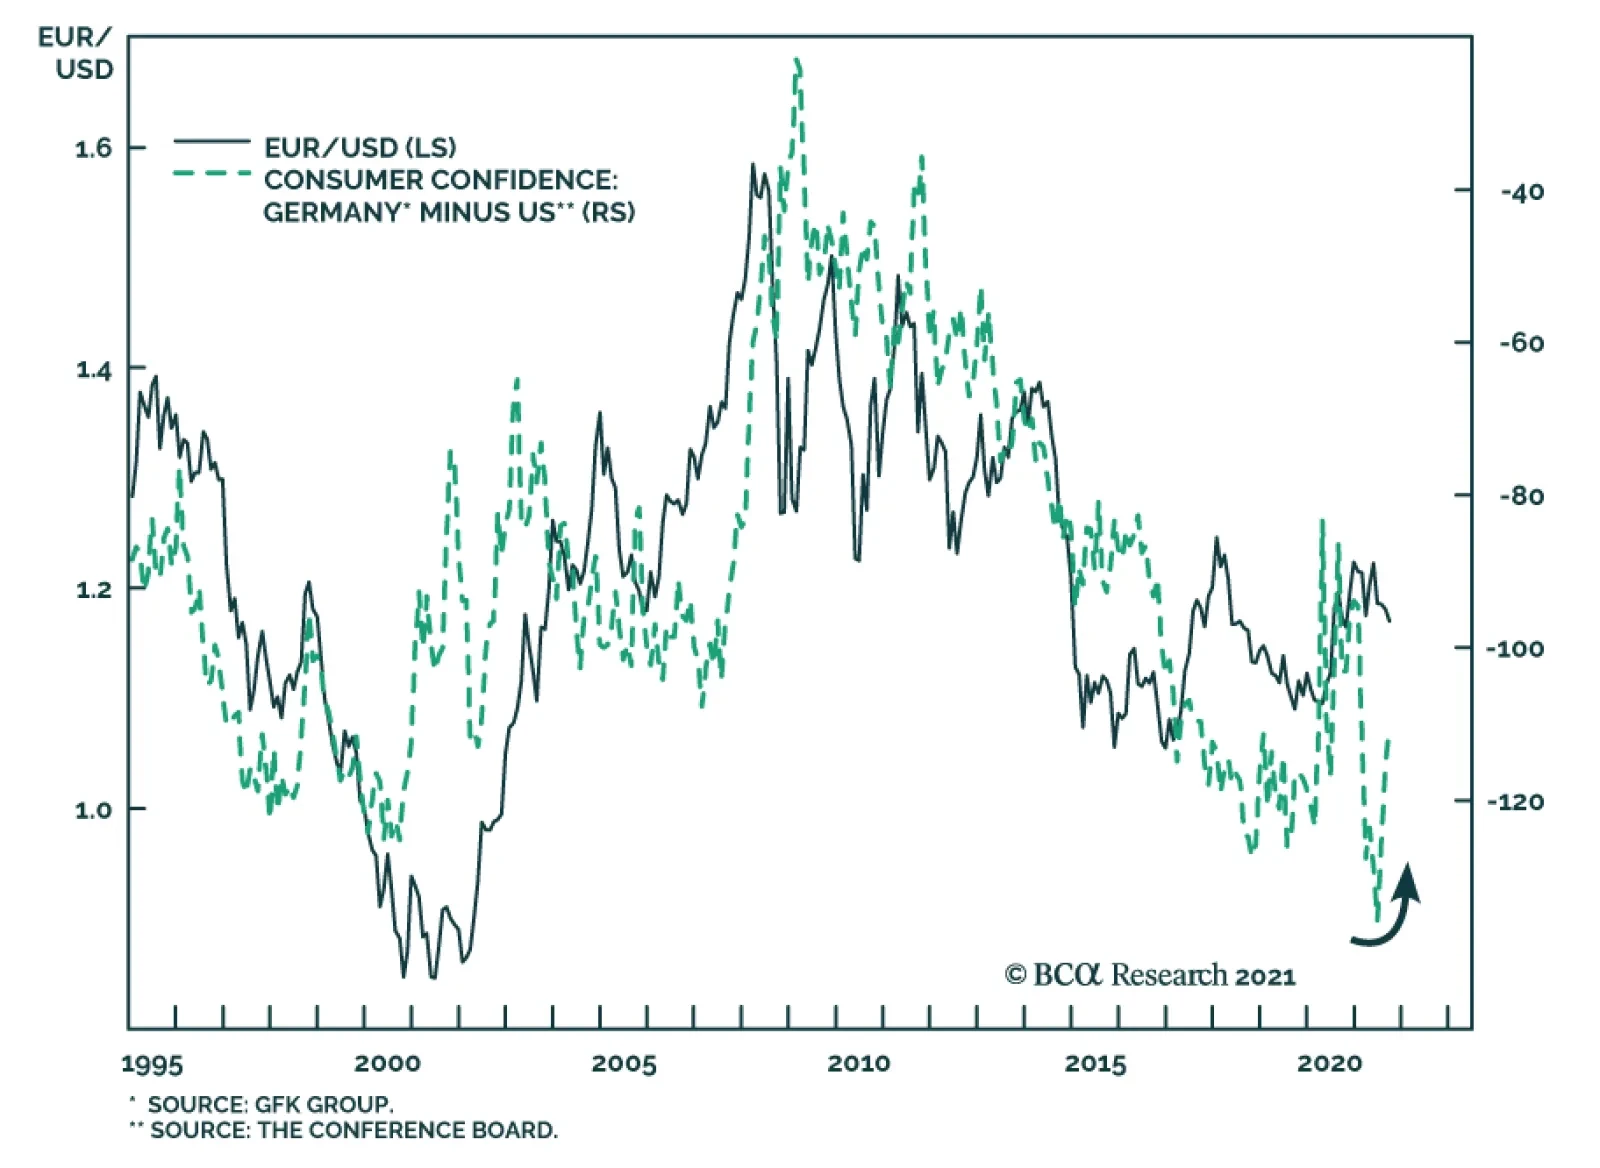
US and Euro Area measures of consumer confidence are diverging. According to the Conference Board survey, US consumer sentiment declined for the third consecutive month to a seven-month low of 109.3 in September. The nearly six-point drop is well below…
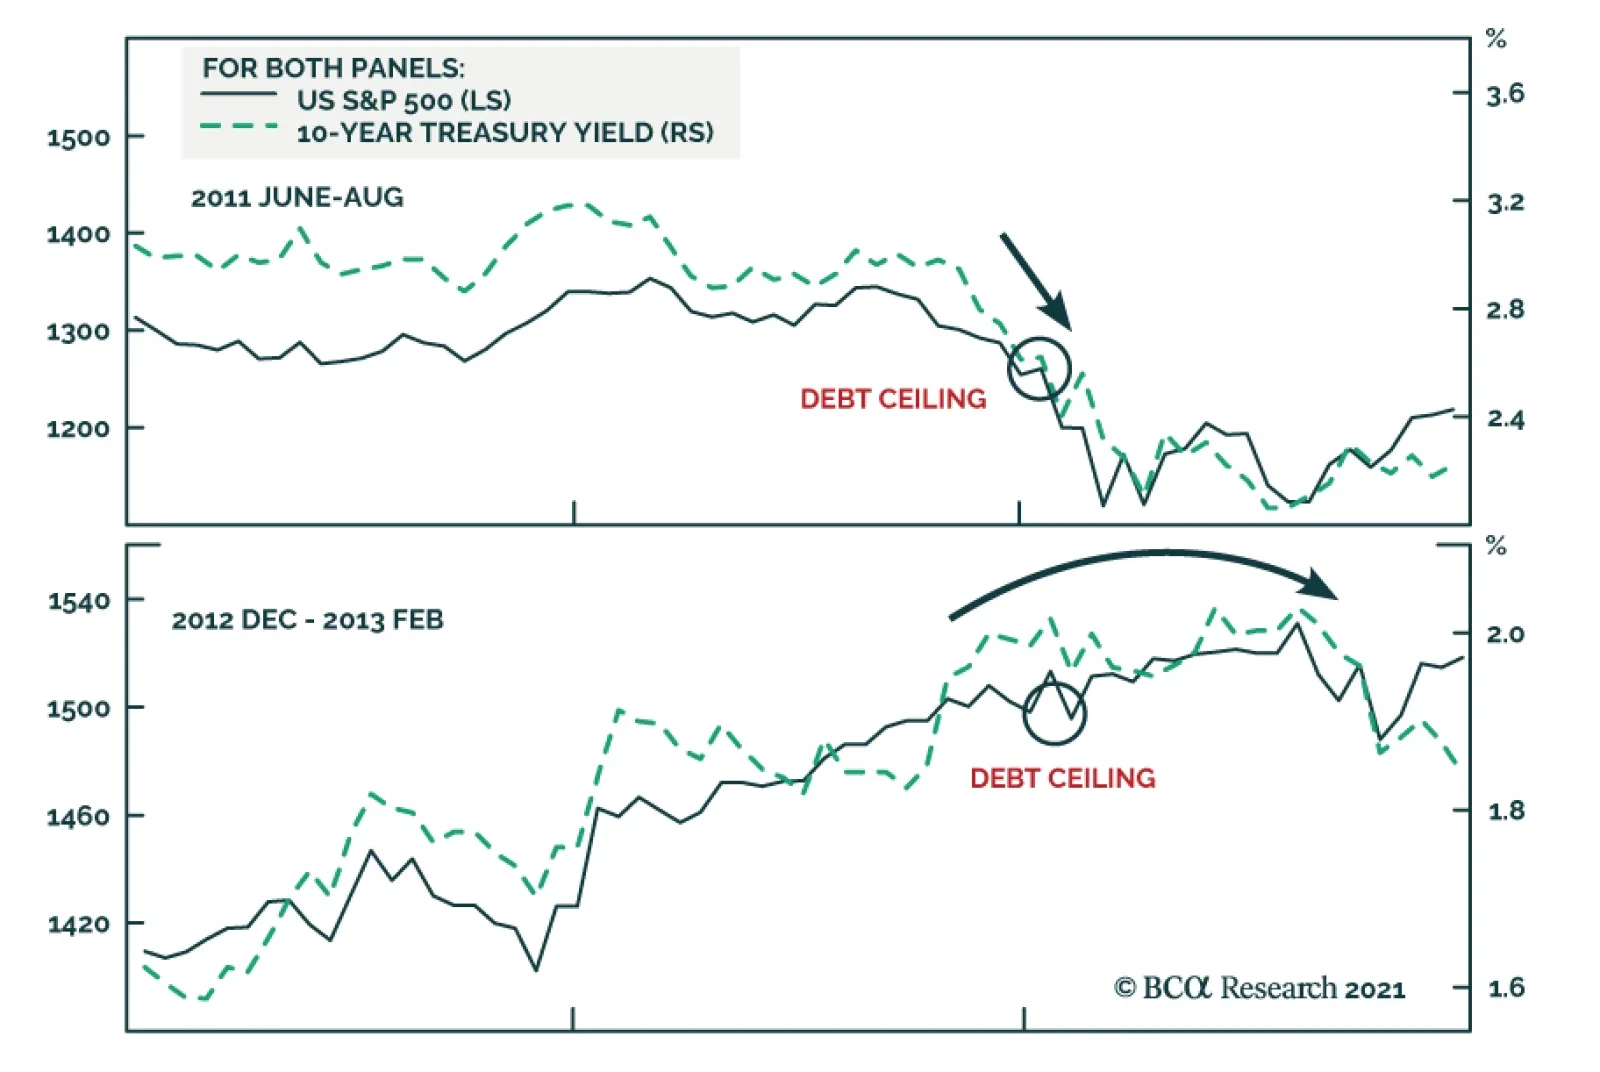
On Monday, Senate Republicans blocked a bill that would have extended federal funding to early December, provided emergency relief, and suspended the debt ceiling until December 2022. Democrats are now facing a tight deadline. Current funding expires on…
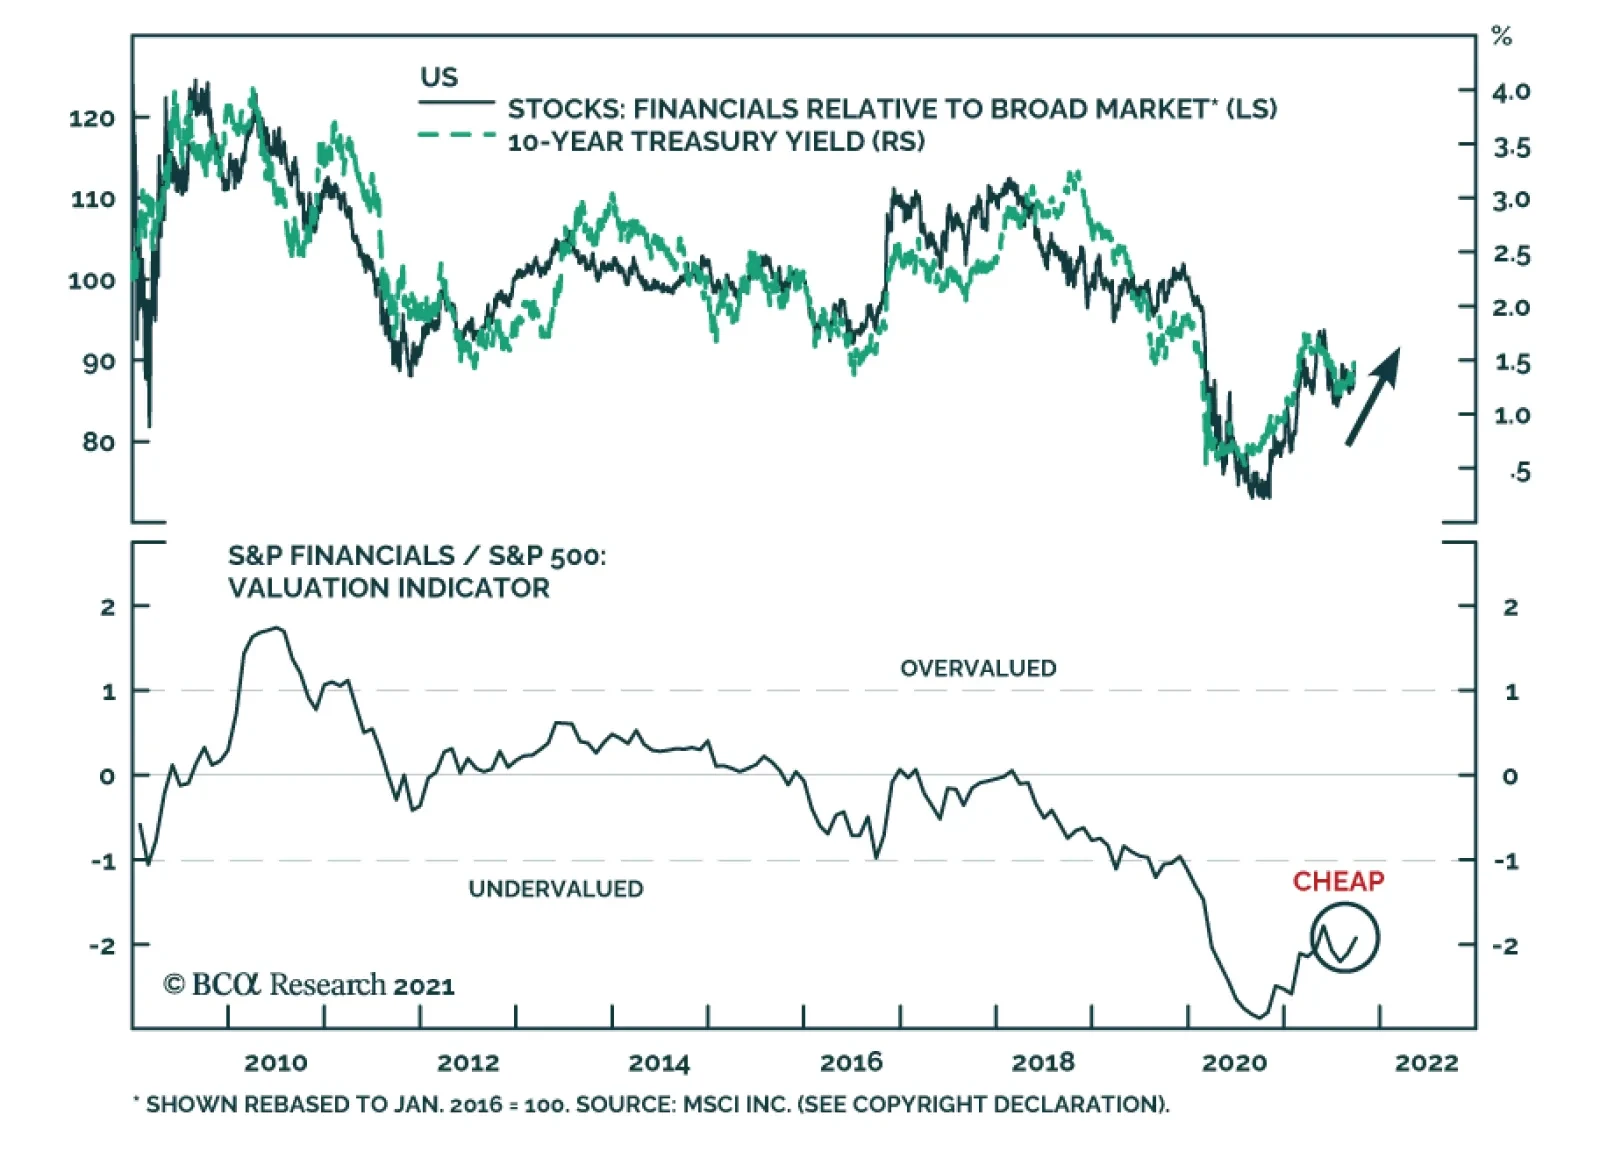
US Financials is among the best performing US equity sectors over the past three months. We expect these positive relative gains to continue. Financials will benefit from rising US bond yields over the coming year. Not only are higher interest rates…
August PPI reading came in at 8.3%. Naturally, many investors are wondering whether the companies will be able to pass their soaring input costs to the customers. An in-depth analysis of margins and pricing power requires a significant research effort. However, below are some examples illustrating our thinking process on the topic. We also included pricing power sector charts in the Appendix. Companies’ ability to hike prices is a function of the elasticity of demand, which is heterogeneous across industries and products. It also depends on product differentiation and competition in the industry. For some categories, such as consumer durables, pricing power has declined as prices reached the upper limit of affordability (Chart 1). As a result, durables goods manufacturers’ pricing power has peaked, and this sector is at a higher risk of margin squeeze. Margins of the Health Care sector have been under pressure for years (Chart 2). This can be tied back to Pharma being under perennial pressure from both politicians aiming to lower prescription drug prices, and from competition from the generics. Meanwhile, the Consumer Discretionary sector is in better shape thanks to pent-up demand for services and discretionary goods – consumers are in good financial health and are able to tolerate marginal prices increases. We expect discretionary and services industries to be able to maintain their margins. Bottom Line: The ability to exert pricing power and pass on costs to customers is highly industry-specific and can not be generalized. CHART 1
CHART 1
CHART 1
CHART 2
CHART 2
CHART 2
Appendix
CHART 3
CHART 3
CHART 4
CHART 4
Highlights Monetary Policy: It’s all but certain that tapering will begin next month and conclude by the middle of next year, but the FOMC is currently split right down the middle on whether it will be appropriate to lift rates in H2 2022. We present five factors to track to decide when the Fed will hike rates. Yield Curve: A bear-flattening of the nominal yield curve remains the most likely scenario for the next 6-12 months. Maintain a position short the 5-year bullet versus a duration-matched 2/10 barbell. TIPS: Investors should enter 2/10 steepeners on the inflation compensation curve and/or 2/10 flatteners on the real (TIPS) curve. The 2-year real yield, in particular, has a lot of upside during the next 6-12 months. EM Bonds: US bond investors should shift some allocation out of expensive US investment grade corporate bonds and into USD-denominated investment grade EM Sovereigns and Corporates where valuation is more compelling. Feature This past week was quite eventful for US bond investors. First, the Fed presented its September update on Wednesday, offering some hints about the timing and pace of asset purchase tapering alongside its updated economic and interest rate forecasts. Then, bonds sold off sharply on Thursday, Friday and Monday with the 10-year Treasury yield rising all the way to 1.49%. The first section of this week’s report looks at what we learned from last week’s FOMC meeting and opines on some monetary policy questions that remain unanswered. The second section updates our views on portfolio duration, the yield curve and TIPS in light of last week’s large market moves. Finally, we conclude with an update on the outlook for USD-denominated Emerging Market bonds. Powell Answers Some Small Questions, Avoids The Big One The Small Questions The start date for asset purchase tapering is the first small question that the Fed answered last week. A new sentence was added to the post-meeting statement saying that “a moderation in the pace of asset purchases may soon be warranted” and, in his press conference, Chair Powell clarified that the purpose of the new language is “to put notice out there that [tapering] could come as soon as the next meeting”. After this statement from the Fed, we expect asset purchase tapering to be announced at the next FOMC meeting on November 3rd. A delay until December is possible if September’s employment report is a massive disappointment, but the bar for delaying tapering beyond November appears high. Chair Powell also shed some light on a second small question related to the Fed’s balance sheet. Specifically, the pace of asset purchase tapering. In his press conference the Chair said that “participants generally view that, so long as the recovery remains on track, a gradual tapering process that concludes around the middle of next year is likely to be appropriate.” The information about the pace of tapering is slightly more interesting than the start date, if only because Fed policymakers have expressed a desire for net purchases to reach zero before the first interest rate increase. The fact that the Fed is planning to reach net zero purchases by the middle of next year suggests that it wants to leave the door open for a possible rate hike in the second half of 2022. This message was confirmed by the Fed’s updated interest rate projections (Chart 1). The projections revealed an even split (9 vs. 9) on the Committee between those that expect at least one 25 basis point rate increase before the end of 2022 and those that do not expect to lift rates next year. It’s also notable that, out of the 9 participants that don’t expect a rate hike in 2022, 8 anticipate lifting rates in 2023. Chart 1Rate Expectations
Rate Expectations
Rate Expectations
Of course, as Chair Powell often points out, the Fed’s interest rate projections are contingent on the future state of the economy and will almost certainly be revised as the outlook evolves. What’s more important from a forecasting perspective is knowing how the Fed will react to different economic conditions. The Big Question With that in mind, we know that the Fed has promised not to lift rates until the labor market reaches “maximum employment”. However, as we noted in a recent report, the Fed hasn’t provided much detail on what “maximum employment” actually means.1 Powell’s comments last week didn’t add much clarity, but we can hunt for clues in the Summary of Economic Projections (SEP). In the SEP, we first notice that 13 FOMC participants expect the unemployment rate to be 3.8% - 3.9% or lower by the end of 2022 (Chart 2A). It is logical to assume that this group includes the 9 participants who expect to lift rates in 2022 and 4 additional ones. We also observe that 17 out of 18 participants anticipate an unemployment rate of 3.8% - 3.9% or lower by the end of 2023 (Chart 2B), exactly matching the number of participants who expect to lift rates by then. We can therefore infer that the Fed views an unemployment rate of roughly 3.8% as consistent with “maximum employment”. That is, FOMC participants tend to have rate hikes penciled into their forecasts once the unemployment rate is below 3.8%. Chart 2AFOMC 2022 Unemployment Rate Projection Distribution
Damage Assessment
Damage Assessment
Chart 2BFOMC 2023 Unemployment Rate Projection Distribution
Damage Assessment
Damage Assessment
The SEP’s inflation forecasts are less illuminating than the unemployment ones. All but 4 participants expect core PCE inflation to be above the Fed’s 2% target at the end of 2022 (Chart 3A) and no FOMC participant is forecasting below-2% core PCE at the end of 2023 (Chart 3B).2 The most we can take away from these forecasts is that 14 FOMC participants expect inflation to be above target in 2022, but five of those participants don’t see the labor market as being tight enough to lift rates by then. Chart 3AFOMC 2022 Core PCE Inflation Rate Projection Distribution
Damage Assessment
Damage Assessment
Chart 3BFOMC 2023 Core PCE Inflation Rate Projection Distribution
Damage Assessment
Damage Assessment
The revelation that FOMC participants view a 3.8% unemployment rate as consistent with “maximum employment” is illuminating, but it doesn’t tell the entire story. We don’t know, for example, what assumptions about labor force participation the different Fed officials are using. Our sense is that the following five criteria will ultimately determine when the Fed starts to lift interest rates: An unemployment rate in the neighborhood of 3.8%. Prime-age (25-54) labor force participation close to its pre-pandemic level (Chart 4, top panel). Accelerating wage growth (Chart 4, bottom 2 panels). Long-dated inflation expectations at or above target levels (Chart 5, top 2 panels). Non-transitory inflation at or above target levels (Chart 5, bottom panel). Bottom Line: The FOMC is currently split right down the middle on whether it will be appropriate to lift rates in 2022, but these forecasts aren’t set in stone and next year’s economic data – particularly the five factors listed above – will determine which group is correct. Chart 4Part Rate & Wage Growth
Part Rate & Wage Growth
Part Rate & Wage Growth
Chart 5Inflation & Inflation Expectations
Inflation & Inflation Expectations
Inflation & Inflation Expectations
Our own view is that the labor market will be sufficiently tight for the Fed to deliver its first rate hike in December 2022, and that rate hikes will proceed more quickly than what is currently priced in the yield curve. US bond investors should maintain below-benchmark portfolio duration. The Fallout In Bond Markets Bonds sold off sharply last Thursday and again yesterday morning. At the time of publication, the 30-year Treasury yield had risen from 1.81% on Wednesday to 2.02% (Chart 6). The 10-year Treasury yield had risen from 1.30% to 1.49% (Chart 6, panel 2). The 5-year yield is up to 0.98% from 0.85% on Wednesday (Chart 6, panel 3), and the 2-year yield is up to 0.28% from 0.24% (Chart 6, panel 4). The yield curve has also steepened since Wednesday, though the 2/10 slope remains well below its March peak (Chart 7). The trend during the past few months has been one of curve steepening out to the 5-year maturity point (Chart 7, panel 2) and flattening beyond that point (Chart 7, bottom 2 panels). Recent market action has led to some steepening beyond the 5-year maturity, but so far that steepening is minor compared to the flattening move we’ve witnessed since the spring. Chart 6Treasury Yield Trends
Treasury Yield Trends
Treasury Yield Trends
Chart 7Treasury Curve Trends
Treasury Curve Trends
Treasury Curve Trends
Nominal Curve We have been recommending a position short the 5-year bullet and long a duration-matched barbell consisting of the 2-year and 10-year notes, and we think this trade will continue to outperform. First, the 5-year/5-year forward Treasury yield is back above 2%, consistent with median estimates of the long-run neutral fed funds rate from the New York Fed’s Surveys of Market Participants (2%) and Primary Dealers (2.25%) (Chart 6, bottom panel). We think it will be difficult for the 5-year/5-year forward yield to rise much above these levels, which makes curve flattening more likely than steepening going forward.3 Second, we updated our work on yield curve scenarios to incorporate recent market action and some new information gleaned from last week’s SEP. In this analysis we estimate fair value levels for different parts of the yield curve as of the end of 2022 based on a scenario for the path of the fed funds rate. For example, if we assume that Fed liftoff occurs in December 2022 and rate hikes proceed at a pace of 75 bps per year (the median pace in the SEP) until the fed funds rate levels-off at 2.08% (consistent with a 2%-2.25% range for the long-run neutral fed funds rate), we calculate that the 2-year yield has 74 bps of upside between now and the end of 2022. This is slightly more than the 65 bps of upside in the 5-year yield and much more than the 37 bps of upside in the 10-year yield (Table 1). Comparing this expected change to what is already discounted in the forward curve, we see that both the 2-year and 10-year yields are expected to exceed their forwards by 6 bps. The 5-year yield is expected to exceed its forward by 16 bps. Table 1Treasury Curve Scenario Analysis
Damage Assessment
Damage Assessment
To us, the message is clear. We want to remain short the 5-year note versus a duration-matched 2/10 barbell. Real & Inflation Curves Chart 8Real & Inflation Curves
Real & Inflation Curves
Real & Inflation Curves
The increase in the 10-year nominal yield since last Wednesday was roughly evenly split between the real and inflation compensation components. Interestingly, inflation drove a greater proportion of the increase at the front-end of the curve, and the 2-year real yield actually fell. We maintain a neutral recommendation on TIPS versus nominal Treasuries, but this week we recommend taking advantage of recent market action by implementing some curve trades across the real and inflation curves. Specifically, we note that the cost of short-maturity inflation compensation remains well above the cost of long-maturity inflation compensation (Chart 8). Going forward, the cost of front-end inflation compensation will fall as inflation moderates from its current extremely high level. Meanwhile, the cost of long-maturity inflation compensation will remain sticky near the Fed’s target levels. This will lead to a steepening of the inflation curve (Chart 8, panel 2). The combination of a steeper inflation curve and a flatter nominal curve will lead to a much flatter real yield curve (Chart 8, bottom 2 panels). The 2-year real yield, in particular, has a lot of upside if inflation moderates, as we expect, and the 2-year nominal yield rises in line with the projections shown in Table 1. Bottom Line: Investors should remain short the 5-year bullet versus a duration-matched 2/10 barbell on the nominal Treasury curve. Investors should also enter 2/10 steepeners on the inflation compensation curve and/or 2/10 flatteners on the real (TIPS) curve. A Quick Update On Emerging Market Bonds The collapse of Chinese real estate behemoth Evergrande dominated headlines for most of the past week, though so far there has been little contagion into USD-denominated credit markets. Unsurprisingly, the spread on Chinese corporate and quasi-sovereign bonds has widened, and there has been some passthrough into both the High-Yield EM USD Corporate & Quasi-Sovereign Index and the High-Yield EM USD Sovereign Index (Chart 9). However, investment grade EM credit spreads have been relatively unaffected by the turmoil, as have US corporate bond spreads (both IG and HY) (Chart 9, bottom 2 panels). While the Evergrande drama – and weakening Chinese economic growth in general – could weigh on USD-denominated EM bond performance in the near-term, we see an excellent buying opportunity in investment grade EM bonds on a 6-12 month horizon. Investment grade EM Sovereigns outperformed credit rating and duration-matched US corporate bonds in the early months of the recovery but have lagged during the past few months (Chart 10). The same is true for the investment grade EM Corporate and Quasi-Sovereign index (Chart 10, panel 3). This is not to say that EM bond performance has been poor – the EM Sovereign index is still up 97 bps versus duration-matched Treasuries on the year – it has simply failed to keep pace with the stellar performance of US corporate bonds. Chart 9No Contagion
No Contagion
No Contagion
Chart 10EM Bonds Versus US Corporates
EM Bonds Versus US Corporates
EM Bonds Versus US Corporates
But that recent stellar performance of US investment grade corporate bonds has left spreads in the sector near historically tight levels. In last week’s report we ran some scenarios for US investment grade corporate bond returns during the next 12 months and concluded that excess returns versus Treasuries are probably capped at 85 bps.4 This makes the current spread advantage in EM Sovereigns (Chart 10, panel 2) and EM Corporates & Quasi-Sovereigns (Chart 10, bottom panel) very compelling. This will be especially true if Emerging Market growth accelerates in 2022 on the back of increased Chinese stimulus and a COVID vaccination campaign that is already picking up steam.5 Bottom Line: US bond investors should shift some allocation out of expensive US investment grade corporate bonds and into USD-denominated investment grade EM Sovereigns and Corporates where valuation is more compelling. Ryan Swift US Bond Strategist rswift@bcaresearch.com Footnotes 1 Please see US Bond Strategy Weekly Report, “2022 Will Be All About Inflation”, dated September 14, 2021. 2 Chart 3B shows that 4 participants expect core PCE inflation of 1.9%-2.0% in 2023, but the SEP also reveals that the minimum forecast for core PCE in 2023 is 2.0%. In other words, all 4 participants in that range are forecasting 2.0%, not 1.9%. 3 For more details on the relationship between our 5-year/5-year forward yield target and the yield curve please see US Bond Strategy Weekly Report, “A Bump On The Road To Recovery”, dated July 27, 2021. 4 Please see US Bond Strategy Weekly Report, “Expected Returns In Corporate Bonds”, dated September 21, 2021. 5 For a recent debate about the outlook for Emerging Market assets please see last Friday’s Webcast: https://www.bcaresearch.com/webcasts/detail/458 Recommended Portfolio Specification Other Recommendations Treasury Index Returns Spread Product Returns
New orders for US durable goods grew 1.8% month-on-month to a record $263.5 billion in August. The increase follows an upwardly revised 0.5% and is more than double expectations of a 0.7% rise. However, a 5.5% month-on-month surge in transportation equipment…
Highlights This is the second part of the publication, in which we provide an in-depth overview of Hotels, Restaurants, and Airlines, or the “travel complex” as we dubbed it. In last week’s report, we provided an overview of the macroeconomic backdrop, the Delta variant trajectory, and a “deep dive” into the hotel industry. We concluded Hotels is a sound tactical and cyclical investment, and we recommended an overweight. Airlines Less profitable trip mix and excess capacity: Domestic travel has rebounded to 2019 levels, while international and corporate travel are still lagging due to government and corporate restrictions (Chart 1). Some of the excess capacity is being redirected to domestic leisure travel, which has higher volume but is far less profitable. Airline cargo growth is a saving grace. The cost side of the airline business has its own challenges. Airlines have high fixed costs as they own or lease aircraft fleets. This creates a heavy financial burden during downturns. The price of jet fuel has increased to pre-pandemic levels. Labor costs are high due to the unionized work force and rising wages. Profitability is elusive: With airline revenues down 27% YoY in August 2021, and costs on the rise, it is hard to envision profitability without a return of international and business travel. Too much debt: Airlines’ net debt has risen significantly since the pandemic. Without positive cash flow generation, it will become harder and harder for them to meet their debt obligations. We have a negative outlook for airlines and are underweight the S&P Airlines index. Restaurants Defensive: Although the S&P Restaurant Industry resides within the pro-cyclical S&P Consumer Discretionary Index, its composition is nothing but defensive as it is dominated by fast-food chains. Profitable and resilient: Despite the havoc wreaked by Covid, the restaurant industry has not stopped being profitable (Chart 2). With any new Covid variant scare, restaurants will just go back to their “drive-throughs” playbook. Over the course of 2021, restaurant spending has risen by more than 40%. We have a positive outlook for fast-food chains and are overweight the S&P Restaurant index. Feature This is the second part of the publication, in which we provide an in-depth overview of Hotels, Restaurants, and Airlines, or the “travel complex” as we dubbed it. These industries share many drivers of profitability as each provides in-person experiences. They are also highly dependent upon public sentiment regarding the potential dangers and likelihood of Covid infections. Further, consumer confidence and financial wellbeing are at the core of this group’s profitability, as the travel complex is a quintessential discretionary spending category. The recovery of the group was coming along quite well until the Delta variant derailed it in late summer, with reports pouring in about dining rooms closing, airline bookings flagging, and hotel occupancy dipping. What is next? In last week’s report, we provided an overview of the macroeconomic backdrop, the Delta variant trajectory, and a “deep dive” into the hotel industry. We concluded that the Hotels, Resorts, and Cruise Lines industry has significant potential to return to its former “glory”: Delta is cresting, financially healthy US consumers are choosing to spend their money on services and experiences, sell-side forecasts are pointing to surging sales, and hotels have substantial pricing power. The industry is a sound tactical and cyclical investment, and we recommend an overweight. This week we will continue with a deep dive into the Restaurant and Airline industries. Sneak Preview: We like restaurants (overweight) but airlines, not so much (underweight). Chart 1Airline Majors' Traffic Still Has Not Recovered To 2019 Level
Travel: Airlines Are Not Ready To Take Off (Part 2)
Travel: Airlines Are Not Ready To Take Off (Part 2)
Chart 2Profitability Is Resilient To Downturns
Profitability Is Resilient To Downturns
Profitability Is Resilient To Downturns
Airlines “To suggest that the airlines should have better prepared for this environment seems akin to suggesting Pompeii should have invested more heavily in firefighting technology.” (JP Morgan, Mar. 22, 2020) Having avoided bankruptcy in 2020 thanks to federal payout support, US passenger airlines recorded $4.3 billion more in pre-tax losses in the first half of 2021. Clearly, this industry’s woes are far from over. Unsurprisingly, airlines have had the worst performance of any industry in the travel complex, underperforming the S&P 500 by 5% over the past year (Chart 3 & Table 1). Importantly, the performance of the industry slumped at the end of the summer, triggered by the Delta variant scare: After several months of steady increases, new ticket sales have dipped. As we noted last week, several major airlines have warned in regulatory filings that their third quarter may not look as rosy as was hoped. American Airlines, Southwest Airlines, and United all noted a deceleration in near-term customer bookings in August and elevated trip cancellations, even in leisure.1 All three have suggested that the Delta variant is having a dampening effect on business. We believe that the Delta variant is cresting. Our base case is that herd immunity is not far off. Of course, the travel complex is vulnerable to any new virus scare (Table 2), and this is a risk that investors need to keep in mind. However, unlike hotels, airlines face multiple other challenges. Chart 3The S&P Airline Industry Index Is Still Under the Pre-pandemic Level
The S&P Airline Industry Index Is Still Under the Pre-pandemic Level
The S&P Airline Industry Index Is Still Under the Pre-pandemic Level
Table 1Performance
Travel: Airlines Are Not Ready To Take Off (Part 2)
Travel: Airlines Are Not Ready To Take Off (Part 2)
Table 2Airline Industry Composition
Travel: Airlines Are Not Ready To Take Off (Part 2)
Travel: Airlines Are Not Ready To Take Off (Part 2)
Competitive Landscape The US airline industry generated total operating revenues of $92.7 billion in 2020, down 48.3% from $179.4 billion in 2019. The industry is dominated by five majors, that are included in the S&P 500 index). Macroeconomic Backdrop For Airlines The airline industry is highly cyclical, and its wellbeing is tightly tied to economic growth. As economic activity improves, business travel tends to increase (except when Covid-related restrictions change the normal course of things). As economic growth translates into higher wages and stronger employment gains, leisure travel also takes off. So does the transportation of goods. As we discussed in Part 1 of the report, the economy is currently in a slowdown stage of the business cycle: Growth is slowing but off high levels. As such, even in the absence of Covid-19 or the Delta variant, Airline sales would continue to grow but at a slow pace. US consumers are financially healthy, and while most of the stimulus money has been spent, more and more people are returning to work. Recently, consumer confidence has soured on the back of a resurgence in Covid infections and rising prices (Chart 4, panel 2). However, domestic airline tickets are still cheap, and only fear of infection is keeping Americans grounded. With Delta cresting, people will go back to flying. Chart 4Airlines Are Highly Cyclical
Airlines Are Highly Cyclical
Airlines Are Highly Cyclical
Key Drivers Of Profitability: Revenue Vs Expenses Revenue While many industries have been hit hard by the pandemic (brick-and-mortar retail, hotels, restaurants) most have turned the corner and are now profitable. Airlines, however, are still struggling (Chart 5). The good news is that losses have been declining, but the bad news is that the financial situation of most airlines is still precarious. Airlines rely on diverse sources of revenue, and thanks to that, business is starting to recover. The following are the key streams: Fares charged to customers In-flight entertainment, food, and beverages Sales of frequent-flyer credits to hotels, auto rental agencies, credit card issuers Auxiliary charges: Baggage checks, choice of seat, extra leg room Cargo and mail Chart 5Airlines' Revenue Remain
Airlines' Revenue Remain
Airlines' Revenue Remain
Chart 6Airline Majors' Traffic Still Has Not Recovered To 2019 Level
Travel: Airlines Are Not Ready To Take Off (Part 2)
Travel: Airlines Are Not Ready To Take Off (Part 2)
Traffic Recovery: Domestic Travel Has Rebounded, While International And Corporate Travel Are Still Lagging Budget airlines are pandemic winners: As of October 2021 compared to October 2019, scheduled available seat miles are down for all the airlines in the S&P 500 index (AAL, LUV, DAL, UAL, and ALK) (Chart 6). Only the budget airlines such as Allegiant, Spirit, and Frontier have a scheduled number of flights above the 2019 watermark. The underlying reason for such a dichotomy is easy to explain. The successful rollout of Covid-19 vaccines in the US has unleashed material pent-up demand for domestic leisure travel, benefiting domestic budget airlines. US domestic seat miles and load factors have recovered to pre-pandemic levels (Chart 7) as consumers have eagerly spent their stimulus checks on travel within the US. Chart 7Domestic Load Factor Has Fallen Below Pre-Pandemic Levels
Travel: Airlines Are Not Ready To Take Off (Part 2)
Travel: Airlines Are Not Ready To Take Off (Part 2)
Major airlines are bleeding cash due to high exposure to international and business travel segments: In the meantime, many government and company-imposed restrictions on international and business flights are still in place. Companies are taking a very cautious approach to office re-openings and employee travel, and Zoom has become embedded as a viable corporate communications alternative and a cost-saving tool. As a result, the airline traffic of the majors with high exposure to international (Chart 8) and business travel (Chart 9), is still below the pre-pandemic level. Some of that capacity is being redirected to domestic leisure travel, which has higher volume but is far less profitable. Chart 8In August 2021, US-International Air Travel* Fell 54% Below 2019 Levels
Travel: Airlines Are Not Ready To Take Off (Part 2)
Travel: Airlines Are Not Ready To Take Off (Part 2)
Chart 9Since Mid-July, Growth Of Overall And Corporate Ticket Sales Has Slowed
Travel: Airlines Are Not Ready To Take Off (Part 2)
Travel: Airlines Are Not Ready To Take Off (Part 2)
Corporate and international travel are the most lucrative revenue segments and are significant in size: Before the pandemic, business travel constituted 30% of all trips. The industry can hardly recover without these segments rebounding. Until that happens, companies will stay unprofitable, and cash burn will continue. Business travel is projected to recover in 2022 at best and 2024 at worst: The US Travel Association projects US business travel to return to the 2019 level in 2024. The Airlines for America Association (A4A) concurs. It projects that airline passenger volumes will return to the 2019 level in 2022 in the best-case scenario and in 2024 in the worst. Airline cargo is a saving grace: With passenger revenues still lagging 2019 levels, many airlines are focusing on the capacity of their cargo units. With global supply chains clogged and shipping costs increasing five-fold over the past few months, this is a profitable niche. Air cargo demand reached its all-time high in 2020 and continues to grow in 2021: US airlines posted a 20.5% increase in demand for international air cargo in July 2021 from the July 2019 actuals (Chart 10). Chart 10For US Airlines, Growth In Air Cargo Continues To Outpace Air Travel By A Large Margin
Travel: Airlines Are Not Ready To Take Off (Part 2)
Travel: Airlines Are Not Ready To Take Off (Part 2)
Airlines Compete On Volume: Airfares Are Low Despite the inflationary environment, the price of airfares is still 18% below its 2019 level (-10% annualized), and that is after 7% YoY price increases in 2021 (Chart 11). These are price levels not seen since the 1990s. With all the spare capacity, former international and business travel is now competing to attract domestic leisure passengers. Making things worse, due to prior commitments, airlines continued to grow their fleets throughout the pandemic closures (Chart 12), further increasing capacity and exacerbating competition for passengers as business and international travel are likely to lag, making peak ticket prices and peak revenue elusive (Chart 13). There is also another matter to consider, which is hardly minor. Airline taxes and fees constitute about a quarter of the price of a ticket. According to an example put together by A4A, the base airline fare of $236 has $64 in multiple taxes and fees, making tickets less affordable. Chart 11Airfares Have Fallen by 10% A Year Since The Beginning Of The Pandemic
Travel: Airlines Are Not Ready To Take Off (Part 2)
Travel: Airlines Are Not Ready To Take Off (Part 2)
Chart 12Capacity Continues To Increase
Travel: Airlines Are Not Ready To Take Off (Part 2)
Travel: Airlines Are Not Ready To Take Off (Part 2)
Chart 13Airfares Are Down 18% From 2019 And 29% From 2014
Travel: Airlines Are Not Ready To Take Off (Part 2)
Travel: Airlines Are Not Ready To Take Off (Part 2)
Sales Growth Analysts expect airline sales growth to stabilize at 60% over the next 12 months. The base effect certainly plays a significant role, but this rate will help the industry to recover. Expenses Airlines have high fixed costs as they own or lease aircraft fleets. This creates a heavy financial burden during downturns, as costs can hardly be cut. Other expenses such as labor and fuel are also sticky. Price Of Jet Fuel Has Increased To Pre-pandemic Levels The cost of jet fuel is one of the most significant input costs for airlines, constituting anywhere between 10% and 30% of revenue (Chart 14). The price of fuel can make a significant difference for an airline’s razor-thin margins. Airlines therefore tend to hedge their fuel exposure. Jet-fuel prices have rebounded to their pre-pandemic level and are up 49% from January 2021 (Chart 14), no longer giving the airline any slack on the cost side. According to Zach Research, at United Airlines the average aircraft fuel price per gallon increased by 66.9% year-over-year to $1.97 in the June quarter. Owing to the uptick in air travel demand witnessed in the June quarter following increased vaccinations, fuel gallons consumed were up 206.4%. Chart 14Price Of Jet Fuel Has Increased To The Pre-pandemic Levels
Price Of Jet Fuel Has Increased To The Pre-pandemic Levels
Price Of Jet Fuel Has Increased To The Pre-pandemic Levels
Chart 15Labor Costs Increased Again
Travel: Airlines Are Not Ready To Take Off (Part 2)
Travel: Airlines Are Not Ready To Take Off (Part 2)
Labor Costs Are Fixed Due To The Unionized Work Force Labor is another significant line item on the expense side of the airline’s income statement. Normally labor costs constitute 30-40% of sales. During the darkest days of the lockdowns, labor expense soared to 60% of sales (Chart 15). With a highly unionized labor force, layoffs and furloughs require significant payouts. There are also many other conditions in the labor contract that must be met. As a result, as sales tanked, labor costs did not change in the same proportion. Even so, airlines reduced their workforce from 458,000 people in 2019 to 363,000 in November 2020 (Chart 15). Now, with sales growing again, airlines have started rehiring. However, with recent wage rises, new employees are more expensive. Profitability With revenue challenged by a less profitable trip mix, excess capacity, and rising fuel and labor costs, airlines have been losing money for over a year now (Chart 16). While the increase in leisure travel and cargo units is helping, it is hard to envision profitability without a return of international and business travel. With airline revenue down 27% YoY in August 2021, and costs on the rise, profitability is still a long way off (Chart 17). Chart 16Airlines Are Unprofitable…
Airlines Are Unprofitable…
Airlines Are Unprofitable…
Chart 17…And Are Burning Cash
…And Are Burning Cash
…And Are Burning Cash
Net Debt Airlines’ net debt has risen significantly since the pandemic, driven by their need to support fixed costs (Chart 18). The increase in net debt was also stimulated by large government support and a low interest-rate environment. The problem is that since airlines are unprofitable, and are burning cash, it is becoming harder and harder for them to meet their debt obligations (Chart 19). While there have not been any high-profile bankruptcies in the US, some European and Asian carriers, such as Norwegian Air and AirAsia Japan Co., had to file for bankruptcy protection. As airlines are expected to continue to burn cash through 2022 their credit ratings have been downgraded (Table 3). We would not be surprised if more bankruptcies or industry consolidations take place in the near term. Chart 18Debt Levels Have Increased Significantly
Debt Levels Have Increased Significantly
Debt Levels Have Increased Significantly
Chart 19Airlines Have Difficulty With Interest Payments
Airlines Have Difficulty With Interest Payments
Airlines Have Difficulty With Interest Payments
Table 3All Airlines Credit Ratings Have Been Downgraded
Travel: Airlines Are Not Ready To Take Off (Part 2)
Travel: Airlines Are Not Ready To Take Off (Part 2)
When Will Airlines Thrive Again While revenue lags, the industry will remain vulnerable to shocks and cost headwinds. However, once international and business travel recovers, sales will pick up, and companies will generate positive cash flow. Cash generation is a necessary condition for financial recovery – once airlines arrest the cash burn, they can shift their efforts towards rebuilding profitability and, eventually, repairing their balance sheets. Valuations And Technicals Airlines are trading at 36x forward earnings, which is optically high. However, the Valuations Indicator suggests that airlines are not expensive relative to their own history (Chart 20). The industry is also modestly oversold (Chart 21). Chart 20Airline Are Not Expensive Relative To Own History…
Airline Are Not Expensive Relative To Own History…
Airline Are Not Expensive Relative To Own History…
Chart 21…And Are Oversold
…And Are Oversold
…And Are Oversold
Investment Implications Airlines are slowly recovering from a malaise induced by the pandemic lockdowns. However, the road to recovery will be long. While domestic leisure and cargo traffic has picked up, it will be another couple of years before international and business travel rebounds to the pre-pandemic levels. With fuel and labor costs on the rise, profitability is elusive without those segments. And, even when airlines return to profitability, it will take them years to repair their indebted balance sheets. What is worse, with current levels of debt burden and negative interest coverage, bankruptcies may not be out of the question for some. While airlines may rally with rates rising and cyclicals outperforming, we are negative on the industry on both a cyclical and structural basis. However, if any of our clients wish to trade this industry, there are several liquid ETFs that represent this space (Table 4). If investors chose to be granular and pick individual stocks in this space, they need to be aware of the individual challenges of each airline and their levels of indebtedness vs cash burn. In short, we have a negative outlook for airlines and are underweighting the industry. Table 4Airline ETFs Are Readily Available
Travel: Airlines Are Not Ready To Take Off (Part 2)
Travel: Airlines Are Not Ready To Take Off (Part 2)
Restaurants: Defensive Cyclicals Industry Composition Although the S&P Restaurant Industry resides within the pro-cyclical S&P Consumer Discretionary Index, its composition is nothing but defensive. In fact, a more appropriate name would have been the S&P Fast-Food Industry, with MCD and SBUX accounting for 70%+ of the industry market cap (Table 5). Table 5Industry Composition
Travel: Airlines Are Not Ready To Take Off (Part 2)
Travel: Airlines Are Not Ready To Take Off (Part 2)
Performance Restaurant Industry performance has been tracking the performance of the S&P 500, lagging the benchmark by only 8% since January 2020 (Chart 22) Chart 22Restaurant Performed Almost In Line With The S&P 500
Restaurant Performed Almost In Line With The S&P 500
Restaurant Performed Almost In Line With The S&P 500
Restaurants Are “Defensive Cyclicals” Since fast-food prices are generally low, fast-food restaurants tend to be what economists call “inferior” goods, i.e., goods whose sales rise when the economy is in a downward spiral. Restaurants tend to outperform in the slowdown stage of the business cycle (Chart 23), are flat during contraction, and underperform during expansions. Consistent with these expectations, fast-food restaurants also came out as winners of Covid lockdowns: Although sales initially dipped, they quickly recovered as fast-food chains reoriented their business toward drive-throughs and other forms of take-out (Chart 24). Chart 23Fast-Food Restaurants Are Defensive
Travel: Airlines Are Not Ready To Take Off (Part 2)
Travel: Airlines Are Not Ready To Take Off (Part 2)
Chart 24Sales Growth Is Recovering
Sales Growth Is Recovering
Sales Growth Is Recovering
Covid While the restaurant business was coming along quite well, concerns emerged at summer’s end that the Delta variant would further delay industry recovery. Chains like McDonald’s and Chick-fil-A announced that they are slowing their dining room re-openings. As data from restaurant analytics firm Black Box Intelligence demonstrates, sales that had grown steadily earlier this summer have fallen.2 We believe that the reaction to the Delta variant is transitory as new infections are cresting. And, in the worst-case scenario, fast-food restaurants in the index will just switch back to their Covid “drive-through playbook,” and will maintain their level of profitability. Restaurant Spending And Profitability Over the course of 2021, US retail sales releases reveal that restaurant spending rose by more than 40%, outpacing the headline number (13%) by a wide margin (Chart 25). While restaurant spending is likely to decelerate over the coming months as pent-up demand for services is satisfied, earnings will continue to improve. This is in line with analyst expectations (Chart 26). Chart 25Restaurant Sales Skyrocketed In 2021
Restaurant Sales Skyrocketed In 2021
Restaurant Sales Skyrocketed In 2021
Chart 26Earnings Will Continue to Grow But At A Slower Pace
Earnings Will Continue to Grow But At A Slower Pace
Earnings Will Continue to Grow But At A Slower Pace
Despite the havoc wreaked by Covid, the restaurant industry has not stopped being profitable, and although margins dipped in the midst of the lockdown, they swiftly rebounded. The 83% YoY print in restaurants FCF is nearly an all-time high reading since the history of the data going back to the 1990s (Chart 27). Debt Is Low Net debt to total assets also echoes the upbeat message highlighting that US dining stocks remain in good financial health (Chart 28). Chart 27Free Cash Flow Is At All-Time High
Free Cash Flow Is At All-Time High
Free Cash Flow Is At All-Time High
Chart 28Debt Is Low
Debt Is Low
Debt Is Low
Valuations And Technicals Valuations are not demanding while technicals suggest that the industry is oversold (Chart 29). Chart 29Restaurants Are Oversold & Undervalued
Restaurants Are Oversold & Undervalued
Restaurants Are Oversold & Undervalued
Investment Implications The current slowdown stage of the business cycle is favorable for the fast-food industry. This industry is profitable and resilient in downturns. It is also attractively valued. The industry is oversold, which represents a favorable entry point for an overweight position. In short, fast-food restaurants are a sound “cyclical defensive”: They are resilient to downturns, highly profitable, and have healthy balance sheets. We have a positive outlook on the industry and are overweight. A Quick Aside: Toast IPO Before we conclude, a brief note on the new Toast (TOST) IPO is in order. While the stock became public only last week and is not a part of the S&P 500, it is an important newcomer to the stock market. The company is a market leader in cloud-based restaurant management software. Toast’s performance is tied to the health of the overall US restaurant industry. Many of the popular restaurants and fast-food chains are among Toast’s clients. Bottom Line We have a negative outlook for Airlines: This highly cyclical industry is on a long-winding path towards recovery, profitability, and deleveraging. Airlines face multiple challenges and headwinds: Fuel and labor costs are rising, while their most profitable revenue segments, international and business travel, are missing in action. Cash burn is still acute, and profitability is elusive despite all the progress made. We are much more positive on the outlook for the Restaurant Index, which represents some of the largest fast-food chains in the nation. This industry thrives during economic slowdown, is resilient to shocks, and is highly profitable. Irene Tunkel Chief Strategist, US Equity Strategy irene.tunkel@bcaresearch.com Footnotes 1 Travel Investors Need More Drive, WSJ, Sep 12, 2021 2 Restaurants Close Dining Rooms Again as Delta-Driven Infections Spread, WSJ, Sep 13, 2021. Recommended Allocation