United States

Highlights Economy – We find the leading arguments for why households’ excess savings won’t be spent to be wanting: US households do not commonly demonstrate the detached foresight that Ricardian equivalence takes as given and the trauma-will-change-behavior thesis fails to account for the absence of widespread financial trauma. Markets – Public equities account for a record portion of household wealth, but their share gains are not a sign of a budding mania: Our analysis of the Fed’s Flow of Funds data argues that much of equities’ relative share gains have been driven by structural rather than cyclical factors. Strategy – It would be premature to shift to defensive asset allocation settings if monetary policy is going to remain accommodative for another three years: The rate hike progression envisioned by FOMC participants’ dot-plot projections suggests policy won’t become tight until late 2024 at the earliest. Feature The US Investment Strategy team has been at the more bullish end of the continuum within BCA, and among the broader strategist community, since the spring of 2020. Our view was premised on the idea that the fiscal and monetary policy responses to the pandemic were (and would continue to be) so large that they would overwhelm its adverse effects on the economy and markets. That view came to pass as Congress augmented the CARES Act’s fiscal largesse with two subsequent rounds of direct payments to households earning up to $100,000 per adult and a renewed federal supplement to unemployment insurance (UI) benefits. With the expiration of the UI benefit program at the beginning of the month and the Fed poised to end asset purchases by the middle of next year, clients have begun to ask if our underlying bullish premise still applies. We believe that it does, on the grounds that policy remains on an emergency footing even though the emergency has passed. The fiscal transfers may have ended, but their full effect has yet to be felt. They will support the economy on an ongoing basis as households direct their excess pandemic savings toward consumption. No one knows for sure how much of the excess savings will be spent or when, but the arguments citing Ricardian equivalence or consumer trauma as impediments to consumption are flawed. What If Today’s Income Is Taxed Tomorrow? British classical economist David Ricardo is best known to introductory economics students for comparative advantage, but he also posited that deficit spending may fail to boost aggregate demand because taxpayers, anticipating that they will be tapped in the future to repay state loans, may increase savings to cover future taxes. Despite its theoretical appeal, empirical data in support of Ricardian equivalence is elusive. Two centuries and an ocean removed from Ricardo’s England, we submit that Americans are not known for parsimony, studied caution or a tendency to see the glass as half-empty. Although American households began to rebuild savings after the global financial crisis, an additional dollar has tended to burn a hole in their pockets ever since the baby boomers began reaching adulthood (Chart 1). Chart 1The Searing Trauma Of The Depression Weighed On Consumption Decisions
The Searing Trauma Of The Depression Weighed On Consumption Decisions
The Searing Trauma Of The Depression Weighed On Consumption Decisions
Even if Americans were wont to consider future tax burdens, it may be rational for the households who received the fiscal transfers to assume they will largely escape them unless their relative income surges. Per the most recent adjusted gross income (AGI) distribution data (for tax year 2018), 70% of taxpayers earn $75,000 or less (Chart 2). Single taxpayers meeting that threshold (and married taxpayers earning $150,000 or less) received the full amount of the economic impact payments authorized by the CARES Act and subsequent legislation. That bottom 70% paid just 5.1% of AGI in federal taxes (Chart 3), and the current political climate points in the direction of an increasingly progressive tax system, so they may not have to worry about being called upon to cover the expanding deficit down the road. Chart 2The Income Distribution Is Top Heavy ...
Post-Traumatic Bliss
Post-Traumatic Bliss
Chart 3…But So Is The Tax Burden
Post-Traumatic Bliss
Post-Traumatic Bliss
The (Not So Traumatic) Economic Trauma Of COVID-19 While we are confident that Ricardian equivalence will not act as an impediment to consumption, the ultimate disposition of households’ excess pandemic savings is unknown. Our working assumption has been that half of the savings will be spent across 2021 and 2022. Though we do not have any close antecedents for what households might do with a savings windfall equivalent to 10% of a year’s GDP amassed over a thirteen-month span, we reject the notion that those who experienced COVID-19 will behave like the many shell-shocked survivors of the Great Depression who became lifelong precautionary savers. However terrible the human cost of COVID, it did not ravage American households’ financial position; as the Fed’s latest Flow of Funds report showed, their balance sheets flourished, allowing the vast majority of them to escape any sense of financial trauma. Per the Flow of Funds, American household wealth grew by nearly $6 trillion in the second quarter, extending the last five quarters’ gains to $31 trillion since financial markets cratered when the pandemic burst forth in the first quarter of 2020. The 22% annualized five-quarter gain is nearly four standard deviations above the mean and blows away 4Q03 through 4Q04’s 14% second-place mark by two full standard deviations (Chart 4, top panel). The current run sets a record even when it’s stretched to six quarters to include 1Q20, the worst quarter in series history, and the five- and six-quarter gains are also pacesetters after adjusting for inflation (Chart 4, bottom panel). Chart 4Recessions Aren't So Bad When Congress And The Fed Throw Everything They Have At Them
Recessions Aren't So Bad When Congress And The Fed Throw Everything They Have At Them
Recessions Aren't So Bad When Congress And The Fed Throw Everything They Have At Them
Changes in household net worth lead consumption growth with a two-quarter lag (Chart 5), though the four quarters before the most recent one (the red dots with negative consumption growth) were notable outliers. 2Q21 consumption was just a little more than a percentage point below the best-fit line, however, so it is closing in on its modeled value and we expect it will overshoot it in coming quarters upon the release of pent-up demand. We do not believe that the pandemic will dampen household spending simply because the broad mass of consumers did not experience financial trauma on a scale that would alter future behavior. As household wealth and income data have shown, this recession has been a boon for most Americans. Chart 5Consumption Overshoots Are On The Way
Post-Traumatic Bliss
Post-Traumatic Bliss
Chart 6Fiscal Shock And Awe
Post-Traumatic Bliss
Post-Traumatic Bliss
We additionally reject the notion that households have learned a lesson that will make them want to hold more savings. The financial lesson of the pandemic seems to be that policymakers will do their utmost to shelter them from calamity. Between the economic impact payments (Chart 6, top panel) and the UI benefit supplement (Chart 6, middle panel), Congress directly sent nearly $1.5 trillion to US households to offset $300 billion of lost wages (Chart 6, bottom panel). COVID-19 inflicted terrible distress on those who lost loved ones and witnessed or experienced near fatal suffering, but it boosted the lower three quartiles of households who received transfers and the top decile of households who reveled in the financial markets’ advance. Those who experienced it will not hoard their pennies and shun debt like many of the Depression’s survivors; they are more likely to have experienced post-traumatic bliss than stress when it comes to their financial outlook. Too Much Of A Good Thing? We periodically check in on the Flow of Funds for insight into the evolution of households’ asset allocations and the share of net worth accounted for by homes. Directly owned equities and mutual funds have taken share from the other major categories throughout the pandemic run (Chart 7) and now account for a record share of household financial assets after having surpassed their 2000 highs (Chart 8, top panel). It is sensible to approach any equity milestone that invokes the dot-com bubble with some trepidation, but structural factors go a long way toward explaining the new allocation peak. The financialization of the economy has steadily advanced since the Flow of Funds data began to be compiled in 1951, promoting public equity ownership, and consolidation has supported the transfer of commercial ownership from mom-and-pop operations to corporate interests, many of which are publicly traded. Overall equity in businesses as a share of household net worth is merely in line with its ‘50s levels (Chart 8, bottom panel). Chart 7The Running Of The Bulls
The Running Of The Bulls
The Running Of The Bulls
Chart 8From Mom And Pop To Broad And Wall
From Mom And Pop To Broad And Wall
From Mom And Pop To Broad And Wall
Home price appreciation has picked up, but it is not out of the ordinary (Chart 9). Home equity gains have outstripped home price gains, relative to each series’ history, testifying to prudent behavior on the part of borrowers and lenders. The low aggregate mortgage loan-to-value ratio (Chart 10) suggests that slowing home price appreciation, or even an outright decline, would not be a source of economic instability. Chart 9Home Price Gains Are Not Out Of The Ordinary ...
Home Price Gains Are Not Out Of The Ordinary ...
Home Price Gains Are Not Out Of The Ordinary ...
Chart 10... And Leverage Levels Are Not A Concern
... And Leverage Levels Are Not A Concern
... And Leverage Levels Are Not A Concern
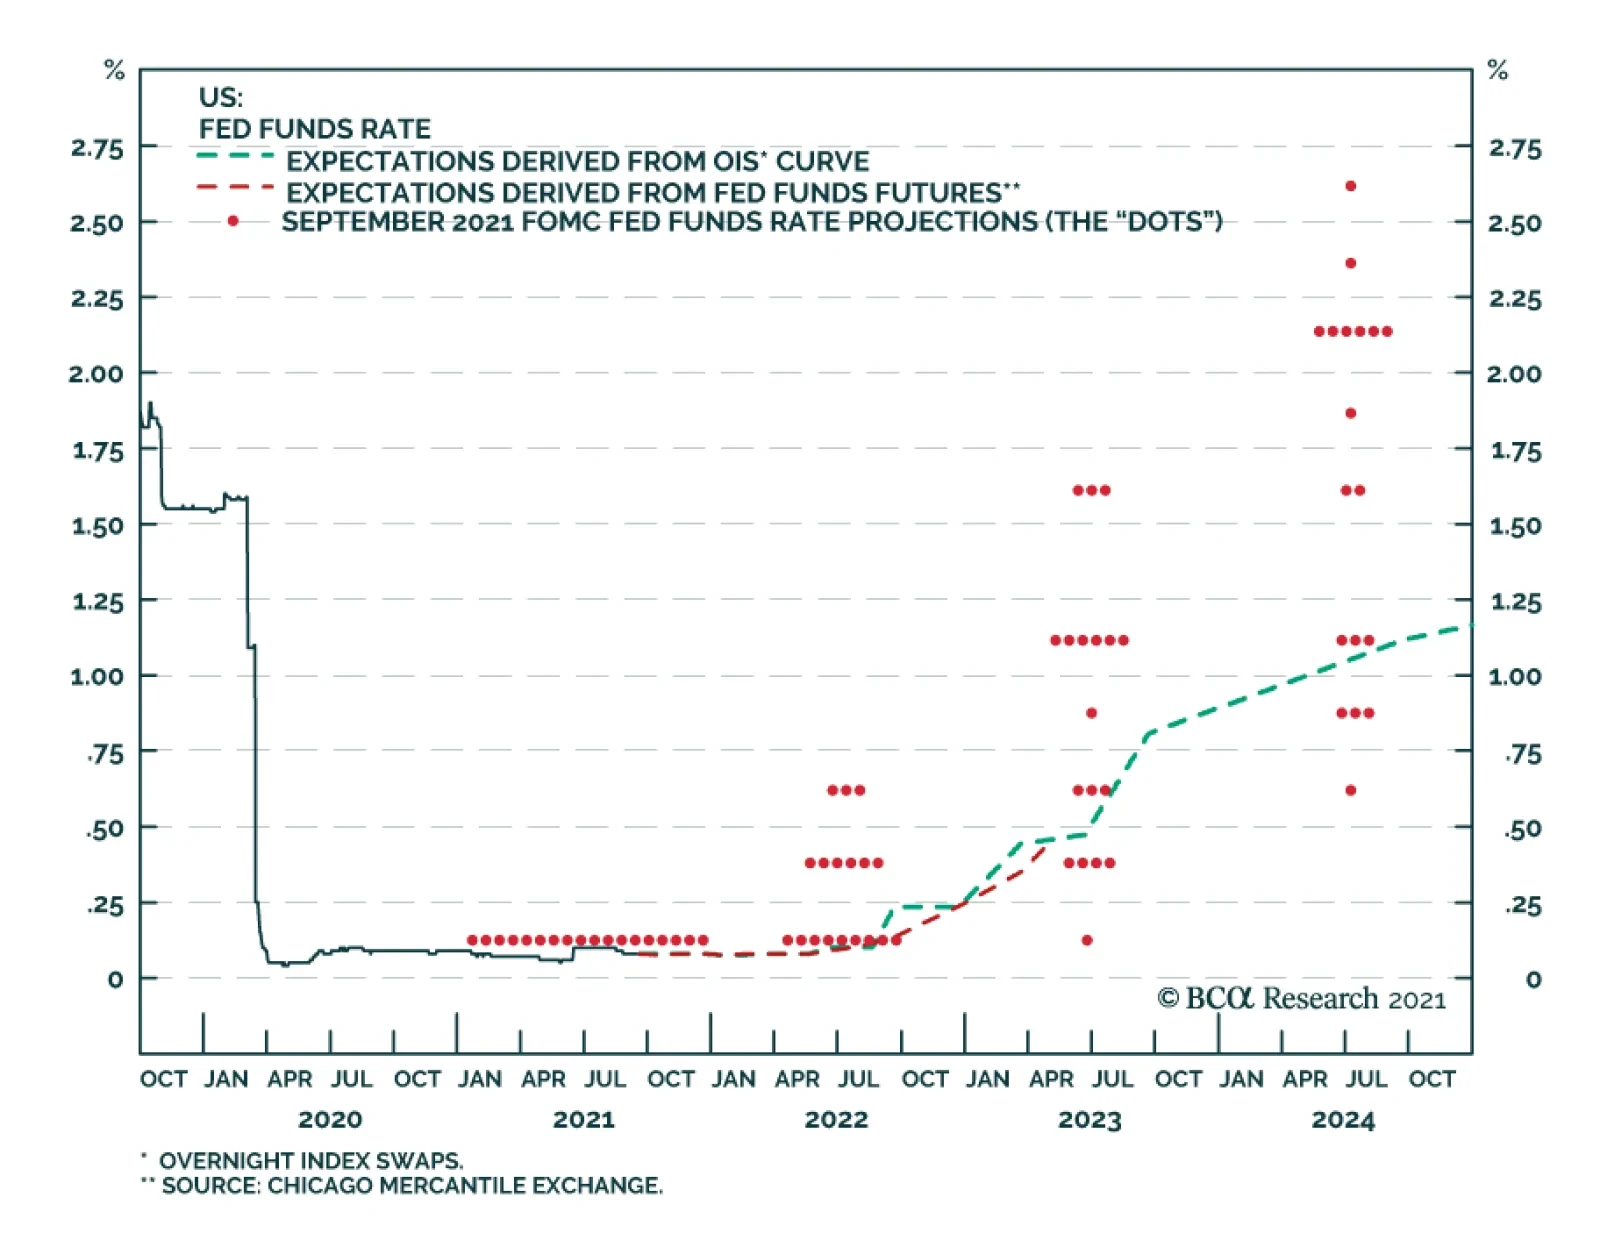
The Fed Signals That Tapering Is Near Though the FOMC did not adjust the pace of its asset purchases last week, it indicated that tapering will most likely begin after its November meeting. Chair Powell noted that the economy has made substantial further progress toward reaching the committee’s inflation goal and expressed that “many” members feel that it has made substantial progress toward achieving its full employment objective as well, going so far as to volunteer his personal view that the employment test has been “all but met.” Per the committee’s discussions, the purchases will likely end around the middle of next year if the economy progresses in line with its expectations. The committee would not be talking about reducing the accommodation it’s providing the economy if it weren’t secure in the sense that it is on solid footing. Powell expressed satisfaction with the evolution of inflation expectations (Chart 11) and although the real GDP forecast for this year was lowered in the summary of economic projections (the “dots”), next year’s forecast was raised and slightly higher inflation expectations imply that nominal GDP growth will remain quite robust. A shift in two members’ fed funds rate projections brought the median member’s liftoff date to 2022 from 2023, in line with our view. Chart 11The Fed Has Succeeded In Firming Up Inflation Expectations
The Fed Has Succeeded In Firming Up Inflation Expectations
The Fed Has Succeeded In Firming Up Inflation Expectations
The chair reiterated that tapering – slowing the pace of accommodation – and hiking the fed funds rate – slowing the economy – are distinct actions subject to separate criteria. We see liftoff as a more significant action than tapering, but much will depend on the pace at which the committee lifts the fed funds rate. It is too soon to speculate on the pace, but we stress that the big move for financial markets will occur once the policy rate exceeds the neutral rate. If the latter is somewhere around 2%, the rate hike pace embedded in the dots suggests that it may take until the end of 2024 or early 2025 before monetary policy becomes restrictive. Investment Implications If monetary policy is not going to become tight for another three years, it is premature to shift a portfolio to more defensive settings, especially for anyone sharing our three-to-twelve-month cyclical timeframe. Growth will be robust in the near term, supported by the income boost that the lower three quartiles of taxpayers received from fiscal transfers and the way wealthier households cleaned up as financial asset prices soared. We expect that a hearty portion of the newly minted wealth will be spent, as Ricardian equivalence requires a longer attention span than Americans typically exhibit, and the pandemic was largely trauma-free for most households from a financial perspective. The clearest policy lesson that a citizen should have taken from COVID is that Congress and the Fed have his/her back in a big way. We are staying the course with our risk-friendly asset allocation recommendations. Doug Peta, CFA Chief US Investment Strategist dougp@bcaresearch.com
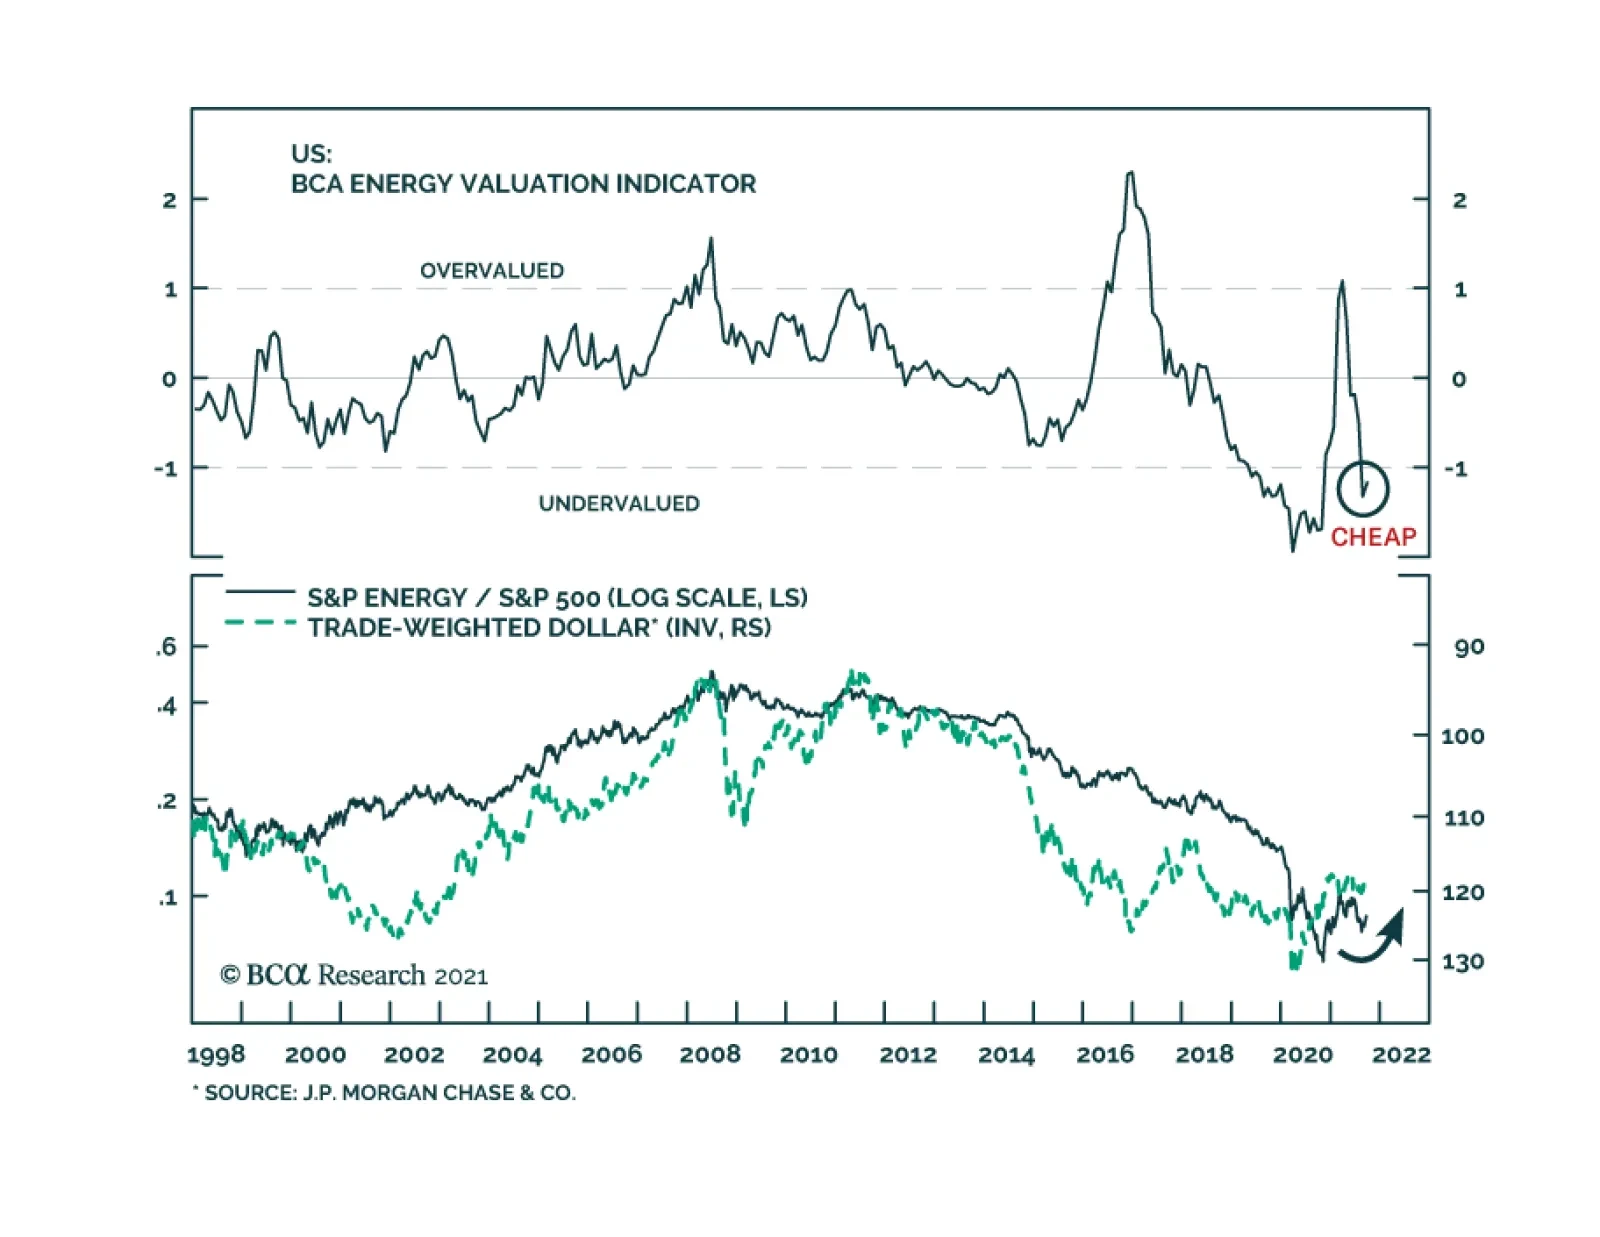
US energy stocks performed poorly earlier this year. They fell 14tween early March and late August. However, the tide seems to be turning in their favor. The energy sector is now leading the benchmark. It is up 12% since August 20 – a period of…
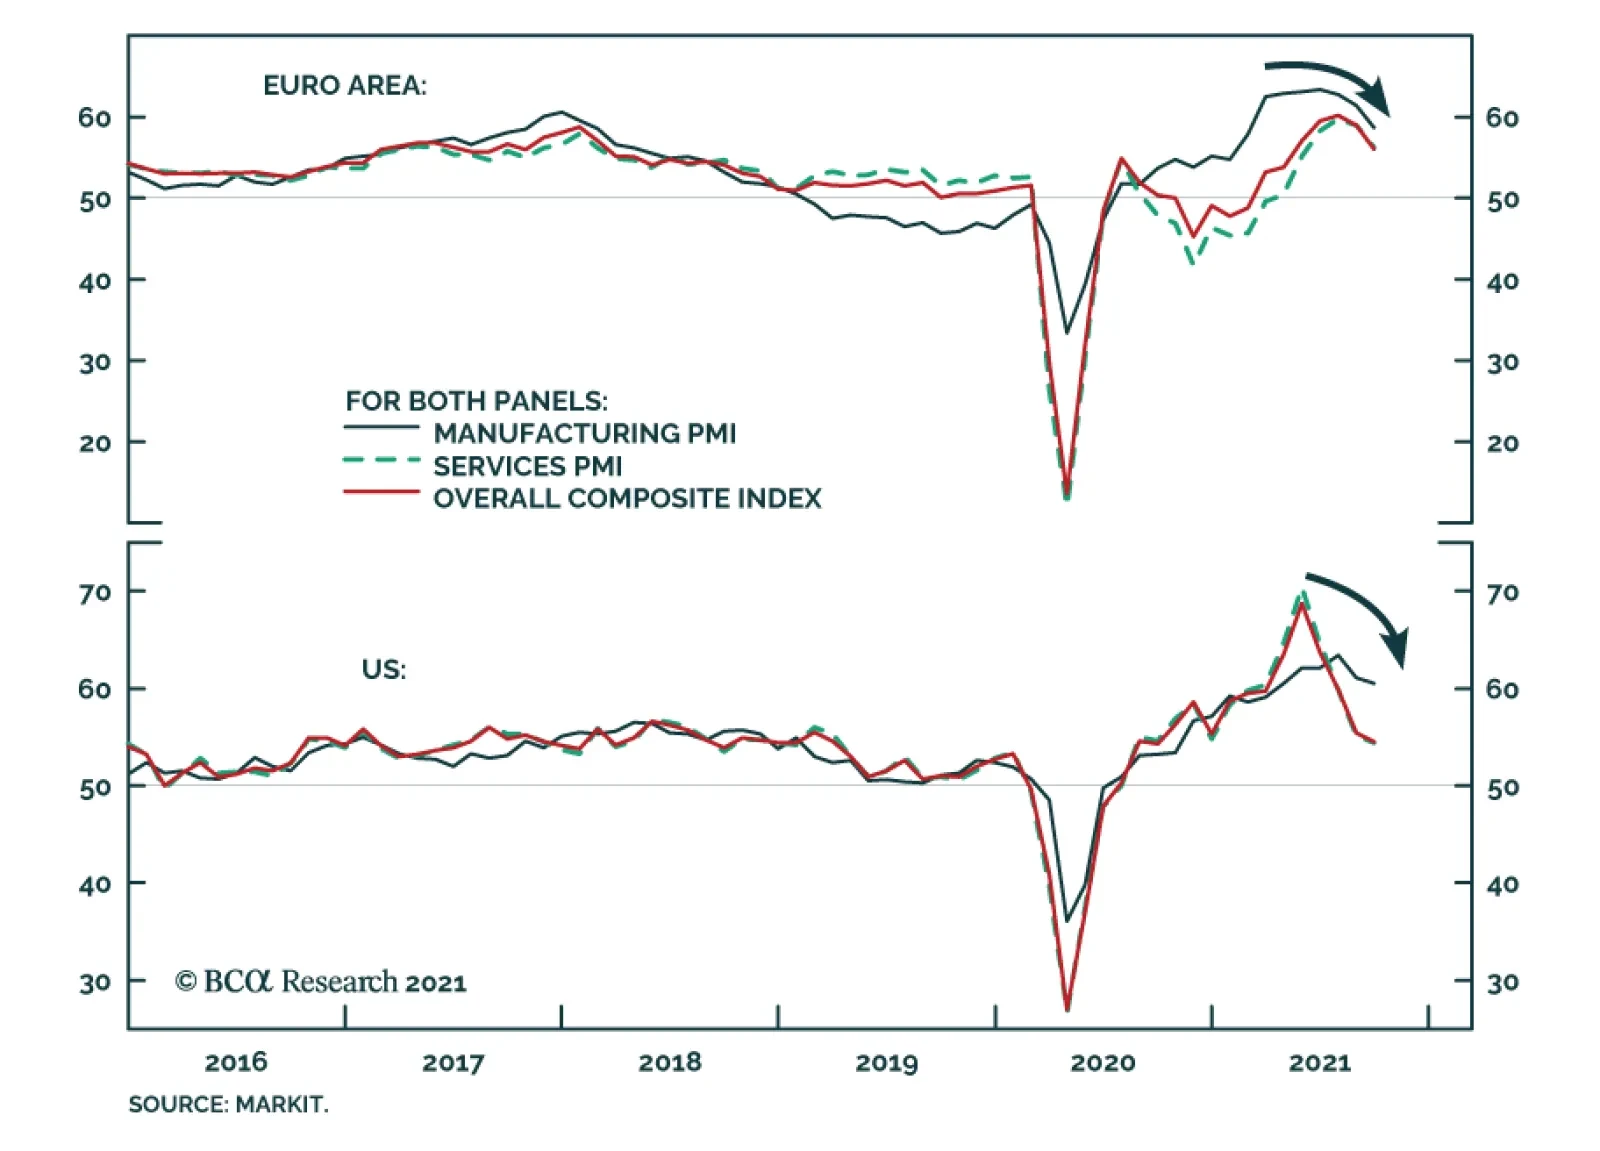
Manufacturing and service flash PMIs for September were weaker than expected. In the US, both service and manufacturing PMIs fell below expectations, bringing down the composite PMI by 0.9 points to 54.5. This dynamic was even more pronounced in the Euro…
Highlights Asian and European natural gas prices will remain well bid as the Northern Hemisphere winter approaches. An upgraded probability of a second La Niña event this winter will keep gas buyers scouring markets for supplies (Chart of the Week). The IEA is pressing Russia to make more gas available to European consumers going into winter. While Russia is meeting contractual commitments, it is also trying to rebuild its inventories. Gas from the now-complete Nord Stream 2 pipeline might not flow at all this year. High natgas prices will incentivize electric generators to switch to coal and oil. This will push the level and costs of CO2 emissions permits higher, including coal and oil prices. Supply pressures in fossil-fuel energy markets are spilling into other commodity markets, raising the cost of producing and shipping commodities and manufactures. Consumers – i.e., voters – experiencing these effects might be disinclined to support and fund the energy transition to a low-carbon economy. We were stopped out of our long Henry Hub natural gas call spread in 1Q22 – long $5.00/MMBtu calls vs short $5.50/MMBtu calls in Jan-Feb-Mar 2022 – and our long PICK ETF positions with returns of 4.58% and -10.61%. We will be getting long these positions again at tonight's close. Feature European natural gas inventories remain below their five-year average, which, in the event of another colder-than-normal winter in the Northern Hemisphere, will leave these markets ill-equipped to handle a back-to-back season of high prices and limited supply (Chart 2).1 The probability of a second La Niña event this winter was increased to 70-80% by the US Climate Prediction Center earlier this week.2 This raises the odds of another colder-than-average winter. As a result, markets will remain focused on inventories and flowing natgas supplies from the US, in the form of Liquified Natural Gas (LNG) cargoes, and Russian pipeline shipments to Europe as winter approaches. Chart of the WeekSurging Natural Gas Prices Intensify Competition For Supplies
Natgas Markets Continue To Tighten
Natgas Markets Continue To Tighten
Chart 2Natgas Storage Remains Tight
Natgas Markets Continue To Tighten
Natgas Markets Continue To Tighten
US LNG supplies are being contested by Asian buyers, where gas storage facilities are sparse, and European buyers looking for gas to inject into storage as they prepare for winter. US LNG suppliers also are finding ready bids in Brazil, where droughts are reducing hydropower availability. In the first six months of this year, US natgas exports averaged 9.5 bcf/d, a y/y increase of more than 40%. Although Russia's Nord Stream 2 pipeline has been completed, it still must be certified to carry natgas into Germany. This process could take months to finish, unless there is an exemption granted by EU officials. Like the US and Europe, Russia is in the process of rebuilding its natgas inventories, following a colder-than-normal La Niña winter last year.3 Earlier this week, the IEA called on Russia to increase natgas exports to Europe as winter approaches. The risk remains no gas will flow through Nord Stream 2 this year.4 Expect Higher Coal, Oil Consumption As other sources of energy become constrained – particularly UK wind power in the North Sea, where supplies went from 25% of UK power in 2020 to 7% in 2021 – natgas and coal-fired generation have to make up for the shortfall.5 Electricity producers are turning more towards coal as they face rising natural gas prices.6 Increasing coal-fired electric generation produces more CO2 and raises the cost of emission permits, particularly in the EU's Emissions Trading System (ETS), which is the largest such market in the world (Chart 3). Prices of December 2021 ETS permits, which represent the cost of CO2 emissions in the EU, hit an all-time high of €62.75/MT earlier this month and were trading just above €60.00/MT as we went to press. Chart 3Higher CO2 Emissions Follow Lower Renewables Output
Higher CO2 Emissions Follow Lower Renewables Output
Higher CO2 Emissions Follow Lower Renewables Output
Going into winter, the likelihood of higher ETS permit prices increases if renewables output remains constrained and natgas inventories are pulled lower to meet space-heating needs in the EU. This will increase the price of power in the EU, where consumers are being particularly hard hit by higher prices (Chart 4). The European think tank Bruegel notes that even though natgas provides about 20% of Europe's electricity supply, it now is setting power prices on the margin.7 Chart 4EU Power Price Surge Is Inflationary
Natgas Markets Continue To Tighten
Natgas Markets Continue To Tighten
Elevated natgas prices are inflationary, according to Bruegel: "On an annual basis, a doubling of wholesale electricity prices from about €50/megawatt hour to €100/MWh would imply that EU consumers pay up to €150 billion (€50/MWh*3bn MWh) more for their electricity. … Drastic increases in energy spending will shrink the disposable income of the poorest households with their high propensity to consume." This is true in other regions and states, as well. Is the Natgas Price Surge Transitory? The odds of higher natgas and CO2 permit prices increase as the likelihood of a colder-than-normal winter increases. Even a normal winter likely would tax Europe's gas supplies, given the level of inventories, and the need for Russia to replenish its stocks. However, at present, even with the odds of a second La Niña event this winter increasing, this is a probable event, not a certainty. The global natgas market is evolving along lines similar to the crude oil market. Fungible cargoes can be traded and moved to the market with the highest netback realization, after accounting for transportation. High prices now will incentivize higher production and a stronger inventory-injection season next year. That said, prices could stay elevated relative to historical levels as this is occurring. Europe is embarked on a planned phase-out of coal- and nuclear-powered electricity generation over the next couple of years, which highlights the risks associated with the energy transition to a low-carbon future. China also is attempting to phase out coal-fired generation in favor of natgas turbines, and also is pursuing a buildout of renewables and nuclear power. Given the extreme weather dependence on prices for power generated from whatever source, renewables will remain risky bets for modern economies as primary energy sources in the early stages of the energy transition. When the loss of wind, for example, must be made up with natgas generation and that market is tight owing to its own fundamental supply-demand imbalance, volatile price excursions to high levels could be required to destroy enough demand to provide heat in a cold winter. This would reduce support for renewables if it became too-frequent an event. This past summer and coming winter illustrate the risk of too-rapid a phase out of fossil-fueled power generation and space-heating fuels (i.e., gas and coal). Frequent volatile energy-price excursions, which put firms and households at risk of price spikes over an extended period of time, are, for many households, material events. We have little doubt the commodity-market effects will be dealt with in the most efficient manner. As the old commodity-market saw goes, "High prices are the best cure for high prices, and vice versa." All the same, the political effects of another very cold winter and high energy prices are not solely the result of economic forces. Inflation concerns aside, consumers – i.e., voters – may be disinclined to support a renewable-energy buildout if the hits to their wallets and lifestyles become higher than they have been led to expect. Investment Implications The price spike in natgas is highly likely to be a transitory event. Another surge in natgas prices likely would be inflationary while supplies are rebuilding – so, transitory. Practically, this could stoke dissatisfaction among consumers, and add a political element to the transition to a low-carbon energy future. This would complicate capex decision-making for incumbent energy suppliers – i.e., the fossil-fuels industries – and for the metals suppliers, which will be relied upon to provide the literal building blocks for the renewables buildout. Robert P. Ryan Chief Commodity & Energy Strategist rryan@bcaresearch.com Ashwin Shyam Research Associate Commodity & Energy Strategy ashwin.shyam@bcaresearch.com Commodities Round-Up Energy: Bullish US crude oil inventories fell 3.5mm barrels in the week ended 17 September 2021, according to the US EIA. Product inventories built slightly, led by a 3.5mm-build in gasoline stocks, which was offset by a 2.6mm barrel draw in distillates (e.g., diesel fuel). Cumulative average daily crude oil production in the US was down 7% y/y, and stood at 10.9mm b/d. Cumulative average daily refined-product demand – what the EIA terms "Product Supplied" – was estimated at 19.92mm b/d, up almost 10% y/y. Brent prices recovered from an earlier sell-off this week and were supported by the latest inventory data (Chart 5). Base Metals: Bullish Iron ore prices have fallen -55.68% since hitting an all-time high of $230.58/MT in May 12, 2021 (Chart 6). This is due to sharply reduced steel output in China, as authorities push output lower to meet policy-mandated production goals and to conserve power. Even with the cuts in steel production, overall steel output in the first seven months of the year was up 8% on a y/y basis, or 48mm MT, according to S&P Global Platts. Supply constraints likely will be exacerbated as the upcoming Olympic Games hosted by China in early February approach. Authorities will want blue skies to showcase these events. Iron ore prices will remain closer to our earlier forecast of $90-$110/MT than not over this period.8 Precious Metals: Bullish The Federal Open Market Committee is set to publish the results of its meeting on Wednesday. In its last meeting in June, more hawkish than expected forecasts for interest rate hikes caused gold prices to drop and the yellow metal has been trading significantly lower since then. Our US Bond Strategy colleagues expect an announcement on asset purchase tapering in end-2021, and interest rate increases to begin by end-2022.9 Rate hikes are contingent on the Fed’s maximum employment criterion being reached, as expected and actual inflation are above the Fed criteria. Tapering asset purchases and increases in interest rates will be bearish for gold prices. Chart 5
BRENT PRICES BEING VOLATILE
BRENT PRICES BEING VOLATILE
Chart 6
BENCHMARK IRON ORE 62% FE, CFR CHINA (TSI)RECOVERING
BENCHMARK IRON ORE 62% FE, CFR CHINA (TSI)RECOVERING
Footnotes 1 Equinor, the Norwegian state-owned energy-supplier, estimates European natgas inventories will be 70-75% of their five-year average this winter. Please see IR Gas Market Update, September 16, 2021. 2 Please see "ENSO: Recent Evolution, Current Status and Predictions," published by the US Climate Prediction Center 20 September 2021. Earlier this month, the Center gave 70% odds to a second La Niña event in the Northern Hemisphere this winter. Please see our report from September 9, 2021 entitled NatGas: Winter Is Coming for additional background. 3 Please see IEA calls on Russia to send more gas to Europe before winter published by theguardian.com, and Big Bounce: Russian gas amid market tightness. Both were published on September 21, 2021. 4 Please see Nord Stream Two Construction Completed, but Gas Flows Unlikely in 2021 published 14 September 2021 by Jamestown.org. 5 Please see The U.K. went all in on wind power. Here’s what happens when it stops blowing, published by fortune.com on 16 September 2021. Argus Media this week reported wind-power output fell 56% y/y in September 2021 to just over 2.5 TWh. 6 Please see UK power firms stop taking new customers amid escalating crisis, published by Aljazeera; Please see UK fires up coal power plant as gas prices soar, published by BBC. 7 Please see Is Europe’s gas and electricity price surge a one-off?, published by Bruegel 13 September 2021. 8 Please see China's Recovery Paces Iron Ore, Steel, which we published on November 5, 2020. 9 Please see 2022 Will Be All About Inflation and Talking About Tapering, published on September 22, 2021 and on August 10, 2021 respectively. Investment Views and Themes Recommendations Strategic Recommendations Commodity Prices and Plays Reference Table Trades Closed in 2021 Summary of Closed Trades
As expected, the FOMC did not make any changes to its policy rate or pace of asset purchases at its meeting on Wednesday. However, the Fed sent a strong signal that tapering is on the horizon. The statement indicated that “if progress continues broadly as…
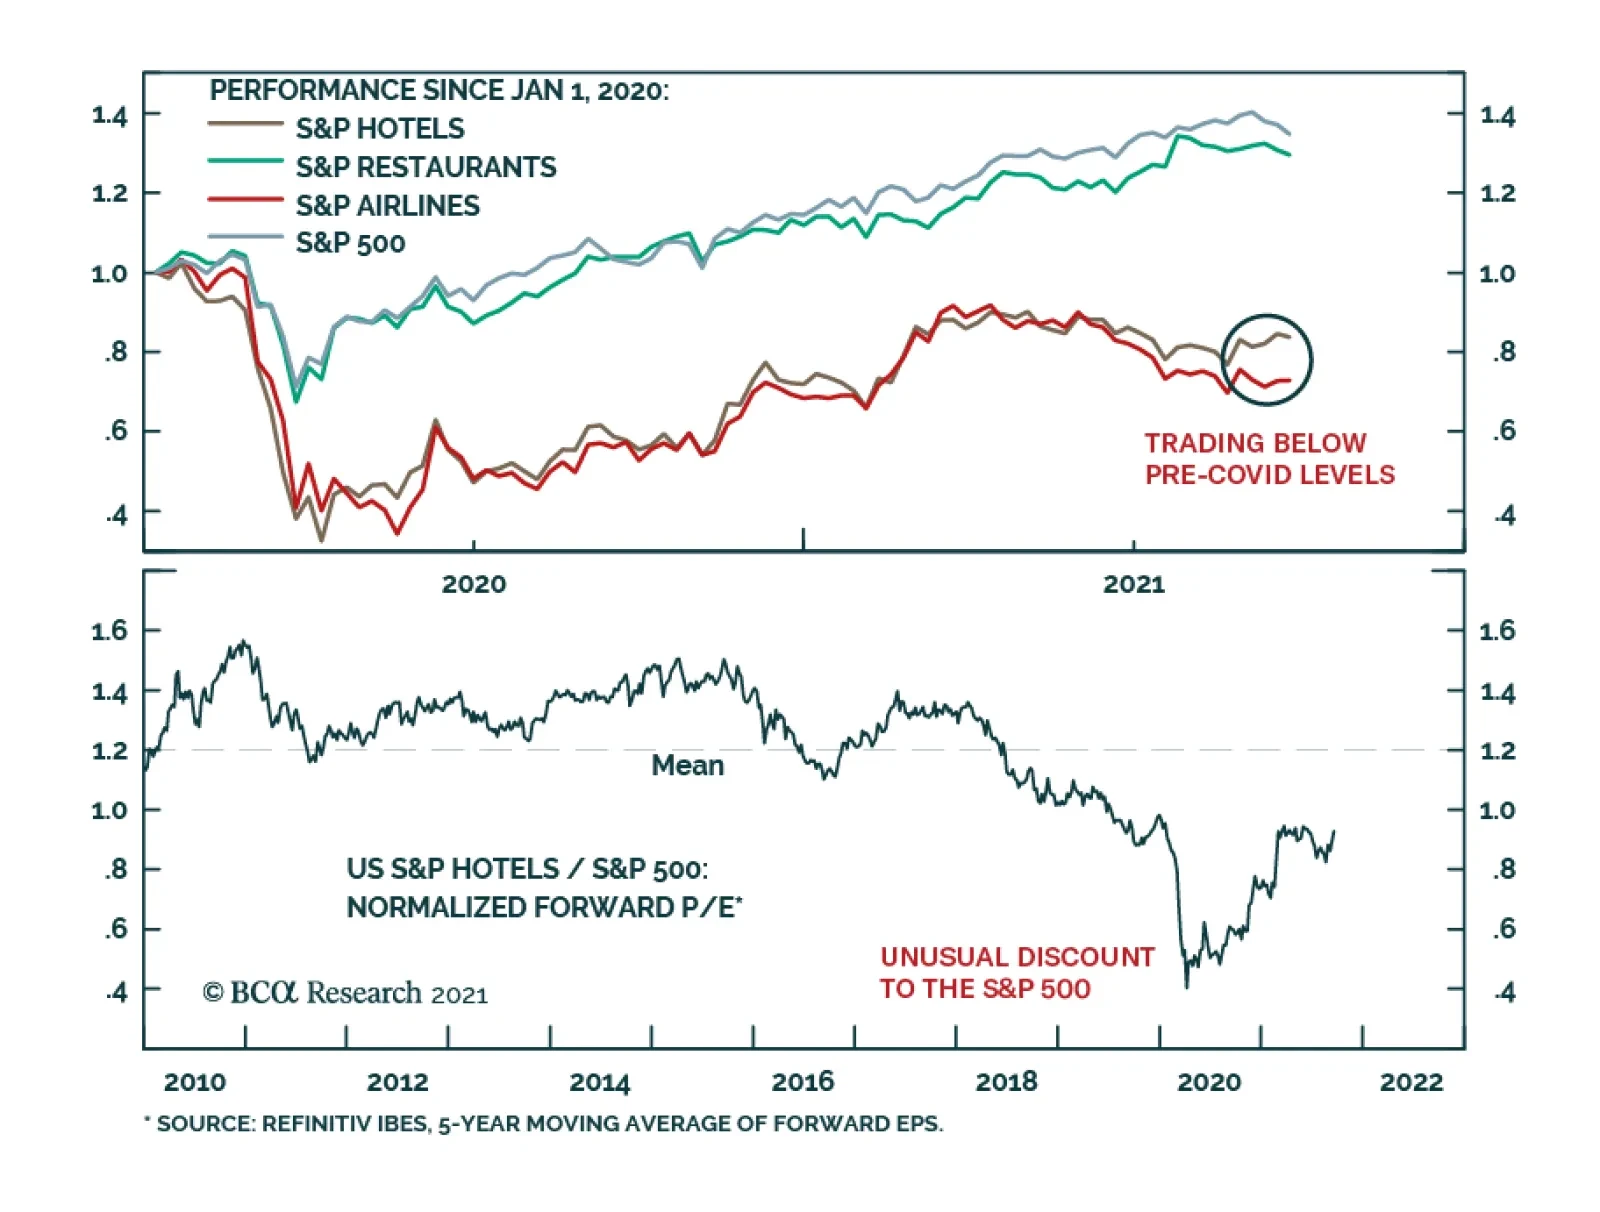
BCA Research’s US Equity Strategy service recommends overweighting the Hotels, Resorts, and Cruise Lines industry. The team summarizes this view as follows: The Delta variant is cresting. Their base case is that herd immunity is not far off. Of…
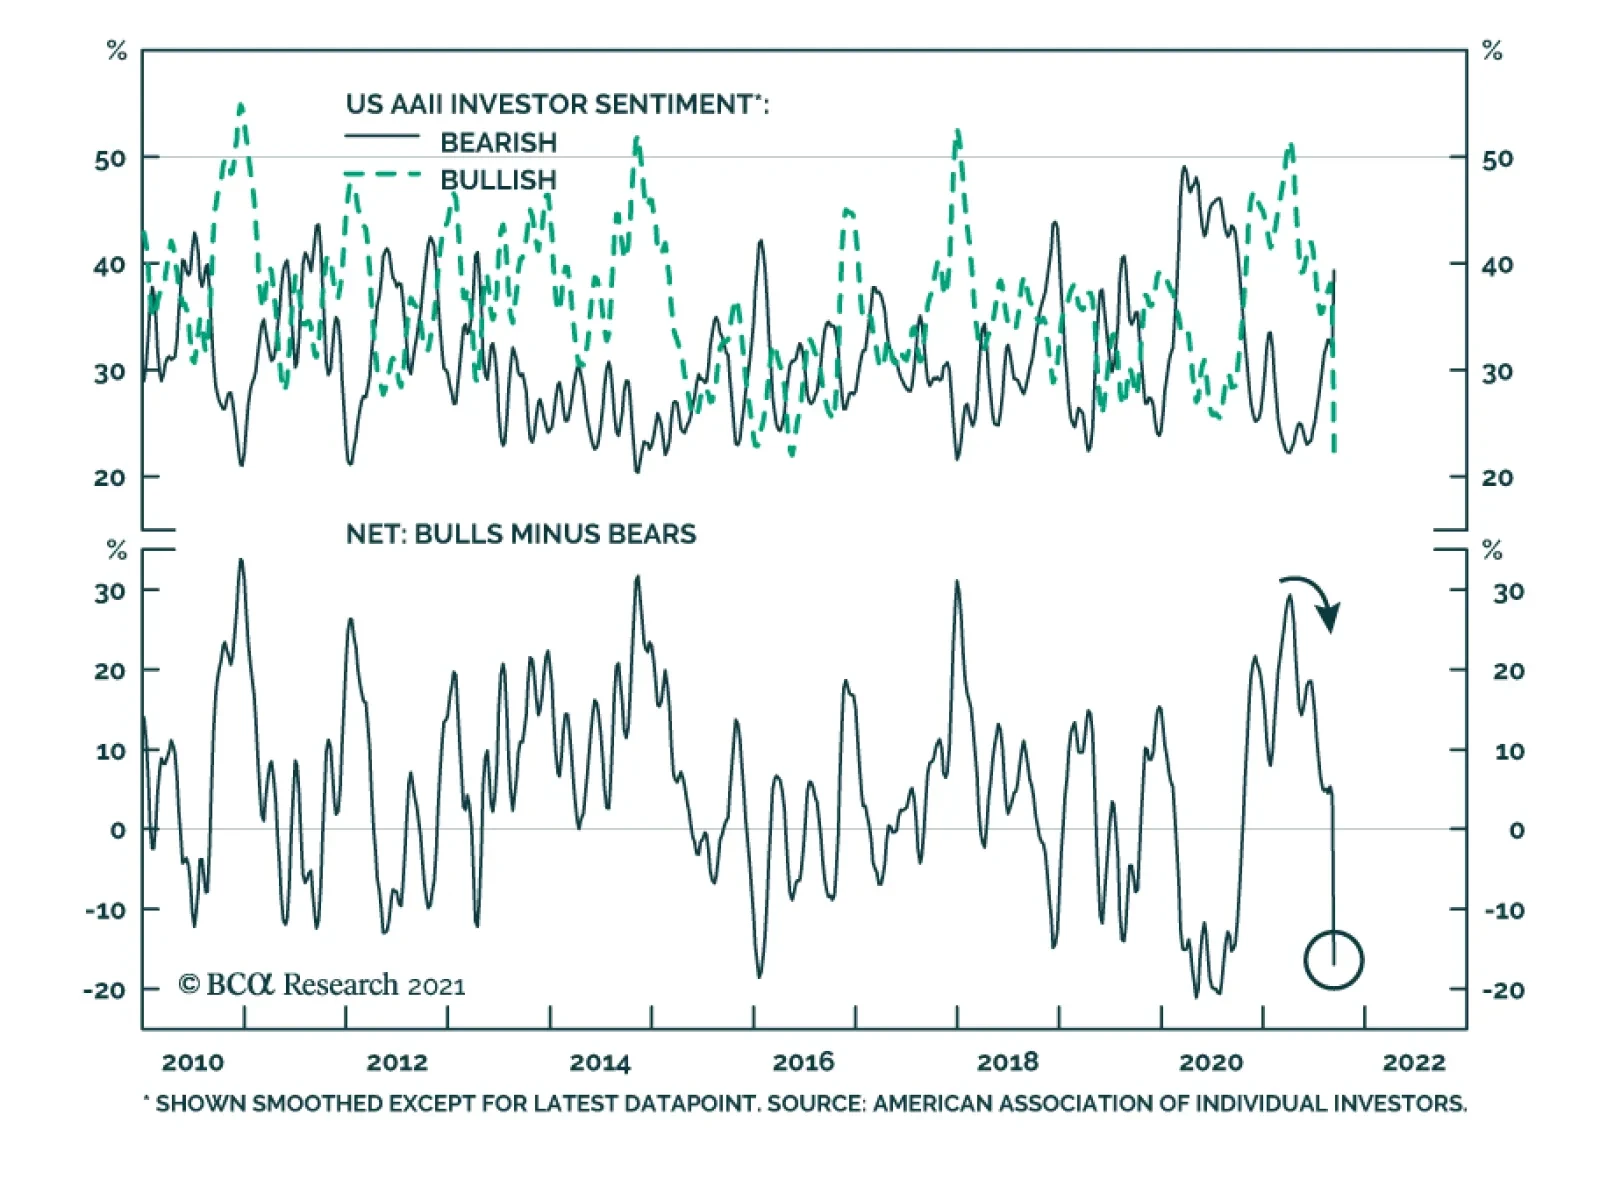
The American Association of Individual Investors’ latest sentiment survey reveals that bullish sentiment has collapsed. Bears exceeded bulls by 16.9 points in the week ending September 15 – among the widest margins in the history of the series. There are…
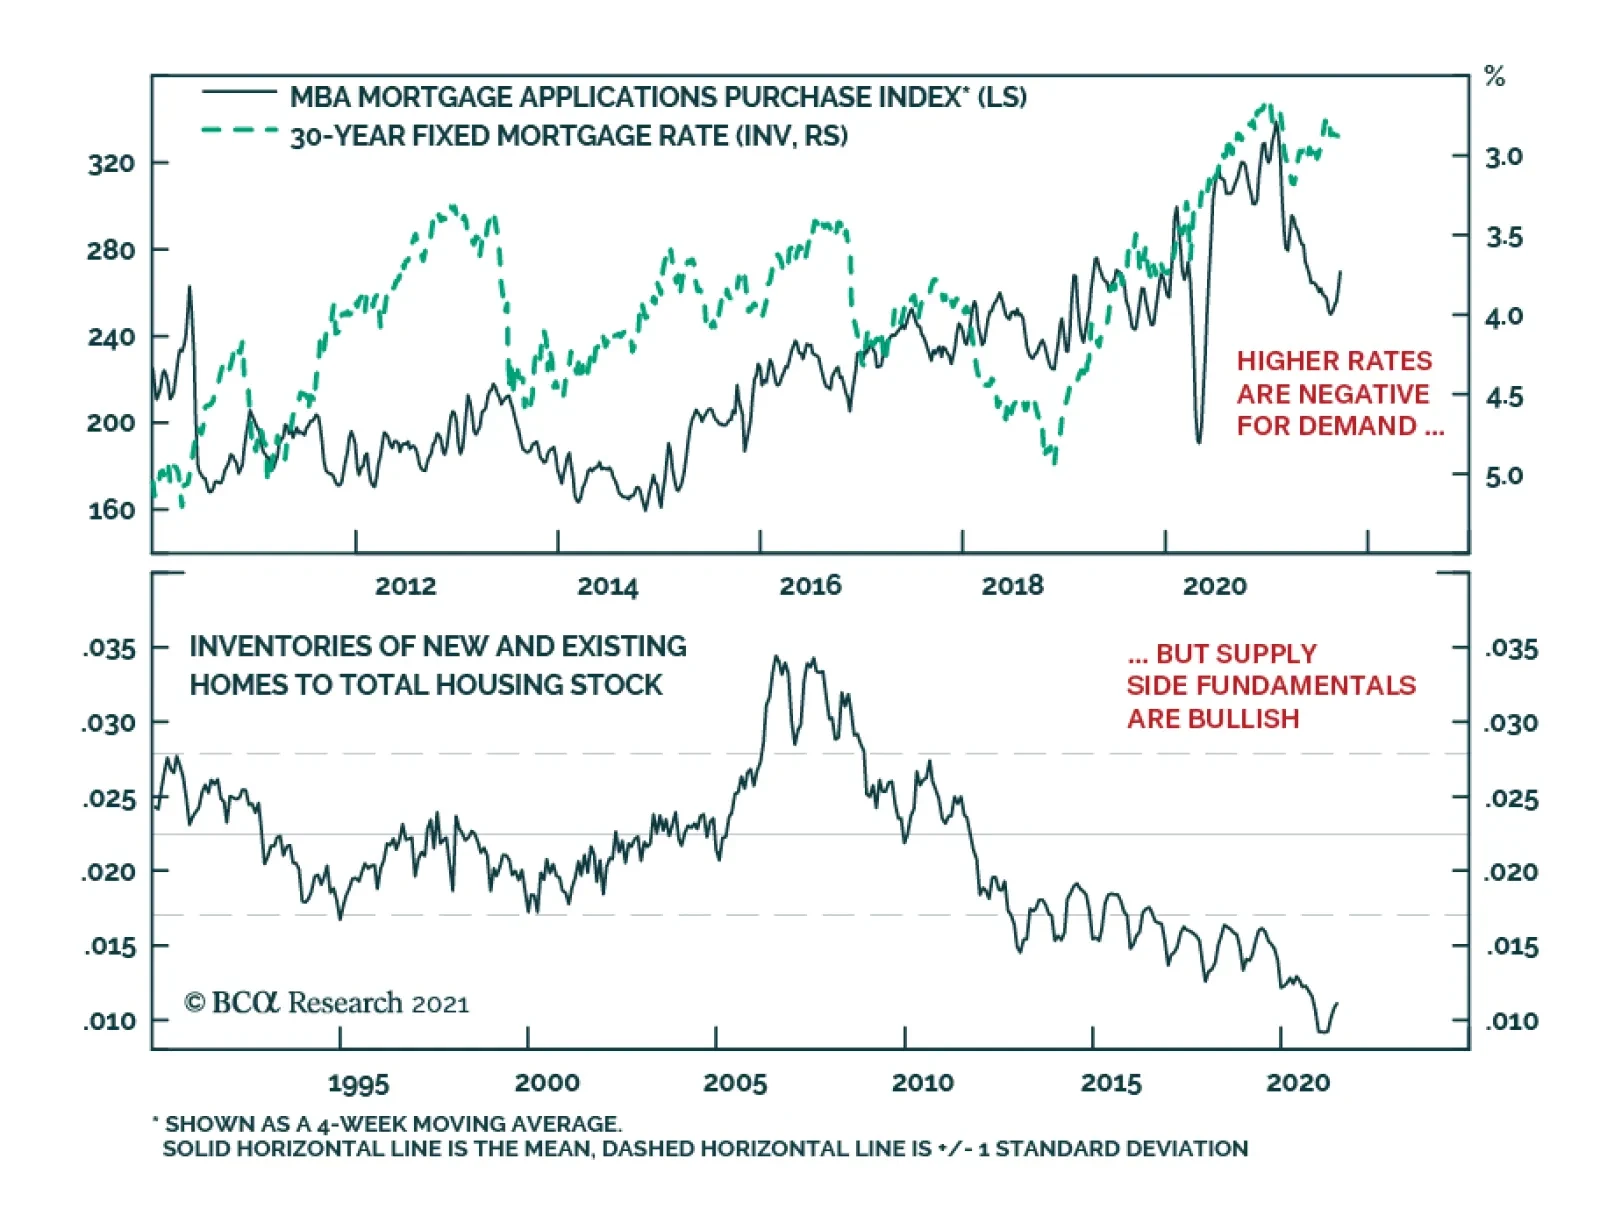
According to the latest MBA weekly survey, mortgage applications increased 4.9% in the week ending September 17. Mortgage applications to purchase a home climbed to the highest level since April. The massive accumulation of household excess savings and the…
Over the past few days, we have received several questions regarding the decrease in US savings we highlighted on Chart 4 in the most recent Strategy Report. US personal savings have decreased by roughly $4 trillion (SAAR) since their recent peak in March 2021, which raises the question of where all that money went? We must start by looking at how personal savings are computed. Broadly speaking, the savings number is a “stock,” which has income as an inflow and spending outlays as an outflow. Change in either of them changes the level of savings in the economy. The recent decrease in personal savings was due to the decrease in the income component, while spending outlays have remained unchanged. Specifically, the $4 trillion SAAR decrease in savings matches the $4 trillion SAAR decrease in government transfers (Chart 1). The implication is that dissaving merely maintained the same level of consumer spending. Chart 1
CHART 1
CHART 1
In fact, US retail sales have contracted since March 2021, further validating our conclusion that savings did not decrease because of additional spending (Chart 2, top panel). The breakdown of the US retail sales release (Charts 2- 4) shows that the categories which increased are restaurant, miscellaneous retail, clothing stores, food & beverage retail, and gas stations. Spending on durable goods has declined. Chart 2
CHART 2
CHART 2
Chart 3
CHART 3
CHART 3
Chart 4
CHART 4
CHART 4
Bottom Line: The fall in US personal savings from the recent March 2021 peak was driven by a decline in government transfers, and consumers dipping into savings to pay for services and everyday needs.
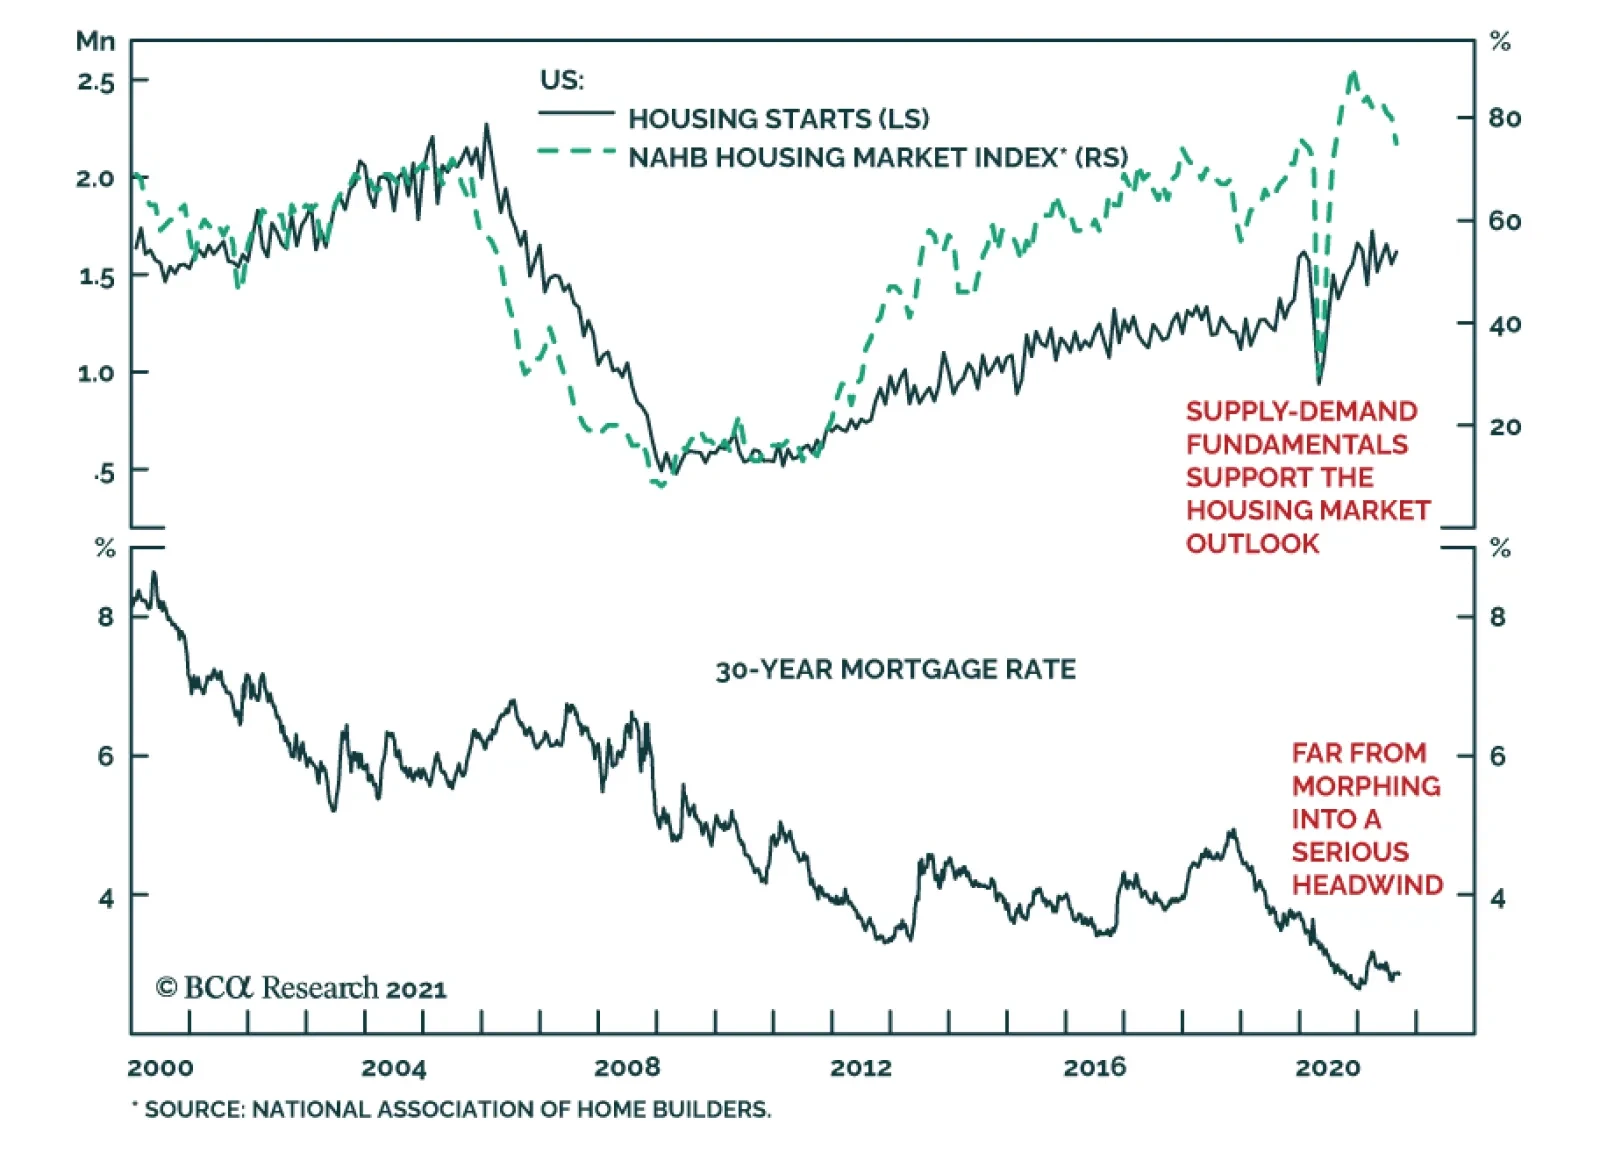
US housing market data surprised to the upside in August. Housing starts increased 3.9% m/m versus expectations of a 1.0% rebound following July’s 6.2% contraction. Similarly, building permits accelerated to 6.0% m/m from 2.3% – beating expectations of a…