United States
BCA Research’s US Bond Strategy service expects corporate bonds to outperform Treasuries during the next 6-12 month. However, both excess returns and total returns will take a step down. Two broad factors must be considered when deciding whether to favor…

Today we take a close look at the historical GICS1 level performance following the taper event in 2013. Chart 1 provides an overview of a price action of the 10-year US Treasury yield, the US dollar, and gold to provide context, while Charts 2 - 4 summarize performance of the S&P sectors. Chart 1
CHART 1
CHART 1
Chart 2
CHART 2
CHART 2
Chart 3
CHART 3
CHART 3
Chart 4
CHART 4
CHART 4
The Fed’s decision to modestly reduce the pace of its asset purchases in December of 2013 was a risk-off event which triggered a decline in Treasury yields and put upward pressure on the dollar. S&P 500 sectors followed the script from a risk-off “playbook” with Technology outperforming on the back of falling Treasury rates, while Financials underperformed. A spike in USD also led to underperformance of the Energy sector. The Consumer Discretionary sector was a notable outlier underperforming the S&P 500 by 6%. However, empirical analysis is hardly helpful in this case as in 2013 Amazon constituted 7.05% of the sector weight compared to 40% today. Finally, the performance of the defensive sectors was mixed as while tapering was perceived by the market as a clear risk-off event, it was also a sign that the economy is strong, and the Fed is comfortable with withdrawing the liquidity crutch. Bottom Line: Investors should not worry about the Fed and tapering as in the US its effect was short-lived and many more years of the bull market have ensued after it.
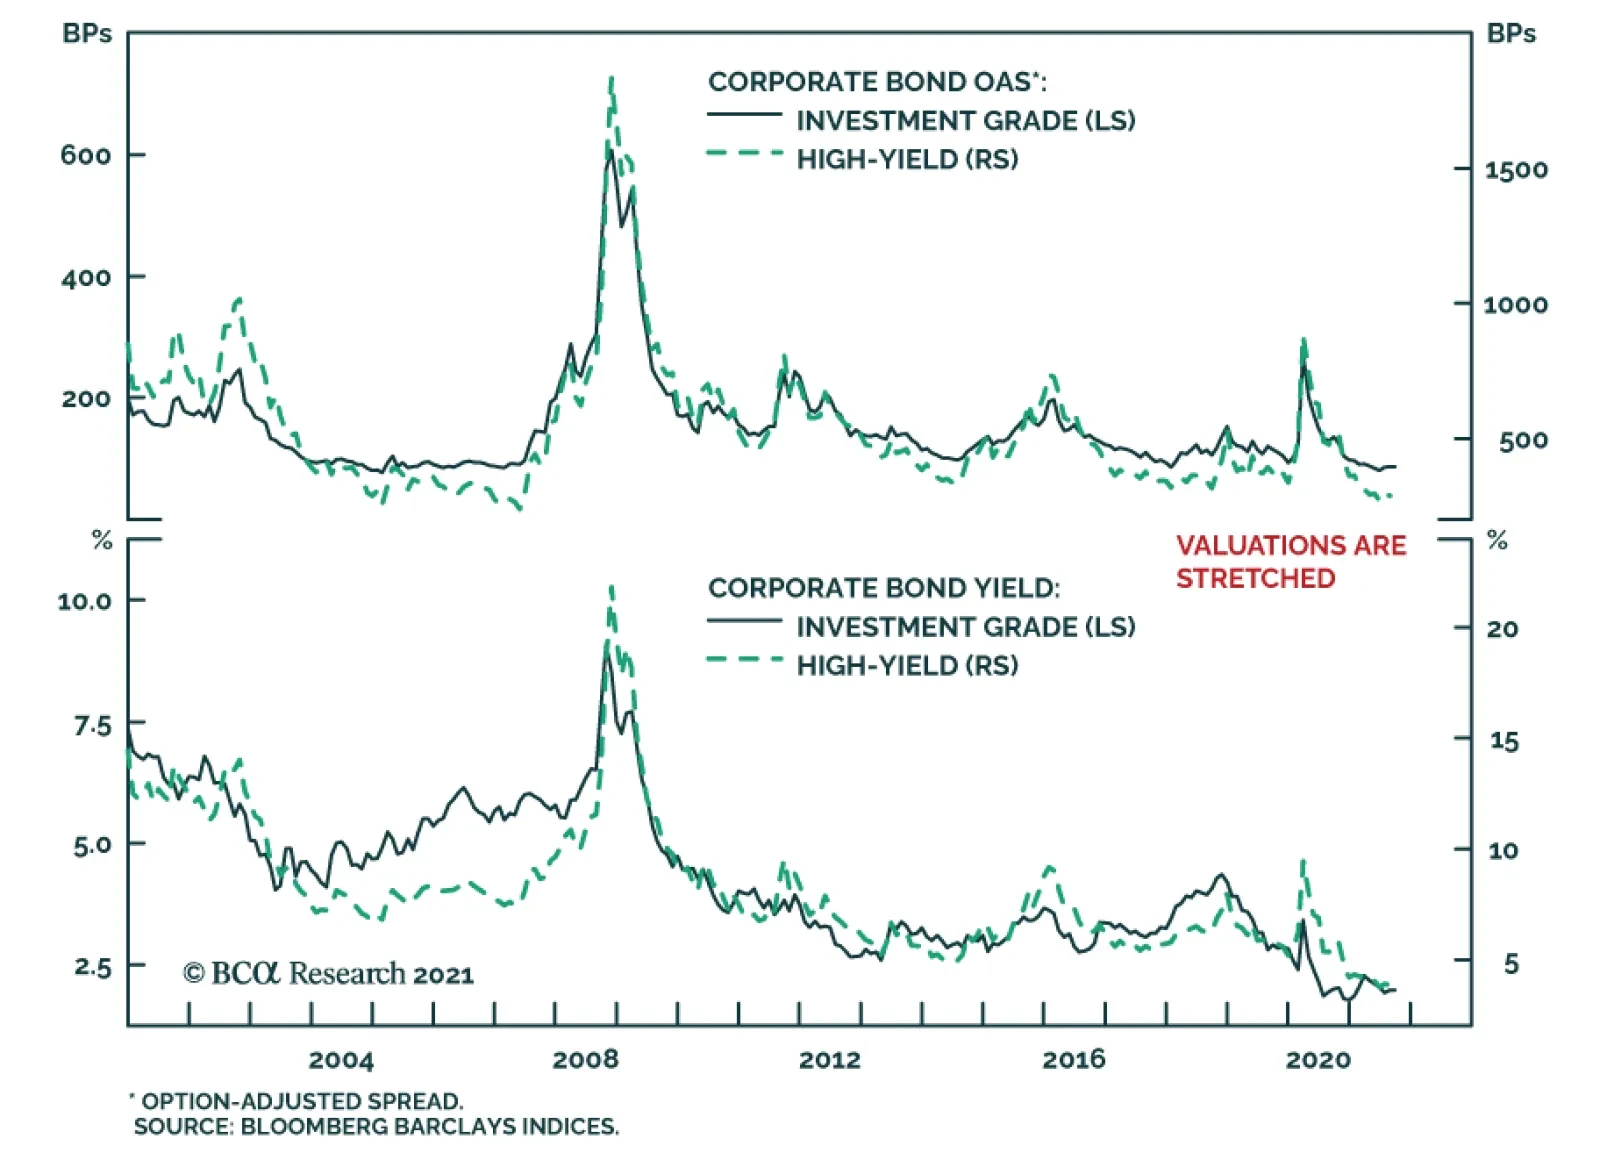
Highlights Investment Grade: Investment grade corporate bond total returns will be close to zero or negative during the next 12 months. The bonds are also likely to outperform duration-matched Treasuries during that period, but excess returns are probably capped at 85 bps. High-Yield: High-yield total returns will fall between -0.29% and +1.80% during the next 12 months, but with a much higher likelihood of being positive than investment grade corporates. Junk will outperform duration-matched Treasuries by between 0.94% and 1.84%, besting the excess returns earned in investment grade. Inflation & The Fed: The Fed will announce asset purchase tapering before the end of this year, and tapering will proceed at a pace that opens the door to a potential rate hike before the end of 2022. Ultimately, whether the Fed lifts rates in 2022 will depend on trends in core CPI excluding COVID-impacted services and autos, along with wage growth and inflation expectations. Feature Chart 1Valuations Are Stretched
Valuations Are Stretched
Valuations Are Stretched
There are two broad factors that must be considered when deciding whether to favor corporate bonds over Treasuries in a US bond portfolio: (i) The cyclical macroeconomic environment and (ii) valuation. The problem is that, as it stands today, these two factors are sending contrasting signals. The cyclical macroeconomic environment is consistent with strong positive excess returns for spread product versus Treasuries. However, corporate bond spreads and yields are extremely low relative to history (Chart 1). We view the slope of the yield curve as the single best indicator of the cyclical macro environment and have shown in prior research that corporate bonds tend to deliver positive excess returns versus Treasuries when the 3-year/10-year Treasury slope is above 50 bps, even when corporate spreads are tight.1 At present, the 3-year/10-year slope sits at 90 bps and our bias will be toward an overweight allocation to corporates until the slope breaks below 50 bps. A flatter yield curve is negative for corporate bond performance because it suggests that monetary conditions are less accommodative. It also makes it more likely that an unforeseen shock will lead to yield curve inversion, a highly reliable recession indicator. While the macro environment is consistent with continued corporate bond outperformance versus Treasuries, valuation suggests that we should anticipate lower returns than usual from corporate bonds. Table 1 shows annualized corporate bond excess returns during each of the past six cycles. Additionally, it splits each cycle into three phases based on the slope of the 3-year/10-year Treasury curve. Phase 1 of the cycle lasts from the end of the prior recession until the slope breaks below 50 bps. Phase 2 encompasses the period when the slope is between 0 bps and 50 bps. Phase 3 lasts from when the yield curve inverts until the start of the next recession. Table 1Corporate Bond Excess Returns In Different Phases Of The Cycle
Expected Returns In Corporate Bonds
Expected Returns In Corporate Bonds
The first conclusion to draw from Table 1 is that excess returns tend to be lower in Phase 2 than in Phase 1 and lower in Phase 3 than in Phase 2. Second, we see that investment grade corporates have returned an annualized 7.55% in excess of duration-matched Treasuries so far this cycle and high-yield corporates have delivered 15.15% of outperformance. These figures are well above even those seen in prior Phase 1 periods. Based on this, an expectation for lower – but still positive – excess corporate bond returns seems like a reasonable base case for the next 6-12 months. Table 2 is identical to Table 1 except that it shows total returns instead of excess returns. We observe that, so far this cycle, junk bond total returns have outpaced prior Phase 1 periods. Investment grade total returns have been slightly lower given the greater exposure to interest rate risk of those securities. Table 2Corporate Bond Total Returns In Different Phases Of The Cycle
Expected Returns In Corporate Bonds
Expected Returns In Corporate Bonds
As noted above, our expectation is that corporate bonds will outperform Treasuries during the next 6-12 months, but that both excess returns and total returns will take a step down. The next section of this report presents a scenario analysis that puts some more specific numbers on the sorts of excess and total corporate bond returns investors might expect to earn during the next year. Corporate Bond Returns: Scenario Analysis Methodology To run our scenario analysis for investment grade corporate bond returns we use the following equations: Excess Return = OAS0 – D0 (dOAS) Total Return = OAS0+ TSY0 – D0 (dOAS+dTSY) Where: Excess Return = The expected corporate index excess return versus duration-matched Treasuries during the next 12 months Total Return = The expected corporate index total return during the next 12 months OAS0 = Today’s average index option-adjusted spread D0 = Today’s average index duration TSY0 = Today’s Treasury yield that matches the duration of the corporate index dOAS = The expected change in the index option-adjusted spread during the next 12 months dTSY = The expected change in the duration-matched Treasury yield during the next 12 months These equations are obviously simplifications. For example, the impact of convexity is ignored. However, Chart 2 shows that our proxies track actual index returns very closely over time, assuming the estimated yield and spread changes are accurate. Chart 2Estimating IG Returns
Estimating IG Returns
Estimating IG Returns
We use similar equations for assessing high-yield corporate returns, with the additional complication that we must include an assumption for default losses. Excess Return= OAS0 – (DR × (1 - RR)) –D0(dOAS) Total Return= OAS0 + TSY0 – (DR × (1 – RR)) –D0 (dOAS + dTSY) In these equations: DR = The expected issuer-weighted default rate for the next 12 months RR = The expected average recovery rate on defaulted debt for the next 12 months Once again, though these equations are relatively simple, they do a good job of capturing actual returns over time (Chart 3). Chart 3Estimating HY Returns
Estimating HY Returns
Estimating HY Returns
Scenarios With the above equations in hand, we can easily make some educated guesses about future yields, spreads and default losses and translate those assumptions into expected return forecasts. Specifically, we test three different scenarios (bullish, neutral and bearish) for corporate spreads, Treasury yields and default losses. For corporate index spreads, both investment grade and high-yield, our bullish scenario assumes that spreads reach the all-time tight levels seen in the mid-1990s. For investment grade bonds this spread level is 58 bps, 27 bps below the current level. For high-yield bonds this spread level is 233 bps, 41 bps below the current level. Our neutral scenario assumes that index spreads remain at their current levels (85 bps for investment grade and 274 bps for junk). Finally, our bearish scenario assumes that spreads widen back to the average levels seen during the 2017-2019 period (112 bps for investment grade and 369 bps for junk), this implies 27 bps of widening for investment grade and 95 bps of widening for junk. Given our view that bond yields will rise as we approach the next Fed tightening cycle, none of our scenarios assume that Treasury yields will fall during the next 12 months. Our bullish Treasury yield scenario assumes that yields stay flat at current levels. Our neutral Treasury yield scenario assumes that yields follow the path implied by current forward rates, and our bearish Treasury yield scenario assumes that yields rise to levels consistent with fair value estimates assuming the market prices-in a December 2022 Fed liftoff followed by 100 bps of rate hikes per year until the fed funds rate levels-off at 2.08%.2 We use the 7-year and 6-year Treasury yields as our inputs for the investment grade and high-yield scenarios, respectively, as those yields most closely match the interest rate component embedded in the corporate indexes. For default losses, our bullish scenario assumes a 1.8% default rate – consistent with the rate at which defaults are tracking so far this year – and a recovery rate of 50%. Our neutral scenario assumes a 3% default rate and a 40% recovery rate. Our bearish scenario assumes a 4% default rate and 30% recovery rate. Investment Grade Results Table 3 shows the results of our scenario analysis for investment grade corporate bond returns. Table 3Investment Grade Corporate Bond Expected Return Scenarios
Expected Returns In Corporate Bonds
Expected Returns In Corporate Bonds
Starting with excess returns, we think it is most likely that spreads remain near current levels, or perhaps widen a bit, during the next 12 months. We think it’s extremely unlikely that spreads will tighten to the levels seen in the mid-1990s because the average duration of the index is much higher today than it was back then. All else equal, it’s generally true that securities with higher duration also have higher OAS. This means we expect investment grade corporate bond excess returns to be between -153 bps and +85 bps during the next 12 months, probably closer to +85 bps. Obviously, this represents a significant step down from the +550 bps earned during the past year. In fact, even the most bullish scenario where spreads tighten back to all-time lows only implies an excess return of +323 bps, well below the recent rate of outperformance. As for total returns, we estimate that a neutral scenario where the index spread holds steady and Treasury yields follow the forward curve will lead to total returns being close to zero during the next 12 months. In fact, our results suggest that it’s highly likely that investment grade corporate bonds will deliver negative total returns during the next 12 months. Yes, the index is expected to deliver a total return of 1.98% if both the index spread and duration-matched Treasury yield remain at their current levels, but an environment where growth is slow enough to keep Treasury yields flat is much more likely to coincide with spread widening than with steady corporate spreads. For some additional historical perspective, the columns labeled “Historical Percentile Rank” show how the returns in each scenario would rank relative to actual returns earned during the past 31 calendar years. For example, even the most bullish total return scenario of 4.36% ranks at the 27th percentile relative to history. This means that it would only be better than 27% of historical 12-month return observations for that index. High-Yield Results Tables 4A, 4B and 4C summarize the results of our high-yield scenario analysis. Table 4A assumes the bullish scenario for default losses, Table 4B assumes the neutral scenario for default losses and Table 4C assumes the bearish scenario for default losses. Table 4AHigh-Yield Corporate Bond Expected Return Scenarios: Bullish Default Loss Scenario*
Expected Returns In Corporate Bonds
Expected Returns In Corporate Bonds
Table 4BHigh-Yield Corporate Bond Expected Return Scenarios: Neutral Default Loss Scenario*
Expected Returns In Corporate Bonds
Expected Returns In Corporate Bonds
Table 4CHigh-Yield Corporate Bond Expected Return Scenarios: Bearish Default Loss Scenario*
Expected Returns In Corporate Bonds
Expected Returns In Corporate Bonds
Looking at excess returns, the first result that jumps out is that even the most bullish scenario leads to an expected 12-month excess return of +3.43%, this would be equivalent to the median return earned during the past 31 calendar years. In our view, it’s more likely that excess returns will be in the +0.94% to +1.84% range during the next 12 months. This is consistent with flat spreads and a range for default losses between our neutral and bullish scenarios. Our sense is that junk bonds are less likely to deliver negative total returns than investment grade bonds. Though even the most bullish scenario puts expected junk total returns at +4.54%, consistent with the 39th percentile relative to history. Investment Implications To summarize, our expectation is that investment grade corporate bond total returns will be close to zero or negative during the next 12 months. The bonds are also likely to outperform duration-matched Treasuries during that period, but excess returns are probably capped at 85 bps. Our best guess places high-yield total returns at between -0.29% and +1.80%, but with a much higher likelihood of earning positive total returns than a position in investment grade. We estimate that excess junk returns will fall between +0.94% and +1.84%, above returns earned in investment grade. In general, the message is that investors should remain overweight corporate bonds versus Treasuries, but should retain a preference for high-yield over investment grade and should expect to earn far lower returns than were earned during the past year. Given low expected returns, investors should also seek out creative ways of adding additional spread to a bond portfolio. We offered some suggestions in a recent report.3 CPI Update And FOMC Preview This week’s FOMC meeting could be significant for bond markets. First off, there is a possibility that the Fed will announce a timeline for tapering its asset purchases. Our sense is that last month’s weak employment report probably delays this announcement, but we still expect it to come before the end of the year. We expect that the actual tapering of purchases will start in January 2022 and that net Fed purchases will reach zero by Q3 of next year. More broadly, we continue to think that the market is already priced for a tapering announcement in 2021. In other words, any information about asset purchases probably won’t move bond yields that much. What will move bond yields is any hint about when the Fed thinks it may want to start lifting rates. Such news could come in the form of revisions to the Fed’s interest rate forecasts, or in any information that the Fed provides about the pace of asset purchase tapering. Because the Fed has indicated a strong preference for having net purchases at zero prior to liftoff, any pace of tapering that gets net purchases to zero by the middle of next year opens the door to a possible rate hike before the end of 2022. Of course, the economic data between now and the end of 2022 will have a lot to say about whether the Fed actually starts to hike. In particular, last week’s report made the case that next year’s inflation data will determine when rate hikes begin.4 With that in mind, last week’s CPI release showed a significant deceleration in core inflation, driven by the COVID-impacted service and auto sectors that had previously caused inflation to spike (Chart 4). Interestingly, core inflation excluding COVID-impacted services and autos jumped on the month (Chart 4, bottom panel). From the Fed’s perspective, it ignored the transitory rise of COVID-impacted service and auto inflation on the way up, it will also be inclined to ignore its descent. What will ultimately matter for monetary policy is whether underlying inflationary pressures start to build throughout 2022. It is therefore much more important for us to focus on trends in core inflation excluding the COVID-impacted services and autos, along with wage growth and inflation expectations. Our view is that underlying inflationary pressures will be strong enough for the Fed to lift rates before the end of 2022. This will, in large part, be due to an acceleration of shelter inflation (Chart 5). Owner’s Equivalent Rent and Rent of Primary Residence inflation have already jumped, and leading indicators of shelter inflation like the unemployment rate (Chart 5, panel 3) and the Apartment Market Tightness Index (Chart 5, bottom panel) are consistent with further acceleration. Chart 4Looking For Underlying Inflation
Looking For Underlying Inflation
Looking For Underlying Inflation
Chart 5Shelter Inflation Will Keep Rising
Shelter Inflation Will Keep Rising
Shelter Inflation Will Keep Rising
Bottom Line: The Fed will announce asset purchase tapering before the end of this year, and tapering will proceed at a pace that opens the door to a potential rate hike before the end of 2022. Ultimately, whether the Fed lifts rates in 2022 will depend on trends in core CPI excluding COVID-impacted services and autos, along with wage growth and inflation expectations. Ryan Swift US Bond Strategist rswift@bcaresearch.com Footnotes 1 Please see US Bond Strategy Weekly Report, “The Post-FOMC Credit Environment”, dated June 29, 2021. 2 Last week’s report provides more detail on this fair value analysis. Please see US Bond Strategy Weekly Report, “2022 Will Be All About Inflation”, dated September 14, 2021. 3 Please see US Bond Strategy Weekly Report, “The Collapsing Credit Risk Premium”, dated July 20, 2021. 4 Please see US Bond Strategy Weekly Report, “2022 Will Be All About Inflation”, dated September 14, 2021. Recommended Portfolio Specification Other Recommendations Treasury Index Returns Spread Product Returns
BCA Research’s Foreign Exchange strategists maintain a bearish outlook for the US dollar. US growth momentum is starting to rotate away from the US to other economies. Meanwhile, central banks are beginning to shift towards policy normalization. Several DM…

BCA Research's US Investment Strategy service does not expect the fall of an overextended Chinese property developer to push the US out of Goldilocks and into too-cold territory. Reports that Evergrande will fail to make scheduled interest and principal…
Highlights Covid-19 has wreaked havoc in the markets, but the Hotels, Restaurants & Leisure, and Airline industries have been most affected. These industries constitute what we call the “travel complex” as they share common drivers of profitability: First, they have been significantly affected by restrictions imposed on individuals and businesses in response to Covid-19 and, second, they rely on discretionary spending. Recovery of the group was proceeding swimmingly until the Delta variant derailed it in late summer, with reports pouring in about dining rooms closing, airline bookings flagging, and hotel occupancy dipping. What is next? The Delta variant is cresting. Our base case is that herd immunity is not far off. Of course, the travel complex is vulnerable to any new virus scare, and this is a risk investors need to keep in mind. Rising rates will be a mild tailwind for the group, as it tends to outperform in that regime. But this is not a key driver of its performance. Consumer confidence and financial wellbeing are at the core of this group’s profitability. So far, Americans still have money to spare and generally prefer to spend it on services. It is disconcerting that the Consumer Confidence Indicator has turned, but we are not too alarmed just yet: Jobs are still plentiful, and Americans are going back to work. August retail sales surprised on the upside. In Part 1 of the report this week, we take a deep dive into the Hotel, Resort, and Cruise Lines industry. We find the industry attractive for the following reasons: Hotel occupancy has increased, and the amount of money consumers are prepared to spend in hotel stays has surged. Sales are expected to increase by 75%, albeit from low levels, over the next 12 months. Hotels have also discovered many new sources of revenue. Earnings growth is impossible to estimate since last year the industry was losing money; however, margins have just turned positive. Companies also have significant pricing power to pass on expenses to their guests, and have the ability to mend their margins, eventually going back to the historical 20%. Lastly, the industry is cheap relative to its own history on a forward PE basis. According to our Technical Indicator, it is also oversold. The Hotels, Resorts, and Cruise Lines industry has a significant potential to return to its former “glory”, and we believe that it is a sound tactical and cyclical investment. We recommend overweighing this industry. NB: Please stay tuned for Part 2 of the report, on Restaurants and Airlines, next week. Feature Part 1: Hotels, Resorts And Cruise Lines In this two-part publication, we will provide an in-depth overview of Hotels, Restaurants, and Airlines. These industries constitute what we call the “travel complex” as they share many common drivers of profitability: First, they are the industries most exposed to Covid-related fears as well as corresponding government health directives, and, second, they rely on the discretionary spending of both consumers and businesses. In this publication, we will examine the macroeconomic backdrop for the entire travel complex, and then zoom into the Hotels, Resorts, and Cruise Lines industry (“Hotels”). Next week, we will provide an in-depth overview of Restaurants and Airlines. Sneak preview: We are bullish on Hotels and are overweight this industry in our portfolio. Hotels, Restaurant And Leisure, Along With Airlines, Were The Poster Child For Post-Covid Recovery… Covid-19 has wreaked havoc in the markets, but the travel complex was most affected. Airlines, hotels, and restaurants have suffered tremendous losses, and all have required government bailouts either directly, or indirectly through the Paycheck Protection Program (PPP). The travel complex rebounded mightily as the vaccine became widely available in February, and Americans suffering from cabin fever boarded planes, traveled, and ate out (Chart 1). Chart 1Hotels And Airlines Are Still Trading Below Their Pre-Covid Levels
Hotels And Airlines Are Still Trading Below Their Pre-Covid Levels
Hotels And Airlines Are Still Trading Below Their Pre-Covid Levels
Table 1Travel Complex Is Lagging S&P 500
Travel: Extend Your Hotel Stay (Part 1)
Travel: Extend Your Hotel Stay (Part 1)
…Everything Changed This Summer All these positive developments began to reverse over the summer as Delta made its appearance in the US, and even the vaccinated succumbed to fears of infection. Airlines were one of the worst performers in the index. Hotels and restaurants were doing better, but their performance did not shoot the lights out either (Table 1). Restaurants: According to a National Restaurant Association survey of 1,000 adults, in recent weeks nearly one in five Americans say they are no longer going out to restaurants, 9% have canceled existing plans to eat out, and 37% of adults said they ordered delivery or takeout instead of dining in a restaurant. Chains like McDonald’s and Chick-fil-A are slowing their dining room reopenings. As data from restaurant analytics firm Black Box Intelligence demonstrate, sales that had grown steadily earlier this summer have fallen.1 Airlines: Several major airlines have warned in regulatory filings that their third quarter may not look as rosy as hoped. United Airlines has noted a deceleration in customer bookings, while Southwest Airlines reported a continued softness in bookings—even in leisure—and elevated trip cancelations. Similarly, American Airlines has said that, after a strong July, it saw a softness in near-term bookings in August and an increase in near-term cancelations. All three have suggested that the Delta variant is having a dampening effect on business.2 Hotels: Marriott International said that revenue per available room in August of 2021 was down 27% from the 2019 level – a drop from the 23% decline seen in July. However, the CEO of the company sounded sanguine: “The trends seem to be stabilizing as we get into the early days of September”. Most of the decline came from lockdowns in China. The most recent data shows revenue per available room was down 44 percent off 2019 levels — not ideal but an improvement from the 57 percent decline seen a week prior.3 With bad news abundant, the natural question is whether these industries are still a good tactical and cyclical investment. Delta Variant Clearly, a resurgence in infections has had an adverse effect on the travel complex. However, there are early signs that the Covid-19 Delta variant is cresting (Chart 2). Around 75% of the U.S. population has had at least one vaccine shot. Globally, 31.5 million doses/day are being administered. At this rate, it will take just eight months to vaccinate 75% of the global population. Herd immunity is not far off. Our base case is that Covid-19 and its multiple variants are unlikely to disappear, but consumers and businesses are learning how to live with it. We believe that the surge of Delta infections will subside over the fall, and the entire travel complex will continue to recuperate from the Covid-inflicted damage. Of course, the resurgence of Covid-19 cases and newer variants could undermine a recovery. This is a risk investors need to monitor. Chart 2The Covid-19 Delta Variant Is Cresting
The Covid-19 Delta Variant Is Cresting
The Covid-19 Delta Variant Is Cresting
Macroeconomic Backdrop Rising Rates Are A Tailwind For The Travel Complex Direction and rate of change in yields dictate which US equity sectors and industries will do well. There are many crosscurrents in both economic data and Fed speak currently that obscure the answer to this question. Analysis of the performance of travel industries by rates regime suggests that all of them tend to do better when rates are rising, as higher rates indicate stronger economic growth (Chart 3). Airlines are most sensitive to an economic slowdown and will underperform most if rates stay “lower for longer”. Consumers Still Have Money To Spend On Services But Less Than Before Chart 3Travel Outperforms When Rates Are Rising
Travel: Extend Your Hotel Stay (Part 1)
Travel: Extend Your Hotel Stay (Part 1)
Travel is a quintessential representation of discretionary spending on services. Consumers travel and eat out when they are confident about the future and have a healthy income and excess savings. Chart 4Disposable Income And Savings Are Returning To Trend
Disposable Income And Savings Are Returning To Trend
Disposable Income And Savings Are Returning To Trend
The helicopter money drop has increased consumer income and padded their savings. However, income gains were not permanent and, recently, disposable income has returned to trend (Chart 4, Panel 1). Further, much of the excess savings has been spent (Chart 4, Panel 2). In another unpleasant twist, over the past few months, wage gains (4.8%) have lagged price increases (5.2%), reducing the purchasing power of American consumers. In response to these developments, the consumer mood has soured: The Consumer Confidence Indicator has slumped to a six-month low of 114 from 125 a month earlier. The next 12-month inflation expectations have surged to 6.5%. While it is disconcerting that consumer confidence has turned, we are not too alarmed just yet: Jobs are still plentiful, and Americans are likely to go back to work as the majority of children are now attending schools in person. In short, Americans are not destitute, but the pattern of spending is normalizing and returning to the pre-pandemic trend. The August retail sales print at 0.7% surprised on the upside and proves that US consumers have not tightened their belts. It is also a positive for the travel complex that demand for services exceeds demand for goods: Consumer expenditure on goods is above trend and has recently turned, while spending on services is below pre-pandemic levels, and the rebound is running its course (Chart 5). Inflation Is Not A Concern For The Travel Complex CPI readings for the travel complex this summer looked outright scary: In July, airfares were up 19% YoY and the price of hotel stays was up 24% YoY. These numbers have come down to 6.7% and 19.6% in August. Indeed, these readings make us wonder whether travel is still affordable to consumers. The answer is a resounding “yes” – reported surges in prices are a function of a base effect and, compared to the same time two years ago, the two-year CAGR of prices looks reasonable for all the industries (Chart 6). Chart 6Price Increases For The Travel Complex Are Moderate
Travel: Extend Your Hotel Stay (Part 1)
Travel: Extend Your Hotel Stay (Part 1)
Chart 5Real Spending On Services Is At Pre-Pandemic Levels: Room For Further Rebound
Real Spending On Services Is At Pre-Pandemic Levels: Room For Further Rebound
Real Spending On Services Is At Pre-Pandemic Levels: Room For Further Rebound
Analysis By Industry: Hotels, Resorts, And Cruise Lines Hotels is a $55B industry4 which is forecast to produce 31.4% growth in 2021 (Table 2). Its market cap is $239Bn and it constitutes 0.6% of the S&P 500 index. The US Hotel industry suffered about $125 billion5 in aggregate lost revenues due to the pandemic in 2020. Hotel operators were in total cash-conservation mode – slashing capex budgets by 75%, suspending dividends, and raising capital. Some 670,000 workers lost their jobs or were furloughed – only half of these workers have returned so far (Chart 7). Table 2Hotels (GICS 4) Constituents
Travel: Extend Your Hotel Stay (Part 1)
Travel: Extend Your Hotel Stay (Part 1)
After a tough year, Hotels have now mostly reopened. Demand is expected to surge by 31.4% YoY in 2021, and per room revenue has reached $94, higher than the pre-Covid-19 level. Many hotels have returned to profitability. However, hotel occupancy in the US is yet to return to the pre-pandemic level: It currently stands at around 50% compared to 70% plus pre-Covid (Chart 8). Chart 7Industry Was Decimated By Covid And Is Recovering Slowly
Industry Was Decimated By Covid And Is Recovering Slowly
Industry Was Decimated By Covid And Is Recovering Slowly
Chart 8Occupancy Rates Are Returning Back To Normal
Occupancy Rates Are Returning Back To Normal
Occupancy Rates Are Returning Back To Normal
Sources Of Revenue Hotels started to recover during the first half of 2021 and revenues are expected to continue to surge to well above the pre-pandemic level in 2022. Analysts expect hotel sales to rebound by 75% over the next 12 months (Chart 9). There are multiple sources of revenue, and a reduction in business travel and international tourism is likely to be replaced by other creative options. Leisure Travel: Significant pent-up demand has been driving a recovery in hotel stays, but it is mostly in leisure travel. According to AHLA, 56% of consumers say they expect to travel for leisure, roughly the same amount as in an average year. Consumer spending on hotels has rebounded and is close to the pre-pandemic normal (Chart 10). Chart 9Blockbuster Sales Growth Is Expected (Off Low Base)
Blockbuster Sales Growth Is Expected (Off Low Base)
Blockbuster Sales Growth Is Expected (Off Low Base)
Chart 10Consumers Eagerly Spend On Hotels
Consumers Eagerly Spend On Hotels
Consumers Eagerly Spend On Hotels
Business travel is still lagging. According to AHLA, business travel was down by 85% compared to 2019 through April 2021, and since then has only begun ticking up slightly. However, going forward, this trend may turn as companies start positioning their in-person visits as a competitive advantage. Bleisure travel: A new post-Covid trend has developed: Workers combine business travel with leisure, prolonging hotel stays. Another creative idea is “working from a hotel” packages to appeal to remote workers tired of being cooped up at home. International tourism: Covid-related restrictions in the rest of the world, and especially cessation of travel from China, is still denting hotel revenue. With global vaccination rates improving by the day, this segment won’t take long to rebound. Profitability While there is forecast to be a pronounced rebound in hotel sales growth over the next 12 months, it is less obvious whether and when the industry will return to its former levels of profitability (Chart 11). After all, not only was the travel complex damaged by the pandemic, but now hotel operators also incur additional Covid-related cleaning expenses. Currently, analysts expect the next 12 months EPS to rebound to about a quarter of January 2020 trailing EPS ($10 vs $34). While this looks measly, from an investment standpoint it presents an opportunity as eventually, albeit slowly, earnings will return to trend. Historical earnings growth is not calculable as the industry was losing money until very recently. Chart 11Earnings Are Expected To Grow Again
Earnings Are Expected To Grow Again
Earnings Are Expected To Grow Again
Margins And Pricing Power Margins crossed the zero threshold in Q2-2021, but are still almost 20 percentage points below the long-term average (Chart 12). While hotel costs have increased with the pandemic, this industry has significant pricing power to pass on its costs to consumers (Chart 13). Chart 12The Hotel Industry Has Returned To Profitability
The Hotel Industry Has Returned To Profitability
The Hotel Industry Has Returned To Profitability
Chart 13Hotels Have Significant Pricing Power And Can Pass Extra Costs To Guests
Hotels Have Significant Pricing Power And Can Pass Extra Costs To Guests
Hotels Have Significant Pricing Power And Can Pass Extra Costs To Guests
Valuations And Technicals The Hotels industry is trading at 30x forward PE and on a 5-year normalized basis, it is trading with a discount to the S&P 500, which is unusual (Chart 14). In terms of our Technical Indicator, the industry is somewhat oversold, and now looks more attractive than it did earlier this year (Chart 15). Chart 14Hotels Are Trading With A Discount To S&P 500 Which Is Unusual
Hotels Are Trading With A Discount To S&P 500 Which Is Unusual
Hotels Are Trading With A Discount To S&P 500 Which Is Unusual
Chart 15Hotels Are Slightly Oversold
Hotels Are Slightly Oversold
Hotels Are Slightly Oversold
Cruise Lines Cruise Lines were the worst-hit and the slowest to recover among the sub-industries, but they are expected to make a comeback in 2022 with a significant surge in revenue growth. Most of the drivers for these companies are similar to Hotels and Resorts – but recovery is delayed due to restrictions that kept cruise ships anchored much longer than initially expected. Investment Implications We stay with our overweight in Hotels, Resorts, and Cruise Lines. We will summarize the reasons: The Delta variant is cresting. Our base case is that herd immunity is not far off. Of course, the industry is also vulnerable to any new virus scare, and this is a risk that investors need to keep in mind. Rising rates will be a mild tailwind for the industry, as it tends to outperform in that regime. But this is not a key driver of its performance. Consumer confidence and financial wellbeing are at the core of Hotel profitability. So far, Americans still have money to spare and prefer to spend it on services. It is disconcerting that the Consumer Confidence Indicator has turned, but we are not too alarmed just yet: Jobs are still plentiful, and Americans are going back to work. Hotel occupancy has increased, and the amount of money consumers are prepared to spend on hotel stays has surged. Sales are expected to increase by 75%, albeit from lower levels, over the next 12 months. Hotels have also discovered many new sources of revenue. Historical earnings growth is not available as until recently the industry was losing money; however, margins have just turned positive. Companies also have the significant pricing power to pass on expenses to their guests and have the ability to mend their margins, eventually going back to the historical 20%. Lastly, the industry is cheap relative to its own history on a forward PE basis. According to our Technical indicator, it is also oversold. The Hotels, Resorts, and Cruise Lines industry has significant potential to return to its former “glory”, and we believe that it is a sound tactical and cyclical investment. We recommend overweighing this industry. Bottom Line The Hotels, Resorts, and Cruise Lines industry has been severely damaged by the pandemic, and the road to recovery may be long. It is also vulnerable to any new virus scare. However, with Delta cresting, financially healthy US consumers choosing to spend their money on services and experiences, sell-side forecasts pointing to surging sales, and companies possessing substantial pricing power mean that we are bullish on the industry. Irene Tunkel Chief Strategist, US Equity Strategy irene.tunkel@bcaresearch.com Footnotes 1 Restaurants Close Dining Rooms Again as Delta-Driven Infections Spread, WSJ, September 13, 2021. 2 Travel Investors Need More Drive, WSJ, September 12, 2021. 3 Hotel Industry News: Marriott CEO Sees Hotels Bouncing Back Quickly After Delta Variant Slump, Skift, September 9, 2021. 4 IBISWorld, August 23, 2021. 5 Oxford Economics. Recommended Allocation
Highlights Economy – The inflation question is unresolved, and it will remain that way for the rest of the year: August’s CPI report had something for everyone and ensured the debate will continue. Doves could celebrate the month-over-month decline while hawks could argue that upward inflation pressures are no longer a transitory phenomenon. Markets – Elevated valuations make equities vulnerable, but a little turmoil in China is not likely to trigger a de-rating wave: The demise of large Chinese property developer Evergrande may cause some upheaval in China but it is not likely to ruffle the S&P 500, corporate bonds or other US spread product. Strategy – Policymakers continue to hold the key. As long as the Fed is still easing, and households direct some of their excess savings to consumption, risk assets should outperform: We still think Goldilocks is far more likely that a too-cold or a too-hot outcome. Feature We continue to view the prospects for financial markets and the economy through a Goldilocks-and-the-two-tails lens, with the idea that equities and credit will thrive against a backdrop of supercharged growth and ongoing policy support (Figure 1). The Fed’s unusually pro-cyclical stance will prolong the macro sweet spot for risk assets and ensure positive excess returns provided growth doesn’t flop (the too-cold left tail), or the inflation genie doesn’t get out of the bottle (the too-hot right tail). Though both flanks pose a risk to our base-case Goldilocks scenario, we deem overheating to be the bigger concern. Unless a vaccine-resistant variant reestablishes COVID-19 as a mortal threat to the broad population, we think it is unlikely that growth will tumble below trend this year or next. Figure 1Goldilocks And The Two Tails
Watching Both Flanks
Watching Both Flanks
One does not need to be a sworn devotee of rugged individualism to harbor some misgivings about the magnitude and scope of the direct transfers to American households or the broader fiscal effort to combat the economic effects of the pandemic. Egged on by support amounting to 25% of a year’s output, it remains entirely possible that aggregate demand might overwhelm productive capacity. The emergence of rolling bottlenecks in the spaces that were most crimped by COVID has focused attention on the threat of overheating, but the more lasting risk emanates from spaces that cannot be dismissed as unduly influenced by the pandemic. We have been closely monitoring the path of consumer prices and will continue to do so, but the ultimate outcome remains unclear. Though a Goldilocks macro backdrop remains our base-case expectation, it is far from assured. In this week’s report, we consider three potential disruptions: too much inflation, a change in the Fed’s policy course and a credit shock from China. We do not think that any of the potential disruptions is likely to change the picture in a material way and we therefore reiterate our view that investors with a twelve-month timeframe ought to maintain at least an equal weight exposure to equities and credit in a multi-asset portfolio. Fitting The August CPI Tile Into The Inflation Mosaic The pace of consumer price increases cooled in August, according to the headline and core CPIs. Both measures came in below market expectations, and the leading month-over-month series (Chart 1, dashed line) decelerated more than their year-over-year counterparts (Chart 1, solid line). Although the data were encouraging on their face, the ongoing inflation debate is nowhere near resolved. COVID continues to play havoc with the spaces it impacted most heavily, defying simple interpretations of aggregate CPI data. Base effects have warped year-over-year data once the peak pandemic months of last spring and summer entered the equation. As category-by-category analyses of the April CPI release showed, the lion’s share of the aggregate core CPI increase was powered by new and used cars and a handful of badly disrupted services like air travel, car rental, lodging and in-person entertainment. Chart 1Inflation Seems To Have Peaked
Inflation Seems To Have Peaked
Inflation Seems To Have Peaked
Chart 2A Stunning Reversal On Used-Car Lots
A Stunning Reversal On Used-Car Lots
A Stunning Reversal On Used-Car Lots
The semiconductor-driven production squeeze pushed up new car prices and took used car prices along for the ride as consumers turned to them as a ready substitute. Used car prices then rose even more as rental car companies frantically reversed 2020’s culling of their fleets to meet revived 2021 demand (Chart 2). By July, however, several of those categories had come off the boil and began to make more modest contributions to month-over-month core CPI growth. In August, they turned into headwinds, limiting core CPI’s sequential gain to just 0.1%. While the core index grew at its slowest rate since February, the segments that weren’t as heavily affected by the pandemic – the gray portion of the stacked bars in Chart 3 – experienced their largest price increases of the year. Those core categories less sensitive to transitory pandemic factors have eased a bit on a year-over-year basis (Chart 4, bottom panel) but the leading month-on-month measure suggests they will turn higher going forward. Chart 3Passing The Baton
Watching Both Flanks
Watching Both Flanks
Shelter costs account for 41% of the core CPI basket and though spiking hotel rates (Chart 5, second panel) have made an outsized contribution to their bounce off the bottom (Chart 5, top panel), the much weightier owners’ equivalent rent and primary residence cost measures have begun to hook up (Chart 5, third panel). Series that impact the supply and demand balance for residences, like the prime-age employment-to-population ratio (Chart 5, fourth panel) and the National Multifamily Housing Council’s measures of apartment market activity (Chart 5, fifth panel), suggest that the key rent series will continue moving higher. Chart 4Transitory Factors Are Abating ...
Transitory Factors Are Abating ...
Transitory Factors Are Abating ...
Chart 5... But Rents Are Rising
... But Rents Are Rising
... But Rents Are Rising
The bottom line is that the August CPI report, like much of the economic data in this particularly uncertain time, offered evidence to support opposing interpretations. We will simply have to wait and see how the data evolve over the rest of the year to gain a good read on its future trajectory. We expect that inflation will continue to come down from its summer peak while remaining comfortably above the Fed’s effective 2.3-2.5% core CPI target. Such a move will underscore that its inflation criteria have been met and focus investor attention squarely on the labor market’s progress toward regaining full employment. Much Ado About Nothing The bond market has cottoned on to the fact that the labor market, not consumer price inflation, is the swing factor for monetary policy settings, and the 10-year Treasury note has essentially ignored the core CPI breakout (Chart 6). Equities have evinced little concern, reflecting the causal relationship we noted last week. High inflation by itself is not kryptonite for stocks; the restrictive monetary policy measures the Fed eventually imposes in response to high inflation are. Inflation’s market importance thus turns on the tipping point at which it heralds restrictive monetary policy. Chart 6Treasuries Are On Board With The Transitory View
Treasuries Are On Board With The Transitory View
Treasuries Are On Board With The Transitory View
A Fed that believes elevated inflation readings are transitory is a Fed that will wait to restrain the economy to contain them. A Fed that is determined to let the economy run hot so as to nurture broad-based strength in the labor market is a Fed with a less sensitive inflation reaction function than has prevailed since Paul Volcker’s tenure. The same goes for a Fed that has made no secret of its desire to reset inflation expectations higher. Putting it all together, the Fed appears determined to wait until it sees the whites of inflation’s eyes before it takes action that will undermine economic growth. Our view that the Fed’s inflation reaction function has become less sensitive is independent of the identity of the chair. The revised statement on longer-run goals and monetary policy strategy was issued by the entire FOMC, and investors should not be distracted by the quadrennial reappointment parlor game, which has settled on a contest between chair Powell and board member Brainard. Although Brainard has won progressives’ admiration for her advocacy of tighter bank supervision, policy would not be materially different under her stewardship than it would be under Jay Powell’s. Monetary policy will be accommodative for a long time regardless of who is chairing the FOMC on February 1st and the Biden administration’s nomination decision will not have lasting market implications. Could A Messy Evergrande Unwind Trip Up The US Bull? The financial press last week was filled with stories about the dire condition of Evergrande Property Group (Chart 7), one of China’s largest property developers. As noted in several of last week’s reports, Evergrande is the world’s most indebted developer and its leverage burden is not news to dollar bond investors, who have increasingly required outsized yields to lend to the company.1 All three major credit rating agencies have downgraded it to the equivalent of CC, reflecting their view that default is imminent. Though a technical default may be certain, per reports that Evergrande will fail to make scheduled interest and principal payments due this week, the ultimate ripple effects are unknown. As our Emerging Markets Strategy team has noted, a broad range of outcomes are possible. At the most benign end of the continuum, the event could mark a crescendo of concerns that have been weighing on sentiment and activity, and trigger policy stimulus that produces economic and market inflections. At the other end, Evergrande could intensify the existing credit crunch, sparking a wave of self-reinforcing defaults and bankruptcies, culminating in a systemic event on the order of Lehman Brothers’ bankruptcy. Absent government intervention, the defaults will be messy. Most of the company’s assets are in the form of unfinished properties that will require additional capital and know-how before they can be monetized. Even its portfolios of completed properties may not be easy to sell in a residential market that was already slowing (Chart 8). The pall its troubles have cast over the property market will make things worse by prodding other liquidity-constrained developers to slash prices to move their own inventories. Chart 7Boom And Bust
Boom And Bust
Boom And Bust
Chart 8Not Exactly A Seller's Market
Not Exactly A Seller's Market
Not Exactly A Seller's Market
Our China strategists believe that the government wants to make an example out of Evergrande to impose some discipline on investors and developers. Despite repeated warnings, it has remained on the wrong side of the three red lines policy makers recently established to rein in property market excesses. Some onshore investors may be bailed out, but party officials will have no qualms about leaving offshore investors holding the bag. As China goes, so too do small neighboring economies reliant on its appetite for imports. Resource economies like Brazil, Chile and Australia that export iron ore, copper and other base metals to feed the China construction and infrastructure juggernaut could slow. Suppliers of machinery and specialized manufactured components like Japan and Europe could also feel a bit of a chill. While the US is not immune to disruptions in the rest of the world, it is a comparatively closed economy that is generally less susceptible to external troubles and has minimal financial links with the Middle Kingdom. A review of the 2020 10-Ks for the SIFI banks and Goldman Sachs and Morgan Stanley confirmed that the American banking system has minimal direct exposures to China and Hong Kong. Only Citigroup, which operates a meaningful commercial banking franchise in Hong Kong, has direct cross-border exposures that amount to as much as 1% of assets (Table 1). Table 1SIFI Exposures To China And Hong Kong
Watching Both Flanks
Watching Both Flanks
The bottom line is that we do not view Evergrande as China’s Lehman. Policymakers may want to make an example of it but not to the point that they will stand by in the face of a broad contagion. Even if it did produce a credit event that rippled across Asian EM markets and tempered investors’ enthusiasm for risk assets more generally, US markets would benefit in a relative sense befitting the dollar’s status as a defensive currency, Treasuries’ status as the predominant risk-free asset and the S&P 500’s low-beta nature. The fall of an overextended Chinese property developer is unlikely to push the US out of Goldilocks and into too-cold territory. Investment Implications Inflation will trigger a policy change once it stays high enough for long enough to trigger the Fed’s recalibrated reaction function. Markets will sniff out a policy change ahead of time and could even catalyze a policy change if the bond vigilantes awaken from their long hibernation. When we reiterate our constructive view on markets and the economy over a three-to-twelve-month timeframe, we are reiterating our assessment that markets will not begin to prepare for the policy change within the next twelve months and that growth will appear as if it will remain on an above-trend trajectory for some time beyond. We are confident that the next twelve months will remain “safe” from a policy and a growth perspective. We have much less conviction about the next six to twelve months following next September and are acutely aware that the outlook for the second half of 2022 and the first half of 2023 will exert a meaningful influence next summer. We will adjust our views based on the incoming data, but we do think the first three to six months of our cyclical timeframe will be conducive to risk asset outperformance and therefore reiterate our recommendation to overweight equities and credit while sharply underweighting Treasuries. Doug Peta, CFA Chief US Investment Strategist dougp@bcaresearch.com Footnotes 1 Per Evergrande’s annual reports, its average annual interest rate on outstanding debt on 12/31/20 was 9.49%, up from 8.99% on 12/31/19, 8.13% on 12/31/18 and 8.09% on 12/31/17.
Friday’s preliminary University of Michigan Consumer Sentiment survey revealed that American households experienced a minor improvement in confidence in August. The headline index ticked up 0.7 points to 72. The minor increase reflects a two-point improvement…
The rally in US Treasurys since March has been positive for tech stocks. The S&P 500 tech sector outperformed the benchmark by 6.58% since then. This strong performance has occurred despite elevated inflation prints and the Fed’s plan to begin normalizing…
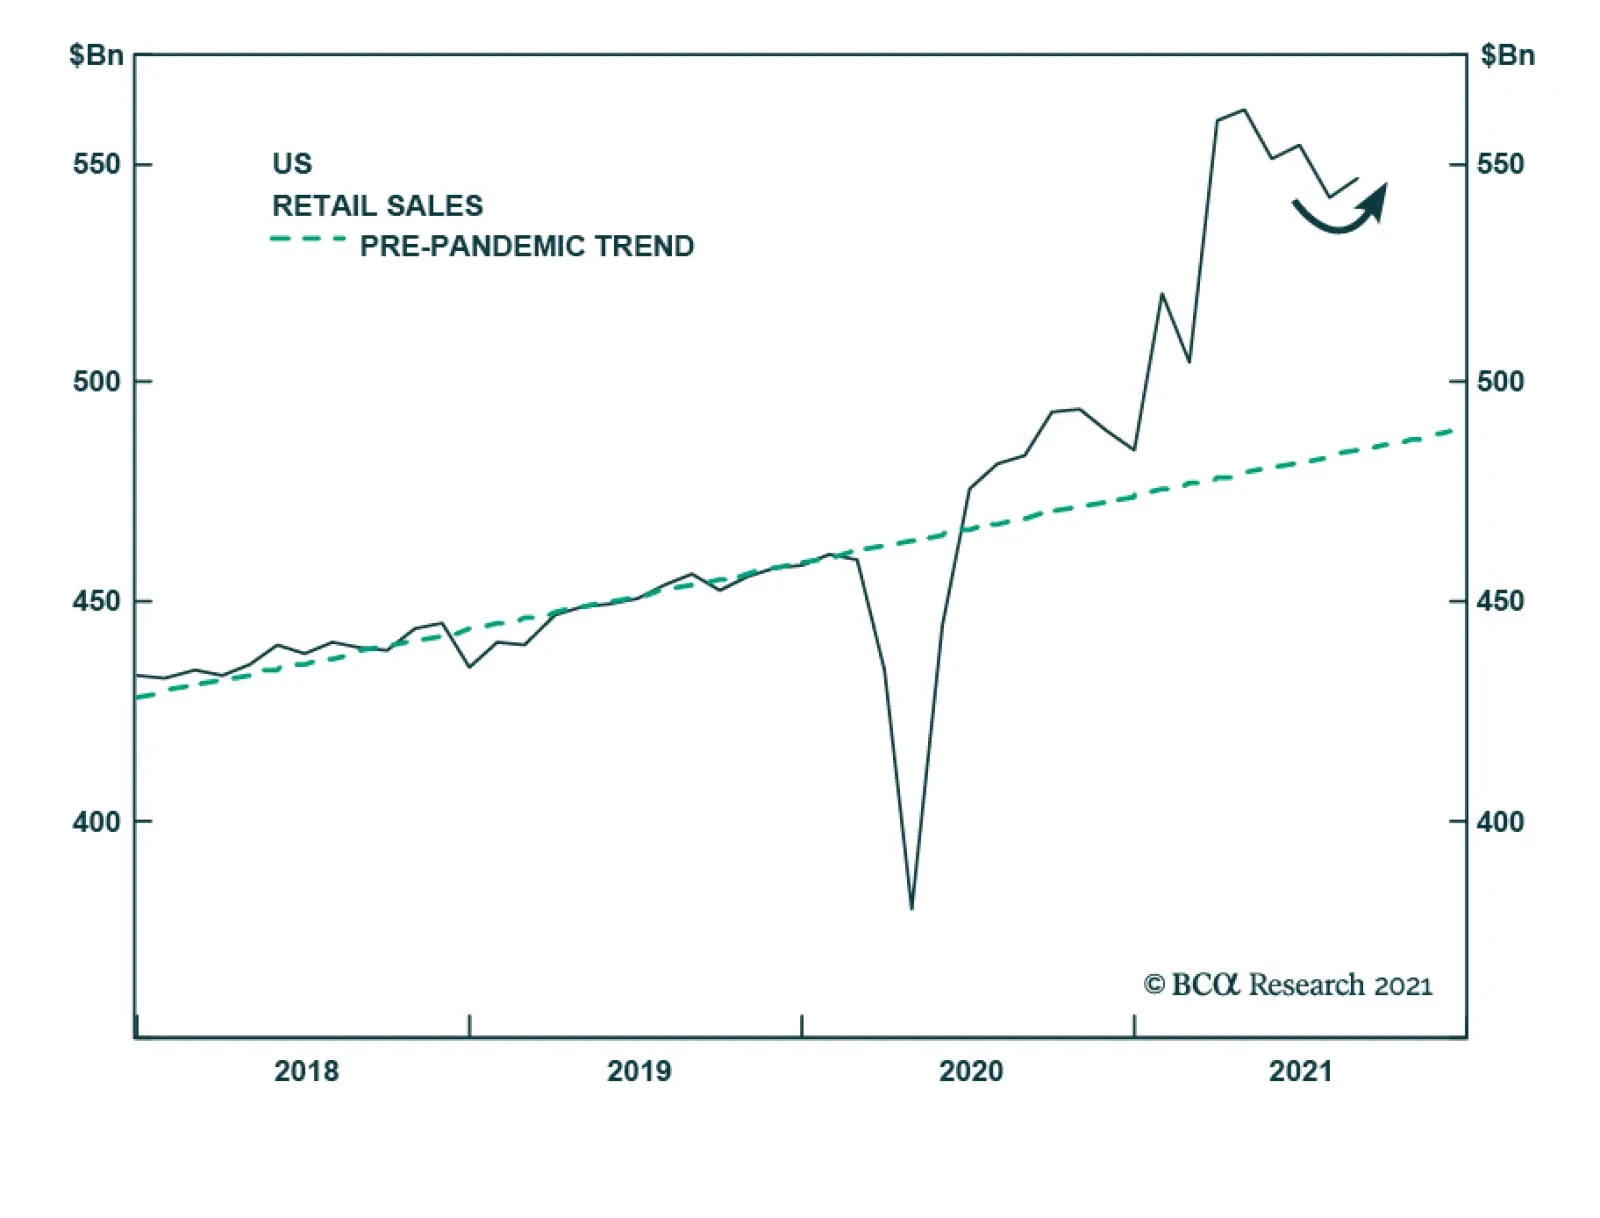
US retail sales for August delivered a positive surprise. The headline number grew 0.7% m/m following the prior month’s downwardly revised decline of 1.8%. Similarly, the retail sales control group expanded 2.5% m/m from a downwardly revised 1.9 decrease. …