United States

Following this week’s CPI release, we update our Corporate Pricing Power Indicator (CPPI). As a reminder, we calculate industry group pricing power from the relevant CPI, PPI, PCE and commodity prices growth rates for each of the 60 industry groups we track. Table 1 on the next page highlights short-term pricing power trends and each industry's spread to overall inflation. 83% of the industries we cover are lifting selling prices, at a faster clip than overall inflation. Commodity-sensitive industries dominate the top of Table 1 with steel and energy industries leading the way with 75% to 10% price increase as they have enjoyed a slingshot post-COVID-19 recovery. One notable exception is the forest products industry with a tape reading of -47% due to the ongoing bear market in lumber futures. We expect the rest of the commodity complex to give up leadership as headwinds from a slowdown in China filter through the global markets. Pricing power of auto manufacturers is also on the rise – empty dealership lots and reduced supply result in a significant upward pressure on prices. There is already evidence that price increases and shortages in supply are starting to discourage consumers from making purchases. Meanwhile, most other consumer goods and services categories populate the middle of the Pricing Power table, suggesting that there is a limit to companies’ ability to raise consumer prices without damaging the demand. We also note that it is reassuring that prices of semiconductors have come down, as it may be an early indication that supply chain is starting to unclog and shortages, such as the one in semiconductors, are starting to resolve. Finally, yesterday was Lehman Bankruptcy Day – 13 years have passed. Time flies. Bottom Line: Outside of commodities and building materials, price increases are moderating. Table 1
Updating Corporate Pricing Power Indicator
Updating Corporate Pricing Power Indicator
Highlights The House Ways and Means Committee’s tax proposals are a slight positive surprise for investors. They envision raising $1.5 trillion in new revenue, down from expectations of $2.6 trillion. The House’s tax plans would see the corporate rate at 26.5%, creating a likely range of 25%-26.5%, confirming our view that the proposal would be closer to Biden’s 28% than Trump’s 21%. Combining the Senate spending proposals with the House tax proposals, our updated scenarios for the budget reconciliation bill point to a net deficit impact of $1.2-$1.6 trillion over ten years. We still assign 80% subjective odds of passage to the bipartisan infrastructure bill and, if it passes, 65% odds to the reconciliation bill’s passage. We still expect the debt ceiling showdown to create only temporary volatility as Democrats have the power to raise or suspend the ceiling unilaterally. The major risk to our cyclically bullish view comes from Chinese corporate debt defaults, not a default on the US national debt. We are closing our consumer discretionary trade for a 9% gain to mitigate risks ahead of looming increase in volatility but we expected cyclical plays on Biden’s forthcoming stimulus bills to grind higher this fall. Feature President Biden’s big budget battle is upon us. The House Ways and Means Committee unveiled its tax proposals for the Democrats’ nominal $3.5 trillion reconciliation bill this fall. Spending proposals are soon to follow. The House tax proposals help to define the range of tax hikes that US businesses and investors face next year. An updated timeline of this fall’s budget battle is shown in Diagram 1. The various House committees are supposed to complete their proposals by September 15, just after we go to press. We will update the spending side next week. After that, on September 27, Democratic lawmakers will have a chance to vote on the bipartisan infrastructure bill that the Senate has already passed. Diagram 1Timeline Of Biden’s Big Budget Battles This Fall
The House Ways And Means Tax Plan
The House Ways And Means Tax Plan
Bipartisan infrastructure will pass sometime this fall even if there are delays. Pelosi and other Democratic leaders will be forced to de-link this bipartisan bill from their partisan reconciliation bill that expands social welfare. Republicans cannot be associated with reconciliation so any linkage of the two bills could scupper the bipartisan infrastructure bill. But neither President Biden nor moderate Democrats can afford to let the infrastructure deal fail. Table 1 shows the nine House moderates who delayed the passage of the House budget resolution in August to demand a separate vote on bipartisan infrastructure. Five are true centrists, with narrow margins of victory in districts that Biden narrowly won. This is more than the three votes that Pelosi can spare. Table 1Moderate Democrats In Competitive Districts Need the Infrastructure Deal
The House Ways And Means Tax Plan
The House Ways And Means Tax Plan
Therefore Pelosi will have to separate the two bills. Senator Bernie Sanders and the progressive Democrats cannot afford to let both bills fail – that is merely a progressive bluff. This means we still give an 80% subjective chance that infrastructure will pass. The reconciliation bill has a subjective 65% chance of passing, assuming infrastructure passes. However, it will be greatly modified from current proposals. The $3.5 trillion headline price tag is too high for Senate moderates while the $1-$1.5 trillion price tag outlined by the Moderate-in-Chief, West Virginia Senator Joe Manchin, is too low for progressives. Other points of negotiation and the net deficit impact will be discussed below. Moderate Senate Democrats like Manchin and Arizona Senator Kyrsten Sinema will pass the reconciliation bill because it is the least bad option both for them and their party. They have four main options: Vote to abolish the Senate filibuster, making way for Democrats to push through their controversial voting rights bill. Vote in favor of Biden’s signature reconciliation bill. Vote against both initiatives, thwarting their party and the Biden presidency without necessarily saving their seat in future elections. Vote for both initiatives and face the wrath of their more moderate voter base in their home state. The least bad option is to refrain from abolishing the filibuster but vote in favor of Biden’s reconciliation – they will then save their skin with both their constituents and the Democratic Party. The concessions they extract from party leaders can be sold as victories on the campaign trail back home, along with the bipartisan infrastructure bill. Thus while all kinds of twists and turns can happen this fall, the base case is that the moderate senators fall in line over the reconciliation bill, enabling it to pass by Christmas. Update On The Debt Ceiling September will see a showdown over keeping the government running (avoiding a shutdown) and raising or suspending the national debt ceiling, or the government’s credit card limit. The showdown will cause equity market volatility but it will be temporary – not a compelling reason to sell stocks but rather a possible buying opportunity. This is because a US default on the national debt will be averted. A continuing resolution must be passed by September 30, end of the fiscal year, to avoid a government shutdown. This stop-gap measure is expected to last until December 10, when a new solution on regular budget appropriations will be required. The Democratic tactic is to link the continuing resolution with $24 billion in disaster relief for the Gulf of Mexico and $6.4 billion in emergency funds for Afghan refugees. Republicans would have trouble voting against these worthy causes only to suffer the opprobrium of shutting down the government during a lingering pandemic. Even if this gambit fails, there is little chance the US will default on the national debt. There are four key aspects to this view: 1. Neither party wants to be blamed for causing a default, which would trigger a financial crisis and deprive seniors and veterans of their federal checks, among other politically intolerable consequences. 2. The 46 Republicans who signed a letter pledging not to raise the debt ceiling specifically said they will not actively vote to raise or increase the ceiling. They did not explicitly rule out a suspension or delay of the debt ceiling, nor did they say they would filibuster any attempt to raise it.1 Suspending the debt ceiling is the more politically palatable alternative these days because it does not require specifying a certain new dollar amount of debt to which the limit will be raised. It merely suspends or delays the operation of the debt limit for a period of time. In other words, some Republicans could vote for a suspension in the eleventh hour to avoid a national default. You would need six of them to do so (in addition to four Republicans who did not sign the letter, and all 50 Democrats), if there were a Republican filibustering the debt ceiling suspension. But then again, Republicans will likely refuse to filibuster. Any senator who filibusters a suspension of the debt ceiling would personally be responsible for a national default. A senator who goes rogue would encourage his moderate colleagues to break ranks and join the Democrats to reach the 60-vote threshold. Otherwise Democrats plus four Republican moderates are more than enough to meet the 51-seat simple majority requirement. The bipartisan infrastructure bill cannot even function if the debt ceiling is not raised to authorize new spending. So Republicans will be twice the fools if they vote for infrastructure but refuse to suspend the debt limit (as well as natural disaster and Afghan refugee relief). And really thrice the fools, because they are already unpopular as they are tainted with the accusation of inciting an insurrection on January 6 at the Capitol. 3. Republicans do not control the House or the Senate, so Democrats have the means at their disposal to suspend the debt ceiling unilaterally. 4. If all options fail, Democrats have the ability to revise the budget resolution so as to include a suspension of the debt ceiling in the reconciliation bill. This point is controversial because it is not certain that the Senate parliamentarian, Elizabeth MacDonough, will allow Democrats to revise the budget resolution to include the debt ceiling. Democrats are already making several demands of her on what can be included in reconciliation, and she has already shot them down once earlier this year over the minimum wage. Our view is that MacDonough would allow the budget resolution to be modified to suspend the debt ceiling if the country were immediately at risk of debt default.2 Moreover the President of the Senate, Vice President Kamala Harris, could always overrule the parliamentarian. This is a key point both for the debt ceiling and the contents of the reconciliation bill. Still, there is serious problem of timing mismatch between the debt ceiling and the reconciliation bill. The government’s technical debt default could happen “during the month of October,” according to Treasury Secretary Janet Yellen, whereas the reconciliation bill may not be ready to pass by Thanksgiving or Christmas. It is very hard to speed up a historic multi-trillion reconciliation bill to meet a much narrower statutory requirement of suspending the debt ceiling. Therefore suspending the debt ceiling via reconciliation, even if we are correct that it is legal, would be very difficult in execution – and hence very volatility-inducing for equities. The Democrats’ refusal to suspend the debt ceiling on their own is the weak link in the chain and will break under pressure if the Republicans unite in opposition. But the latter is not a foregone conclusion since the GOP would take the blame for a national default. If Republicans regain the House but not the Senate after the November 2022 midterm elections then our assessment of the debt ceiling risk may change. But for 2021, financial markets should view national default as a passing risk. Comparing The House Tax Plan To Previous Expectations The House Ways and Means Committee released tax proposals for the nominal $3.5 trillion reconciliation bill. These proposals will change significantly in the House, and in conference with the Senate, but the new proposals help to determine the range of policies under negotiation. Table 2 outlines the “tax expenditures” or tax breaks that the Democrats propose. The key features are tax breaks for households (e.g. a large and fully refundable child tax credit, an expanded earned income tax credit and dependent tax credit) and tax breaks for corporations to switch to renewable energy and electric vehicles. Table 3 high lights the “revenue raisers” or new taxes. The top marginal corporate rate would be set at 26.5%. While Senate moderates prefer 25%, which has determined consensus expectations, the implicit range is now between these two numbers. This is a confirmation of our prediction that it would be about 26%-27%. The new rate will thus be closer to the 21% rate established by the Trump administration than the previous 35% status quo, which was the highest in the OECD (Chart 1). Table 2House Ways & Means Tax Expenditure Plan
The House Ways And Means Tax Plan
The House Ways And Means Tax Plan
Table 3House Ways & Means Tax Revenue Plan
The House Ways And Means Tax Plan
The House Ways And Means Tax Plan
Indeed that is the common thread across these tax hikes: the Biden administration, in a nod to the median voter, is only partially reversing President Trump’s Tax Cuts and Jobs Act. Chart 1Corporate Tax Rate Under House Plan
The House Ways And Means Tax Plan
The House Ways And Means Tax Plan
Chart 2Individual Tax Rate Under House Plan
The House Ways And Means Tax Plan
The House Ways And Means Tax Plan
The top marginal individual rate would be 39.6% — no surprise to anyone (Chart 2). The long-term capital gains tax rate would be set at 25%. In addition, a new 3% surtax would be levied on incomes greater than $5 million. These, combined with the Obamacare surtax of 3.8%, would yield a top marginal rate of 31.8%, close to our expected 32% (Chart 3). The international minimum corporate rate would be set at 16.6%, which, when various tax breaks are included, will end up close to the nominal 15% minimum that Biden agreed with a range of other countries this summer (Chart 4). Putting it all together, the House is projecting a hike in taxes worth $1.5 trillion in total revenue, about 58% of the $2.6 trillion previously envisaged (Table 4). Chart 3Capital Gains Tax Rates Under House Plan
The House Ways And Means Tax Plan
The House Ways And Means Tax Plan
Chart 4Minimum Corporate Rate Under House Plan
The House Ways And Means Tax Plan
The House Ways And Means Tax Plan
Table 4Comparison Of House And Senate Tax Plan For Reconciliation Bill
The House Ways And Means Tax Plan
The House Ways And Means Tax Plan
This news constitutes a slight positive surprise for investors relative to expectations earlier this year. Senate tax writers will probably propose more ambitious taxes but Senate moderates will constrain them when it comes to what can gain 51 votes. So the final bill is unlikely to hike taxes more aggressively. However, we still expect the news of rising taxes to be negative in absolute terms – i.e. to create a one-off knock against corporate earnings that investors will have to digest. The historical record shows that there is no correlation between corporate tax rates and economic growth. However, it is not only corporate rates that are rising. The Biden administration is hiking taxes across the board, which could combine to weigh on business sentiment if growth or earnings disappoint.. A look at tax rates over the long run shows that these hikes are not insignificant, though they are moderate (Chart 5). Chart 5The Long View Of US Tax Rates
The House Ways And Means Tax Plan
The House Ways And Means Tax Plan
Going forward, however, investors must consider that the political environment in the US suggests that the median voter has shifted to the left due to generational, ethnic, geopolitical, and ideological shifts affecting the electorate. Tax hikes are more likely to become the norm over the long run than tax cuts, the opposite of the case during the long Reagan era. Hence our expectation is that investors will “buy the rumor, sell the news” of the reconciliation bill. The bill will stimulate economic growth – it increases the budget deficit over the coming ten years relative to expectations. But by the time the Senate passes the bill, this effect may be priced in, whereas any unintended consequences of across-the-board tax hikes will have to be accounted for later. And not only will 2022 see tax hikes but it will also see the Federal Reserve preparing for interest rate hikes. The budget deficit will shrink in 2022 but grow over the coming 10 years under Biden’s legislation. Until the House releases its spending plans, we must combine the House tax plan with the Senate spending plan to update our deficit projections. Table 5 provides descriptions of the various legislative scenarios and Table 6 provides the results in terms of revenue, expenditure, and net deficit impact. Note that these tables include the bipartisan infrastructure bill. Table 5Scenario Descriptions For Budget Deficit Under House Ways And Means Tax Proposals (Sept 2021)
The House Ways And Means Tax Plan
The House Ways And Means Tax Plan
Table 6Scenario Results For Budget Deficit Under House Ways And Means Tax Proposals (Sept 2021)
The House Ways And Means Tax Plan
The House Ways And Means Tax Plan
The deficit impact falls into the same general range we highlighted in the past albeit a bit larger: the Baseline Scenario would amount to a $1.6 trillion net expansion of the deficit over the 10-year budget window, , while the moderate/compromise Scenario 6 would amount to a $1.2 trillion net expansion. Previously we estimated $1-$1.6 trillion, so the difference is a drop in the bucket but the point is that Democrats cannot afford to let tax ambitions sink the entire bill or the economic recovery. The risk to the deficit lies to the upside given that several of the “pay-fors,” or revenue offsets, are chimerical. For example, doubling the size of the Internal Revenue Service may not yield the $140 billion that is projected in higher tax collections, as the Congressional Budget Office pointed out in its scoring of the bipartisan infrastructure bill. The use of “dynamic scoring” to project higher tax revenues from putatively faster economic growth is the favorite gimmick of the US political parties. Investment Takeaways Higher taxes – and a higher labor share of national income via rising wages and social transfers – will weigh on the net profit margins of business. If interest rates rise along with wages and taxes, in a context of hypo-globalization, the result will be a squeeze on margins (Chart 6). The one-off impact of the corporate tax hike on earnings could range from 5%-8%, according to our Global Investment Strategy. President Trump’s Tax Cut and Jobs Act created a 16% gap in the growth of earnings after tax relative to pre-tax earnings growth (Chart 7). A partial reversal of Trump’s hikes could produce half of this effect in the opposite direction. Our US Investment Strategy and US Equity Strategy still expect positive earnings growth in 2022. Chart 6Drivers Of Profit Margins
Drivers Of Profit Margins
Drivers Of Profit Margins
Chart 7Gauging The Tax Hit To Earnings
Gauging The Tax Hit To Earnings
Gauging The Tax Hit To Earnings
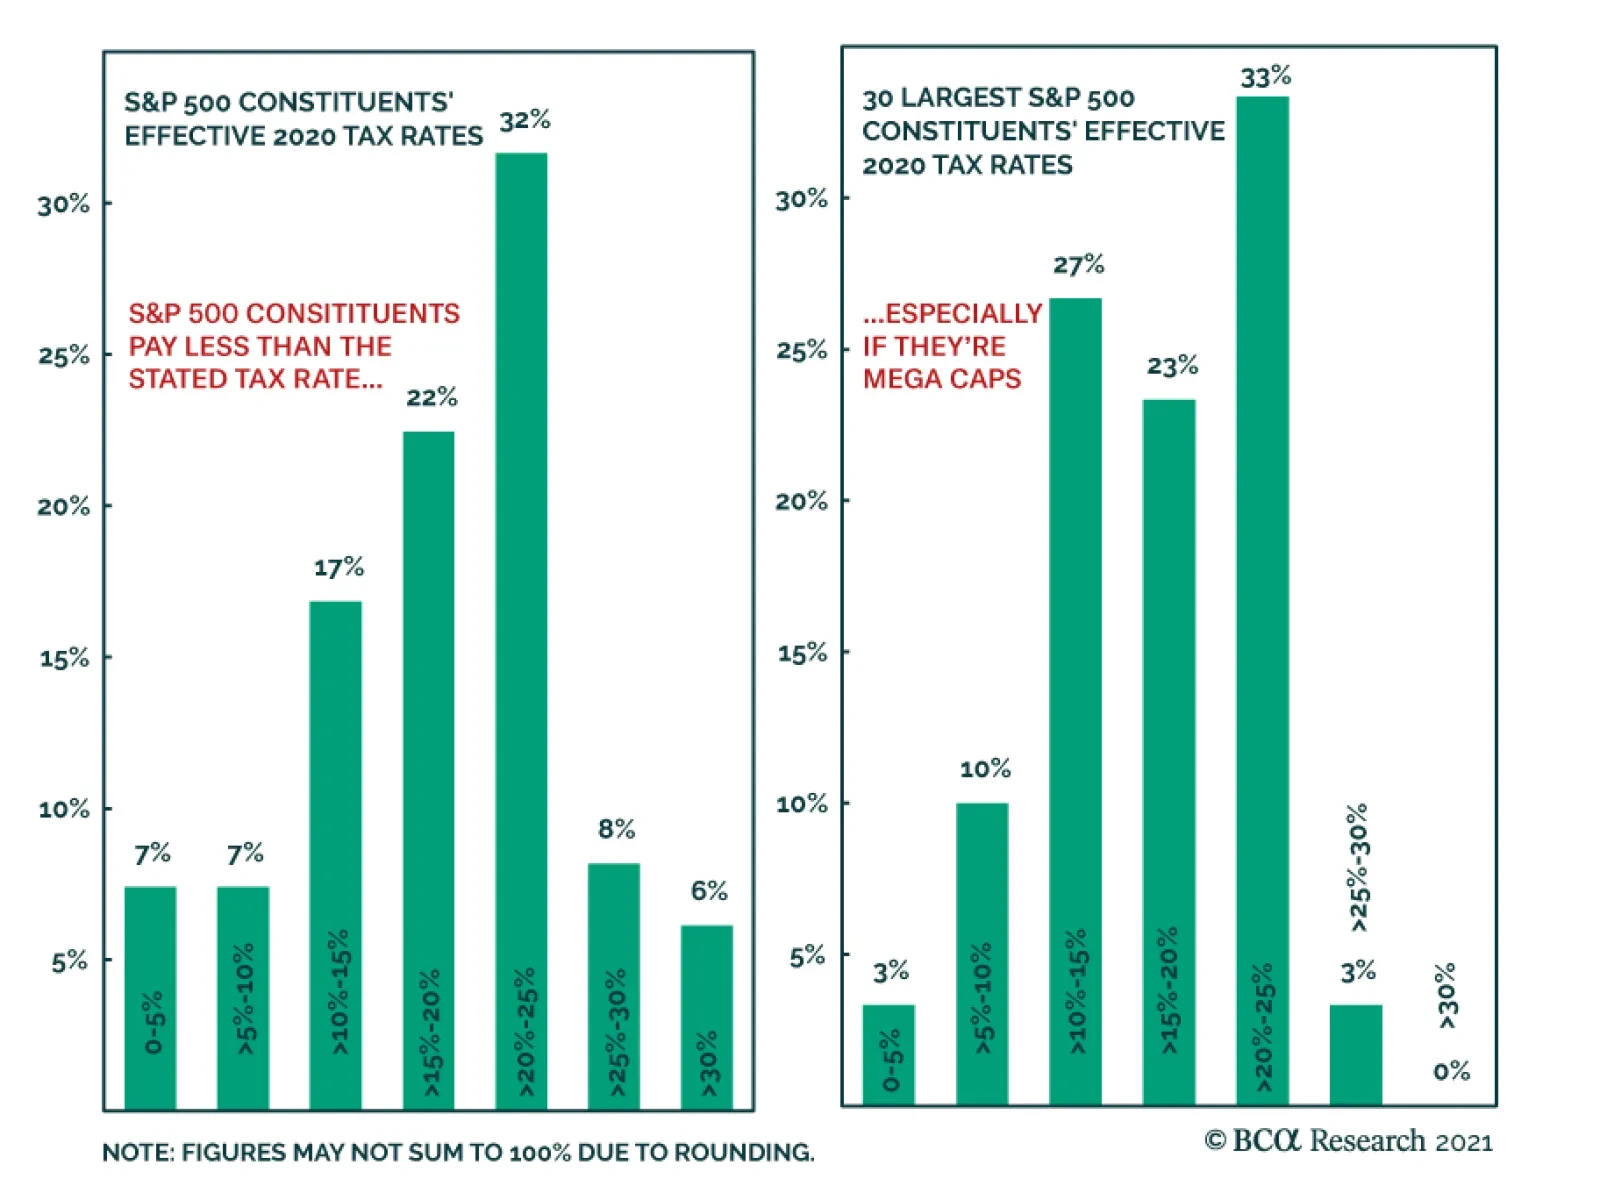
The sectors that pay the lowest effective taxes in the US are the ones that stand to suffer most from broadening the corporate tax base, raising rates, and tightening enforcement. This would include Big Tech as well as health care and utilities (although we are bullish on health care in general). Sectors like tech that gain a large share of earnings from abroad also stand to suffer. These low-tax sectors will especially suffer on a relative basis if Biden’s stimulus pushes up growth and inflation expectations and hence interest rates. Companies that pay high effective rates, such as energy, industrials, and materials, could also lose out. But as long as the pandemic continues to wane and the global economy recovers, some of these high-tax firms should still perform well, as will companies with a high share of earnings from abroad. The relative performance of these different baskets suggests that markets are still much more concerned about global recovery than about higher taxes (Chart 8). Cyclical and “value” stocks surged on the advent of the coronavirus vaccines despite the political result in the US indicating that tax hikes were coming. This was a key signal and we would expect something similar, on a smaller scale, as the pandemic recedes. Chart 8Higher Taxes Will Hit The Trump Winners
Higher Taxes Will Hit The Trump Winners
Higher Taxes Will Hit The Trump Winners
American populism is visible in that the Biden administration is coopting Trump’s agenda in various areas despite outward acrimony (e.g. infrastructure, China, trade protectionism). It is only partially reversing Trump’s legacy even in the areas of greatest disagreement, such as taxes. When all is said and done this Christmas, the United States will likely be left with a net tax cut relative to the levels seen under President Obama’s administration. We would not be surprised if across-the-board tax hikes caused or contributed to an equity market correction sometime in the wake of the bill’s passage. But that would not be a reason to grow cyclically bearish. Instead, the fate of China’s economic growth is the big risk to the cyclical view. While we expect equities to grind higher, we are booking a 9% gain on our consumer discretionary trade to mitigate risks ahead of the looming volatility this fall. Fundamentally we remain bullish on this sector due to economic recovery, fiscal stimulus, income redistribution, and the relative costs of the upcoming tax hikes. Matt Gertken Vice President Geopolitical Strategy mattg@bcaresearch.com Appendix Table A1USPS Trade Table
The House Ways And Means Tax Plan
The House Ways And Means Tax Plan
Table A2Political Risk Matrix
The House Ways And Means Tax Plan
The House Ways And Means Tax Plan
Chart A1Presidential Election Model
The House Ways And Means Tax Plan
The House Ways And Means Tax Plan
Chart A2Senate Election Model
The House Ways And Means Tax Plan
The House Ways And Means Tax Plan
Table A3Political Capital Index
The House Ways And Means Tax Plan
The House Ways And Means Tax Plan
Table A4APolitical Capital: White House And Congress
The House Ways And Means Tax Plan
The House Ways And Means Tax Plan
Table A4BPolitical Capital: Household And Business Sentiment
The House Ways And Means Tax Plan
The House Ways And Means Tax Plan
Table A4CPolitical Capital: The Economy And Markets
The House Ways And Means Tax Plan
The House Ways And Means Tax Plan
Footnotes 1 See Senator Shelley Moore Capito, “Debt Ceiling Letter,” United States Senate, August 10, 2021, capito.senate.gov. 2 Senate Majority Leader Chuck Schumer of New York said “We have a number of different ways we’re going to look at getting the debt ceiling done. We must get it done,” in the context of whether Democratic leaders would revise the budget resolution’s reconciliation instructions to lift the debt ceiling. See Jennifer Shutt, “Yellen: Treasury could hit debt ceiling in October without congressional action,” Roll Call, September 8, 2021, rollcall.com. For the parliamentarian’s role, see James Wallner, “Parliamentarian’s Guidance Contradicts Budget Rules,” Legislative Procedure, June 21, 2021, legislativeprocedure.com.
Looking At PPI
Looking At PPI
Last week’s PPI release came in strong, beating expectations and posting its eighth consecutive print of a higher-than-forecasted YoY increase. The release confirms that supply chains remain clogged and that businesses are forced to hike prices to offset pricing pressures. Anecdotally, the Suez Canal was briefly blocked once again last week as if foreshadowing more supply-side pain ahead. PPI internals also send the same message with goods inflation outpacing both the headline number and the services inflation (see chart). Given that service-producing industries are less reliant on raw materials, we expect the same divergence between goods and services PPI to hold over the coming several prints. Meanwhile our house view remains that the ongoing inflationary spike will be transitory in nature, and as businesses replenish inventories, inflation data will stabilize at lower levels. Please stay tuned for tomorrow’s Sector Insight report where we will update our Corporate Pricing Power table.
BCA Research’s US Bond Strategy service expects employment data to take a back seat to the inflation data in the minds of bond investors in 2022. The Fed has successfully convinced markets that it will not lift rates until “maximum employment” is achieved,…
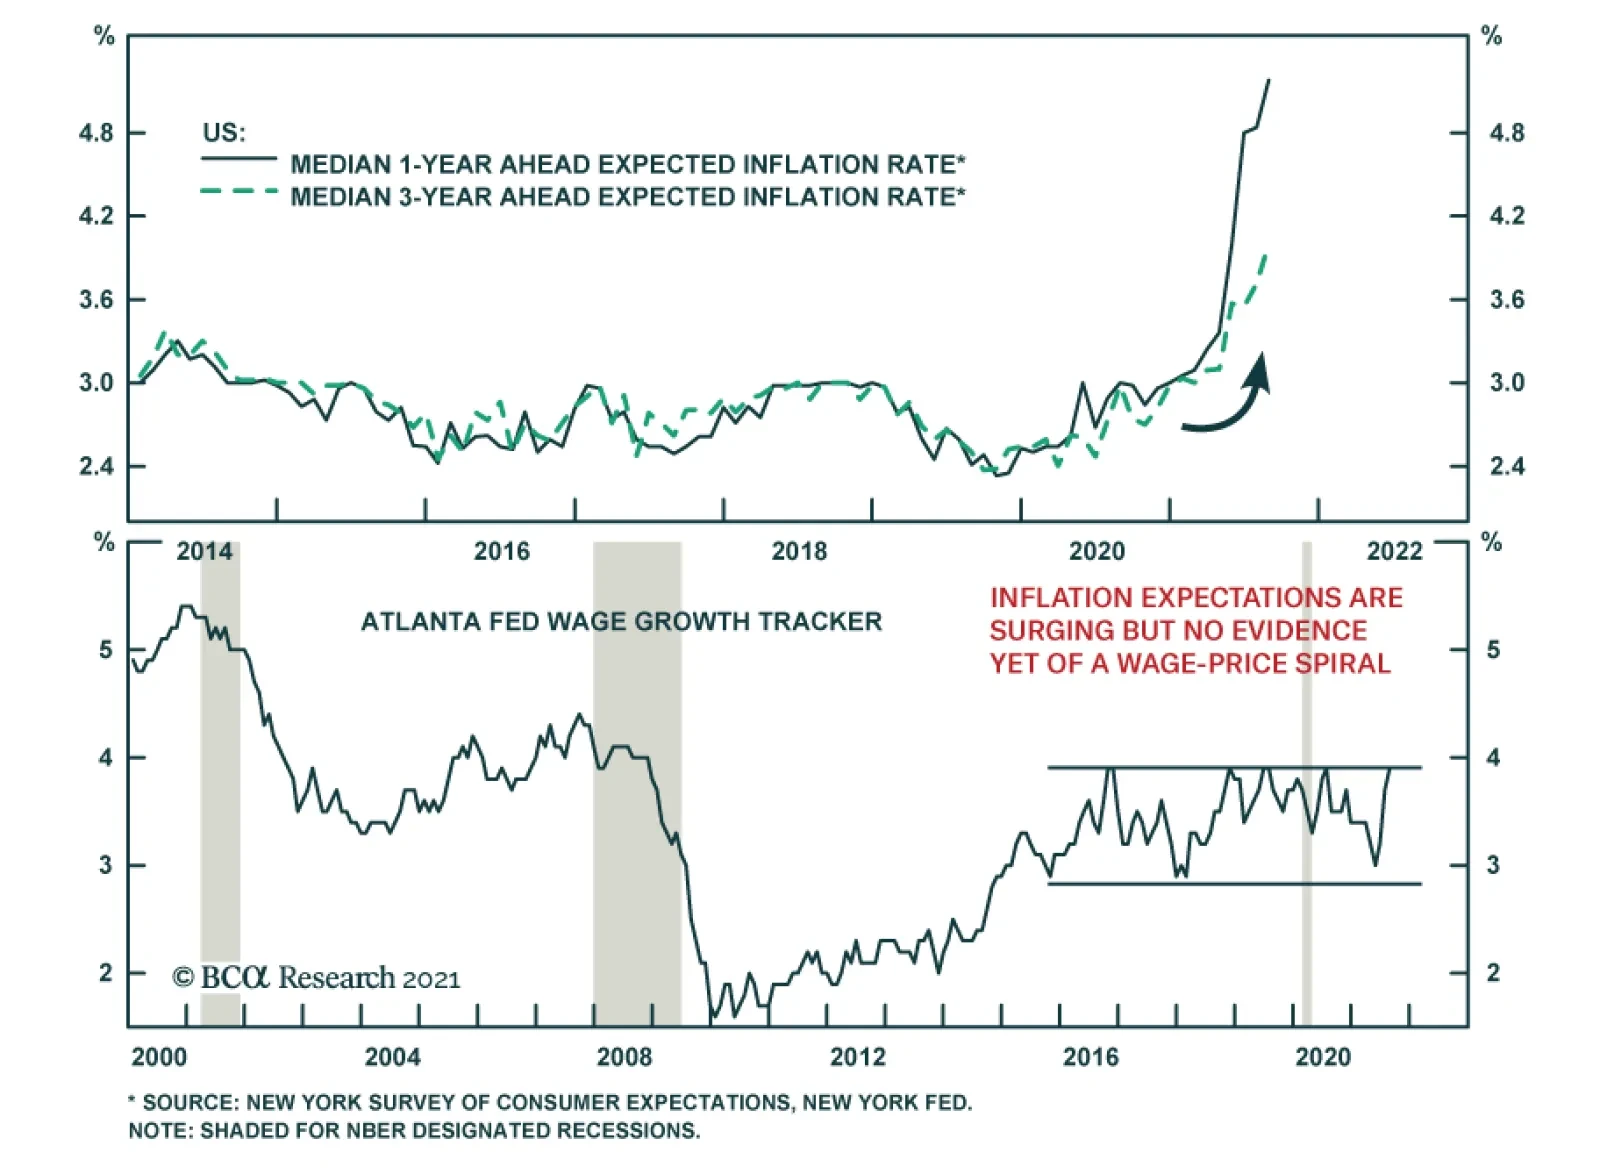
According to the New York Fed’s Survey of Consumer Expectations, the median 1-year ahead and 3-year ahead expected inflation rates rose to fresh series highs in August. Survey respondents expect the inflation rate to be 5.2% in a year’s time and ease to a…
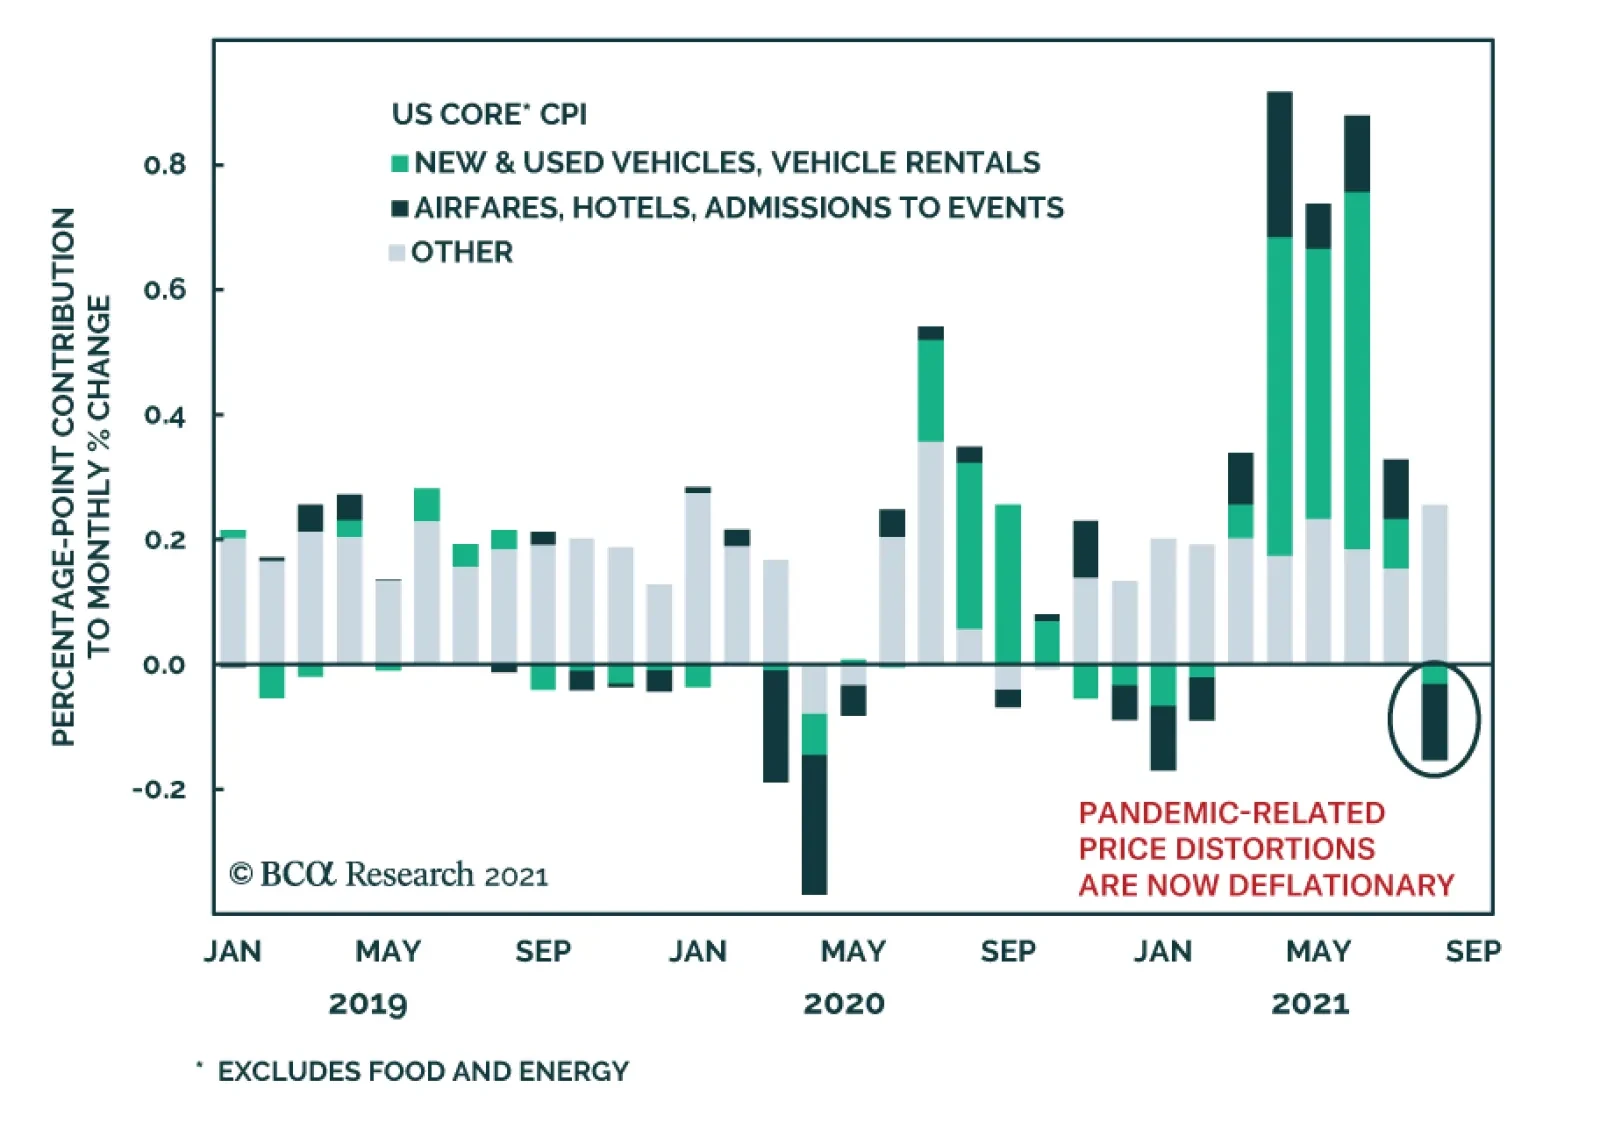
The US CPI report produced a slight downwards surprise in August. Core CPI eased 0.3 percentage points to 4.0% y/y versus an anticipated 4.2% y/y. Similarly, the month-on-month changes in both headline and core inflation fell below market expectations.…
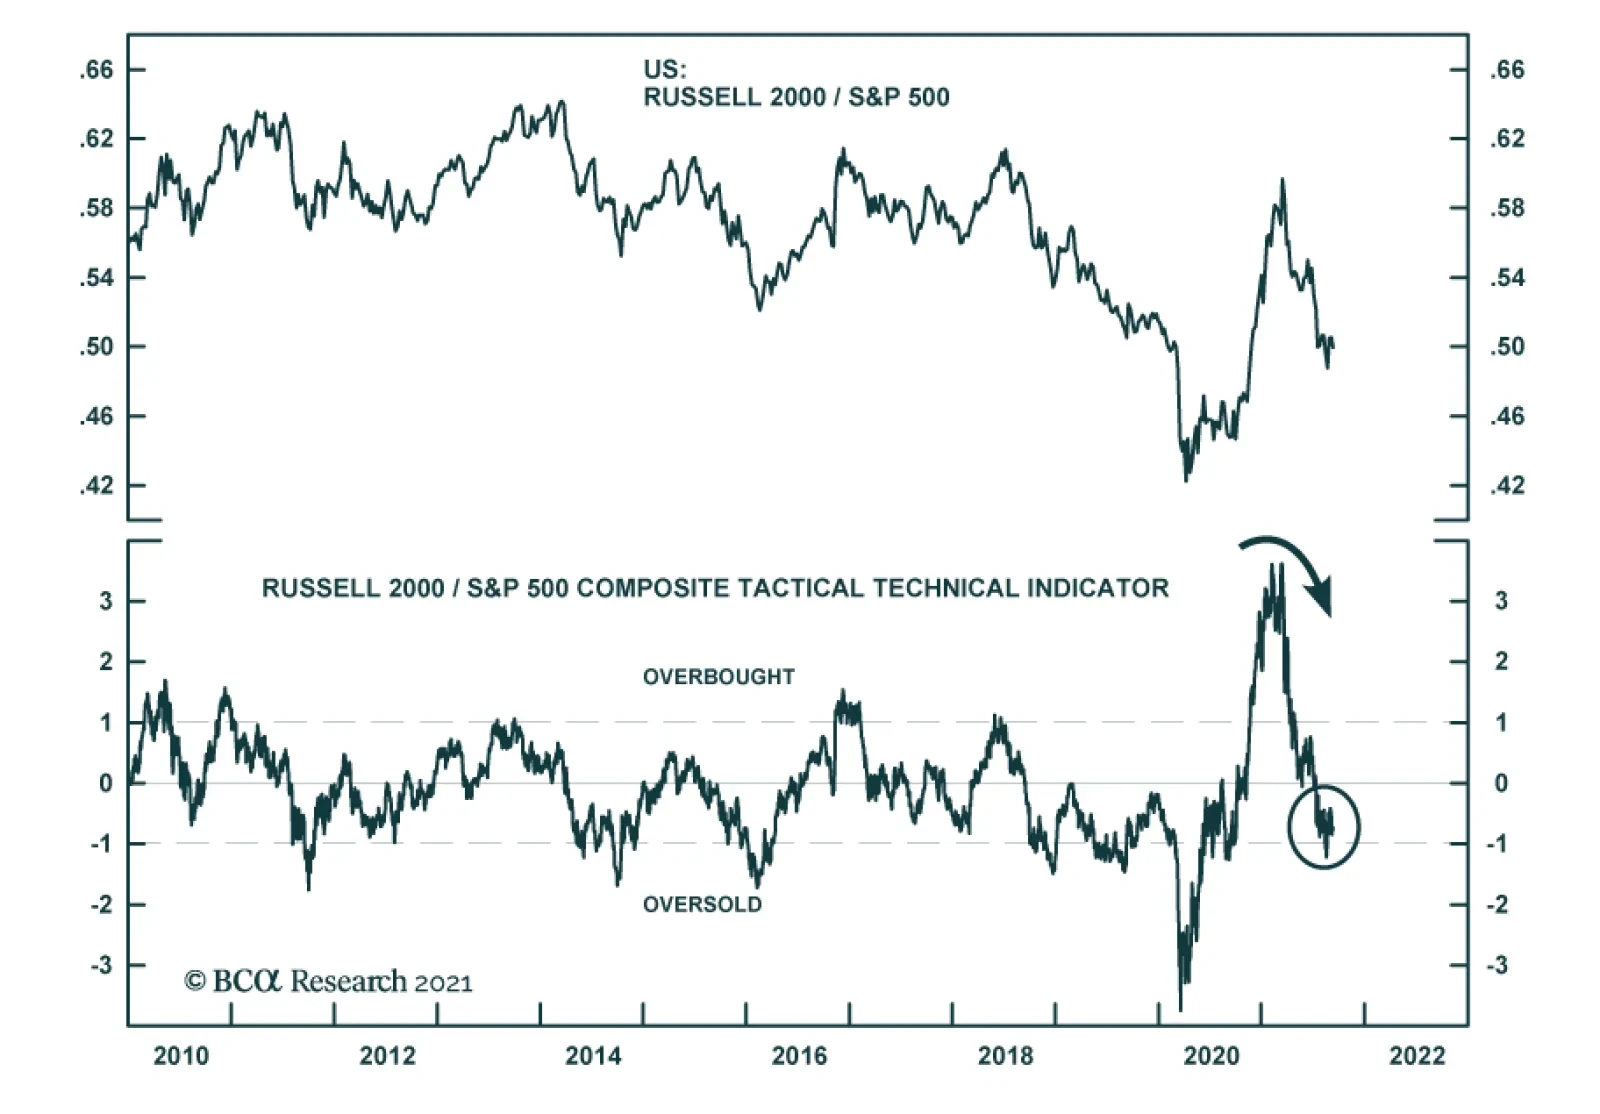
Several factors explain why US small caps have been underperforming their large cap peers since March. First, small caps benefit most early in the business cycle. This is in line with their performance following the initial COVID-19 shock last year after…
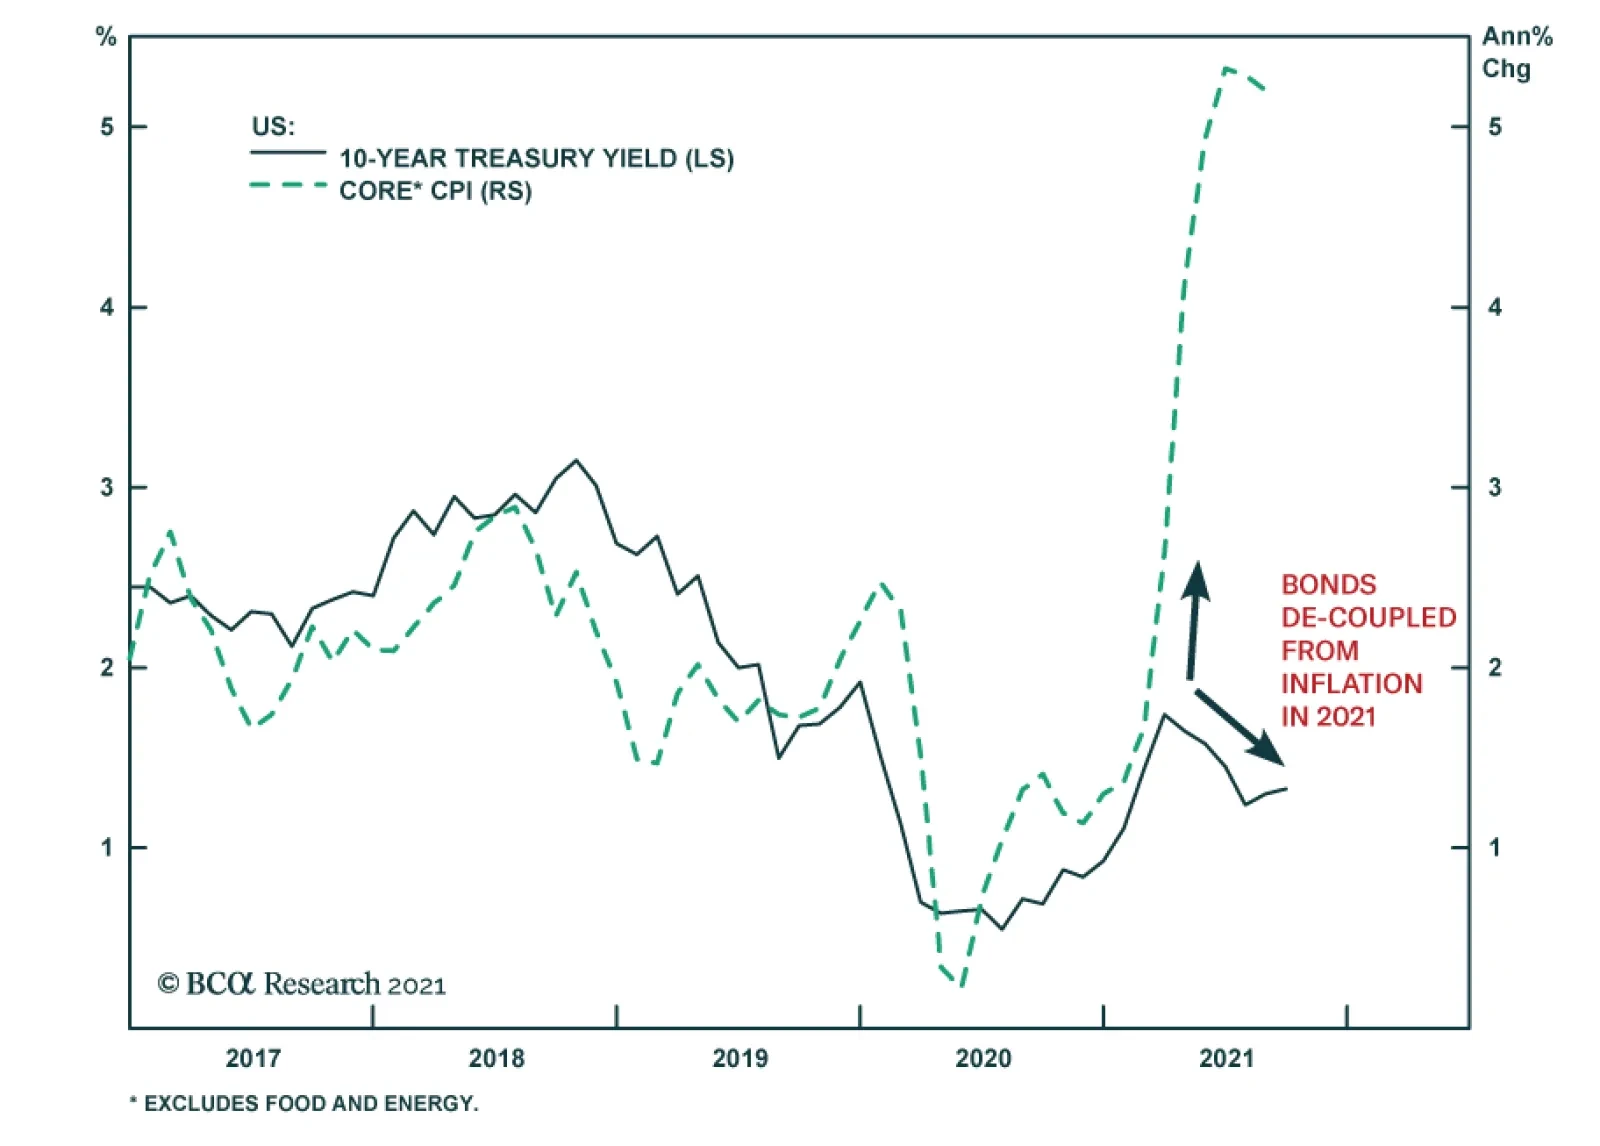
Highlights Fed: The Fed will be forced to clarify its definition of “maximum employment” in 2022, and the path of inflation will ultimately dictate how far the Fed tries to push the labor market. We expect Fed rate hikes to start in December 2022 and that the pace of hikes will proceed more quickly than is currently priced in the yield curve. Duration: Investors should maintain below-benchmark portfolio duration in anticipation of a rate hike cycle starting in December 2022. Yield Curve: Investors should position in Treasury curve flatteners. Specifically, we recommend shorting the 5-year Treasury note versus a duration-matched barbell consisting of the 2-year and 10-year notes. Feature Chart 1Bonds De-Coupled From Inflation In 2021
Bonds De-Coupled From Inflation In 2021
Bonds De-Coupled From Inflation In 2021
One of our themes this year is that US bond investors should pay more attention to the employment data than the inflation data.1 This is because the Fed has successfully convinced markets that it will not lift rates until “maximum employment” is achieved, even if inflation is strong.2 This story has played out during the past few months as bond yields have remained low despite surging prices (Chart 1). Our view is that the muted reaction in bonds is due to the widespread belief that the labor market remains far from “maximum employment” and that rate hikes are therefore a long way off. In this environment, only surprisingly strong employment prints can upset the market’s narrative and send bond yields higher. This playbook for the bond market will continue to function for the next few months. Strong employment data will pull bond yields higher and disappointing employment data will push them down. Inflation prints will be largely irrelevant for the market. But this will change next year. In fact, we see the employment data taking a back seat to the inflation data in the minds of bond investors in 2022. A More Explicit Definition of “Maximum Employment” Must Emerge In 2022 Almost everyone agrees that the US labor market is far from “maximum employment” today, but that will no longer be the case in 2022. The Appendix to this report shows the average monthly nonfarm payroll growth that is required to reach different possible definitions of “maximum employment” by a few specific future dates. For example, we calculate that average monthly nonfarm payroll growth of 414 thousand would cause the unemployment rate to reach 3.8% and the labor force participation rate to reach 63% by the end of 2022. Our sense is that the US economy will be able to add more than 414 thousand jobs per month between now and December 2022. This means that if Fed officials believe that an unemployment rate of 3.8% and a participation rate of 63% meet the definition of “maximum employment”, then they will start to lift interest rates by then. This example sets the scene for what will become next year’s most important monetary policy debate. What constitutes “maximum employment”? Does our example of a 3.8% unemployment rate and a 63% participation rate meet the definition? Or does the Fed have different targets in mind? The Fed will be forced to clarify its position on the topic as the labor market gets closer to reasonable definitions of “maximum employment”. Our sense is that, as of now, there are a range of views on the committee with some FOMC participants taking a more hawkish view of how much slack is left in the labor market and some adopting a more dovish posture. We outline the differences between the hawkish and dovish positions below, but ultimately the path of inflation in 2022 will determine which camp wins out. If inflation remains high next year, then the Fed will be quicker to declare that the labor market is at “maximum employment”, and vice-versa. The Fed’s reliance on the inflation data to settle the argument of what constitutes “maximum employment” will make inflation the most important economic indicator for bond yields in 2022. Labor Market Slack: The Hawkish Case Chart 2The Unemployment Rate Is Falling Fast
The Unemployment Rate Is Falling Fast
The Unemployment Rate Is Falling Fast
The hawkish case for the US labor market reaching “maximum employment” sooner rather than later was outlined nicely last month by our own Bank Credit Analyst.3 First, the Bank Credit Analyst points out that the US labor market was likely beyond “maximum employment” before COVID-19 struck. The implication being that the Fed may move to lift interest rates before the unemployment and participation rates fully recover their pre-pandemic levels. Notice that the unemployment rate (adjusted for the post-COVID surge in people employed but absent from work) was 3.5% in February 2020, well below the Congressional Budget Office’s 4.5% estimate of the natural rate of unemployment (Chart 2).4 Today, the adjusted unemployment rate is 5.5%, not that far above the 3.5%-4.5% range of FOMC participant estimates of the natural rate. If this year’s rate of decline continues, the unemployment rate will hit 4.5% by January 2022 and 3.5% by May 2022. Of course, we know that the Fed takes a broader view of labor market utilization than just the unemployment rate. In particular, we observed sharp declines in labor force participation rates across a wide range of demographic groups when the pandemic struck last year (Chart 3). While the Fed will want to see some improvement in labor force participation, it might be unrealistic to expect the overall labor force participation rate to return to its pre-pandemic level. This is because the aging of the US population imparts a structural downtrend to the participation rate. The dashed line in Chart 4 shows where the participation rate would be if the rate of labor force participation of every individual age cohort remained constant at its February 2020 level. Even in this case, the greater flow of people into the older age groups causes the part rate to fall over time. The message from Chart 4 is that even if the participation rates of every age cohort tracked by the Bureau of Labor Statistics rebound to their February 2020 levels, we would still only expect an overall participation rate of 62.8% by the end of 2022, significantly below the 63.3% seen in February 2020. Chart 3Labor Force Participation By Age Cohort
Labor Force Participation By Age Cohort
Labor Force Participation By Age Cohort
Chart 4The Demographic Downtrend In Participation
The Demographic Downtrend In Participation
The Demographic Downtrend In Participation
On top of the demographic argument, we also notice that the pandemic led to a surge in the number of retired people last year, a number that continues to rise quickly (Chart 5). While we should probably expect some increase in the flow of people coming out of retirement to re-join the labor force as the economy recovers, it’s also logical to assume that there will be at least some hysteresis among the retired population. That is, the longer someone is retired, the less likely they are to re-enter the labor force at all. To the extent that the increase in retired people is sticky, it may be ambitious to expect a full convergence of the 55-year+ part rate back to February 2020 levels (Chart 3, bottom panel). All else equal, this will cause the labor market to reach “maximum employment” more quickly than even our demographic trendline for participation suggests. Chart 5A Surge In Retirees
A Surge In Retirees
A Surge In Retirees
The question of how many FOMC participants agree with the above arguments remains open, but our sense is that there are some who will be eager to declare that “maximum employment” has been achieved before we see a full rebound in the unemployment and participation rates back to pre-COVID levels. For example, Fed Vice-Chair Richard Clarida mentioned the “demographic trend” in labor force participation in his most recent speech.5 Also, Dallas Fed President Robert Kaplan said the following in a recent interview: We’ve had 3 million retirements since February 2020. […] Some of these workers will come back into the workforce, but some of these workers are 55 and older and they’re in reasonably good financial shape and COVID has caused them to re-think whether they really want to re-enter the workforce.6 Labor Market Slack: The Dovish Case There are also good arguments on the side of those who think that an appropriate definition of “maximum employment” involves an unemployment rate closer to 3.5% than 4.5% and a participation rate that does return to pre-COVID levels, and maybe even moves higher. First, a study from the Federal Reserve Bank of Kansas City noted that the bulk of the recent increase in the number of retired people is explained, not by an increase in the number of retirements, but by a reduction in the flow of people from retirement back into the workforce (Chart 6).7 This suggests that pandemic-related health risks are the likely culprit behind the increase in the number of retired people, casting doubt on the idea that the increase in retired people will be sticky. Chart 6Increased Retirees: A Closer Look
2022 Will Be All About Inflation
2022 Will Be All About Inflation
Second, there is a strong case to be made that even the February 2020 labor force participation rate is not high enough to meet the definition of “maximum employment”. If we look at the participation rates for 25-54 year old men and women, we see that both were in strong uptrends prior to the pandemic (Chart 7), and there is every reason to believe that they would have continued to move higher if COVID hadn’t cut the recovery short. Chart 7Part Rates Were Rising Pre-Pandemic
Part Rates Were Rising Pre-Pandemic
Part Rates Were Rising Pre-Pandemic
Consider what some FOMC participants were saying prior to the pandemic: The strong labor market is also encouraging more people in their prime working years – ages 25 to 54 – to rejoin or remain in the labor force, […] So far, we have made up more than half the loss in the Great Recession, which translates to almost 2 million more people in the labor force. But prime age participation could still be higher. - Jerome Powell, November 20198 Whether participation will continue to increase in a tight labor market remains to be seen. But I note that male prime-age participation still remains below levels seen in previous business cycle expansions. - Richard Clarida, November 20199 In a more recent interview, Minneapolis Fed President Neel Kashkari expressed skepticism about the idea that labor force participation is destined to remain in a long-run structural downtrend and said that he’s “not convinced we were actually at maximum employment before the COVID shock hit us.” He also said: Getting [labor force participation] and employment-to-population at least back to where they were before [the pandemic], but not necessarily even declaring victory when we do that. I think that’s a reasonable thing for us to try to achieve.10 Inflation: The Ultimate Argument Settler What the above arguments make clear is that there are good reasons to think that the US labor market will reach some policymakers’ definitions of “maximum employment” perhaps by as early as the middle of next year. However, there are also some policymakers who will adopt a more dovish view of what constitutes “maximum employment”. Ultimately, the path of inflation will determine which camp wins out. This is because the entire concept of “maximum employment” is only meaningful when viewed alongside inflation. If employment is pushed beyond its “maximum”, it definitionally means that labor market tightness is leading to unwanted inflationary pressures. With that in mind, the Fed will increasingly refer to the inflation data next year as it tries to make its definition of “maximum employment” more precise. Crucially, what will matter for the Fed (and for the bond market) is where inflation is next year, not where it is right now. Right now, core inflation is well above the Fed’s price stability target, but it is well known that the recent increase in inflation is concentrated in a few sectors – COVID-impacted services and autos – where prices will decelerate as post-pandemic bottlenecks ease (Chart 8). Just as the Fed ignored surging prices in those sectors this year, it will ignore plunging prices in those sectors next year. What will matter for monetary policy is whether core inflation excluding COVID-impacted services and autos remains contained or rises above levels consistent with the Fed’s target (Chart 8, bottom panel). The Fed will also be inclined to declare that “maximum employment” has been achieved if wage growth is accelerating. Currently, there is some evidence of rising wages but also some major supply bottlenecks in the labor market, as evidenced by the all-time high in job openings (Chart 9). Labor supply constraints should ease next year, but the Fed will be watching closely to see if wage growth moderates in kind or continues to increase. Chart 8Watch CPI (ex. COVID-Impacted Services And Autos) In 2022
Watch CPI (ex. COVID-Impacted Services And Autos) In 2022
Watch CPI (ex. COVID-Impacted Services And Autos) In 2022
Chart 9Watch Wages In 2022
Watch Wages In 2022
Watch Wages In 2022
Finally, the Fed will keep a close eye on inflation expectations next year. In particular, it will monitor the Common Inflation Expectations Index and the 5-year/5-year forward TIPS breakeven inflation rate (Chart 10). If either of these indicators break above levels consistent with the Fed’s 2% inflation target, then policymakers will be more inclined to think that “maximum employment” has been attained. Chart 10Watch Inflation Expectations In 2022
Watch Inflation Expectations In 2022
Watch Inflation Expectations In 2022
Bottom Line: The Fed will be forced to clarify its definition of “maximum employment” in 2022, and the path of inflation will ultimately dictate how far the Fed tries to push the labor market. The key indicators to monitor to decide when the Fed will declare that “maximum employment” has been attained are: core inflation excluding COVID-impacted services and autos, wage growth, inflation expectations and the prime-age (25-54) labor force participation rate (Chart 3, panel 2). Investment Implications For bond markets, the question of when the Fed decides that the labor market has reached “maximum employment” is crucial because it will determine the start of the next rate hike cycle. At present, the overnight index swap curve is priced for Fed liftoff in January 2023 and for a total of 78 bps of rate hikes by the end of 2023 (Chart 11). Chart 11Rate Hike Expectations
Rate Hike Expectations
Rate Hike Expectations
Our expectation is that the Fed will start lifting rates in December 2022 and that rate hikes will proceed more quickly than what is currently priced in the market. The unemployment rate will be close to 3.5% by December 2022 and inflation will be sufficiently above the Fed’s target that policymakers will be inclined to view the labor market as at “maximum employment”. Investors should run below-benchmark duration in US bond portfolios to profit from this outcome. We also recommend that investors position for a flatter yield curve by the end of 2022. Specifically, we recommend shorting the 5-year Treasury note versus a duration-matched barbell consisting of the 2-year and 10-year notes. Table 1A shows fair value estimates for the 2-year, 5-year and 10-year yields as of the end of 2022 assuming the market moves to price-in the following path for the fed funds rate: The first 25 bps rate hike occurs in December 2022 Rate hikes proceed at a pace of 100 bps per year The fed funds rate levels-off at a terminal rate of 2.08%11 Table 1ATreasury Curve Fair Value Estimates: December 2022 Liftoff Scenario
2022 Will Be All About Inflation
2022 Will Be All About Inflation
In that example, the 2-year and 5-year yields both rise by much more than the 10-year yield and both exceed the change that is priced into the forward curve by more than the 10-year yield. Table 1B shows the results from a similar scenario, the only difference is that the liftoff date is pushed back to March 2023. Both the 2-year and 5-year yields also rise by more than the 10-year yield in this scenario, though the delayed liftoff dampens the relative upside in the 2-year yield. Table 1BTreasury Curve Fair Value Estimates: March 2023 Liftoff Scenario
2022 Will Be All About Inflation
2022 Will Be All About Inflation
Bottom Line: Investors should maintain below-benchmark portfolio duration and position in Treasury curve flatteners in anticipation of a rate hike cycle that will start in December 2022. Appendix: How Far From “Maximum Employment” And Fed Liftoff? Chart A1Defining “Maximum Employment”
Defining "Maximum Employment"
Defining "Maximum Employment"
The Federal Reserve has promised that the funds rate will stay pinned at zero until the labor market returns to “maximum employment”. The Fed has not provided explicit guidance on the definition of “maximum employment”, but we deduce that “maximum employment” means that the Fed wants to see the U3 unemployment rate within a range consistent with its estimates of the natural rate of unemployment, currently 3.5% to 4.5%, and that it wants to see a more or less complete recovery of the labor force participation rate back to February 2020 levels (Chart A1). Alternatively, we can infer definitions of “maximum employment” from the New York Fed’s Surveys of Primary Dealers and Market Participants. These surveys ask respondents what they think the unemployment and labor force participation rates will be at the time of Fed liftoff. Currently, the median respondent from the Survey of Market Participants expects an unemployment rate of 3.5% and a participation rate of 63%. The median respondent from the Survey of Primary Dealers expects an unemployment rate of 3.8% and a participation rate of 62.8%. Tables A1-A4 present the average monthly nonfarm payroll growth required to reach different combinations of unemployment rate and participation rate by specific future dates. For example, if we use the definition of “maximum employment” from the Survey of Market Participants, then we need to see average monthly nonfarm payroll growth of +414k in order to hit “maximum employment” by the end of 2022. Table A1Average Monthly Nonfarm Payroll Growth Required For The Unemployment To Reach 4.5% By The Given Date
2022 Will Be All About Inflation
2022 Will Be All About Inflation
Table A2Average Monthly Nonfarm Payroll Growth Required For The Unemployment To Reach 4% By The Given Date
2022 Will Be All About Inflation
2022 Will Be All About Inflation
Table A3Average Monthly Nonfarm Payroll Growth Required For The Unemployment To Reach 3.5% By The Given Date
2022 Will Be All About Inflation
2022 Will Be All About Inflation
Table A4Average Monthly Nonfarm Payroll Growth Required To Reach “Maximum Employment” As Defined By Survey Respondents
2022 Will Be All About Inflation
2022 Will Be All About Inflation
Chart A2 presents recent monthly nonfarm payroll growth along with target levels based on the Survey of Market Participants’ definition of “maximum employment”. This chart is to help us track progress toward specific liftoff dates. For example, if monthly nonfarm payroll growth continues to print at the same level as last month, then we could anticipate a Fed rate hike by June 2022. Chart A2Tracking Toward Fed Liftoff
Tracking Toward Fed Liftoff
Tracking Toward Fed Liftoff
We will continue to track these charts and tables in the coming months, and will publish updates after the release of each monthly employment report. Ryan Swift US Bond Strategist rswift@bcaresearch.com Footnotes 1 Please see US Bond Strategy Weekly Report, “Watch Employment, Not Inflation”, dated June 15, 2021. 2 Specifically, the Fed’s forward guidance states that it will not lift interest rates until (i) inflation is above 2%, (ii) inflation is expected to remain above 2% for some time and (iii) the labor market has reached “maximum employment”. 3 Please see Bank Credit Analyst Special Report, “The Return To Maximum Employment: It May Be Faster Than You Think”, dated August 26, 2021. 4 For details on the adjustment we make to the unemployment rate please see US Bond Strategy Weekly Report, “Overreaction”, dated July 13, 2021. 5 https://www.federalreserve.gov/newsevents/speech/clarida20210804a.htm 6 https://www.bloomberg.com/news/articles/2021-08-09/dallas-fed-president-rob-kaplan-on-the-economy-and-monetary-policy-right-now?sref=Ij5V3tFi 7 https://www.kansascityfed.org/research/economic-bulletin/what-has-driven-the-recent-increase-in-retirements/ 8 https://www.federalreserve.gov/newsevents/speech/powell20191125a.htm 9 https://www.federalreserve.gov/newsevents/speech/clarida20191114a.htm 10 https://www.bloomberg.com/news/articles/2021-08-16/neel-kashkari-on-the-fed-s-quest-to-get-to-full-employment?srnd=oddlots-podcast&sref=Ij5V3tFi 11 We assume a target range of 2% to 2.25% for the terminal fed funds rate. We also assume that the effective fed funds rate trades 8 bps above the lower-end of its target band, as is presently the case. Recommended Portfolio Specification Other Recommendations Treasury Index Returns Spread Product Returns
BCA Research’s US Investment Strategy service expects tax changes to deal the bull a glancing blow rather than a knockout punch. Based on the relative favoritism the US tax code bestows upon a particular activity, or the disparate way it treats domestic…
The House Ways and Means Committee delivered a positive surprise to President Biden’s tax plan. In a package released on Monday, the Committee increased the top corporate tax rate to 26.5% from 21% and raised the capital gains tax to 25% from 20%. Both…