United States

Highlights Economic policy uncertainty is rising in the US and will generate volatility this fall. But by the end of the year the result should be more fiscal reflation. Biden’s approval rating is now “underwater” – net negative – but this was expected. Unless he suffers another black eye, he can still shepherd his two big bills through Congress by year’s end. Public support for Biden’s tax hikes is weak. Some tax hikes are likely but aggressive hikes are now off the table. The midterm elections were already likely to produce a Republican win in the House. History supports this consensus. But the Senate is still an open game. The presidential election outlook is only marginally affected, at most, by the messy Afghanistan pullout. Value stocks are re-testing their low point against growth stocks. We do not expect them to break down when Congress is about to pass historic new spending increases. Feature Economic policy uncertainty is reviving in the US and set to increase this fall. This is true in absolute terms and relative to global uncertainty, even at a time when China’s sweeping regulatory crackdown is generating a lot of global uncertainty (Chart 1). Chart 1US Relative Policy Uncertainty Reviving
US Relative Policy Uncertainty Reviving
US Relative Policy Uncertainty Reviving
Chart 2Policy Uncertainty Breakdown
Policy Uncertainty Breakdown
Policy Uncertainty Breakdown
The latest increase in the policy uncertainty index is largely driven by rising uncertainty over future government spending (Chart 2, panel 2) and expiring tax provisions (Chart 2, panel 3), more so than by public sentiment reflected in the mainstream media or even the inflation debate. The looming budget battle this fall will have major implications for taxes and spending and will lift the uncertainty indicators regarding sentiment and consumer prices. Volatility will ensue in the coming months. But by the end of the year, Congress will have passed at least one, likely two, new laws that will increase government fiscal support for the economy and dispel deflationary tail risks. The lingering pandemic will if anything help concentrate lawmakers’ minds on passing more stimulus. Therefore we expect US equities and cyclical sectors to grind higher. The passage of these bills will mark the high point in policy reflation, after which clouds will loom on the horizon in 2022. Biden’s Net Negative Approval Rating President Biden’s job approval rating is now officially “underwater” – more people disapprove of his leadership than approve (Table 1). This is raising serious doubts about his ability to shepherd legislation through Congress this fall. However, these doubts are overrated. Table 1Biden’s Net Approval Is Officially Negative
Biden Is Underwater But His Legislation Will Float
Biden Is Underwater But His Legislation Will Float
Biden’s approval has mostly fallen due to his mishandling of the US military’s withdrawal from Afghanistan – which most Americans agree was necessary, however much they deplored the commander-in-chief’s handling of it. Therefore Biden’s approval rating will not fall much farther – at least not until he suffers another black eye. Until that happens, Biden’s approval will stabilize in the range of Obama’s and above Trump’s. The reason is that he retains a solid political base of support – and his political base is larger than President Trump’s, so his general approval will stay higher. Indeed his approval is still stronger than Obama’s among Democrats (Charts 3A and 3B). This is counterintuitive since Obama was a charismatic, young, and progressive Democrat. The reason is that Democrats are still very cognizant and fearful of the alternative: President Trump. This anti-Trump tailwind will help Biden for some time. Support among Democrats is critical for maintaining party discipline in passing the reconciliation bill this fall. It is also important for the midterm elections. Chart 3ABiden’s Job Approval Collapses
Biden Is Underwater But His Legislation Will Float
Biden Is Underwater But His Legislation Will Float
Chart 3BBiden’s Approval Holding Up Among Democrats
Biden Is Underwater But His Legislation Will Float
Biden Is Underwater But His Legislation Will Float
On specific issues, Biden is weaker than Obama on foreign policy and than Trump on the economy (Charts 4A and 4B). The economy will remain the central concern, notwithstanding Afghanistan, and on this front Biden should stabilize or improve. However, other foreign policy issues could rise to the fore and hurt him at any time given today’s fraught geopolitical environment. Chart 4ABiden’s Falling Approval On Economy
Biden Is Underwater But His Legislation Will Float
Biden Is Underwater But His Legislation Will Float
Chart 4BBiden’s Falling Approval On Foreign Policy
Biden Is Underwater But His Legislation Will Float
Biden Is Underwater But His Legislation Will Float
We say Biden’s score on the economy will improve because consumer confidence will rebound once the Delta variant of COVID-19 subsides (Chart 5). Both manufacturing and service sectors are performing better than when Biden was elected and employment is holding up in both sectors. The new orders-to-inventories measures suggest the service sector will continue to improve (Chart 6). The headline unemployment rate has dropped to 5.2%. Chart 5Consumer Confidence Should Support Biden
Consumer Confidence Should Support Biden
Consumer Confidence Should Support Biden
Chart 6PMIs Also Offer Some Support For Biden
PMIs Also Offer Some Support For Biden
PMIs Also Offer Some Support For Biden
Given the above, Biden still has enough clout to steer his signature legislation through Congress this fall, albeit with major modifications to his unwieldy $3.5 trillion American Families Plan. Moderate Democratic Senator Joe Manchin of West Virginia has called for a pause in new big spending legislation, but a close look at his words shows that he does not oppose the bill, he merely wants to water it down, which is not a change from his earlier position.1 He speaks for other moderates. The left-wing faction led by Senator Bernie Sanders of Vermont will make counter-threats yet ultimately has no choice other than to support the most progressive social legislation in recent memory. The bill will be watered down. Could this watering down process result in a total jettison of the Democrats’ proposed tax hikes? The Wall Street Journal reports that congressional support for tax hikes is losing steam.2 While aggressive tax hikes are off the table, we highly doubt that all tax hikes will be removed. Financial markets have not responded much to the threat of higher taxes. Small business owners, who are most sensitive to the risk of new taxes and regulation imposed by Democrats, have not shown much concern for either issue this year – they are much more worried about inflation (Chart 7). We assume the equity market would rally if tax hikes were dropped but we do not think this is likely to happen. Americans support higher taxes – but only Democrats are enthusiastic about across-the-board hikes on individuals, corporations, and capital gains. Polls show that 59% of independent voters, not to mention Democrats, support higher taxes on high-income earners, although the proposed 28% corporate is increasingly likely to be cut down (Chart 8). This is the fundamental reason for investors to expect Democrats to band together in the eleventh hour and include tax hikes in their reconciliation bill. If nothing else, a partial reversal of President Trump’s Tax Cut and Jobs Act will be necessary to give a veneer of affordability to Biden’s giant spending bill to get it past Senate moderates. Chart 7Business Will Worry About Tax Hikes When (If) They Pass
Business Will Worry About Tax Hikes When (If) They Pass
Business Will Worry About Tax Hikes When (If) They Pass
Chart 8Look Out: Americans Support Higher Taxes
Biden Is Underwater But His Legislation Will Float
Biden Is Underwater But His Legislation Will Float
The impact of Biden’s corporate tax hike is expected to be a 5%-8% one-off hit to corporate earnings, according to our Global Investment Strategy. The impact could be less than that but the combination of popular opinion and the Democratic Party’s need to finance their social agenda suggests that investors should plan for the worst, which in this case is not that bad – key tax rates will still be lower than they were under President Obama. The chief risk to Biden’s legislation is that passing the bipartisan infrastructure bill (80% subjective odds) consumes so much political capital that there is not enough left for Biden’s reconciliation bill (50%-65% subjective odds, depending on circumstances). This is possible. Congressional Democrat leaders want to tie these two bills together but most likely the quick success of infrastructure, which is more popular than social welfare, will lead Democrats to conclude that a bird in the hand is worth two in the bush. They will pass infrastructure on less-than-perfect assurances from Senate moderates that they will support reconciliation. Then a separate battle over reconciliation will ensue, in which Biden must cajole the left-wing and moderate factions of his party into a “yea” vote while Republicans obstruct. The second major risk to Biden’s legislation – and the macro backdrop – comes if he mismanages foreign policy more generally, such as with the looming crisis over Iran. A foreign policy failure beyond Afghanistan could cause permanent damage to his political capital. And yet Democrats would be even more desperate for a legislative victory then, as they would face a wipeout in the midterm elections if they had no legislative victories and two foreign policy humiliations. In other words, Biden is nowhere near so unpopular that moderate Democrats will abandon his signature legislative agenda and condemn their party and his administration to a heavy defeat in 2022. Bottom Line: Biden’s legislation will pass, including some tax hikes. The revised magnitude of tax hikes will not be known until later this fall when the Senate and House start producing legislative text. Policy uncertainty and equity volatility will trend upward this fall but the end-game is more reflationary policy, which should keep equities grinding higher at least through Christmas. Midterm Elections: The Best Case For Democrats Is Not Good Enough Are Republicans more likely to take Congress now that Biden’s approval is underwater? How would this impact the policy and macroeconomic outlook? While Republicans are highly likely to retake the House of Representatives, the Senate is still slightly tipped for the Democrats. Biden would have to fail to pass legislation or commit another major policy mistake to give Republicans full control of Congress, although this outcome is slightly favored in online betting markets. The House currently consists of 220 Democrats and 212 Republicans. There is always some fluctuation in the exact numbers. Three vacancies should be filled in November’s special elections, which could bring the count to 222 Democrats and 213 Republicans.3 With 218 votes needed to pass legislation on an absolute majority vote, Democrats can only afford to lose three votes at present. This is an extremely tight margin and shows that this fall’s reconciliation bill is at risk in the House as well as the Senate. In the midterm elections, Republicans only need to take five-to-six seats to regain the majority (218). This is easy on paper: the average seat gain for the opposition in midterm House elections is 35. Biden’s latest approval rating puts Democrats in line to lose 37 seats based on history. The opposition typically makes gains in the midterm because it is fired up whereas the presidential party is complacent. In addition Republicans are expected to gain two seats (possibly as many as four) via gerrymandering in 2022. True, Democrats have some underrated supports in 2022. In all probability the pandemic will be waning while the economy will be waxing. Biden will likely have passed at least a bipartisan infrastructure deal. The divisions within Republican ranks over Trumpism will also persist, which may or may not increase Democratic turnout and vote-switching from suburban Republicans. Hence it is reasonable to ask whether Democrats could surprise to the upside and retain the House. Online betting markets put the probability at 29%, and these odds make sense to us. The historical record helps to define what kind of events might alter the outlook for the midterms. Table 2 shows the midterm elections in which the presidential party performed best (the opposition party disappointed the historical norm). The following points are salient: Table 2Best-Case Outcomes For Presidential Party In Midterm Elections
Biden Is Underwater But His Legislation Will Float
Biden Is Underwater But His Legislation Will Float
There are only two cases in which the presidential party gained seats (Clinton 1998, Bush 2002) and three cases in which they only lost a few seats (Kennedy 1962, Reagan 1986, arguably Bush 1990). The Democratic victory of 1998 occurred at the top of an economic boom while the Republican victory of 2002 occurred one year after the 9/11 terrorist attacks. Neither is likely to be replicated for Democrats in 2022. Republicans’ mild losses in 1990 occurred just after Iraq invaded Kuwait. Republican’s mild losses in 1986 occurred despite a big legislative victory (tax reform). If either of the last two scenarios played out for Democrats in 2022, Democrats would likely lose the House by a whisker. Only if the Democrats’ 1962 scenario played out would Democrats retain the House in 2022, and only by a single seat. Yet the 1962 election occurred in the midst of the Cuban Missile Crisis! The takeaway is that a foreign policy crisis could help Democrats pare their losses in the midterms if Biden is deemed to have handled the crisis adroitly. But even then the ruling party would likely lose the House judging by history. Needless to say these are just historical examples. They also show that Democratic fortunes could turn around drastically between now and next fall (e.g. Kennedy went from a recession and the Bay of Pigs fiasco to gaining his party seats). The Senate outlook is less straightforward. Biden’s approval rating suggests a loss of four seats for Democrats based on the historical pattern. But the same pattern suggested Republicans would lose four seats in 2018 and instead they gained two. Our quantitative Senate election model, which we update every week in the Appendix, still tips the Democrats to gain one seat (a 51-49 majority) or at least retain their de facto one seat majority (50-50). Chart 9Presidential Vetoes In History
Biden Is Underwater But His Legislation Will Float
Biden Is Underwater But His Legislation Will Float
What are the macroeconomic implications? A Republican House and Democratic White House would play “constitutional hardball,” just as occurred from 2011-14, given that the country is still at historically peak levels of political polarization.4 There are likely to be critical differences between 2011 and 2023 – populism has fundamentally weakened support for fiscal austerity – but the most likely result is gridlock and deadlock. Republicans will not be able to slash spending or cut taxes as Biden will have the presidential veto, but Democrats will not be able to increase spending or hike taxes (Chart 9). The problem for Biden would be the need to avoid a national default when and if the Republicans insist on spending cuts to raise the debt ceiling. The looming debt ceiling showdown this fall will increase uncertainty and volatility but ultimately Democrats have the votes to avoid a default. That would not necessarily be the case if Republicans controlled the House. And this time around Republicans could be driven to impeach the president, for whatever reason, in retaliation for President Trump’s impeachment in 2019. This situation obviously cannot be ruled out, even though it would be virtually impossible for the Senate to convict. At the same time, some bipartisanship could occur, as it did under Trump following the 2018 midterms. Anti-trust legislation and immigration reform are the two most important policy areas to watch on this front. Republican gains in Congress would marginally weaken the Democrats’ hold on the White House in 2024, though we continue to believe that Democrats are favored. American voters are likely to be better off in November 2024 than they were in November 2020, amid a pandemic, recession, and nationwide social unrest. Our quantitative model tips Democrats with 308 electoral votes (Appendix). Professor Allan Lichtman’s “13 Keys” to the presidency – a nearly flawless prediction system since 1984 – currently suggest that the Democrats only have three keys turned against them. They would need to see six or more in order to lose the White House (Table 3). Obviously the long-term status of the economy will be a critical factor (Chart 10). Table 3Lichtman’s Keys To The Presidency (Updated Sept 2021)
Biden Is Underwater But His Legislation Will Float
Biden Is Underwater But His Legislation Will Float
Chart 10Will Biden's Economy Grow Faster Than That Of His Two Predecessors?
Will Biden's Economy Grow Faster Than That Of His Two Predecessors?
Will Biden's Economy Grow Faster Than That Of His Two Predecessors?
Bringing it all together, US fiscal policy has taken a more proactive turn but it is still likely to freeze after this fall. It will be hard to pass major budget bills in 2022 ahead of the election and gridlock is the likeliest outcome, making 2025 the next realistic chance for major fiscal changes. The immediate implication is that Biden and Democratic leaders will have to disconnect the bipartisan infrastructure bill from the partisan social welfare reconciliation bill this autumn. This will require a major concession from House Speaker Nancy Pelosi. Otherwise both bills could collapse and with them the Democratic Party’s fortunes. Biden and moderate Democrats that face competitive races in 2022 will demand a quick victory before moving onto the less popular part. Investment Takeaways Value stocks are re-testing their cycle lows against growth stocks (Chart 11). The Delta variant and global growth jitters continue to weigh on this trade. Chart 11S&P Value Re-Tests Lows Versus Growth
S&P Value Re-Tests Lows Versus Growth
S&P Value Re-Tests Lows Versus Growth
The S&P 500’s “Big Five” are rallying and outperforming the other 495 companies once again (Chart 12). Chart 12S&P 5 Recovery Versus 495
S&P 5 Recovery Versus 495
S&P 5 Recovery Versus 495
We expect politically induced volatility throughout the fall but we also expect it to be resolved in new and reflationary legislation. Signs that Biden’s legislation will pass should enable cyclical sectors and value stocks to recover, though the pandemic, global growth, and Chinese stability may prevent them from outperforming defensive sectors and growth stocks. A new set of hurdles will face markets if Republicans regain the House and halt fiscal easing from 2022-24. However, they will not be rewarded by voters if they create a fiscal or economic crisis, implying that the proactive fiscal turn in public opinion will prevail over the long run. If Biden’s legislation fails then it suggests that US fiscal policy is dysfunctional even under single-party control. This would heighten the deflationary tail risk and force us to reassess our macro and policy outlook. Matt Gertken Vice President Geopolitical Strategy mattg@bcaresearch.com Appendix Table A1USPS Trade Table
Biden Is Underwater But His Legislation Will Float
Biden Is Underwater But His Legislation Will Float
Table A2Political Risk Matrix
Biden Is Underwater But His Legislation Will Float
Biden Is Underwater But His Legislation Will Float
Chart A1Presidential Election Model
Biden Is Underwater But His Legislation Will Float
Biden Is Underwater But His Legislation Will Float
Chart A2Senate Election Model
Biden Is Underwater But His Legislation Will Float
Biden Is Underwater But His Legislation Will Float
Table A3Political Capital Index
Biden Is Underwater But His Legislation Will Float
Biden Is Underwater But His Legislation Will Float
Table A4APolitical Capital: White House And Congress
Biden Is Underwater But His Legislation Will Float
Biden Is Underwater But His Legislation Will Float
Table A4BPolitical Capital: Household And Business Sentiment
Biden Is Underwater But His Legislation Will Float
Biden Is Underwater But His Legislation Will Float
Table A4CPolitical Capital: The Economy And Markets
Biden Is Underwater But His Legislation Will Float
Biden Is Underwater But His Legislation Will Float
Footnotes 1 See Senator Joe Manchin, “Why I Won’t Support Spending Another $3.5 Trillion,” Wall Street Journal, September 2, 2021, wsj.com. 2 Richard Rubin, “Progressives’ Tax-The-Rich Dreams Fade As Democrats Struggle For Votes,” Wall Street Journal, September 5, 2021, wsj.com. 3 The three special House elections are: Florida’s 20th District, previously Democratic held; Ohio’s 11th District, previously Democratic held; Ohio’s 15th District, previously Republican held. 4 See Mark V. Tushnet, “Constitutional Hardball,” John Marshall Legal Review 37 (2004), pp. 523-53, scholarship.law.georgetown.edu.
Highlights Chart 1Employment Growth Will Rebound
Employment Growth Will Rebound
Employment Growth Will Rebound
August’s weak employment growth reflects the surge of Delta variant COVID cases in the United States. This is evidenced by the fact that Leisure & Hospitality sector payrolls held flat in August after having grown by 415k in July and 397k in June (Chart 1). While Delta could still be a drag on employment growth for another month or two, there is mounting evidence that the daily new case count is close to its peak. Leisure & Hospitality employment growth will regain its prior pace as new Delta cases trend down. This will lead to a resumption of strong monthly payroll reports (500k – 1000k) as we head into the new year. For monetary policy, we calculate that average monthly nonfarm payroll growth of 414k will be sufficient for the Fed to start rate hikes before the end of 2022 (bottom panel). We anticipate that this threshold will easily be met. The Treasury curve will bear-flatten as employment growth improves and the market prices-in an earlier start and quicker pace of Fed rate hikes. Investors should maintain below-benchmark portfolio duration and stay short the 5-year Treasury note versus a duration-matched 2/10 barbell. Feature Table 1Recommended Portfolio Specification
The Delta Drag
The Delta Drag
Table 2Fixed Income Sector Performance
The Delta Drag
The Delta Drag
Investment Grade: Neutral Chart 2Investment Grade Market Overview
Investment Grade Market Overview
Investment Grade Market Overview
Investment grade corporate bonds underperformed the duration-equivalent Treasury index by 5 basis points in August, dragging year-to-date excess returns down to +166 bps. The combination of above-trend economic growth and accommodative monetary policy supports continued positive excess returns for spread product versus Treasuries. At 91 bps, the 3-year/10-year Treasury slope remains steep. This is a strong signal that monetary conditions are accommodative. But despite the positive macro back-drop, investment grade valuations are extremely tight (Chart 2). A recent report looked at what different combinations of Treasury slope and corporate spreads have historically signaled for corporate bond excess returns.1 It shows that tight corporate spreads only correlate with negative excess returns once the 3-year/10-year Treasury slope is below 50 bps. Though we retain a positive view of spread product as a whole, better value can be found outside of the investment grade corporate sector. Specifically, we recommend that investors shift into high-yield corporates, municipal bonds and USD-denominated Emerging Market sovereigns and corporates. We also advise investors to favor long-maturity corporate bonds and those corporate sectors with elevated Duration-Times-Spread.2 Table 3ACorporate Sector Relative Valuation And Recommended Allocation*
The Delta Drag
The Delta Drag
Table 3BCorporate Sector Risk Vs. Reward*
The Delta Drag
The Delta Drag
High-Yield: Overweight Chart 3High-Yield Market Overview
High-Yield Market Overview
High-Yield Market Overview
High-Yield outperformed the duration-equivalent Treasury index by 66 basis points in August, bringing year-to-date excess returns up to +502 bps. A recent report looked at the default expectations that are currently priced into the junk index and considered whether they are likely to be met.3 If we demand an excess spread of 100 bps and assume a 40% recovery rate on defaulted debt, then the High-Yield index embeds an expected default rate of 3.0% (Chart 3). Using a model of the 12-month trailing speculative grade default rate that is based on gross corporate leverage (pre-tax profits over total debt) and C&I lending standards, we estimate that the 12-month default rate will fall to between 2.3% and 2.8%, below what the market currently discounts. Notably, the corporate default rate is tracking at an annualized rate of roughly 1.7% through the first seven months of the year, well below the estimate generated by our macro model. Another recent report looked at the incremental spread pick-up investors can earn by moving out of investment grade corporates and into junk.4 It concluded that the extra spread available in high-yield is worth grabbing and that B-rated bonds look particularly attractive in risk-adjusted terms. MBS: Underweight Chart 4MBS Market Overview
MBS Market Overview
MBS Market Overview
Mortgage-Backed Securities underperformed the duration-equivalent Treasury index by 3 basis points in August, dragging year-to-date excess returns down to -67 bps. The nominal spread between conventional 30-year MBS and equivalent-duration Treasuries tightened 4 bps in August. The spread is wide compared to recent history, but it remains tight compared to the pace of mortgage refinancings (Chart 4). The conventional 30-year MBS option-adjusted spread (OAS) widened 2 bps in August (panel 2), and it is now starting to look attractive compared to other similarly risky spread sectors. The conventional 30-year MBS OAS sits at 38 bps, below the 56 bps offered by Aa-rated corporate bonds but above the 20 bps offered by Aaa-rated consumer ABS and the 35 bps offered by Agency CMBS. In a recent report we looked at MBS performance and valuation across the coupon stack.5 We noted that the higher convexity of high-coupon MBS makes them likely to outperform lower-coupon MBS in a rising yield environment. Higher coupon MBS also have greater OAS than lower coupons. This makes the high-coupon MBS more likely to outperform in a flat bond yield environment as well. Given our view that bond yields will be higher in 6-12 months, we recommend favoring high coupons (4%, 4.5%) over low coupons (2%, 2.5%, 3%) within an overall underweight allocation to Agency MBS. Government-Related: Neutral Chart 5Government-Related Market Overview
Government-Related Market Overview
Government-Related Market Overview
The Government-Related index outperformed the duration-equivalent Treasury index by 27 basis points in August, bringing year-to-date excess returns up to +84 bps (Chart 5). Sovereign debt outperformed duration-equivalent Treasuries by 122 bps in August, bringing year-to-date excess returns up to +7 bps. Foreign Agencies outperformed the Treasury benchmark by 8 bps on the month, bringing year-to-date excess returns up to +44 bps. Local Authority bonds outperformed by 9 bps in August, bringing year-to-date excess returns up to +382 bps. Domestic Agency bonds outperformed by 3 bps, bringing year-to-date excess returns up to +30 bps. Supranationals outperformed by 5 bps, bringing year-to-date excess returns up to +31 bps. USD-denominated Emerging Market (EM) Sovereign bonds outperformed US corporates in August and relative valuation between the two sectors is starting to equalize (panel 4). That said, we retain a preference for EM sovereigns over US corporates, particularly the bonds of Russia, Mexico, Saudi Arabia, UAE and Qatar where value remains attractive. A recent report looked at valuation within the investment grade USD-denominated EM corporate space.6 It found that EM corporates are attractively priced relative to US corporate bonds across the entire investment grade credit spectrum. It also found that EM corporates are attractive relative to EM sovereigns within the A and Baa credit tiers. EM sovereigns have the edge in the Aa credit tier. Municipal Bonds: Overweight Chart 6Municipal Market Overview
Municipal Market Overview
Municipal Market Overview
Municipal bonds underperformed the duration-equivalent Treasury index by 9 basis points in August, dragging year-to-date excess returns down to +262 bps (before adjusting for the tax advantage). The economic and policy back-drop remains favorable for municipal bond performance. Trailing 4-quarter net state & local government savings were already positive through the end of Q1 2021 and they received another significant boost in Q2 as funds from the American Rescue Plan were doled out (Chart 6). With state & local government balance sheets in such good shape, we are comfortable moving down in quality within municipal bonds. A move down in quality is especially compelling because of tight Aaa muni valuations relative to Treasuries (top panel). Valuation is more compelling in the lower investment grade credit tiers, especially at the long-end of the curve.7 GO munis in the 12-17 year maturity bucket offer a 5% breakeven tax rate versus corporates with the same credit rating and duration. 12-17 year Revenue munis actually offer a before-tax yield pick-up (panel 2). Finally, high-yield muni spreads are reasonably attractive relative to high-yield corporates, offering a breakeven tax rate of 23% (panel 4). But despite the attractive spread, we recommend only a neutral allocation to high-yield munis versus high-yield corporates as the deep negative convexity of high-yield munis makes them susceptible to extension risk if bond yields rise. Treasury Curve: Buy 2/10 Barbell Versus 5-Year Bullet Chart 7Treasury Yield Curve Overview
Treasury Yield Curve Overview
Treasury Yield Curve Overview
Treasury yields moved higher in August, with the 5-year and 7-year maturities bearing the brunt of the sell-off. The 2-year/10-year Treasury slope steepened 5 bps to end the month at 110 bps. The 5-year/30-year slope flattened 5 bps to end the month at 115 bps. We expect bond yields to be higher in 6-12 months, but we also anticipate that the next significant move higher in bond yields will coincide with curve flattening, not steepening. At 1.93%, the 5-year/5-year forward Treasury yield is not that far below our target fair value range of 2% - 2.25%. In a recent report, we demonstrated that yield curve steepening only occurs when either the Fed is cutting rates or the 5-year/5-year forward yield rises.8 This means that the 2/10 Treasury curve is more likely to flatten than steepen during the next 6-12 months, even as bond yields move higher. Similarly, we observe that the overnight index swap (OIS) curve is priced for the fed funds rate to be 0.21% in one year’s time and 1.47% in five years (Chart 7). The latter rate has 146 bps of upside if it converges all the way back to its 2018 high, but this pales in comparison to the 265 bps of upside in the 12-month forward rate. The yield curve will flatten as the 12-month forward OIS rate converges with the 5-year forward rate (panel 3). Investors should position in yield curve flatteners on a 6-12 month horizon. Specifically, we recommend shorting the 5-year bullet versus a duration-matched 2/10 barbell. TIPS: Neutral Chart 8TIPS Market Overview
TIPS Market Overview
TIPS Market Overview
TIPS performed in line with the duration-equivalent nominal Treasury index in August, leaving year-to-date excess returns unchanged at +578 bps. The 10-year and 5-year/5-year forward TIPS breakeven inflation rates both fell by 7 bps in August. At 2.37%, the 10-year TIPS breakeven inflation rate is near the middle of the 2.3% to 2.5% range that is consistent with inflation expectations being well anchored around the Fed’s target (Chart 8). Meanwhile, at 2.21%, the 5-year/5-year forward TIPS breakeven inflation rate is only just below target (panel 3). With long-dated inflation expectations close to the Fed’s target levels, we see limited upside on a 6-12 month investment horizon. We also see the cost of short-maturity inflation protection falling during the next few months as realized inflation continues to moderate from its current extremely high level. This will lead to some modest steepening of the inflation curve (bottom panel). While the inflation curve has some room to steepen, we don’t see it returning to positive territory. An inverted inflation curve is simply more consistent with the Fed’s Average Inflation Target than a positively sloped one. This is because the Fed’s new framework calls for it to attack its inflation target from above rather than from below. ABS: Overweight Chart 9ABS Market Overview
ABS Market Overview
ABS Market Overview
Asset-Backed Securities outperformed the duration-equivalent Treasury index by 3 basis points in August, bringing year-to-date excess returns up to +40 bps. Aaa-rated ABS outperformed by 2 bps on the month, bringing year-to-date excess returns up to +30 bps. Non-Aaa ABS outperformed by 4 bps, bringing year-to-date excess returns up to +92 bps. The stimulus from last year’s CARES Act led to a significant increase in household savings when individual checks were mailed in April 2020. That excess savings has still not been spent and the most recent round of stimulus checks has only added to the stockpile (Chart 9). The extraordinarily large stock of household savings means that the collateral quality of consumer ABS is also extraordinarily high. Indeed, many households have been using their windfalls to pay down consumer debt (bottom panel). Investors should remain overweight consumer ABS and should also take advantage of the high quality of household balance sheets by moving down the quality spectrum. Non-Agency CMBS: Neutral Chart 10CMBS Market Overview
CMBS Market Overview
CMBS Market Overview
Non-Agency Commercial Mortgage-Backed Securities outperformed the duration-equivalent Treasury index by 6 basis points in August, bringing year-to-date excess returns up to +193 bps. Aaa Non-Agency CMBS outperformed Treasuries by 10 bps in August, bringing year-to-date excess returns up to +92 bps. Non-Aaa Non-Agency CMBS underperformed Treasuries by 9 bps on the month, dragging year-to-date excess returns down to +529 bps (Chart 10). Though returns have been strong and spreads remain attractive, particularly for lower-rated CMBS, we continue to recommend only a neutral allocation to the sector because of the structurally challenging environment for commercial real estate. Agency CMBS: Overweight Agency CMBS outperformed the duration-equivalent Treasury index by 4 basis points in August, bringing year-to-date excess returns up to +91 bps. The average index option-adjusted spread held flat on the month. It currently sits at 35 bps (bottom panel). Though Agency CMBS spreads have recovered to well below pre-COVID levels, they still look attractive compared to other similarly risky spread products. Stay overweight. Ryan Swift US Bond Strategist rswift@bcaresearch.com Appendix A: Butterfly Strategy Valuations The following tables present the current read-outs from our butterfly spread models. We use these models to identify opportunities to take duration-neutral positions across the Treasury curve. The following two Special Reports explain the models in more detail: US Bond Strategy Special Report, “Bullets, Barbells And Butterflies”, dated July 25, 2017, available at usbs.bcaresearch.com US Bond Strategy Special Report, “More Bullets, Barbells And Butterflies”, dated May 15, 2018, available at usbs.bcaresearch.com Table 4 shows the raw residuals from each model. A positive value indicates that the bullet is cheap relative to the duration-matched barbell. A negative value indicates that the barbell is cheap relative to the bullet. Table 4Butterfly Strategy Valuation: Raw Residuals In Basis Points (As Of August 31st, 2021)
The Delta Drag
The Delta Drag
Table 5 scales the raw residuals in Table 4 by their historical means and standard deviations. This facilitates comparison between the different butterfly spreads. Table 5Butterfly Strategy Valuation: Standardized Residuals (As Of August 31st, 2021)
The Delta Drag
The Delta Drag
Table 6 flips the models on their heads. It shows the change in the slope between the two barbell maturities that must be realized during the next six months to make returns between the bullet and barbell equal. For example, a reading of 12 bps in the 5 over 2/10 cell means that we would only expect the 5-year to outperform the 2/10 if the 2/10 slope steepens by more than 12 bps during the next six months. Otherwise, we would expect the 2/10 barbell to outperform the 5-year bullet. Table 6Discounted Slope Change During Next 6 Months (BPs)
The Delta Drag
The Delta Drag
Appendix B: Excess Return Bond Map The Excess Return Bond Map is used to assess the relative risk/reward trade-off between different sectors of the US bond market. It is a purely computational exercise and does not impose any macroeconomic view. The Map’s vertical axis shows 12-month expected excess returns. These are proxied by each sector’s option-adjusted spread. Sectors plotting further toward the top of the Map have higher expected returns and vice-versa. Our novel risk measure called the “Risk Of Losing 100 bps” is shown on the Map’s horizontal axis. To calculate it, we first compute the spread widening required on a 12-month horizon for each sector to lose 100 bps or more relative to a duration-matched position in Treasury securities. Then, we divide that amount of spread widening by each sector’s historical spread volatility. The end result is the number of standard deviations of 12-month spread widening required for each sector to lose 100 bps or more versus a position in Treasuries. Lower risk sectors plot further to the right of the Map, and higher risk sectors plot further to the left. Chart 11Excess Return Bond Map (As Of August 31st, 2021)
The Delta Drag
The Delta Drag
Footnotes 1 Please see US Bond Strategy Weekly Report, “The Post-FOMC Credit Environment”, dated June 29, 2021. 2 For ideas on how to increase the average spread of a US bond portfolio please see US Bond Strategy Weekly Report, “The Collapsing Credit Risk Premium”, dated July 20, 2021. 3 Please see US Bond Strategy Weekly Report, “The Post-FOMC Credit Environment”, dated June 29, 2021. 4 Please see US Bond Strategy Weekly Report, “The Collapsing Credit Risk Premium”, dated July 20, 2021. 5 Please see US Bond Strategy Weekly Report, “A New Conundrum”, dated April 20, 2021. 6 Please see US Bond Strategy Weekly Report, “The Post-FOMC Credit Environment”, dated June 29, 2021. 7 Please see US Bond Strategy Weekly Report, “The Collapsing Credit Risk Premium”, dated July 20, 2021. 8 Please see US Bond Strategy / Global Fixed Income Strategy Weekly Report, “A Bump On The Road To Recovery”, dated July 27, 2021.
Foreword Today we are publishing a charts-only report focused on the S&P 500, Cyclicals/Defensives, Growth/Value, and Small/Large. Many of the charts are self-explanatory; to some we have added a short commentary. The charts cover macro, valuations, fundamentals, technicals, and the uses of cash. Our goal is to equip you with all the data you need to make investment decisions along these style dimensions. We also include performance, valuations, and earnings growth expectations tables for all styles, sectors, industry groups, and industries (GICS 1, 2 and 3). We hope you will find this publication useful. We alternate between Style and Sector chart packs updates on a bi-monthly basis. Overarching Investment Themes Macro Is bad news good news again? Investors are caught in crosscurrents of worries and deteriorating economic data. The Citigroup Economic Surprise index is in negative territory (Chart 1) – yet the US equity market defies gravity. The bad news is good news again, as it gives the Fed cover to keep a loose monetary policy for longer. Tapering: The Fed has broadcast its plans for tapering well in advance, and Fed Chair Jay Powell’s Jackson Hole speech, with its many caveats and uncertain timetable, produced a muted reaction from financial markets. However, investors exhaled with relief, when Powell explicitly separated the decision to taper from the timing of the first rate hike, conditioned on full employment, which is “a long way off”. Covid-19 Delta variant has caught investors off guard: "What does not kill us, mutates and tries again”. While a new wave of infections has dented consumer activity, there are early signs that it is cresting (Chart 2). Delta scare was a key reason for the underperformance of consumer services and cyclical stocks over the summer. Once fears of Delta subside, these groups will bounce back. Chart 1US Economic Data Disappoints
US Economic Data Disappoints
US Economic Data Disappoints
Chart 2Delta Infections Are Cresting
Delta Infections Are Cresting
Delta Infections Are Cresting
Supply chain disruptions are still rampant: Shipping costs have soared again in recent months: After falling below 10 this summer, the number of anchored containers ships waiting to offload in the West Coast ports has spiked again to 40, a level last seen in January 2021. Container freight costs have increased nearly five-fold from pre-pandemic levels (Chart 3). There are also significant backlogs of goods (Chart 4), and inventories have been drawn down to all-time low. It will take time for supply chains to normalize, with most industry participants expecting the situation to improve only in 2022. Chart 3Transportation Costs Have Surged
Transportation Costs Have Surged
Transportation Costs Have Surged
Chart 4Supply Chain Bottlenecks Are Not Abating
Supply Chain Bottlenecks Are Not Abating
Supply Chain Bottlenecks Are Not Abating
Labor shortages: : Companies are still struggling to fill job openings: There are 10 million job openings to slightly over eight million job seekers (Chart 5). That puts upward pressure on wages and increases companies’ costs. Disappointing jobs report: It is confounding, given strong demand for workers, that August payroll grew only by 235,000 jobs. While this low number may have resulted from the Delta hit to service industries, jobs data is volatile, and revisions are common. Next month's report will be a decisive data point for the Fed’s tapering timing decision. Chart 5Plenty Of Job Openings To Fill
Plenty of Job Openings To Fill
Plenty of Job Openings To Fill
Chart 6Inflation Is Broadening
Inflation Is Broadening
Inflation Is Broadening
Companies continue rising prices: Good news for corporate America is that its pricing power remains high, with 45% of companies planning on passing surging labor and supply costs on to consumers. This leads to a broadening of inflation across categories, with even trimmed means significantly overshooting 2% (Chart 6). While pricing power protects against significant margin compression, former peak margins are elusive. Consumer mood has soured: Consumers are well-aware of rising prices and expect inflation to exceed 6.5% within 12 months - high inflation is becoming embedded into consumer behavior and may become a self-fulfilling prophecy. The consumer confidence reading has slumped to a six-month low of 114 from 125 a month earlier. Many consumers have also postponed durable goods and house purchases discouraged by soaring prices and low inventories (Chart 7). Quality balance sheets outperformed: The wall of worries has resulted in strong balance sheet equities outperforming weak ones. This is also consistent with the classical performance of assets during the slowdown stage of the business cycle (Chart 8). Chart 7Consumer Are Discouraged By Prices And Shortages Of Inventory
Consumer Are Discouraged By Prices And Shortages Of Inventory
Consumer Are Discouraged By Prices And Shortages Of Inventory
Chart 8Strong Balance Sheet Companies Outperformed During The Slowdown
Strong Balance Sheet Companies Outperformed During The Slowdown
Strong Balance Sheet Companies Outperformed During The Slowdown
Valuations and Profitability Q2-2021 earnings season was remarkable both in terms of growth delivered (96% yoy%), and earnings surprise (88%). Earnings have grown at a 14% compound rate since 2019: Chart 9Earnings Growth Is Returning To Trend
US Equity Chart Pack
US Equity Chart Pack
Now earnings have returned to trend, and we expect normalization of growth. Analysts expect flat QoQ growth for the next three quarters. These are timid expectations; barring a black swan event, earnings growth is likely to surprise on the upside (Chart 9). Earnings growth will provide the necessary impetus for the US equity markets to move higher, with the driver of returns shifting from multiple expansion to earnings growth and cash disbursements to shareholders. Valuations remain elevated with the S&P 500 trading at 21x forward earnings. However, this level of valuations is more of a speed limit for future gains as opposed to a harbinger of a bear market. Sentiment Buy the dip investor mentality prevails. The S&P 500 has not had a 10% correction for nearly a year. This can be explained by FOMO (fear of missing out), and $2 trillion in excess savings in the US: cash that many retail investors aim to park in US equities. Retail flows into domestic equities have been exceptionally strong (Chart 10). Uses of Cash Share buybacks and other shareholder-friendly activities are on the rise again and are expected to gain steam this year and next. S&P 500 buybacks have increased from $120B reported two months ago to nearly $180B – impressive. This is another driver of returns in addition to earnings growth (Chart 11). Chart 10Retail Investors Buy On Dips
Retail Investors Buy On Dips
Retail Investors Buy On Dips
Chart 11Buybacks Are A Driver Of Returns
Buybacks Are A Driver Of Returns
Buybacks Are A Driver Of Returns
Investment Implications Low for longer: Fed’s dovish stance, Delta scare, and deteriorating economic growth data suggest that rates are likely to remain “low for longer”, and tapering may be postponed till January 2022. S&P 500: We expect US equities to perform well into the balance of the year on the back of an easy fiscal and monetary policy and steady earnings growth. Growth vs Value: Economic growth continues to slow, the Delta variant is still at the forefront of investor worries, and the Fed is dovish: Interest-rate sensitive stocks, such as Growth and Technology sector will continue outperforming. Cyclicals vs Defensives: We expect consumer cyclicals to start performing again once the onset of Delta dissipates, and more people are willing to travel and eat out. We believe that this is imminent and we are watching Delta stats closely. We also believe that parts of the Industrial sector most exposed to restocking of inventories, infrastructure, and construction will perform strongly. Small vs Large: Small is an “out of the gate” asset class, which tends to surge at the first whiff of recovery. Recently, Small started outperforming on the news that the number of new Delta cases is rolling over. Small is cheap relative to Large, and most of the earnings downgrades are already in the price. We are getting more constructive on this asset class. Irene Tunkel Chief Strategist, US Equity Strategy irene.tunkel@bcaresearch.com S&P 500 Chart 12Macroeconomic Backdrop
Macroeconomic Backdrop
Macroeconomic Backdrop
Chart 13Profitability
Profitability
Profitability
Chart 14Valuations And Technicals
Valuations And Technicals
Valuations And Technicals
Chart 15Uses Of Cash
Uses Of Cash
Uses Of Cash
Cyclicals Vs Defensives Chart 16Macroeconomic Backdrop
Macroeconomic Backdrop
Macroeconomic Backdrop
Chart 17Profitability
Profitability
Profitability
Chart 18Valuation And Technicals
Valuation And Technicals
Valuation And Technicals
Chart 19Uses Of Cash
Uses Of Cash
Uses Of Cash
Growth Vs Value Chart 20Macroeconomic Backdrop
Macroeconomic Backdrop
Macroeconomic Backdrop
Chart 21Profitability
Profitability
Profitability
Chart 22Valuations And Technicals
Valuations And Technicals
Valuations And Technicals
Small Vs Large Chart 23Macroeconomic Backdrop
Macroeconomic Backdrop
Macroeconomic Backdrop
Chart 24Profitability
Profitability
Profitability
Chart 25Valuations And Technicals
Valuations and Technicals
Valuations and Technicals
Chart 26Uses Of Cash
Uses Of Cash
Uses Of Cash
Recommended Allocation . Footnotes
Highlights A trio of ECB hawks raised the prospect of an ECB taper. In the past, the current set of economic conditions in the Euro Area would have prompted the ECB to tighten policy. A potential economic deceleration this fall, the transitory nature of the Eurozone’s inflation spike, and the level of inflation expectation in the region limit the ECB’s ability to taper this week. We expect a one-off return to the pre-Q2 2021 level of asset purchases couched in a very dovish forward guidance. Peripheral bonds and European corporate bonds will outperform German and other core European paper. Stay long European curve steepeners, while buying US curve flatteners. Overweight German Bunds versus US Treasury Notes, on a USD-hedged basis. European productivity will remain structurally hampered compared to that of the US. US real bond yields will rise relative to Europe. Feature Last week, a chorus of ECB Governing Council members raised the idea among investors that the central bank may soon begin to taper its asset purchases, which prompted Bund yields to hit -0.35% on Wednesday. Robert Holzmann of Austria, Klaas Knot of the Netherlands, and Jens Weidmann of Germany all suggested that monetary conditions were too accommodative for the Eurozone and that the ECB needed to remedy this problem. The complaints of this hawkish trio reflect the current environment. In August, the Eurozone HICP reached a 3% annual rate while the preliminary estimate for core CPI clicked in at 1.6%. Meanwhile, July PPI rose to 12.1%. Such robust inflation readings are at odds with the low level of interest rates in the Eurozone, where the yields on European IG credit and 10-year Italian BTPs average a paltry 0.45% (Chart 1). Beyond the level of inflation, its broad geographic nature is an additional source of concern. Headline CPI is accelerating across all the bloc’s nations, and it stands above 2% in 82% of the members’ states. Historically, this kind of inflationary backdrop resulted in either higher interest rates or some tapering of asset purchases, especially when economic activity was also improving in the Eurozone (Chart 2). Chart 1A Gap For The Hawks
A Gap For The Hawks
A Gap For The Hawks
Chart 2In The Past, The ECB Would Have Tightened
In The Past, The ECB Would Have Tightened
In The Past, The ECB Would Have Tightened
Will the ECB listen to its most hawkish members and follow its past script? We do not believe that the Governing Council is about to start a sustained period of decreased bond buying, even if a return to the pre-Q2 2021 pace of buying is likely this fall. Thus, a dovish taper is the most likely outcome of this week’s meeting. The ECB’s Three Constraints The outlook for growth, the temporary nature of the current spike in European inflation, and the low-level of Euro Area inflation expectations limit the ECB’s ability to remove monetary accommodation. First, European economic growth is at its apex and will decelerate over the next six months. Currently, domestic activity as approximated by the Services PMI stands at near a 15-year high of almost 60. Moreover, despite the spike in COVD-19 cases linked to the Delta variant, mobility remains very robust. If anything, the decline in cases in Spain and France should lead to further improvement in mobility (Chart 3). Nonetheless, the recent fall in consumer confidence and the recent US experience, which the European economy usually follows, point to a deceleration in the Services PMI. The case for a decline in manufacturing activity is more pronounced. The European manufacturing sector responds strongly to the fluctuation of the global industrial sector. US consumer spending on durable goods is 21% above its pre-pandemic trend and is beginning to weaken as pent-up demand for such products has been satiated and households shift their spending back toward services. Moreover, the Chinese credit cycle, which leads the Eurozone Manufacturing PMI by nine months, indicates a greater deceleration in the coming quarters, because European exports to China will slow (Chart 4, top and middle panels). In response to these two forces, Europe will not diverge from the deterioration in our Global Activity Nowcast (Chart 4, bottom panel). Chart 3So Far, No Delta Impact
So Far, No Delta Impact
So Far, No Delta Impact
Chart 4The Coming Manufacturing Slowdown
The Coming Manufacturing Slowdown
The Coming Manufacturing Slowdown
Chart 5Abnormal Goods Inflation
Abnormal Goods Inflation
Abnormal Goods Inflation
Second, most evidence still suggests that the current inflation increase will be temporary, despite its violence. To begin with, the spike in inflation remains consigned to the goods sectors, while services inflation stands at 1.1%, in line with the experience of the past 10 years (Chart 5). Even within goods prices, the spike in CPI is limited to sectors facing bottlenecks or linked closely to commodity and shipping prices. As Chart 6 illustrates, the categories experiencing abnormal inflation are directly related to higher energy prices, cars, complex machinery, hotels, and fresh food. Meanwhile, underlying inflation as estimated by our trimmed-mean CPI measure is bottoming, but remains at a very low 0.2% annual rate (Chart 7). Chart 6Inflation Remains A Commodity and Bottleneck Story
The ECB Taper Dilemma
The ECB Taper Dilemma
In the same vein, the surge in Selling Price Expectations of the European Commission Business Survey is a function of commodity inflation (Chart 8). In other words, companies feel they can increase their selling prices, because natural resource prices have spiked. However, inflation across many commodities is currently peaking, which suggests that Selling Price Expectations will soon do so as well. Moreover, this process indicates that headline inflation should hit its summit by year end, because Selling Price Expectations are a coincident indicator of inflation (Chart 8, bottom panel). Chart 7Narrow Inflation
Narrow Inflation
Narrow Inflation
Chart 8Rising Selling Prices And Commodities
Rising Selling Prices And Commodities
Rising Selling Prices And Commodities
A wage-inflation spiral also remains far away. Historically, rapidly accelerating wage growth marked periods of elevated inflation. Despite current fears, such a development is not taking place in the Eurozone. For the whole bloc, negotiated wages are growing at a modest 1.7% annual rate (Chart 9). Even in Germany, negotiated wages are only increasing at the same rate. While some labor shortages have been reported, total hours worked remain below the equilibrium level based on the Euro Area demographic profile (Chart 9, bottom panel). Furthermore, the past ten years reveal that labor shortages only caused stronger salary growth with a multi-year delay. Third, the market doubts the credibility of the ECB when it comes to achieving a 2% inflation target. So far, survey-based inflation expectations remain below 2% at all tenors (Chart 10, top panel). The same is true of market-based measures, which are still lower than the levels that prevailed before the sovereign debt crisis of the past decade (Chart 10, bottom panel). Chart 9No Wages/Inflation Spiral
No Wages/Inflation Spiral
No Wages/Inflation Spiral
Chart 10The ECB's Inflation Mandate Is Not Yet Credible
The ECB's Inflation Mandate Is Not Yet Credible
The ECB's Inflation Mandate Is Not Yet Credible
Bottom Line: Risks to growth over the winter, the transitory nature of the recent inflation shock, and inflation expectations that remain significantly below target are constraints limitating the ability of the ECB to announce a true tapering of its asset purchases this Thursday. A Dovish Taper? Considering the current set of conditions prevailing in the Eurozone, we expect the ECB to announce a return to the pace of asset purchases that existed prior to Q2 2021. However, the Governing Council (GC) will go out of its way to issue clear forward guidance that strongly indicates this is not the beginning of a taper campaign. Instead, the GC will hint at the transmutation of a large proportion of the PEPP monthly buying into the PSPP after March 2022. The inflation target change enacted at the conclusion of the ECB’s strategy review in July limits the central bank’s ability to go back to its old rule book and tighten policy at the first hint of inflation. First, the ECB must believe that inflation will overshoot 2% on a durable basis, which will necessitate an upgrade to its long-term inflation forecast above the target. Too many members of the GC do not share this view, which makes it unlikely that inflation forecasts will rise this much this week. Moreover, inflation expectations are also too low to warn of a meaningful change in the behavior of European economic agents, especially if the current spike in inflation proves to be transitory. Another problem for the ECB is the Fed. If the ECB were to announce a durable tapering of its asset purchase this week, it would be doing so ahead of the Fed. The GC fears that this action would put considerable upward pressure on EUR/USD, which would create a grave deflationary tendency in the Eurozone (Chart 11). Despite these shackles, the ECB will also acknowledge that the current emergency pace of asset purchases is no longer warranted. Starting Q2 2021, the ECB increased its average monthly purchase from EUR80 billion in the August 2020 to March 2021 period, to EUR95 billion since April 2021 (Chart 12). However, these increased purchases followed a 0.1% GDP contraction in Q1 in the wake of a spike in COVID-19 cases and deaths, which prompted a large reduction in mobility. Moreover, the larger bond buying also followed large increases in bond yields across the main economies of the continent, a rise which, if it had been left unchecked, would have exacerbated the economic malaise. Chart 11The ECB Fears A Strong Euro
The ECB Fears A Strong Euro
The ECB Fears A Strong Euro
Chart 12Normalizing Purchases
The ECB Taper Dilemma
The ECB Taper Dilemma
None of these factors are still present. The increasing level of vaccination has dulled the economic impact of the third wave of infection. The economy is expanding robustly and, even if it slows in the months ahead, growth will remain well above trend. Crucially, financial conditions are much more generous than in the first half of the year, with a euro that trades 4% below its January peak and with yields in the bloc’s four largest economies 25 to 45 basis points below their spring peaks. Bottom Line: In response to the aforementioned crosscurrents, we anticipate the ECB to announce a return of its monthly asset purchases to the level that prevailed in the August 2020 to March 2021 period. However, the GC will also clearly indicate, as it did last March, that this policy shift is a one-off, and that investors must not anticipate any further curtailment of asset purchases over the next six months. To reinforce this guidance, we expect the ECB’s inflation forecast to show a return of HICP below 2% by the end of 2023. The GC might also hint at the roll-over of the PEPP program into the PSPP after March 2022. Investment Implications An ECB that conducts a dovish taper on Thursday will support our main fixed-income themes in Europe. First, it will remain a tailwind behind an overweight position in peripheral government bonds versus German bonds. The combination of continued purchases of EUR80 billion a month of bonds over the foreseeable future, above-trend growth, and the fiscal risk mutualization from the NGEU and REACT EU programs means that investors can continue to safely pocket the yield premium offered by BTPs and BONOs. Moreover, our geopolitical strategists expect a left-wing coalition to govern Germany after the September 26 election, which will limit the pressures to tighten budgets in the periphery over the coming years. Chart 13European Corporates Remain Attractive
European Corporates Remain Attractive
European Corporates Remain Attractive
Second, continued liquidity injections by the ECB are also consistent with a preference for European corporate credit over government securities, especially in Germany, France, and the Netherlands. European breakeven spreads for IG and high-yield debts are in the 18th and 13th percentile rank, respectively (Chart 13). Easy monetary conditions and above-trend growth will facilitate further yield-seeking behavior in the Eurozone. This process will allow these securities to offer continued excess returns over at least the next six months. Third, we hold on to our box trade of being long Eurozone curve steepeners and long US curve flatteners. In our base case scenario, the Fed will soon indicate the beginning of its tapering campaign and will be on track to raise rates by early 2023, while the ECB will still conduct a very easy monetary policy. In this context, the US yield curve will flatten relative to the European one, driven by a more rapid increase at the short end of the curve. Chart 14Still Favor Bunds Over T-Notes
The ECB Taper Dilemma
The ECB Taper Dilemma
Finally, in a global bond portfolio, it still makes sense to overweight German Bunds (hedged into USD) relative to US Treasury Notes. Bunds display a significantly lower yield beta than their US counterparts, which creates an attractive defensive feature in an environment in which global yields are likely to rise. Moreover, as the model in Chart 14 highlights, the US/German 10-year yield spread is roughly 50bps below an equilibrium estimate based on relative inflation, unemployment and policy rates, and the size of the Fed and ECB balance sheets. US inflation is likely to remain perkier than that of Europe over the coming quarters, and the US unemployment rate will decline faster as well. Additionally, in the unlikely scenario that the Fed declines to taper its purchases this year, but the ECB does, inflation expectations will rise in the US relative to the Euro Area, which will put upward pressure on yield spreads. Bottom Line: A dovish ECB taper, whereby the GC executes a one-off adjustment in asset purchases with an easy forward guidance, will support our overweight in peripheral government bonds relative to bunds, our preference for European corporate credit relative to government paper, our Europe / US box trade, and BCA’s underweight in Treasurys relative to Bunds. Europe’s Productivity Deficit Is Not Over Compared to the US, GDP growth in the Eurozone has been trending lower since the introduction of the euro in 1999. While a weaker demographic profile has hurt Europe, so has slower productivity growth. Going forward, the gap between European and US productivity growth will somewhat narrow compared to last decade, but it will still favor the US. The cross-Atlantic gap in output per hour growth between has a cyclical and a structural component. The cyclical element is set to ebb. Last decade, the Eurozone suffered a double-dip recession, as the European sovereign debt crisis raged. As a result, capex and debt accumulation in Europe lagged that of the US, which hurt demand and, thus, output-per-hour worked (Chart 15, top panel). Going forward, the European debt crisis has been addressed, the ECB has demonstrated its willingness to do “whatever it takes” to support the monetary union and both the European Commission and the German government have thrown their full weight behind the integrity of Europe, even if it means bailing out their profligate southern neighbors. Despite this positive, some structural headwinds will continue to handicap European productivity. Since 2000, total factor productivity in the major Euro Area economies has lagged that of the US (Chart 15, bottom panel). Many factors suggest this will not change: Chart 15Europe’s Productivity Deficit
The ECB Taper Dilemma
The ECB Taper Dilemma
The Eurozone’s big four economies continue to linger well behind the US in terms of ICT investment, which in recent decades has been a crucial driver of productivity. R&D represents a significantly lower share of GDP in the Eurozone than it does in the US (Chart 16). More investment in intangible assets has been linked to higher productivity growth. Additionally, Ortega-Argilés et al. have shown that EU companies do not convert R&D into productivity gains as well as US businesses do, because they generate lower return on investments.1 Confirming this insight, an empirical study using microdata on R&D spending for EU and US firms highlights that both R&D intensity and productivity are lower for EU firms than for their US counterparts.2 For a 10% increase in R&D intensity, US businesses generated a 2.7% increase in productivity, while EU firms enjoyed a much smaller 1% gain. The gap is larger for high-tech companies, where the same rise in R&D intensity produced a 3.3% productivity gain in the US, but only a 1.2% one in the EU. The European economy remains much more fragmented than that of the US, and the greater prevalence of small firms in the Euro Area results in a less efficient use of the human and capital stocks. Finally, the low rate of investments in recent years has caused the European capital stock to age faster than that of the US. An older pool of assets is further away from the technological frontier and thus weighs on TFP and overall labor productivity (Chart 17). Chart 16Lagging European R&D
The ECB Taper Dilemma
The ECB Taper Dilemma
Chart 17The Ageing European Capital Stock
The Ageing European Capital Stock
The Ageing European Capital Stock
Notwithstanding cyclical fluctuations related to the global debt cycle, the Eurozone profit margins and RoEs will not converge meaningfully toward US levels on a structural basis because of this productivity problem. Europe’s lower industry concentration ratios, lower markups, and greater share of output absorbed by wages will only accentuate this problem. Chart 18TIPS Yields Vs Real Bunds
TIPS Yields Vs Real Bunds
TIPS Yields Vs Real Bunds
As a result of the lower trend growth rate caused by lower productivity and its inferior return on invested capital, Europe’s R-Star is unlikely to catch up meaningfully to US levels. Consequently, the gap between US and Germany real rates will remain wide and will drive the increase in US yields relative to those of Germany, as the Fed begins to tighten policy while the ECB stands pat (Chart 18). Bottom Line: Europe’s productivity deficit is not the only consequence of last decade’s sovereign debt crisis. Thus, the Euro Area’s potential GDP growth and return on invested capital will lingers behind those of the US. As a corollary, the Eurozone’s R-star is well below that of the US. Hence, we expect higher real rates to drive the increase in US yields over Germany as the Fed tightens policy ahead of the ECB. Mathieu Savary, Chief European Strategist Mathieu@bcaresearch.com Footnotes 1R. Ortega-Argilés, M. Piva, and M. Vivarelli, “The Transatlantic Productivity Gap: Is R&D the Main Culprit?,” Canadian Journal of Economics 47.4 (2014), pp. 1342-71. 2D. Castellani, M. Piva, T. Schubert, and M. Vivarelli, “The Productivity Impact of R&D Investment: A Comparison between the EU and the US,” IZA Discussion Papers 9937 (2016). Tactical Recommendations
The ECB Taper Dilemma
The ECB Taper Dilemma
Cyclical Recommendations
The ECB Taper Dilemma
The ECB Taper Dilemma
Structural Recommendations
The ECB Taper Dilemma
The ECB Taper Dilemma
Closed Trades
The ECB Taper Dilemma
The ECB Taper Dilemma
Currency Performance Fixed Income Performance Equity Performance
Highlights Economy – Goldilocks remains our base-case macro backdrop for the next twelve months: The transitory inflation narrative is still intact, despite persistently high consumer price increases, suggesting that the economy will not overheat. The Delta wave has roiled many communities, but COVID is unlikely to spark a growth outage unless a vaccine-resistant variant emerges. Markets – Above-trend growth and extraordinarily accommodative monetary policy is a sweet spot for risk assets: As long as the Fed’s novel policy of adding monetary stimulus to an economy growing way above trend doesn’t give rise to unnervingly high inflation, the combination will be conducive to continued equity and credit outperformance. Strategy – Continue to overweight risk assets within multi-asset portfolios: There’s more to investment returns than the state of the business, credit and monetary policy cycles but they make a powerful case against turning defensive in the near term. Feature We had several virtual meetings with clients in August and inflation, the Fed and the growth outlook were frequently recurring themes. In this week’s report, we share some of the most common questions, along with our take on them, so that all clients can see what we’ve been discussing with their peers. In the interest of space, we confine the discussion to our base-case scenarios, but future outcomes appear to be even more uncertain than they normally are against a backdrop of unprecedented policy settings. We advise investors to remain vigilant and be prepared to hold positions for shorter-than-usual durations in the event circumstances change. Inflation prints remain high, pressuring the Fed’s transitory narrative. What will happen to markets if investors reject it? Chart 1Losing Steam?
Losing Steam?
Losing Steam?
Inflation prints do remain high, with headline CPI rising 0.5% month-over-month and 5.3% year-over-year in July and core CPI rising 0.3% and 4.2%. Both series modestly exceeded expectations, though they recorded their smallest sequential gains since February and their year-over-year increases came in just below the peaks recorded in June (Chart 1). It is possible that consumer price increases have begun to decelerate though it will take more data to confirm the existence of a new trend. Reports of continued bottlenecks driven by component shortages, transport challenges and the Delta infection wave suggest that even if the factors that have pushed inflation higher are beginning to abate, they may linger in some form for longer than initially expected. The transitory narrative remains intact, however. Drilling into the components of the elevated core CPI reveals that a handful of categories that have been particularly impacted by the pandemic are exerting outsized influence over the index. When we published the initial version of Table 1 in late May, nine categories powered April’s reported core inflation. This time there are eight, as the five shaded components have come off the boil and the four components shown in an indented font have newly begun to run hot. Table 1Temporary Irritants
Discussing Inflation, Growth And Market Implications
Discussing Inflation, Growth And Market Implications
Excepting historically volatile recreational services and water, sewer and trash services, which have been increasing in price far faster than other goods and services for a while, the hot categories’ moves have been extreme relative to their own history. Unless their spaces have undergone lasting structural changes, we expect their two-plus standard deviation moves will not be sustained. The biggest outliers, lodging and new vehicles, can be explained entirely by the pandemic and once hotels are able to return to full capacity and an end to the semiconductor shortage allows automakers to resume normal production levels, they will come back to earth. The turnover among the outliers supports the transitory narrative, as price spikes in categories that have long lagged the overall basket, like airfares and used cars, or have experienced long deflationary skids, like furniture and bedding, appear to have been fleeting. Chart 2Back To The Early Nineties
Back To The Early Nineties
Back To The Early Nineties
Markets would experience considerable disruption if investors became convinced that elevated inflation readings were not transitory. Bond yields would rise sharply; the dollar would weaken, stoking further price increases; and the technology sector would come under pressure, threatening the S&P 500. Worst of all, the Fed would be forced to begin hiking the fed funds rate sooner than expected, on its way to setting it at a higher terminal level than expected, sending rates higher across all maturities and weighing on equities generally. The sizable potential market impacts have us monitoring inflation closely, even if the inflation debate won’t likely be resolved until we have several more monthly data points. So you’re watching inflation closely, but you’re not all that worried about it? That’s the gist of it, yes. We’re watchful but not worried. Part of the reason that respective year-over-year core and headline CPI prints over 4% and 5% give everyone such a start is that inflation hasn’t been so high since the beginning of the nineties (Chart 2). But the structural factors that have helped keep inflation in check for decades didn’t suddenly disappear when the pandemic arrived. While BCA’s house view holds that investors are complacent about inflation’s longer-run trajectory, we expect that it will take a few years for prices to move sustainably higher. Table 2Inflation Checklist
Discussing Inflation, Growth And Market Implications
Discussing Inflation, Growth And Market Implications
We developed our inflation checklist to keep tabs on when inflation is poised to rise enough to impact monetary policy and provoke a market inflection. We check the same three boxes that we have in our previous reviews: Labor demand is still red-hot, year-over-year changes in marquee inflation indexes are still well above the Fed’s target and BCA’s pipeline inflation indicator remains very elevated (Table 2). Wages have not yet broken out in response to the worker shortage, however (Chart 3), and it is as if idle workers are abstaining from working rather than using their leverage to command higher wages. The more refined trimmed-mean measures of the CPI and the PCE Index remain relatively well behaved (Chart 4). Chart 3Wages Have Risen, But They Haven't Broken Out Yet
Wages Have Risen, But They Haven't Broken Out Yet
Wages Have Risen, But They Haven't Broken Out Yet
Chart 4More Refined Inflation Measures Continue To Lag Their Marquee Peers
More Refined Inflation Measures Continue To Lag Their Marquee Peers
More Refined Inflation Measures Continue To Lag Their Marquee Peers
Even if our pipeline inflation indicator has crested, it remains at an extremely high level consistent with above-target consumer price gains (Chart 5). As measured by the DXY Index, the dollar has twice bounced convincingly off support at 90 this year, helping to keep imports from adding fuel to the fire. Core consumer prices in the Eurozone and China are only rising a little more than 1% annually in any event, so the two largest economies outside the US are not yet exporting inflation stateside (Chart 6). Chart 5Inflation Pressures May Finally Be Easing
Inflation Pressures May Finally Be Easing
Inflation Pressures May Finally Be Easing
Chart 6Eurozone Prices Are Rising, But They're Not Yet Elevated
Eurozone Prices Are Rising, But They're Not Yet Elevated
Eurozone Prices Are Rising, But They're Not Yet Elevated
If we had to pick just one indicator to determine whether inflation will become problematic, it would be the shape of the inflation expectations curve. High inflation becomes self-sustaining when economic actors – workers, businesses, consumers and lenders – begin to expect it will persist into the future and change their behavior to align with their expectations. When inflation is expected to be high over the long term, individual workers or their unions insist on higher wages to maintain purchasing power, businesses at all points of the supply chain demand higher prices to protect their margins, consumers accelerate their big-ticket purchase decisions to get the most bang for their buck and lenders require higher nominal pro forma returns. The resulting feedback loops help inflation become entrenched in the same way that expectations of falling prices have paved the way for a deflationary mindset to grip Japan. As long as investors (Table 3) and households (Chart 7) expect inflation to decelerate from the short term to the intermediate term, and again from the intermediate term to the long term, the inflation genie has not gotten out of the bottle. Table 3Investors' Inflation Expectations Curve Is Inverted, ...
Discussing Inflation, Growth And Market Implications
Discussing Inflation, Growth And Market Implications
Chart 7... And So Is Consumers'
... And So Is Consumers'
... And So Is Consumers'
Where do you get the idea that upward S&P 500 earnings revisions are in store? Analysts are already penciling in double-digit year-over-year gains over the next four quarters and growth is plainly decelerating. In our view, the dislocations imposed by COVID-19 across all of 2020 distorts year-over-year earnings comparisons so much that they are of little use. To sidestep that distortion, we have been calculating expected growth by comparing forward four-quarter earnings projections to the annualized run rate of the last reported quarter. As an example, at the beginning of the second quarter earnings season in July, we multiplied the first quarter’s $49.13 EPS by four to get $196.52 and then compared it to the $193.25 sum of expectations for 2Q21 through 1Q22, discovering that analysts were calling for a nearly 2% decline in S&P earnings based on 1Q21's run rate. We also observed that the 2Q21 projection of $45.21 indicated that analysts expected an 8% quarter-over-quarter decline (Table 4). Table 4Expectations At The Start Of The 2Q Earnings Season Were Too Low
Discussing Inflation, Growth And Market Implications
Discussing Inflation, Growth And Market Implications
Looking through modest seasonal effects, S&P 500 EPS tend to grow from quarter to quarter during expansions. An 8% quarter-on-quarter contraction would have been very surprising when nominal GDP, a sound proxy for S&P 500 revenue growth, was projected to grow by at least 2.25% (7% real annual growth plus 2% inflation). Assuming S&P 500 earnings could match GDP growth, we figured that 2Q index EPS would be at least $50, 2% above 1Q and 10% above analyst estimates. With nearly all constituents having reported at press time, it looks like they will settle at $52.74. Chart 8Predicted Declines In Forward Four-Quarter S&P 500 Earnings Are Rare
Predicted Declines In Forward Four-Quarter S&P 500 Earnings Are Rare
Predicted Declines In Forward Four-Quarter S&P 500 Earnings Are Rare
Table 5S&P 500 Earnings
Discussing Inflation, Growth And Market Implications
Discussing Inflation, Growth And Market Implications
BCA does not make point estimates, but a sequential perspective yielded a useful insight that pandemic-distorted year-over-year analysis missed: consensus 2Q earnings estimates were glaringly low when compared to actual 1Q results and the next three quarters’ estimates looked like they had room to rise as well. As Chart 8 shows, forward four-quarter earnings are rarely projected to fall below the most recent quarter’s annualized run rate. With quarterly earnings not projected to exceed 2Q21 until 2Q22 (Table 5), the expectations bar appears to be set low for the next four quarters, especially given 2H21 real annualized GDP growth expectations of around 6% (9% nominal, if inflation declines to no less than 3%) and 1H22 real GDP growth expectations of 3 to 3.5% (5.5 to 6% nominal, if inflation declines to no less than 2.5%). The bottom line is that earnings estimates are quite modest from a sequential perspective when viewed against S&P 500 earnings’ tendency to rise during expansions. While we expect that earnings growth will decelerate, we do not foresee that it will spite history and contract, especially given the extraordinarily accommodative monetary and fiscal policy backdrop. Investment Implications As the foregoing discussion suggests, we remain comfortable with our base-case scenario that the Goldilocks strong-growth/accommodative policy backdrop will remain in place and support risk assets over the next twelve months. Neither the too-hot right-hand tail, in which monetary policy is projected to turn restrictive soon enough to weigh on twelve-month returns, or the too-cold left-hand tail, in which growth disappoints despite copious accommodation, looks particularly likely. But as we keep highlighting in discussions with clients, we are mindful that our conviction levels are necessarily lower than usual given the unprecedented backdrop. We are bullish, but vigilantly so, and we urge investors not to let their guard down. We take heart from what we view as a powerful bias for the Fed to err on the side of providing too much accommodation. It was nothing new when Chair Powell explicitly drew a distinction between tapering asset purchases and hiking the fed funds rate in his Jackson Hole speech a week and a half ago, but it was nonetheless comforting for an investor in risk assets to have the Fed reiterate its dovish default position. A zero fed funds rate is conducive to corporate earnings growth and risk asset outperformance and it will help hold off the start date of the next recession. So too will the lagged effects of massive fiscal transfers that bolster households’ ability to consume. The path of least resistance is for risk assets to continue generating excess returns. Doug Peta, CFA Chief US Investment Strategist dougp@bcaresearch.com
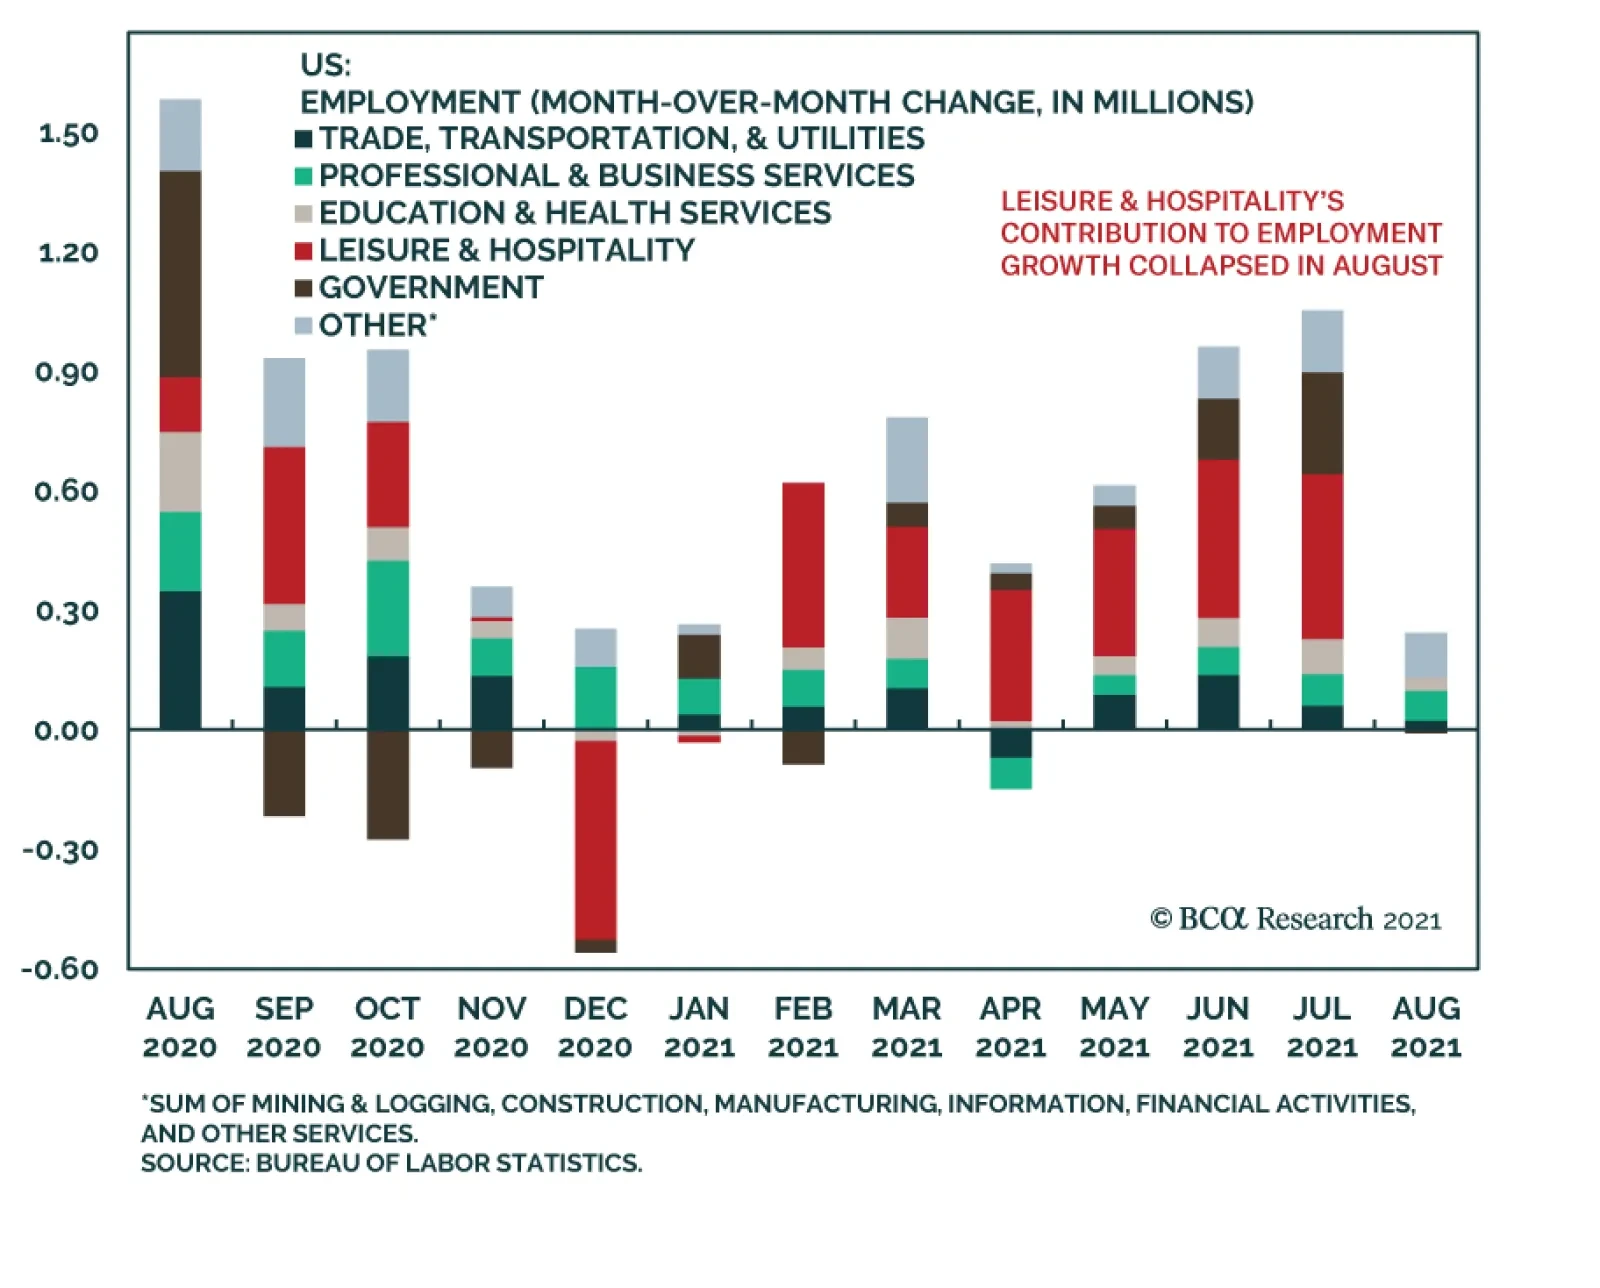
The US employment report for August was a massive miss. Nonfarm payroll employment rose by 235 thousand, which is significantly below July's upwardly revised 1.1 million and consensus estimates of 733 thousand. Meanwhile, the participation rate was flat at…
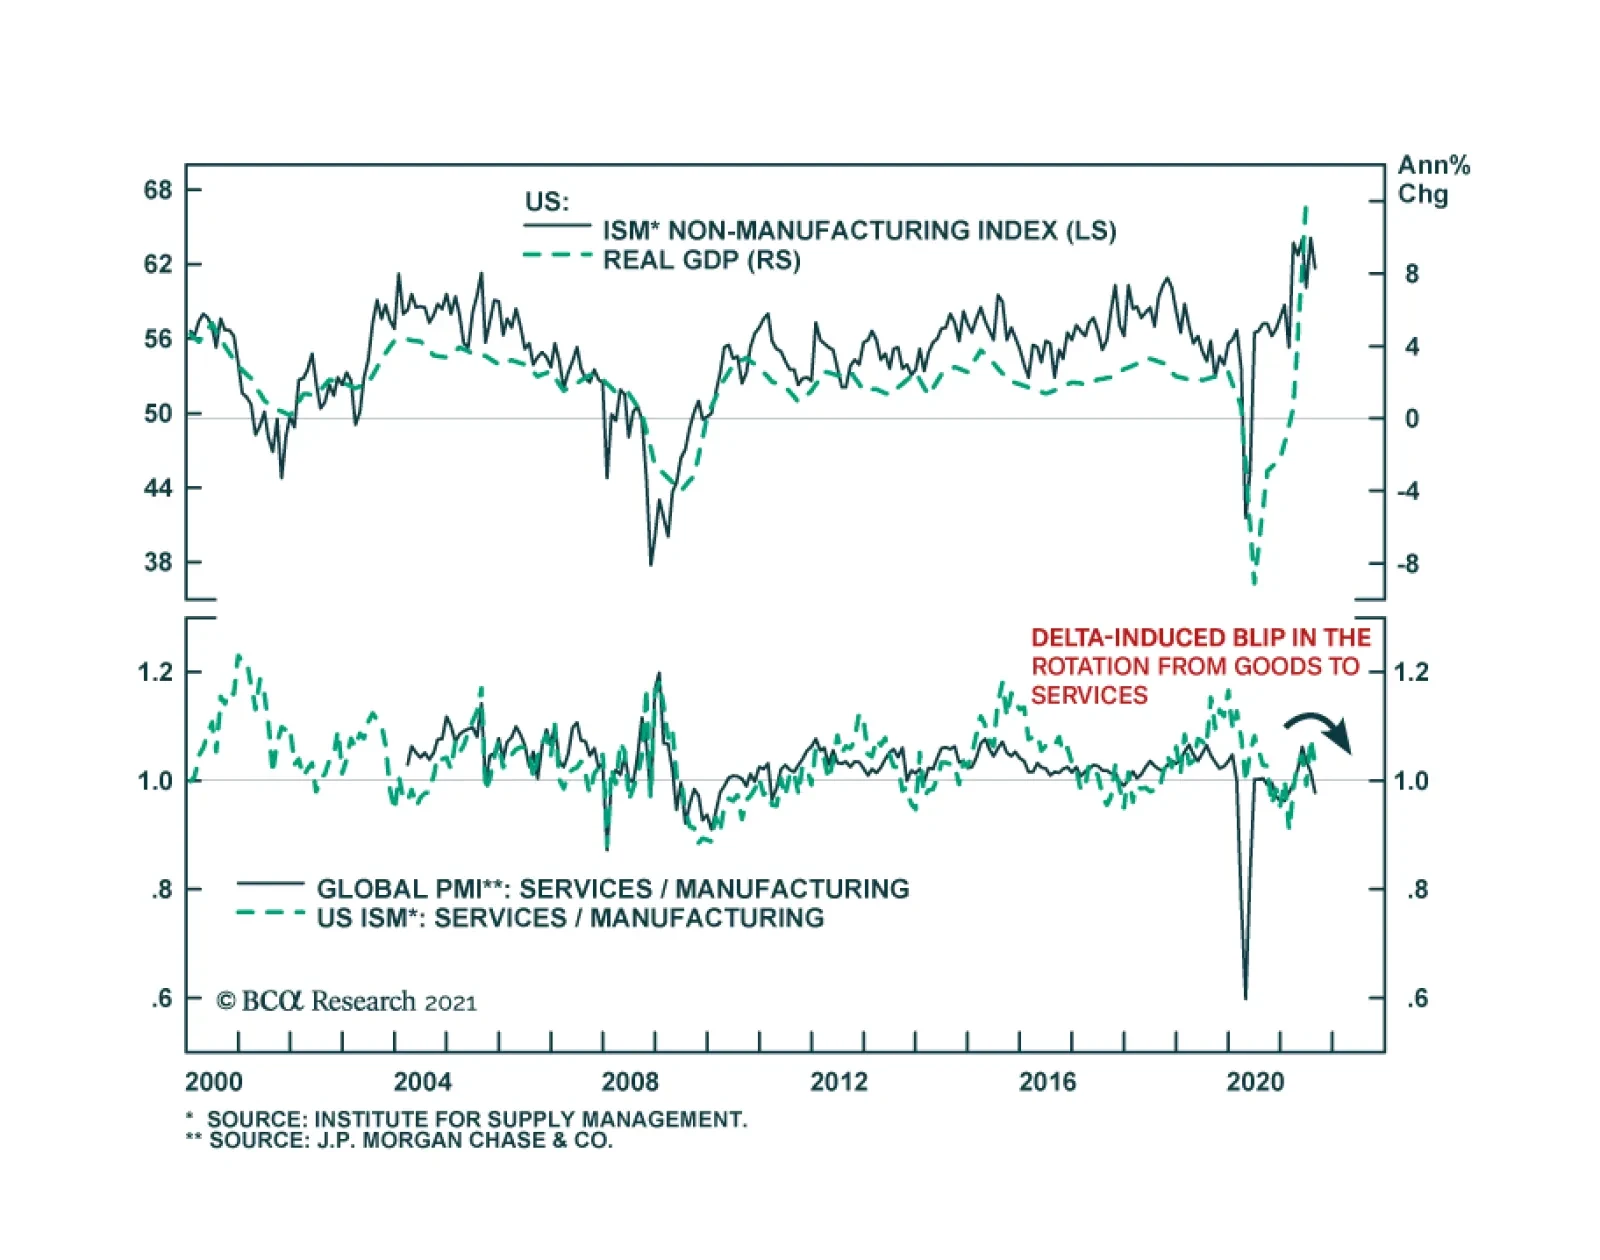
The US Services ISM eased 2.4 percentage points to 61.7 in August, broadly in line with expectations. The survey's production, prices, and new export orders series all eased sharply but remain above 60. Commentary in the report reveals that final demand is…
Highlights An Iran crisis is imminent. We still think a US-Iran détente is possible but our conviction is lower until Biden makes a successful show of force. Oil prices will be volatile. Fiscal drag is a risk to the cyclical global macro view. But developed markets are more fiscally proactive than they were after the global financial crisis. Elections will reinforce that, starting in Germany, Canada, and Japan. The Chinese and Russian spheres are still brimming with political and geopolitical risk. But China will ease monetary and fiscal policy on the margin over the coming 12 months. Afghanistan will not upset our outlook on the German and French elections, which is positive for the euro and European stocks. Feature Chart 1Bull Market In Iran Tensions
Biden's Show Of Force (GeoRisk Update)
Biden's Show Of Force (GeoRisk Update)
Iran is now the most pressing geopolitical risk in the short term (Chart 1). The Biden administration has been chastened by the messy withdrawal from Afghanistan and will be exceedingly reactive if it is provoked by foreign powers. Nuclear weapons improve regime survivability. Survival is what the Islamic Republic wants. Iran is surrounded by enemies in its region and under constant pressure from the United States. Hence Iran will never ultimately give up its nuclear program, as we have maintained. Chart 2Biden Unlikely To Lift Iran Sanctions Unilaterally
Biden's Show Of Force (GeoRisk Update)
Biden's Show Of Force (GeoRisk Update)
However, Supreme Leader Ali Khamenei could still agree to a deal in which the US reduces economic sanctions while Iran allows some restrictions on uranium enrichment for a limited period of time (the 2015 nuclear deal’s key provisions expire from 2023 through 2030). This would be a stopgap measure to delay the march into war. The problem is that rejoining the 2015 deal requires the US to ease sanctions first, since the US walked away from the deal in 2018. Iran would need domestic political cover to rejoin it. Biden has the executive authority to ease sanctions unilaterally but after Afghanistan he lacks the political capital to do so (Chart 2). So Biden cannot ease sanctions until Iran pares back its nuclear activities. But Iran has no reason to pare back if the US does not ease sanctions. Iran is now enriching some uranium to a purity of 60%. Israeli Defense Minister Benny Gantz says it will reach “nuclear breakout” capability – enough fissile material to build a bomb – within 10 weeks, i.e. mid-October. Anonymous officials from the Biden administration told the Associated Press it will be “months or less,” which could mean September, October, or November (Table 1). Table 1Iran Nearing "Breakout" Nuclear Capability
Biden's Show Of Force (GeoRisk Update)
Biden's Show Of Force (GeoRisk Update)
Meanwhile the new Iranian government of President Ebrahim Raisi, a hardliner who is tipped to take over as Supreme Leader once Ali Khamenei steps down, is implying that it will not rejoin negotiations until November. All of these timelines are blurry but the implication is that Iran will not resume talks until it has achieved nuclear breakout. Israel will continue its campaign of sabotage against the regime. It may be pressed to the point of launching air strikes, as it did against nuclear facilities in Iraq in 1981 and Syria in 2007 under what is known as the “Begin Doctrine.” Chart 3Israel Cannot Risk Losing US Security Guarantee
Biden's Show Of Force (GeoRisk Update)
Biden's Show Of Force (GeoRisk Update)
The constraint on Israel is that it cannot afford to lose America’s public support and defense alliance since it would find itself isolated and vulnerable in its region (Chart 3). But if Israeli intelligence concludes that the Iranians truly stand on the verge of achieving a deliverable nuclear weapon, the country will likely be driven to launch air strikes. Once the Iranians test and display a viable nuclear deterrent it will be too late. Four US presidents, including Biden, have declared that Iran will not be allowed to get nuclear weapons. Biden and the Democrats favor diplomacy, as Biden made clear in his bilateral summit with Israeli Prime Minister Naftali Bennett last week. But Biden also admitted that if diplomacy fails there are “other options.” The Israelis currently have a weak government but it is unified against a nuclear-armed Iran. At very least Bennett will underscore red lines to indicate that Israel’s vigilance has not declined despite hawkish Benjamin Netanyahu’s fall from power. Still, Iran may decide it has an historic opportunity to make a dash for the bomb if it thinks that the US will fail to support an Israeli attack. The US has lost leverage in negotiations since 2015. It no longer has troops stationed on Iran’s east and west flanks. It no longer has the same degree of Chinese and Russian cooperation. It is even more internally divided. Iran has no guarantee that the US will not undergo another paroxysm of nationalism in 2024 and try to attack it. The faction that opposed the deal all along is now in power and may believe it has the best chance in its lifetime to achieve nuclear breakout. The only reason a short-term deal is possible is because Khamenei may believe the Israelis will attack with full American support. He agreed to the 2015 deal. He also fears that the combination of economic sanctions and simmering social unrest will create a rift when he dies or passes the leadership to his successor. Iran has survived the Trump administration’s “maximum pressure” sanctions but it is still vulnerable (Chart 4). Chart 4Supreme Leader Focuses On Regime Survival
Supreme Leader Focuses On Regime Survival
Supreme Leader Focuses On Regime Survival
Moreover Biden is offering Khamenei a deal that does not require abandoning the nuclear program and does not prevent Iran from enhancing its missile capabilities. By taking the deal he might prevent his enemies from unifying, forestall immediate war, and pave the way for a smooth succession, while still pursuing the ultimate goal of nuclear weaponization. Bringing it all together, the world today stands at a critical juncture with regard to Iran and the unfinished business of the US wars in the Middle East. Unless the US and Israel stage a unified and convincing show of force, whether preemptively or in response to Iranian provocations, the Iranians will be justified in concluding that they have a once-in-a-generation opportunity to pursue the bomb. They could sneak past the global powers and obtain a nuclear deterrent and regime security, like North Korea did. This could easily precipitate a war. Biden will probably continue to be reactive rather than proactive. If the Iranians are silent then it will be clear that Khamenei still sees the value in a short-term deal. But if they continue their march toward nuclear breakout, as is the case as we go to press, then Biden will have to make a massive show of force. The goal would be to underscore the US’s red lines and drive Iran back to negotiating table. If Biden blinks, he will incentivize Iran to make a dash for the bomb. Either way a crisis is imminent. Israel will continue to use sabotage and underscore red lines while the Iranians will continue to escalate their attacks on Israel via militant proxies and attacks on tankers (Map 1). Map 1Secret War Escalates In Middle East
Biden's Show Of Force (GeoRisk Update)
Biden's Show Of Force (GeoRisk Update)
Bottom Line: After a crisis, either diplomacy will be restored, or the Middle East will be on a new war path. The war path points to a drastically different geopolitical backdrop for the global economy. If the US and Iran strike a short-term deal, Iranian oil will flow and the US will shift its strategic focus to pressuring China, which is negative for global growth and positive for the dollar. If the US and Iran start down the war path, oil supply disruptions will rise and the dollar will fall. Implications For Oil Prices And OPEC 2.0 The probability of a near-term conflict is clear from our decision tree, which remains the same as in June 2019 (Diagram 1). Diagram 1US-Iran Conflict: Critical Juncture In Our Decision Tree
Biden's Show Of Force (GeoRisk Update)
Biden's Show Of Force (GeoRisk Update)
Shows of force and an escalation in the secret war will cause temporary but possibly sharp spikes in oil prices in the short term. OPEC 2.0 remains intact so far this year, as expected. The likelihood that the global economic recovery will continue should encourage the Saudis, Russians, Emiratis and others to maintain production discipline to drain inventories and keep Brent crude prices above $60 per barrel. OPEC 2.0 is a weak link in oil prices, however, because Russians are less oil-dependent than the Gulf Arab states and do not need as high of oil prices for their government budget to break even (Chart 5). Periodically this dynamic leads the cartel to break down. None of the petro-states want to push oil prices up so high that they hasten the global green energy transition. Chart 5OPEC 2.0 Keeps Price Within Fiscal Breakeven Oil Price
Biden's Show Of Force (GeoRisk Update)
Biden's Show Of Force (GeoRisk Update)
Chart 6Oil Price Risks Lie To Upside Until US-Iran Deal Occurs
Oil Price Risks Lie To Upside Until US-Iran Deal Occurs
Oil Price Risks Lie To Upside Until US-Iran Deal Occurs
As long as OPEC 2.0 remains disciplined, average Brent crude oil prices will gradually rise to $80 barrels per day by the end of 2024, according to our Commodity & Energy Strategy (Chart 6). Imminent firefights will cause prices to spike at least temporarily when large amounts of capacity are taken offline. Global spare capacity is probably sufficient to handle one-off disruptions but an open-ended military conflict in the Persian Gulf or Strait of Hormuz would be a different story. After the next crisis, everything depends on whether the US and Israel establish a credible threat and thus restore diplomacy. Any US-Iran strategic détente would unleash Iranian production and could well motivate the Gulf Arabs to pump more oil and deny Iran market share. Bottom Line: Given that any US-Iran deal would also be short-term in nature, and may not even stabilize the region, some of the downside risks are fading at the moment. The US and China are also sucking in more commodities as they gear up for great power struggle. The geopolitical outlook is positive for oil prices in these respects. But OPEC 2.0 is the weak link in this expectation so we expect volatility. Global Fiscal Taps Will Stay Open Markets have wavered in recent months over softness in the global economic recovery, COVID-19 variants, and China’s policy tightening. The world faces a substantial fiscal drag in the coming years as government budgets correct from the giant deficits witnessed during the crisis. Nevertheless policymakers are still able to deliver some positive fiscal surprises on the margin. Developed markets have turned fiscally proactive over the past decade. They rejected austerity because it was seen as fueling populist political outcomes that threatened the established parties. Note that this change began with conservative governments (e.g. Japan, UK, US, Germany), implying that left-leaning governments will open the fiscal taps further whenever they come to power (e.g. Canada, the US, Italy, and likely Germany next). Chart 7Global Fiscal Taps Will Stay Open
Biden's Show Of Force (GeoRisk Update)
Biden's Show Of Force (GeoRisk Update)
Chart 7 updates the pandemic-era fiscal stimulus of major economies, with light-shaded bars highlighting new fiscal measures that are in development but have not yet been included in the IMF’s data set. The US remains at the top followed by Italy, which also saw populist electoral outcomes over the past decade. Chart 8US Fiscal Taps Open At Least Until 2023
US Fiscal Taps Open At Least Until 2023
US Fiscal Taps Open At Least Until 2023
The Biden administration is on the verge of passing a $550 billion bipartisan infrastructure bill. We maintain 80% subjective odds of passage – despite the messy pullout from Afghanistan. Assuming it passes, Democrats will proceed to their $3.5 trillion social welfare bill. This bill will inevitably be watered down – we expect a net deficit impact of around $1-$1.5 trillion for both bills – but it can pass via the partisan “budget reconciliation” process. We give 50% subjective odds today but will upgrade to 65% after infrastructure passes. The need to suspend the debt ceiling will raise volatility this fall but ultimately neither party has an interest in a national debt default. The US is expanding social spending even as geopolitical challenges prevent it from cutting defense spending, which might otherwise be expected after Afghanistan and Iraq. The US budget balance will contract after the crisis but then it will remain elevated, having taken a permanent step up as a result of populism. The impact should be a flat or falling dollar on a cyclical basis, even though we think geopolitical conflict will sustain the dollar as the leading reserve currency over the long run (Chart 8). So the dollar view remains neutral for now. Bottom Line: The US is facing a 5.9% contraction in the budget deficit in 2022 but the blow will be cushioned somewhat by two large spending bills, which will put budget deficits on a rising trajectory over the course of the decade. Big government is back. Developed Market Fiscal Moves (Outside The US) Chart 9German Opinion Favors New Left-Wing Coalition
Biden's Show Of Force (GeoRisk Update)
Biden's Show Of Force (GeoRisk Update)
Fiscal drag is also a risk for other developed markets – but here too a substantial shift away from prudence has taken place, which is likely to be signaled to investors by the outperformance of left-wing parties in Germany’s upcoming election. Germany is only scheduled to add EUR 2.4 billion to the 25.6 billion it will receive under the EU’s pandemic recovery fund, but Berlin is likely to bring positive fiscal surprises due to the federal election on September 26. Germany will likely see a left-wing coalition replace Chancellor Angela Merkel and her long-ruling Christian Democrats (Chart 9). The platforms of the different parties can be viewed in Table 2. Our GeoRisk Indicator for Germany confirms that political risk is elevated but in this case the risk brings upside to risk assets (Appendix). Table 2German Party Platforms
Biden's Show Of Force (GeoRisk Update)
Biden's Show Of Force (GeoRisk Update)
While we expected the Greens to perform better than they are in current polling, the point is the high probability of a shift to a new left-wing government. The Social Democrats are reviving under the leadership of Olaf Scholz (Chart 10). Tellingly, Scholz led the charge for Germany to loosen its fiscal belt back in 2019, prior to the global pandemic. Chart 10Germany: Online Markets Betting On Scholz
Biden's Show Of Force (GeoRisk Update)
Biden's Show Of Force (GeoRisk Update)
Chart 11Canada: Trudeau Takes A Calculated Risk
Biden's Show Of Force (GeoRisk Update)
Biden's Show Of Force (GeoRisk Update)
In June, the cabinet approved a draft 2022 budget plan supported by Scholz that would contain new borrowing worth EUR 99.7 bn ($119 billion). This amount is not included in the chart above but it should be seen as the minimum to be passed under the new government. If a left-wing coalition is formed, as we expect, the amount will be larger, given that both the Social Democrats and the Greens have been restrained by Merkel’s party. Canada turned fiscally proactive in 2015, when the institutional ruling party, the Liberals, outflanked the more progressive New Democrats by calling for budget deficits instead of a balanced budget. The Liberals saw a drop in support in 2019 but are now calling a snap election. Prime Minister Trudeau is not as popular in general opinion as he is in the news media but his party still leads the polls (Chart 11). The Conservatives are geographically isolated and, more importantly, are out of step with the median voter on the key issues (Table 3). Table 3Canada: Liberal Agenda Lines Up With Top Voter Priorities
Biden's Show Of Force (GeoRisk Update)
Biden's Show Of Force (GeoRisk Update)
Nevertheless it is a risky time to call an election – our GeoRisk Indicator for Canada is soaring (Appendix). Granting that the Liberals are very unlikely to fall from power, whatever their strength in parliament, the key point is that parliament already approved of CAD 100 billion in new spending over the coming three years. Any upside surprise would give Trudeau the ability to push for still more deficit spending, likely focused on climate change. Chart 12Japan: Suga Will Go, LDP Will Stimulate
Japan: Suga Will Go, LDP Will Stimulate
Japan: Suga Will Go, LDP Will Stimulate
Japanese politics are heating up ahead of the Liberal Democrats’ leadership election on September 29 and the general election, due by November 28. Prime Minister Yoshihide Suga’s sole purpose in life was to stand in for Shinzo Abe in overseeing the Tokyo Olympics. Now they are done and Suga will likely be axed – if he somehow survives the election, he will not last long after, as his approval rating is in freefall. The Liberal Democrats are still the only game in town. They will try to minimize the downside risks they face in the general election by passing a new stimulus package (Chart 12). Rumor has it that the new package will nominally be worth JPY 10-15 trillion, though we expect the party to go bigger, and LDP heavyweight Toshihiro Nikai has proposed a 30 trillion headline number. It is extremely unlikely that the election will cause a hung parliament or any political shift that jeopardizes passage of the bill. Abenomics remains the policy setting – and consumption tax hikes are no longer on the horizon to impede the second arrow of Abenomics: fiscal policy. Not all countries are projecting new spending. A stronger-than-expected showing by the Christian Democrats would result in gridlock in Germany. Meanwhile the UK may signal belt-tightening in October. Bottom Line: Germany, Canada, and Japan are likely to take some of the edge off of expected fiscal drag next year. Emerging Market Fiscal Moves (And China Regulatory Update) Among the emerging markets, Russia and China are notable in Chart 7 above for having such a small fiscal stimulus during this crisis. Russia has announced some fiscal measures ahead of the September 19 Duma election but they are small: $5.2 billion in social spending, $10 billion in strategic goals over three years, and a possible $6.8 billion increase in payments to pensioners. Fiscal austerity in Russia is one reason we expect domestic political risk to remain elevated and hence for President Putin to stoke conflicts in his near abroad (see our Russian risk indicator in the Appendix). There are plenty of signs that Belarussian tensions with the Baltic states and Poland can escalate in the near term, as can fighting in Ukraine in the wake of Biden’s new defense agreement and second package of military aid. China’s actual stimulus was much larger than shown in Chart 7 above because it mostly consisted of a surge in state-controlled bank lending. China is likely to ease monetary and fiscal policy on the margin over the coming 12 months to secure the recovery in time for the national party congress in 2022. But China’s regulatory crackdown will continue during that time and our GeoRisk Indicator clearly shows the uptick in risk this year (Appendix). Chart 13China Expands Unionization?
China Expands Unionization?
China Expands Unionization?
The regulatory crackdown is part of a cyclical consolidation of Xi Jinping’s power as well as a broader, secular trend of reasserting Communist Party and centralization in China. The latest developments underscore our view that investors should not play any technical rebound in Chinese equities. The increase in censorship of financial media is especially troubling. Just as the government struggles to deal with systemic financial problems (e.g. the failing property giant Evergrande, a possible “Lehman moment”), the lack of transparency and information asymmetry will get worse. The media is focusing on the government’s interventions into public morality, setting a “correct beauty standard” for entertainers and limiting kids to three hours of video games per week. But for investors what matters is that the regulatory crackdown is proceeding to the medical sector. High health costs (like high housing and education costs) are another target of the Xi administration in trying to increase popular support and legitimacy. Central government-mandated unionization in tech companies will hurt the tech sector without promoting social stability. Chinese unions do not operate like those in the West and are unlikely ever to do so. If they did, it would compound the preexisting structural problem of rising wages (Chart 13). Wages are forcing an economic transition onto Beijing, which raises systemic risks permanently across all sectors. Bottom Line: Political and geopolitical risk are still elevated in China and Russia. China will ease monetary and fiscal policy gradually over the coming year but the regulatory crackdown will persist at least until the 2022 political reshuffle. Afghanistan: The Refugee Fallout September 2021 will officially mark the beginning of Taliban’s second bout of power in Afghanistan. Will Afghanistan be the only country to spawn an outflux of refugees? Will the Taliban wresting power in Afghanistan trigger another refugee crisis for Europe? How is the rise of the Taliban likely to affect geopolitics in South Asia? Will Afghanistan Be The Last Major Country To Spawn Refugees? Absolutely not. We expect regime failures to affect the global economy over the next few years. The global growth engine functions asymmetrically and is powered only by a fistful of countries. As economic growth in poor countries fails to keep pace with that of top performers, institutional turmoil is bound to follow. This trend will only add to the growing problem of refugees that the world has seen in the post-WWII era. History suggests that the number of refugees in the world at any point in time is a function of economic prosperity (or the lack thereof) in poorer continents (Chart 14). For instance, the periods spanning 1980-90 and 2015-20 saw the world’s poorer continents lose their share in global GDP. Unsurprisingly these phases also saw a marked increase in the number of refugees. With the world’s poorer continents expected to lose share in global GDP again going forward, the number of refugees in the world will only rise. Chart 14Refugee Flows Rise When Growth Weak In Poor Continents
Biden's Show Of Force (GeoRisk Update)
Biden's Show Of Force (GeoRisk Update)
Citizens of Syria, Venezuela, Afghanistan, South Sudan, and Myanmar today account for two-thirds of all refugees globally. To start with, these five countries’ share in global GDP was low at 0.8% in the 1980s. Now their share in global GDP is set to fall to 0.2% over the next five years (Chart 15). Chart 15Refugee Exporters Hit All-Time Low In Global GDP Share
Biden's Show Of Force (GeoRisk Update)
Biden's Show Of Force (GeoRisk Update)
Per capita incomes in top refugee source countries tend to be very low. Whilst regime fractures appear to be the proximate cause of refugee outflux, an economic collapse is probably the root cause of the civil strife and waves of refugee movement seen out of the top refugee source countries. Another factor that could have a bearing is the rise of multipolarity. Shifting power structures in the global economy affect the stability of regimes with weak institutions. Instability in Afghanistan has been a direct result of the rise and the fall of the British and Russian empires. American imperial overreach is just the latest episode. If another Middle Eastern war erupts, the implications are obvious. But so too are the implications of US-China proxy wars in Southeast Asia or Russia-West proxy wars in eastern Europe. Bottom Line: With poorer continents’ economic prospects likely to remain weak and with multipolarity here to stay, the world’s refugee problem is here to stay too. Is A Repeat Of 2015 Refugee Crisis Likely In 2021? No. 2021 will not be a replica of 2015. This is owing to two key reasons. First, Afghanistan has long witnessed a steady outflow of refugees – especially at the end of the twentieth century but also throughout the US’s 20-year war there. The magnitude of the refugee problem in 2021 will be significantly smaller than that in 2015. Secondly, voters are now differentiating between immigrants and refugees with the latter entity gaining greater acceptance (Chart 16). Chart 16DM Attitudes Permissive Toward Refugees
Biden's Show Of Force (GeoRisk Update)
Biden's Show Of Force (GeoRisk Update)
Chart 17Refugees Will Not Change Game In German/French Elections
Biden's Show Of Force (GeoRisk Update)
Biden's Show Of Force (GeoRisk Update)
Concerns about refugees will gain some political traction but it will reinforce rather than upset the current trajectory in the most important upcoming elections, in Germany in September and France next April. True, these countries feature in the list of top countries to which Afghan refugees flee and will see some political backlash (Chart 17). But the outcome may be counterintuitive. In the German election, any boost to the far-right will underscore the likely underperformance of the ruling Christian Democrats. So the German elections will produce a left-wing surprise – and yet, even if the Greens won the chancellorship (the true surprise scenario, looking much less likely now), investors will cheer the pro-Europe and pro-fiscal result. The French election is overcrowded with right-wing candidates, both center-right and far-right, giving President Macron the ability to pivot to the left to reinforce his incumbent advantage next spring. Again, the euro and the equity market will rise on the status quo despite the political risk shown in our indicator (Appendix). Of course, immigration and refugees will cause shocks to European politics in future, especially as more regime failures in the third world take place to add to Afghanistan and Ethiopia. But in the short run they are likely to reinforce the fact that European politics are an oasis of stability given what is happening in the US, China, Brazil, and even Russia and India. Bottom Line: 2021 will not see a repeat of the 2015 refugee crisis. Ironically Afghan refugees could reinforce European integration in both German and French elections. The magnitude of the Afghan crisis is smaller than in the past and most Afghan refugees are likely to migrate to Pakistan and Iran (Chart 17). But more regime failures will ensure that the flow of people becomes a political risk again sometime in the future. What Does The Rise Of Taliban Mean For India? The Taliban first held power in Afghanistan from 1996-2001. This was one of the most fraught geopolitical periods in South Asia since the 1970s. Now optimists argue that Taliban 2.0 is different. Taliban leaders are engaging in discussions with an ex-president who was backed by America and making positive overtures towards India. So, will this time be different? It is worth noting that Taliban 2.0 will have to function within two major constraints. First, Afghanistan is deeply divided and diverse. Afghanistan’s national anthem refers to fourteen ethnic groups. Running a stable government is inherently challenging in this mountainous country. With Taliban being dominated by one ethnic group and with limited financial resources at hand, the Taliban will continue to use brute force to keep competing political groups at bay. Chart 18Taliban In Line With Afghanis On Sharia
Biden's Show Of Force (GeoRisk Update)
Biden's Show Of Force (GeoRisk Update)
At the same time, to maintain legitimacy and power, the Taliban will have to support aligned political groups operating in Afghanistan and neighboring Pakistan. Second, an overwhelming majority of Afghani citizens want Sharia law, i.e. a legal code based on Islamic scripture as the official law of the land (Chart 18). Hence if the Taliban enforces a Sharia-based legal system in Afghanistan then it will fall in line with what the broader population demands. It is against this backdrop that Taliban 2.0 is bound to have several similarities with the version that ruled from 1996-2001. Additionally, US withdrawal from Afghanistan will revive a range of latent terrorist movements in the region. This poses risks for outside countries, not least India, which has a long history of being targeted by Afghani terrorist groups. The US will remain engaged in counter-terrorism operations. To complicate matters, India’s North has an even more unfavorable view of Pakistan than the rest of India. With the northern voter’s importance rising, India’s administration may be forced to respond more aggressively to a terrorist event than would have been the case about a decade ago. It is also possible that terrorism will strike at China over time given its treatment of Uighur Muslims in Xinjiang. China’s economic footprint in Afghanistan could precipitate such a shift. Bottom Line: US withdrawal from Afghanistan is bound to add to geopolitical risks as latent terrorist forces will be activated. India has a long history of being targeted by Afghani terrorist movements. Incidentally, it will take time for transnational terrorism based in Afghanistan to mount successful attacks at the West once again, given that western intelligence services are more aware of the problem than they were in 2000. But non-state actors may regain the element of surprise over time, given that the western powers are increasingly focused on state-to-state struggle in a new era of great power competition. Matt Gertken Vice President Geopolitical Strategy mattg@bcaresearch.com Ritika Mankar, CFA Editor/Strategist ritika.mankar@bcaresearch.com Section II: GeoRisk Indicator China
China: GeoRisk Indicator
China: GeoRisk Indicator
Russia
Russia: GeoRisk Indicator
Russia: GeoRisk Indicator
United Kingdom
UK: GeoRisk Indicator
UK: GeoRisk Indicator
Germany
Germany: GeoRisk Indicator
Germany: GeoRisk Indicator
France
France: GeoRisk Indicator
France: GeoRisk Indicator
Italy
Italy: GeoRisk Indicator
Italy: GeoRisk Indicator
Canada
Canada: GeoRisk Indicator
Canada: GeoRisk Indicator
Spain
Spain: GeoRisk Indicator
Spain: GeoRisk Indicator
Taiwan
Taiwan: GeoRisk Indicator
Taiwan: GeoRisk Indicator
Korea
Korea: GeoRisk Indicator
Korea: GeoRisk Indicator
Turkey
Turkey: GeoRisk Indicator
Turkey: GeoRisk Indicator
Brazil
Brazil: GeoRisk Indicator
Brazil: GeoRisk Indicator
Australia
Australia: GeoRisk Indicator
Australia: GeoRisk Indicator
Section III: Geopolitical Calendar
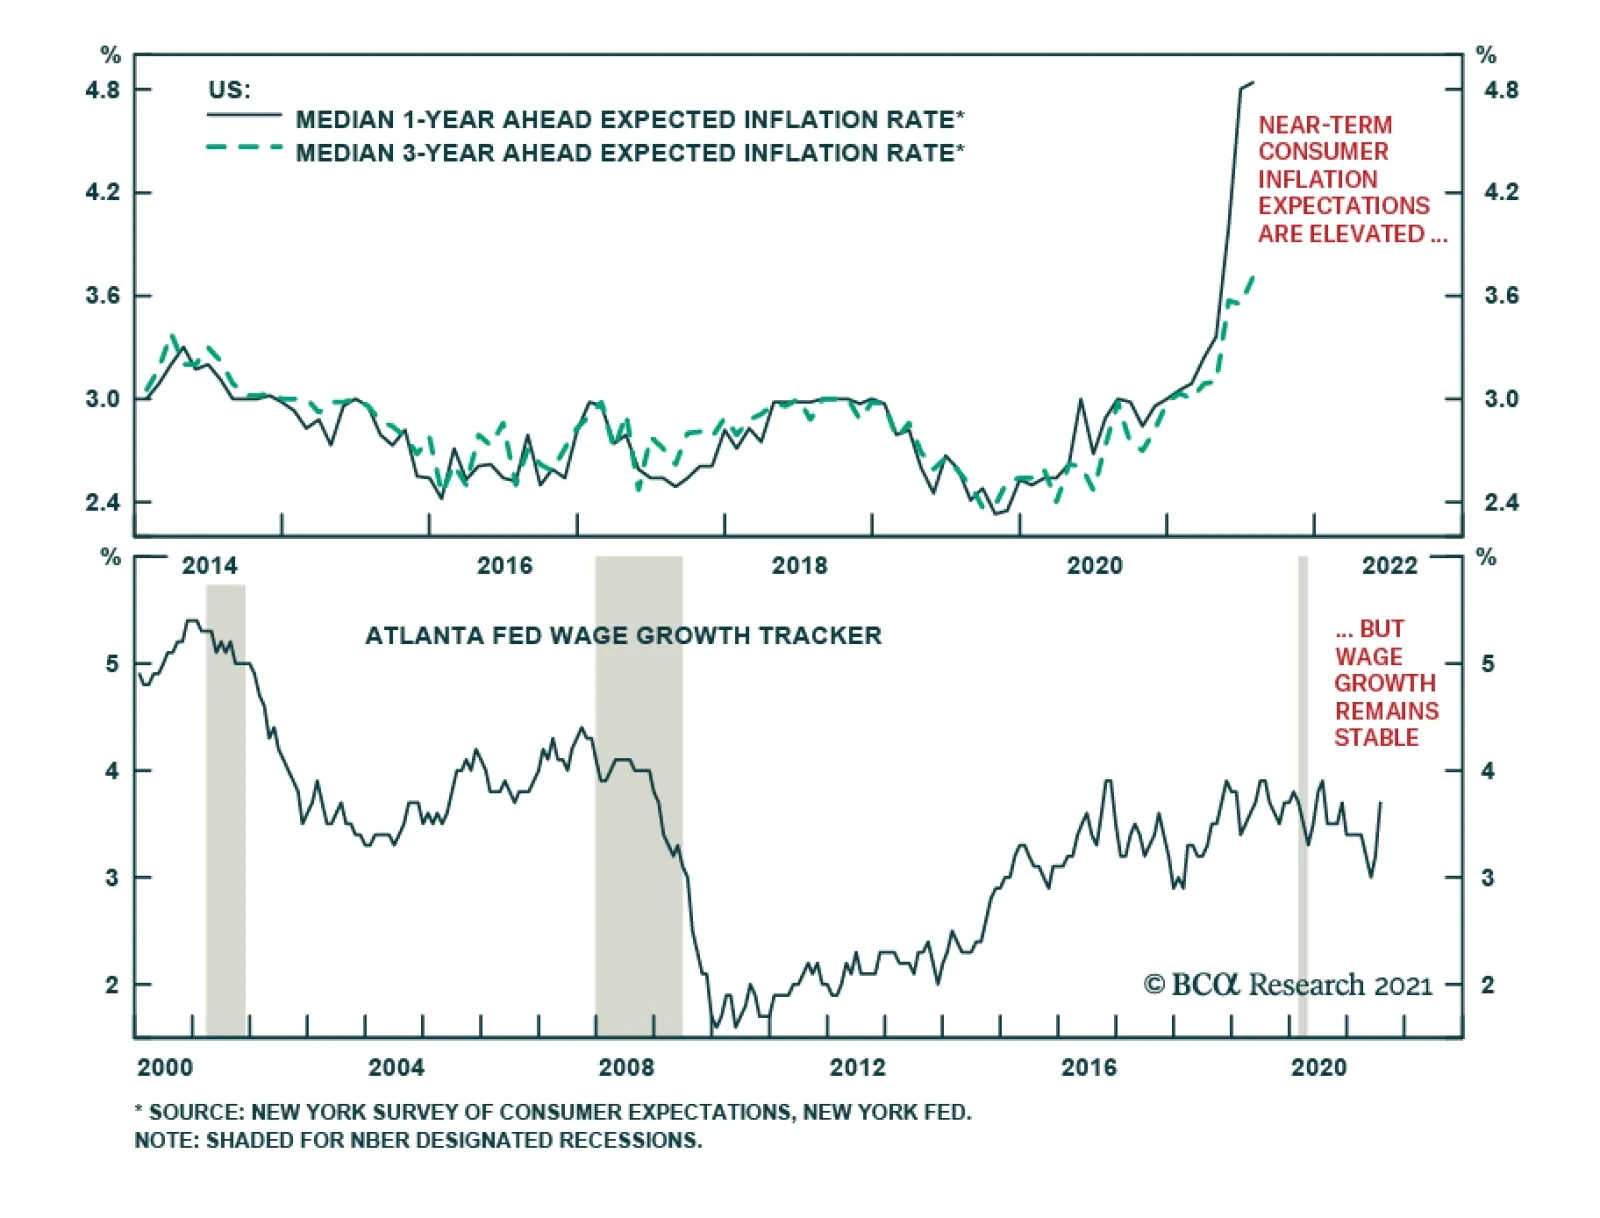
Upside surprises to European consumer and producer prices (see The Numbers) reveal that inflationary pressures - initially a US phenomenon - are now broadening. Two forces are to blame for rising prices. First, fresh COVID-19 outbreaks are weighing…
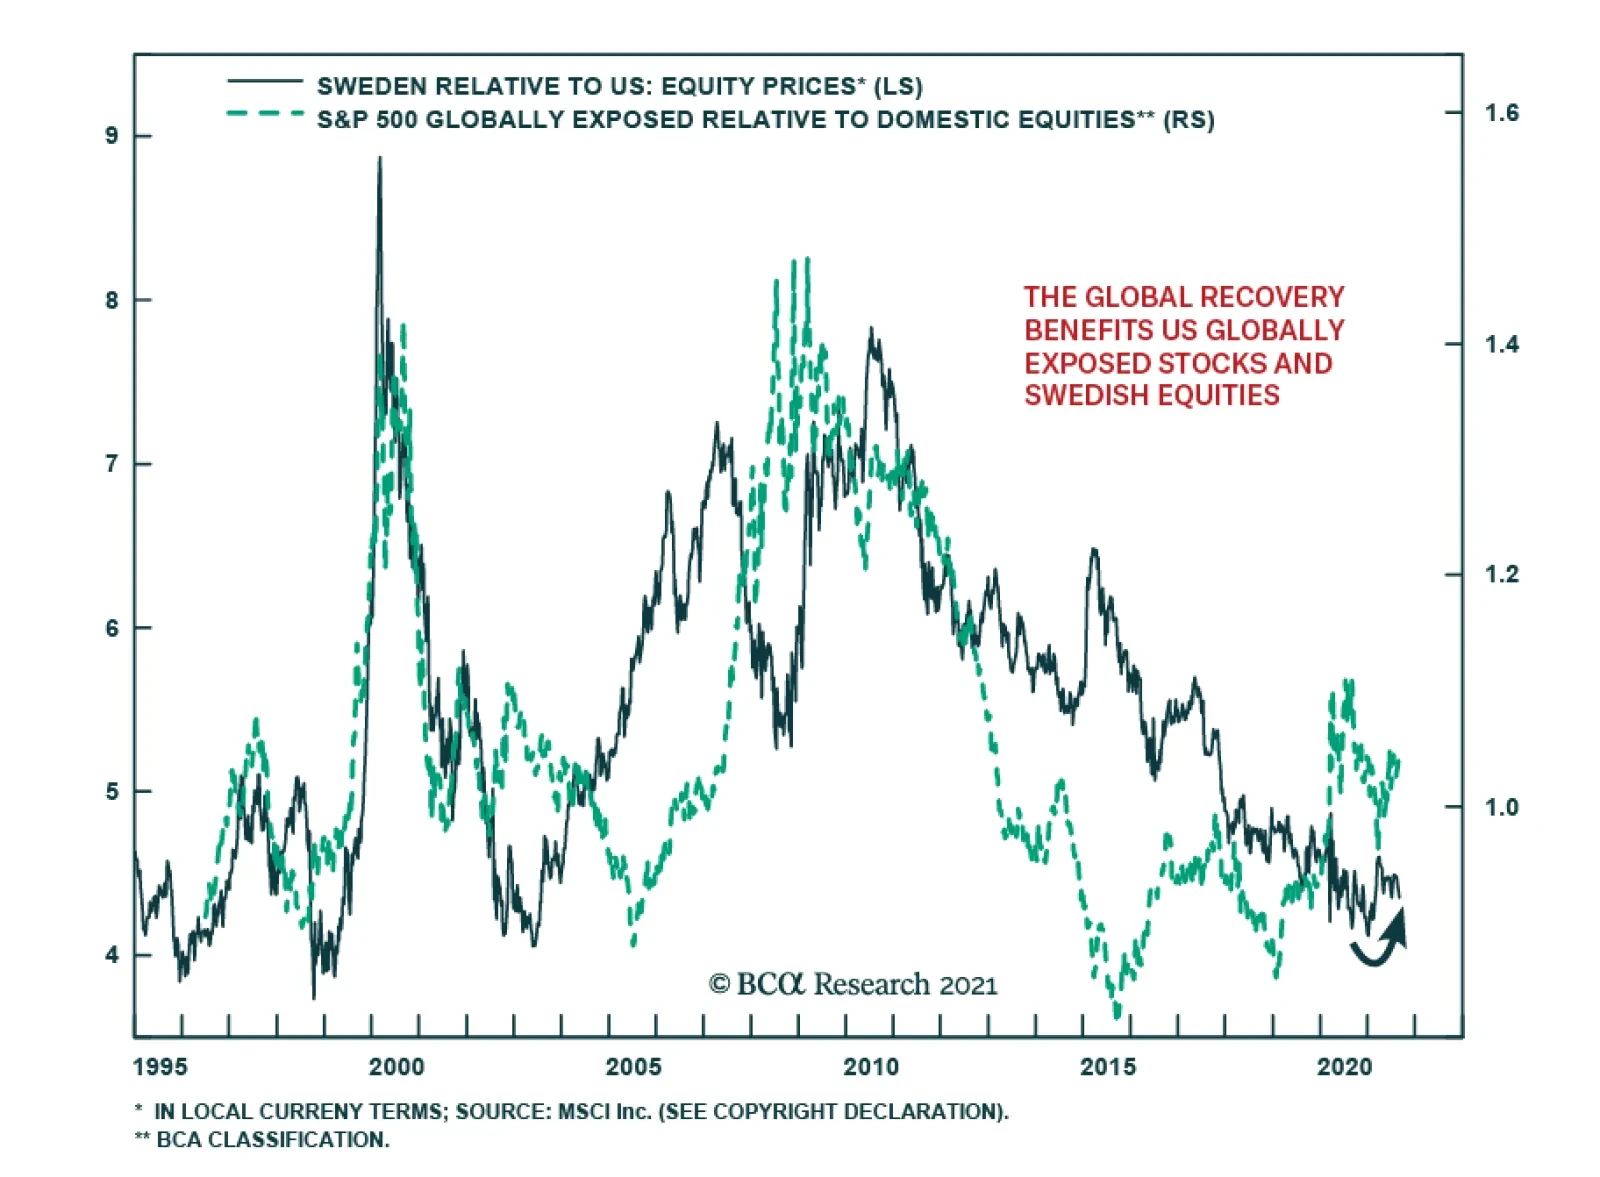
The US is leading the world in the post-pandemic economic recovery. US real GDP grew at an annualized quarter-on-quarter rate of 6.3% in Q1 while other major economies such as the eurozone and Japanese ones contracted. This growth differential has since…