United States

Highlights The US government issued its first-ever water-shortage declaration for the Colorado River basin in August, due to historically low water levels at the major reservoirs fed by the river (Chart of the Week). The drought producing the water shortage was connected to climate change by US officials.1 Globally, climate-change remediation efforts – e.g., carbon taxes – likely will create exogenous shocks similar to the oil-price shock of the 1970s. Remedial efforts will compete with redressing chronic underfunding of infrastructure. The US water supply infrastructure, for example, faces an investment shortfall of ~ $3.3 trillion over the next 20 years to replace aging plants and equipment, based on an analysis by the American Society of Civil Engineers (ASCE). This will translate to a $6,000 per-capita cost by 2039 if the current funding gap persists. Fluctuating weather and the increasing prevalence of droughts and floods will increase volatility in markets such as agriculture which rely on stable climate and precipitation patterns.We are getting long the FIW ETF at tonight's close. The ETF tracks the performance of equities in the ISE Clean Edge Water Index, which covers firms providing potable water and wastewater treatment technologies and services. This is a strategic recommendation. Feature A decades-long drought in the US Southwest linked by US officials to climate change will result in further water rationing in the region. The drought has reduced total Colorado River system water-storage levels to 40% of capacity – vs. 49% at the same time last year. It has drawn attention to the impact of climate change on daily life, and the acute need for remediation efforts. The US Southwest is a desert. Droughts and low water availability are facts of life in the region. The current drought began in 2012, and is forcing federal, state, and local governments to take unprecedented conservation measures. The first-ever water-shortage declaration by the US Bureau of Reclamation sets in motion remedial measures that will reduce water availability in the Lower Colorado basin starting in October (Map 1). Chart 1Drought Hits Colorado River Especially Hard
Drought Hits Colorado River Especially Hard
Drought Hits Colorado River Especially Hard
Map 1Colorado River Basin
Investing In Water Supply
Investing In Water Supply
The two largest reservoirs in the US – Lake Powell and Lake Meade, part of the massive engineering projects along the Colorado – began in the 1930s and now supply water to 40mm people in the US Southwest. Half of those people get their water from Lake Powell. Emergency rationing began in August, primarily affecting Arizona, but will be extended to the region later in the year. Lake Powell is used to hold run-off from the upper basin of the Colorado River from Colorado, New Mexico, Utah and Wyoming. Water from Powell is sent south to supply the lower-basin states of California, Arizona, and Nevada. Reduced snowpack due to weather shifts caused by climate change has reduced water levels in Powell, while falling soil-moisture levels and higher evaporation rates, contribute to the acceleration of droughts and their persistence down-river. Chart 2Southwests Exceptionally Hard Drought
Southwests Exceptionally Hard Drought
Southwests Exceptionally Hard Drought
Steadily increasing demand for water from agriculture, energy production and human activity brought on by population growth and holiday-makers have made the current drought exceptional (Chart 2). Most of the Southwest has been "abnormally dry or even drier" during 2002-05 and from 2012-20, according to the US EPA. According to data from the National Oceanic and Atmospheric Administration, most of the US Southwest was also warmer than the 1981 – 2010 average temperature during July (Map 2). The Colorado River Compact of 1922 governing the water-sharing rights of the river expires in 2026. Negotiations on the new treaties already have begun, as the seven states in the Colorado basin sort out their rights alongside huge agricultural interest, native American tribes, Mexico, and fast-growing urban centers like Las Vegas. Map 2Most Of The US Southwest Is Warmer Than Average
Investing In Water Supply
Investing In Water Supply
Global Water Emergency States around the globe are dealing with water crises as a result of climate change. "From Yemen to India, and parts of Central America to the African Sahel, about a quarter of the world's people face extreme water shortages that are fueling conflict, social unrest and migration," according to the World Economic Forum. Droughts, and more generally, changing weather patterns will make agricultural markets more volatile. Food production shortages due to unpredictable weather are compounding lingering pandemic related supply chain disruptions, leading to higher food prices (Chart 3). This could also fuel social unrest and political uncertainty. Floods in China’s Henan province - a key agriculture and pork region - inundated farms. Drought and extreme heat in North America are destroying crops in parts of Canada and the US. While flooding in July damaged Europe’s crops, the continent’s main medium-term risk, will be water scarcity.2 Droughts and extreme weather in Brazil have deep implications for agricultural markets, given the variety and quantity of products it exports. Water scarcity and an unusual succession of polar air masses caused coffee prices to rise earlier this year (Chart 4). The country is suffering from what national government agencies consider the worst drought in nearly a century. According to data from the NASA Earth Observatory, many of the agricultural states in Brazil saw more water evaporate from the ground and plants’ leaves than during normal conditions (Map 3). Chart 3The Pandemic and Changing Weather Patterns Will Keep Food Prices High
The Pandemic and Changing Weather Patterns Will Keep Food Prices High
The Pandemic and Changing Weather Patterns Will Keep Food Prices High
Chart 4Unpredictable Weather Will Increase Volatility In Markets For Agricultural Commodities
Unpredictable Weather Will Increase Volatility In Markets For Agricultural Commodities
Unpredictable Weather Will Increase Volatility In Markets For Agricultural Commodities
Map 3Brazil Is Suffering From Its Worst Drought In Nearly A Century
Investing In Water Supply
Investing In Water Supply
Agriculture itself could be part of a longer-term and irreversible problem – i.e. desertification. Irrigation required for modern day farming drains aquifers and leads to soil erosion. According to the EU, nearly a quarter of Spain’s aquifers are exploited, with agricultural states, such as Andalusia consuming 80% of the state’s total water. Irrigation intensive farming, the possibility of higher global temperatures and the increased prevalence of droughts and forest fires are conducive to soil infertility and subsequent desertification. This is a global phenomenon, with the crisis graver still in north Africa, Mozambique and Palestinian regions. Changing weather patterns could also impact the production of non-agricultural goods and services. One such instance is semiconductors, which are used in machines and devices spanning cars to mobile phones. Taiwan, home to the Taiwan Semiconductor Manufacturing Company – the world’s largest contract chipmaker - suffered from a severe drought earlier this year (Chart 5). While the drought did not seriously disrupt chipmaking, in an already tight market, the event did bring the issue of the impact of water shortages on semiconductor manufacturing to the fore. According to Sustainalytics, a typical chipmaking plant uses 2 to 4 million gallons of water per day to clean semiconductors. While wet weather has returned to Taiwan, relying on rainfall and typhoons to satisfy the chipmaking sector’s water needs going forward could lead to volatility in these markets. Chart 5Taiwan Faced Its Worst Drought In History Earlier This Year
Investing In Water Supply
Investing In Water Supply
Climate Change As A Macro Factor The scale of remediating existing environmental damage to the planet and the cost of investing in the technology required to sustain development and growth will be daunting. Unfortunately, there is not a great deal of research looking into how much of a cost households, firms and governments will incur on these fronts. Estimates of the actual price of CO2 – the policy variable most governments and policymakers focus on – range from as little as $1.30/ton to as much as $13/ton, according to the Peterson Institute for International Economics.3 PIIE's Jean Pisani-Ferry estimates the true cost is around $10/ton presently, after accounting for a lack of full reporting on costs and subsidies that reduce carbon costs. The cost of carbon likely will have to increase by an order of magnitude – to $130/ton or more over the next decade – to incentivize the necessary investment in technology required to deal with climate change and to sufficiently induce, via prices, behavioral adaptations by consumers at all levels. The PIIE notes, "… the accelerated pace of climate change and the magnitude of the effort involved in decarbonizing the economy, while at the same time investing in adaptation, the transition to net zero is likely to involve, over a 30-year period, major shifts in growth patterns." These are early days for assessing the costs and global macro effects of decarbonization. However, PIIE notes, these costs can be expected to "include a significant negative supply shock, an investment surge sizable enough to affect the global equilibrium interest rate, large adverse consumer welfare effects, distributional shifts, and substantial pressure on public finances." Much of the investment required to address climate change will be concentrated on commodity markets. Underlying structural issues, such as lack of investment in expanding supplies of metals and hydrocarbons required during the transition to net-zero CO2 emissions, will impart an upward bias to base metals, oil and natural gas prices over the next decade. We remain bullish industrial commodities broadly, as a result. Investment Implications Massive investment in infrastructure will be needed to address emerging water crises around the world. The American Society of Civil Engineers (ASCE) projects an investment shortfall of ~ $3.3 trillion over the next 20 years to replace aging water infrastructure in the US alone. This will translate to a $6,000 per-capita cost by 2039 if the current funding gap persists.4 At tonight's close we will be getting long the FIW ETF, which is focused on US-based firms providing potable water and wastewater treatment services. This ETF provides direct investment exposure to water remediation efforts and needed infrastructure modernization in the US. We also remain long commodity index exposure – the S&P GSCI and the COMT ETF – as a way to retain exposure to the higher commodity-price volatility that climate change will create in grain and food markets. This volatility will keep the balance of price risks to the upside. Robert P. Ryan Chief Commodity & Energy Strategist rryan@bcaresearch.com Ashwin Shyam Research Associate Commodity & Energy Strategy ashwin.shyam@bcaresearch.com Commodities Round-Up Energy: Bullish Hurricane Ida shut in ~ 96% of total US Gulf of Mexico (GoM) oil production. Colonial Pipeline, a major refined product artery for the US South and East coast closed a few of its lines due to the hurricane but has restarted operations since then. Since the share of US crude oil from this region has fallen, WTI and RBOB gasoline prices have only marginally increased, despite virtually zero crude oil production from the GoM (Chart 6). Prices are, however, likely to remain volatile, as energy producers in the region check for damage to infrastructure. Power outages and a pause in refining activity in the region will also feed price volatility over the coming weeks. Despite raising the 2022 demand forecast and pressure from the US, OPEC 2.0 stuck to its 400k b/d per month production hike in its meeting on Wednesday. Base Metals: Bullish A bill to increase the amount of royalties payable by copper miners in Chile was passed in the senate mining committee on Tuesday. As per the bill, taxes will be commensurate with the value of the red metal. If the bill is passed in its current format, it will disincentivize further private mining investments in the nation, warned Diego Hernandez, President of the National Society of Mining (SONAMI). Amid a prolonged drought in Chile during July, the government has outlined a plan for miners to cut water consumption from natural sources by 2050. Increased union bargaining power - due to higher copper prices -, a bill that will increase mining royalties, and environmental regulation, are putting pressure on miners in the world’s largest copper producing nation. Precious Metals: Bullish Jay Powell’s dovish remarks at the Jackson Hole Symposium were bullish for gold prices. The chairman of the US Central Bank stated the possibility of tapering asset purchases before the end of 2021 but did not provide a timeline. Powell reiterated the absence of a mechanical relationship between tapering and an interest rate hike. Raising interest rates is contingent on factors, such as the prevalence of COVID, inflation and employment levels in the US. The fact that the US economy is not close to reaching the maximum employment level, according to Powell, could keep interest rates lower for longer, supporting gold prices (Chart 7). Ags/Softs: Neutral The USDA crop Progress Report for the week ending August 29th reported 60% of the corn crop was good to excellent quality, marginally down by 2% vs comparable dates in 2020. Soybean crop quality on the other hand was down 11% from a year ago and was recorded at 56%. Chart 6
Investing In Water Supply
Investing In Water Supply
Chart 7
Weaker Real Rates Bullish For Gold
Weaker Real Rates Bullish For Gold
Footnotes 1 Please see Reclamation announces 2022 operating conditions for Lake Powell and Lake Mead; Historic Drought Impacting Entire Colorado River Basin. Released by the US Bureau of Reclamation on August 16, 2021. 2 Please refer to Water stress is the main medium-term climate risk for Europe’s biggest economies, S&P Global, published on August 13, 2021. 3 Please see 21-20 Climate Policy is Macroeconomic Policy, and the Implications Will Be Significant by Jean Pisani-Ferry, which was published in August 2021. 4 Please see The Economic Benefits of Investing in Water Infrastructure, published by the ASCE and The Value of Water Campaign on August 26, 2020. Investment Views and Themes Recommendations Strategic Recommendations Commodity Prices and Plays Reference Table Trades Closed in 2021 Summary of Closed Trades
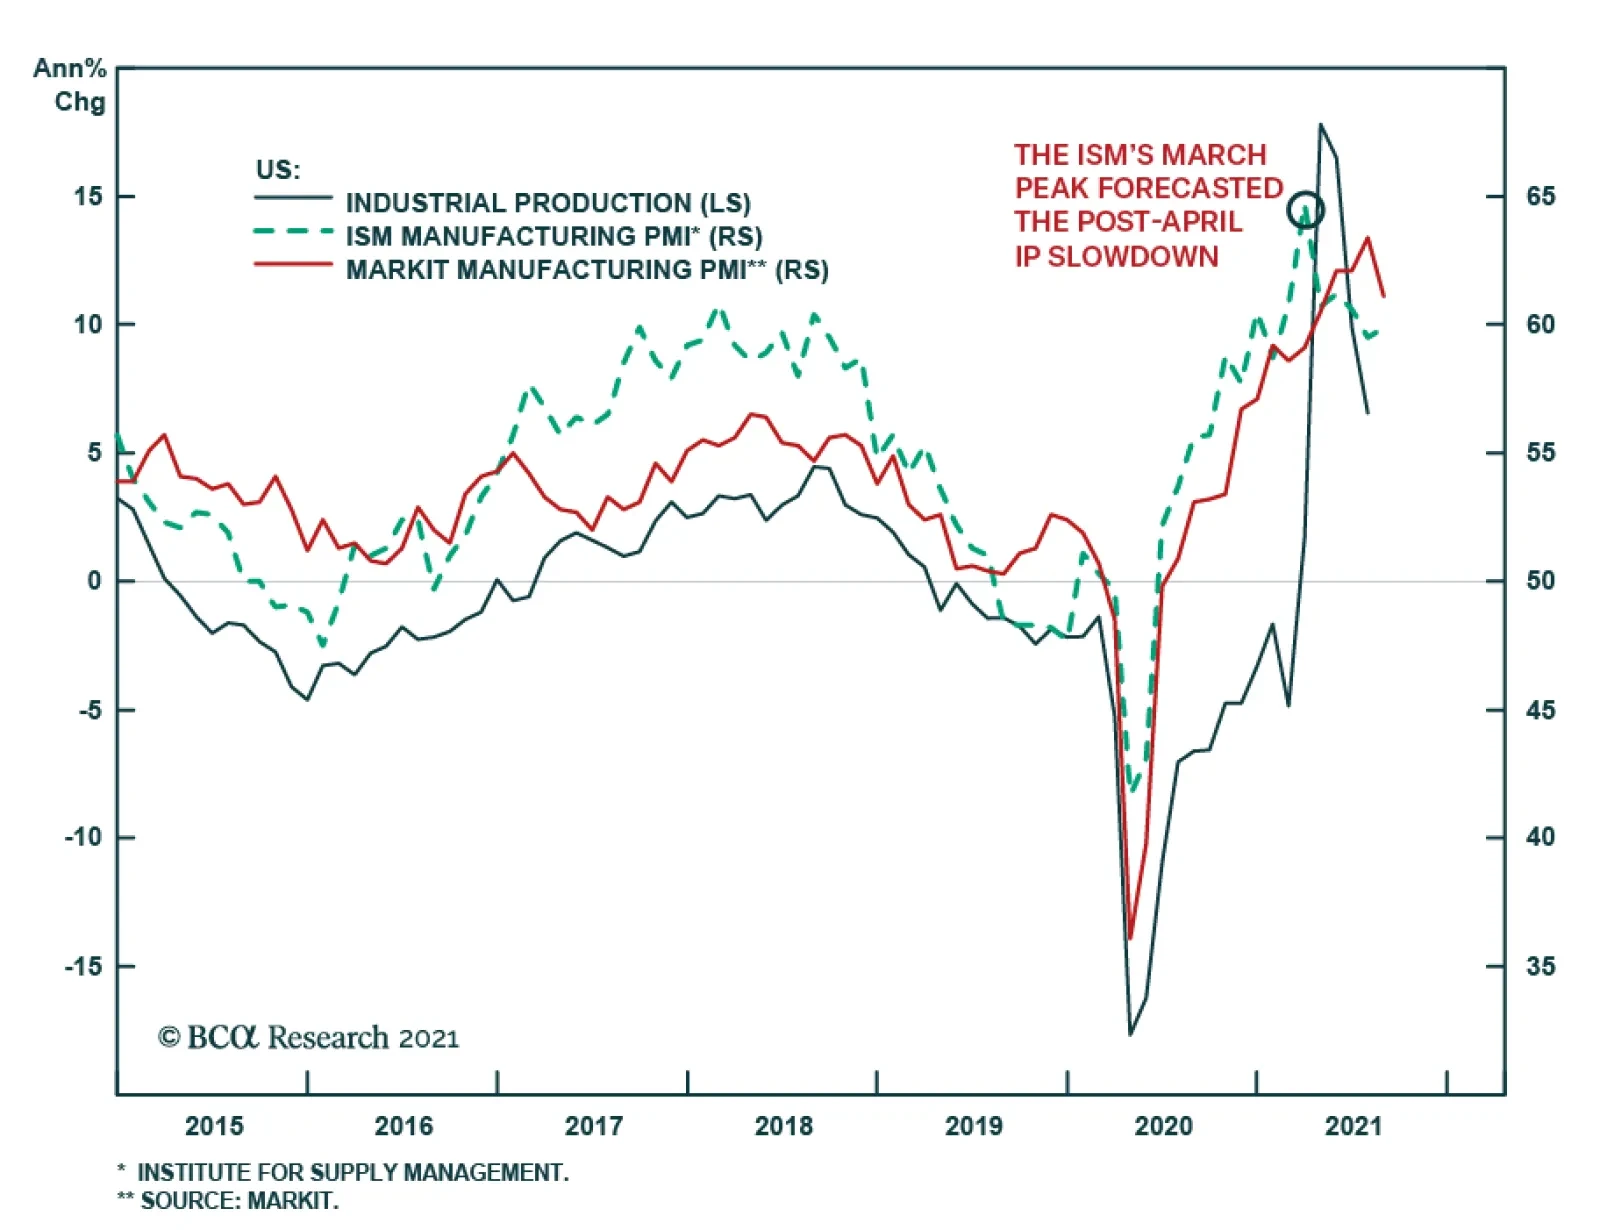
The ISM and Markit PMIs sent a somewhat contradictory signal about the US manufacturing sector in August. The ISM index accelerated to 59.9, beating expectations it would lose one percentage point to 58.5. Meanwhile, the Markit PMI softened to 61.1 from…
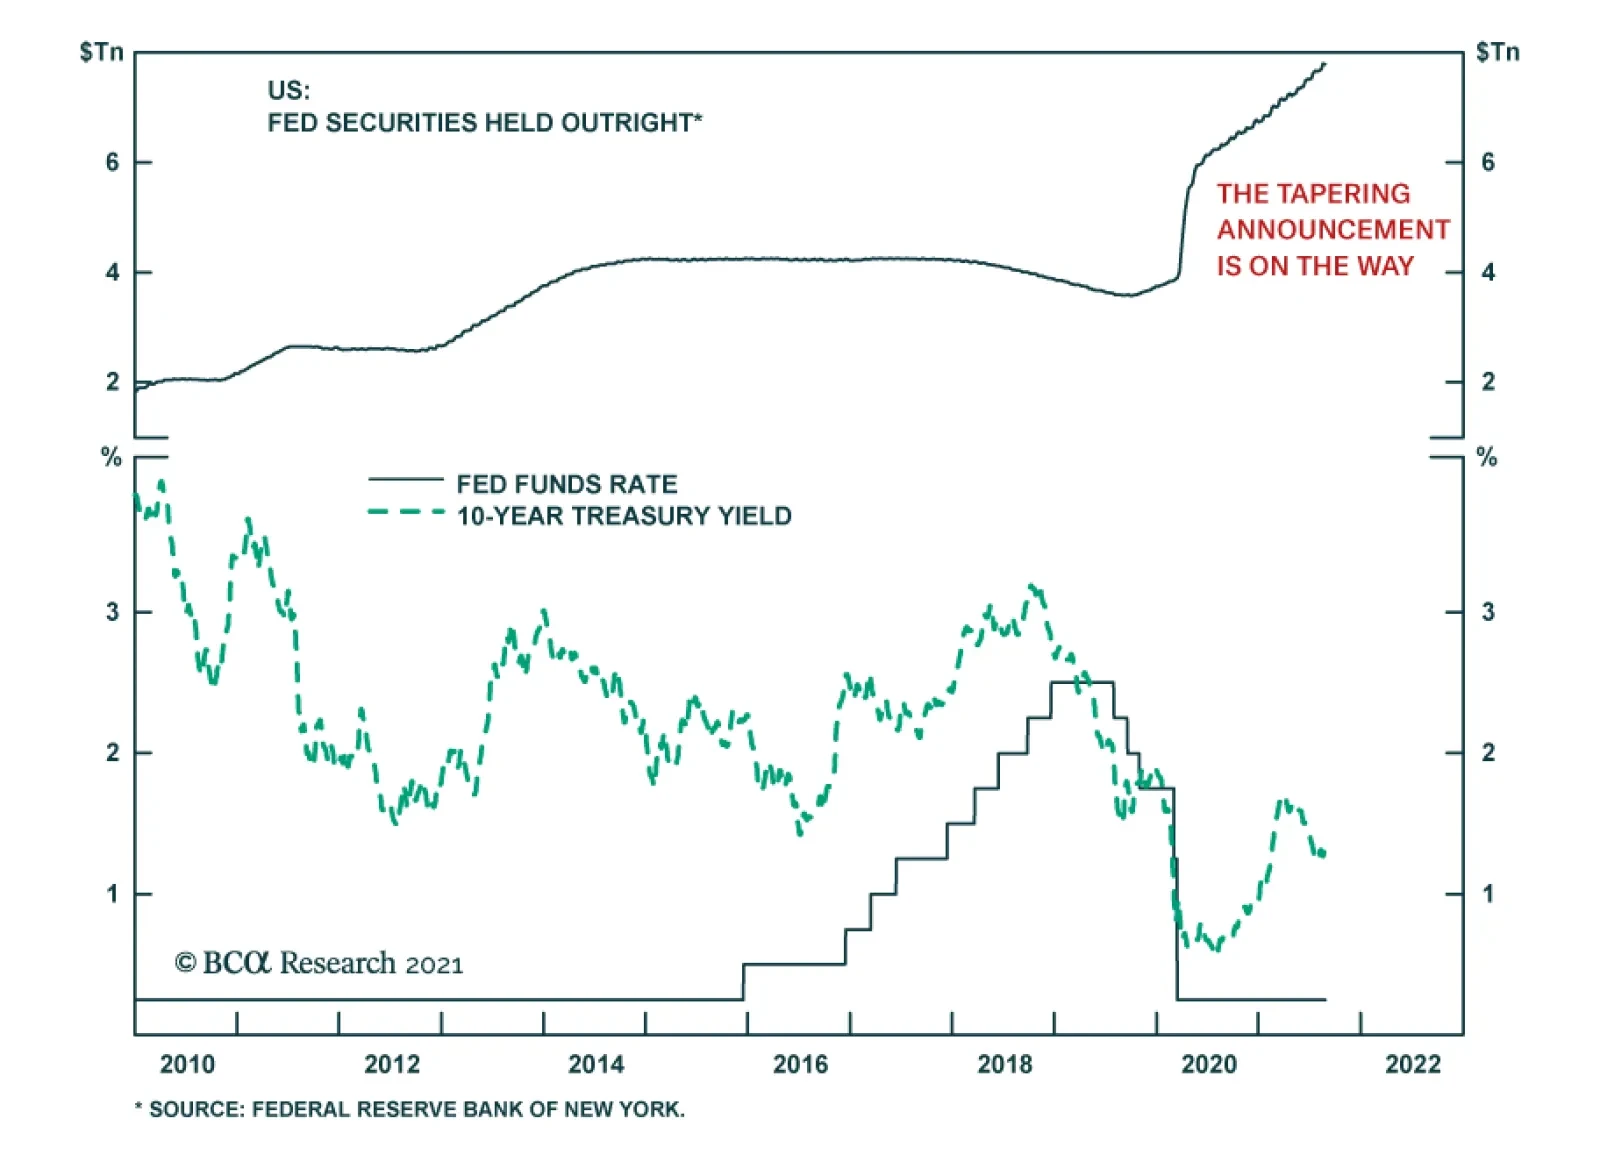
Highlights Jackson Hole: The message from Jackson Hole is that the majority of the FOMC – including Fed Chair Powell - is ready to begin tapering asset purchases before year-end. There is less unanimity within the FOMC over the timing of interest rate increases following the taper. Fed Policy: The Fed is trying to communicate a separation of the balance sheet and interest rate components of its monetary policy, hoping to limit bond volatility stemming from markets pulling forward the timing of rate hikes during the taper. A tightening US labor market will make that separation difficult given the shallow path for interest rates currently discounted in the US yield curve - particularly if the current surge in US inflation proves not to be as transitory as the Fed is expecting. US Treasury Yields: Expect higher Treasury yields over the next 12-18 months as the Fed transitions from talking about tapering to actual tapering and, eventually, to rate hikes starting in H2/2022. A September To Remember? Chart 1The Fed Faces Some Tough Decisions
The Fed Faces Some Tough Decisions
The Fed Faces Some Tough Decisions
The much anticipated Jackson Hole speech from Fed Chair Jerome Powell offered a balanced tone.1 Powell did say that the Fed could begin tapering asset purchases by the end of this year, given the “substantial further progress” on the Fed’s 2% average inflation goal, if the US economy evolved in line with the Fed’s forecasts. However, Powell also noted that rate hikes would not occur without greater improvements in the US labor market, particularly given the Fed’s view that the current surge in US inflation will not prove lasting. Several other Fed officials speaking to the media before Powell’s speech hinted at a much more accelerated timetable, with tapering to begin in September and rate hikes potentially starting as soon as mid-2022. The Fed’s messaging is part of an extended conversation with financial markets to prepare for a withdrawal of pandemic-era policy stimulus from quantitative easing (QE). The FOMC is well aware that valuations on asset prices of all stripes have been boosted by loose monetary settings. Powell’s Jackson Hole comments were more nuanced than those of his FOMC colleagues, but this is no surprise as the words of the Fed Chair carry the greatest weight among investors. The Fed Chair does not want to risk a repeat of the 2013 Taper Tantrum in Treasury yields, or the December 2018 plunge in US equity prices, by sounding unexpectedly hawkish and triggering a market rout that tightens US financial conditions (Chart 1). Our baseline assumption has been that the Fed would signal a tapering at the December FOMC meeting and begin to slow asset purchases in January 2022, leading to an eventual liftoff of the fed funds rate by the end of next year. The comments from Powell and others have raised the risk that the Fed moves a bit faster than our expectations on tapering, and perhaps even for liftoff (Chart 2). This would also be faster than the expectations among bond investors. Chart 2The Fed May Be Set To Move Faster Than Our Expected Timeline
The Fed’s Separation Anxiety
The Fed’s Separation Anxiety
The New York Fed’s Survey of Primary Dealers in July showed that tapering is expected by Q1 of next year but a rate hike was not projected until the latter half of 2023 (Table 1). Current pricing in the US overnight index swap (OIS) forward curve is a bit more hawkish than that, with a full 25bp rate hike discounted by January 2023. Table 1Primary Dealers Expect A Taper, Not Rate Hikes
The Fed’s Separation Anxiety
The Fed’s Separation Anxiety
The Fed’s next move will depend on how the questions regarding the Delta variant, the true state of the US labor market and underlying US inflation momentum are resolved. Dismissing The Delta Threat? There has been a clear hit to US economic confidence from the spread of the variant. The August readings from the University of Michigan consumer sentiment survey, the Philadelphia Fed business outlook survey and the ZEW survey of US growth expectations all showed sharp declines (Chart 3). The August flash estimate of the Markit PMIs fell to 8-month and 4-month lows, respectively, indicating that the pace of US economic activity slowed. Higher frequency data like restaurant reservations and hotel bookings have also dipped in recent weeks, potentially a sign of US consumers turning more cautious on leaving home during the Delta surge. Yet there is some tentative positive news on the spread of the variant. The 7-day moving average of new COVID-19 cases in the US appears to be rolling over (Chart 4). In the more stricken states in the US south like Florida, Texas and Louisiana, the effective reproduction number has fallen below one and cases are clearly peaking, suggesting that the transmission of Delta is slowing. If these trends continue, the full hit to US growth from the variant could prove to be minimal and potentially contained to only August data Chart 3A Hit To US Confidence From The Delta Variant
A Hit To US Confidence From The Delta Variant
A Hit To US Confidence From The Delta Variant
Chart 4Has The US Delta Wave ##br##Peaked?
Has The US Delta Wave Peaked?
Has The US Delta Wave Peaked?
Fed officials have been highlighting Delta as a potential near-term risk to the economy, but some comments made last week suggested only a modest level of concern that would not derail tapering plans. For example: Dallas Fed President Robert Kaplan: “[…] what I'm seeing is, in certain sectors, as you would expect, travel-related, you're seeing weakness in some other sectors but by and large, predominantly, what we're seeing is resilience across the indicators that we look at.”2 Kansas City Fed President Esther George: “[…] by and large, I think, unlike what we experienced last year, people have mechanisms to continue to interact with the economy in a way that we didn't before. And so that gives me some confidence in the outlook that we see, that we could continue to push through this.”3 Atlanta Fed President Raphael Bostic: “What I have seen is some suggestion that things are slowing down, but they are still just slowing from extremely high levels. I have not seen big changes in the underlying dynamic.”4 Even Powell himself noted in his speech that “while the Delta variant presents a near-term risk, the prospects are good for continued progress toward maximum employment.” If the hit to the domestic US economy from Delta proves to be modest and short-lived, the Fed will want to see confirmation of this in the US employment data. Labor market slack overestimated? It is clear from other comments made last week that FOMC officials will be watching the August payrolls report very closely, especially given the perception that the US job market may be a lot tighter than the headline unemployment rate suggests. For example, Fed Governor Christopher Waller noted that “when you adjust the labor force for early retirements, if we get another million [jobs in August] we will recover about 85% of the jobs that were lost and that took almost seven years after the last recession.”5 Kaplan noted that “we do think that the labor market is much tighter than the headline statistics indicate. We've had 3 million retirements since February 2020.” Our colleagues at BCA Research’s The Bank Credit Analyst came to a similar conclusion on labor market tightness in a report published last week.6 They determined that the single largest factor driving the US labor force participation rate lower since the onset of the pandemic has been individuals choosing to retire (Chart 5). Only some of that decline has been related to early retirement decisions made in response to COVID. There has been a structural trend of a falling participation rate, by an average of 0.3 percentage points per year, since 2008 due to demographic factors. The labor force participation rate does not need to fully return to pre-pandemic levels for the Fed to conclude that its maximum employment goal has been reached, after accounting for retirements and other demographic shifts (Chart 6). This fits with the comments from Waller and Kaplan indicating that there has likely been enough labor market improvement to begin tapering asset purchases. Chart 5Most Of The Pandemic Decline In Labor Force Participation Has Occurred Due To Retirement
The Fed’s Separation Anxiety
The Fed’s Separation Anxiety
Chart 6Full Employment Without A Pre-COVID Participation Rate
Full Employment Without A Pre-COVID Participation Rate
Full Employment Without A Pre-COVID Participation Rate
Transitory or persistent inflation? In his Jackson Hole speech, Fed Chair Powell downplayed many of the factors that have driven US headline inflation higher in 2021 as “[…] the product of a relatively narrow group of goods and services that have been directly affected by the pandemic and the reopening of the economy.” He also noted that the current surge in durable goods inflation, which has contributed “about one percentage point to the 12-month measures of headline and core inflation”, was likely to end once current supply chain disruptions fade. Durables would then return to the deflationary trend of the past 25 years and help cool off current overheated US inflation. Chart 7US Inflation Is Not Slowing Down
US Inflation Is Not Slowing Down
US Inflation Is Not Slowing Down
Powell also noted the absence of significant US wage growth as reason not to be overly worried about a sustained period of high inflation. He also highlighted that “there is little reason to think” that ongoing structural disinflationary forces like technology and globalization “have suddenly reversed or abated” and that “it seems more likely that they will continue to weigh on inflation as the pandemic passes into history.” This is the message that the Fed has consistently communicated over the past several months, that high inflation was merely “transitory” and the inevitable result of year-over-year base effect comparisons and temporary supply squeezes. The problem with this interpretation is that we are now well into the summer months of 2021, past the period where base effects would be expected to boost US year-over-year inflation rates (the level of both the CPI and PCE deflator indices fell between January and May 2020 before starting to climb again in June). The July 2021 readings on annual headline and core PCE inflation were 4.2% and 3.6%, respectively, the highest rates seen since 1991 (Chart 7, top panel). The year-over-year increase appears to have been concentrated in a few components, with the Dallas Fed’s trimmed mean PCE 12-month inflation for July only climbing to 2.0%. However, the 6-month annualized measure was a more rapid 2.6% - the fastest such pace in 13 years - suggesting that the momentum of US inflation is both broadening and accelerating on the margin (second panel). Chart 8A Sustainable, Not Transitory, Rise In Global Inflation
A Sustainable, Not Transitory, Rise In Global Inflation
A Sustainable, Not Transitory, Rise In Global Inflation
Powell, like many other developed market central bankers, is making a big bet that the “transitory” inflation narrative will prove to be correct and the current surge in inflation will soon subside. Yet already, global supply chain disruptions have lingered longer than the Fed has been expecting. There are also deeper underlying trends in inflation that are challenging the “transitory” narrative. The NFIB small business survey showed that a net 52% of respondents reported raising selling prices in July, while a net 44% planned future price hikes (third panel), both readings last seen during the days of double-digit US inflation in the late 1970s. US firms are successfully passing on rising input costs to US consumers, which is influencing US consumer inflation expectations. The University of Michigan consumer survey for August showed that US households expect inflation over the next year of 4.6% and over the next 5-10 years of 2.9%, with both series well above pre-pandemic lows (bottom panel). The trends in higher inflation seen in the US, and elsewhere, are not just limited to commodity prices where supply squeezes were most prevalent earlier this year and where price momentum is peaking (Chart 8). A GDP-weighted average of core inflation rates for 14 developed market economies reached 2.50% in June and 2.4% in July, levels last seen in the mid-1990s. Higher core inflation readings are consistent with intensifying price pressures stemming from diminished economic slack. The broad swings in our global core inflation measure correlate strongly with the IMF’s estimate of the output gap for the advanced economies (bottom panel). The current acceleration in global core inflation is entirely consistent with the rapid narrowing of the global output gap projected by the IMF for 2021 and, more importantly, 2022. This suggests that underlying inflation pressures, both within and outside the US, will linger into next year, providing an offset the expected drag on “non-core” inflation from slowing commodity price momentum. Already, lingering supply squeezes and stubbornly high US inflation are causing concern among some FOMC members, as noted in these comments last week: Robert Kaplan: “[…] headline PCE inflation next year, we think is going to be in the neighborhood of 2.5%, and there's risk that could be higher. And so we think some of these supply-demand imbalances for materials, some of them will not moderate, but some of them are going to persist longer than people think.” Esther George: “[…] if you continue to have supply constraints and strong demand, you might expect that those will persist more through this year or longer than we originally anticipated.” Chris Waller: “I do think it’s going to be more persistent than I may have thought back in May.” Chart 9Fed Tapering To Deal With Financial Stability Risks?
Fed Tapering To Deal With Financial Stability Risks?
Fed Tapering To Deal With Financial Stability Risks?
Importantly, the senior FOMC leadership - Powell, Lael Brainard, Richard Clarida – has been sticking with the “transitory” narrative. However, even Clarida noted in a speech in early August that he would consider core PCE inflation at or above 3% at year-end to be “much more than a “moderate” overshoot” of the Fed’s 2% inflation objective.7 In his role as Fed Chair, Powell must speak on behalf of the entire FOMC, even if those views are not necessarily his own. Given the growing chorus of Fed voices expressing concern that US inflation could remain higher for longer, it will be increasingly difficult for Powell to do what he did at Jackson Hole – sound more dovish than the individual FOMC members with regards to inflation risks. What about financial stability risks from QE? Fed officials have been understandably cautious in their comments about how QE (and a 0% funds rate) could be influencing asset prices (Chart 9). However, with equity markets at record highs, corporate bond yields near record lows despite high levels of corporate leverage, and US house prices soaring – the S&P CoreLogic Case-Shiller national index rose 18.6% on a year-over-year basis in June, the fastest pace in its 35-year history - it is difficult not to see the role of the Fed’s easy money policies in boosting risk seeking, yield chasing activities. Stimulative financial conditions are also creating future upside growth risks, with the Conference Board leading economic indicator now reaccelerating (bottom panel). Robert Kaplan, Boston Fed President Eric Rosengren and St. Louis Fed President James Bullard have voiced concerns that QE, particularly the Fed’s buying of agency mortgage-backed securities (MBS), have played a significant role in the current US housing boom. The senior FOMC leadership has avoided any such comments for obvious reasons – imagine the market reaction if Powell expressed concerns about high house prices or equity market valuations. However, for those at the Fed already looking to begin tapering sooner, booming asset prices are an additional reason to vote that way as soon as the September FOMC meeting. Separating Tapering From Rate Hikes It seems clear that the majority of the FOMC is now leaning towards starting to taper before year-end, if US growth and employment maintain recent strength. The common message of Fed officials, from Powell on down, is that enough progress has been made on the Fed’s 2% average inflation target objective to justify tapering. Market-based inflation expectations from the TIPS and CPI swap markets are consistent with that interpretation, with breakevens and forward inflation rates within the 2.3-2.5% range consistent with the Fed’s 2% inflation mandate (Chart 10). Yet while our Fed Monitor continues to flag the need for tighter US monetary policy, only 100bps of rate hikes are discounted in the US OIS curve by the end of 2024 – and only after a first rate hike not expected to occur until January 2023. Despite the common messaging on the start of the taper, the Fed voices were singing a bit less in harmony about the potential timing of the first interest rate hike post-taper. Powell went out of his way to note in his Jackson Hole speech that “the timing and pace of the coming reduction in asset purchases will not be intended to carry a direct signal regarding the timing of interest rate liftoff, for which we have articulated a different and substantially more stringent test.” That test, of course, is when the Fed deems that its maximum employment objective has been reached. Can the Fed continue to successfully separate guidance on balance sheet decisions from guidance on future interest rate moves? Current pricing from US OIS and CPI swap forward curves indicates that the market is discounting negative real policy rates, with the Fed never raising rates above inflation, for the next decade (Chart 11). This goes a long way to explain the persistence of negative real US Treasury yields at a time of elevated inflation readings. Although a decade of negative real interest rates is also consistent with the market believing the equilibrium real interest rate (i.e. r-star) is negative – a view currently expressed by no one on the FOMC. Chart 10Too Few Rate Hikes Discounted In The US OIS Curve
Too Few Rate Hikes Discounted In The US OIS Curve
Too Few Rate Hikes Discounted In The US OIS Curve
Chart 11Markets Believe The Fed Will Never Raise Rates Above Inflation
Markets Believe The Fed Will Never Raise Rates Above Inflation
Markets Believe The Fed Will Never Raise Rates Above Inflation
That persistent pricing of negative real rates make sense when there is modest headline inflation and ample spare capacity in the US economy and labor markets. However, that complacency on future rate hikes will be shaken if the US economy approaches full employment and inflation remains above the Fed’s 2% target – outcomes that we expect to occur by the second half of next year. That will lead to the first fed rate hike of the next cycle in Q4 2022, but only after the taper that we expect to start in either December 2021 or January 2022 is completed in Q3 2022. Bottom Line: A tightening US labor market will make the Fed’s current guidance on the separation of tapering from rate hikes increasingly unconvincing, given the shallow path for interest rates currently discounted in the US yield curve - particularly if the current surge in US inflation proves not to be as transitory as the Fed is expecting. Jackson Hole Investment Conclusion – Expect Higher US Treasury Yields Chart 12Stay Below-Benchmark On US Duration
Stay Below-Benchmark On US Duration
Stay Below-Benchmark On US Duration
With such a modest path for future rate hikes, and bond yields, discounted in US forward interest rate curves, we continue to advocate positioning for higher US Treasury yields on a strategic (6-18 months) basis (Chart 12). We see the benchmark 10-year Treasury yield eventually reaching a peak in the 2-2.25% range by the end of 2022. We recommend maintaining a below-benchmark duration stance in the US, while staying underweight US Treasuries in US and global bond portfolios. There is even a case to be made for a more tactical (i.e. shorter-term) bearish stance on US Treasuries with the US data surprise cycle set to turn towards upside surprises, especially if the negative impact of the Delta variant on confidence and spending begins to wane as case numbers start to decline in the coming weeks. Bottom Line: Expect higher Treasury yields over the next 12-18 months as the Fed transitions from talking about tapering to actual tapering and, eventually, to rate hikes starting in H2/2022. Robert Robis, CFA Chief Fixed Income Strategist rrobis@bcaresearch.com Footnotes 1 A transcript of Powell’s speech can be found here: https://www.federalreserve.gov/newsevents/speech/powell20210827a.htm 2 https://finance.yahoo.com/news/dallas-fed-president-robert-kaplan-yahoo-finance-transcript-august-2021-215700082.html 3 https://finance.yahoo.com/news/kansas-city-fed-president-esther-george-yahoo-finance-transcript-august-2021-113024734.html 4 https://www.reuters.com/business/exclusive-feds-bostic-says-reasonable-begin-bond-buying-taper-october-2021-08-27/ 5 https://finance.yahoo.com/news/fed-gov-waller-strong-august-jobs-report-will-be-green-light-for-taper-202340105.html 6 Please see BCA Research The Bank Credit Analyst September 2021 Section II, “The Return To Maximum Employment: It May Be Faster Than You Think”, available at bca.bcaresearch.com 7 https://www.federalreserve.gov/newsevents/speech/clarida20210804a.htm Recommendations Duration Regional Allocation Spread Product Yields & Returns Global Bond Yields Historical Returns
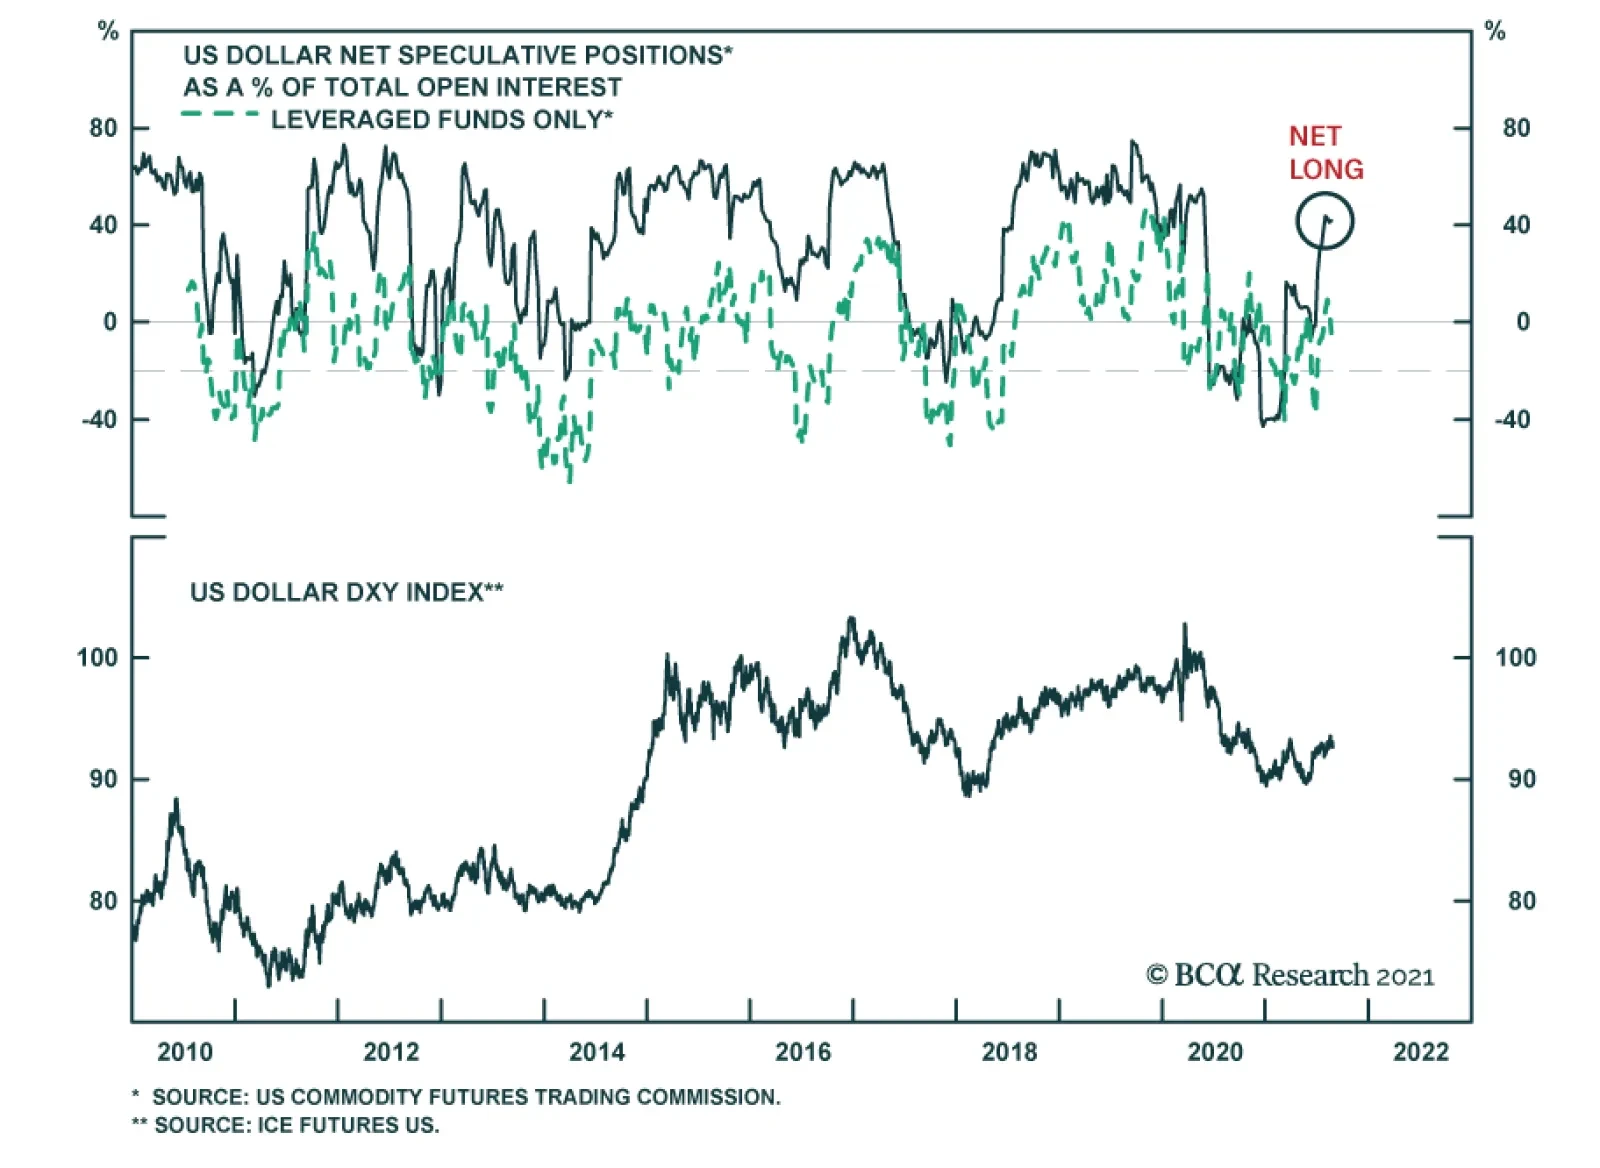
US dollar weakness since Fed Chair Jerome Powell's Jackson Hole Speech on Friday highlights two factors. First, Powell's speech did not produce a surprise. This is corroborated by the decline in Treasury yields and higher equity prices since Friday.…
BCA Research's US Equity Strategy service argues that Gen Z presents an untapped investment opportunity. Generation Z is starting to come of age now, with the oldest members hitting 25 this year. Gen Z-ers now outrank Millennials as the majority generation…
Fed Chair Jerome Powell's Jackson Hole speech did not produce a surprise. On the labor market, Powell noted that "the prospects are good for continued progress toward maximum employment." Regarding inflation, he reiterated that current price pressures…
Highlights Gen Z Is Coming Of Age And Has Money To Spend Generation Z in the US includes 62 million people born between the 1997 and 2012. With $143B in buying power in the US alone, making up nearly 40% of all consumer sales, Gen Z wields increasing influence over consumer trends. This is the first generation of digital natives—they simply can’t remember the world without the internet. They are the early adopters of the new digital ways to bank, get medical treatments, and learn. Gen Z is joining the workforce and replacing retiring baby boomers. Gen Z Investment Themes Fintech: Gen Z loves seamless connectivity, online banking, and digital wallets. They are also the early adopters of semi-autonomous digital and non-traditional banking and insurance: PayPal (PYPL), Square (SQ), Lemonade (LMND), and Social Finance (Sofi). Investing And Crypto: Gen Z are avid investors: They opened 20% of all new investment accounts in 2020. Crypto is also very popular among the digital natives: Coinbase (COIN), Paypal (PYPL), and Square/Cash App (SQ). Alternative Reality And Online Gaming: Members of Gen Z will become the key gaming demographic in the decade ahead. E-sports betting is also gaining prominence. Two online gaming ETFs capture the theme: GAMR and ESPO. Quality-Over-Price Shoppers: Gen Z was found to be less price-sensitive when buying products, choosing quality over price. Lululemon (LULU) is among the Gen Z’s favorites. Finally, Gen Zers won’t have any qualms about buying a car online: Vroom (VRM). Online Dating: Gen Zers have whole-heartedly accepted online dating: Match (MTCH) and Bumble (BMBL). Pet Ownership: The Gen Z cohort often feels lonely and loves their furry friends: They are more than happy to spend time and money on them: Chewy (CHWY), Trupanion (TRUP), and IDEXX Labs (IDXX). PAWZ is the ETF. Healthy Lifestyle: Gen Z is a “green” generation that deeply cares about the planet, loves outdoors and traveling, with many identifying as vegans. This is also a generation that prizes a healthy lifestyle and working out: Beyond Meat (BYND), Planet Fitness (PLNT), and Yeti (YETI). Generation Sober Chooses Cannabis: Gen Zers perceive hard liquor and tobacco as bad for their health. Curiously, marijuana is perceived as “healthy.” CNBS, YOLO, and THCX are the biggest ETFs in this space. How To Invest In Gen Z Gen Z is a nascent investment theme, so there are no ETFs available in the market yet. We propose investors follow our Gen Z investment themes or replicate fully or partially our Gen Z basket (Table 1). Table 1Gen Z Basket Constituents
Generation Z: The Digital Natives
Generation Z: The Digital Natives
Feature Gen Z Is Coming Of Age And Has Money To Spend Generation Z in the US includes 62 million people born between the years of 1997 and 2012 – a cohort starting to come of age now, with the oldest members hitting 25 this year (Chart 1). Gen Z-ers now outrank Millennials as the majority generation on the planet. With $143B in buying power in the US alone, making up nearly 40% of all consumer sales, Gen Z commands an increasing influence over consumer trends. Chart 1Gen Zers Are Taking Over
Gen Zers Are Taking Over
Gen Zers Are Taking Over
Furthermore, while most Gen Zers are still in high school and college, their parents, who have padded their savings accounts after a series of stimulus checks, are ready to step in and foot the bill, fortifying the financial impact of this new generation. In this report, we have outlined the Gen Z investment themes and most representative stocks. The Gen Z basket is a compilation of these themes and stocks. However, we are not stock-pickers - our selections are for illustration only. Digital Natives This is the first cohort that has grown up with a phone in one hand and a computer mouse in the other. Dubbed “digital natives,” they simply can’t remember a world without the internet. Gen Z, often referred to as “Zoomers” or “Centennials,” are connected nearly every waking hour of the day and are deeply social, even if considerable interaction may take place in cyberspace. The average Gen Z got their first smartphone just before their twelfth birthday, communicates primarily through social media and texts, and spends as much time on their cell phones as their parents on television. Because tech made Gen Z’s personal lives easier, faster, and more efficient, they emphasize customization and optimization as users and consumers. One of the most educated generations, they are more likely to pursue college than earlier generations. Among 18- to 21-year-olds no longer in high school in 2018, 57% were enrolled in two- or four-year college (that number was 52% for Millennials). The last year has also blurred the lines between work and home: Many college graduates have never met their new colleagues in person. Generation Z students had unprecedented exposure and experience using technology to continue their education outside the traditional brick-and-mortar school setting. They are also most likely to adopt new ways to bank, get medical treatments, and learn. Zoomers are future entrepreneurs (72% of high schoolers want to start their own business)1 and evangelists of the gig economy. Demographics & Macro Trends Chart 2 displays US demographic trends. Until 2018, baby boomers dominated the labor force; but, over the past three years, they have passed the baton to Gen Z. Moreover, during the pandemic, the retirements of baby boomers have accelerated. With more Zoomers graduating from high school and college, their proportion in the labor force is rising and their spending patterns are becoming increasingly more prominent in the economy. Gen Z wage data also reveals an interesting trend. Since 2014, median weekly earnings for the coming generation noticeably outpaced one of the departing generations—by 14.5%, to be exact (Chart 3). Chart 2Generational Shifts In The Labor Force
Generational Shifts In The Labor Force
Generational Shifts In The Labor Force
Chart 3They Also Have Money To Spend
They Also Have Money To Spend
They Also Have Money To Spend
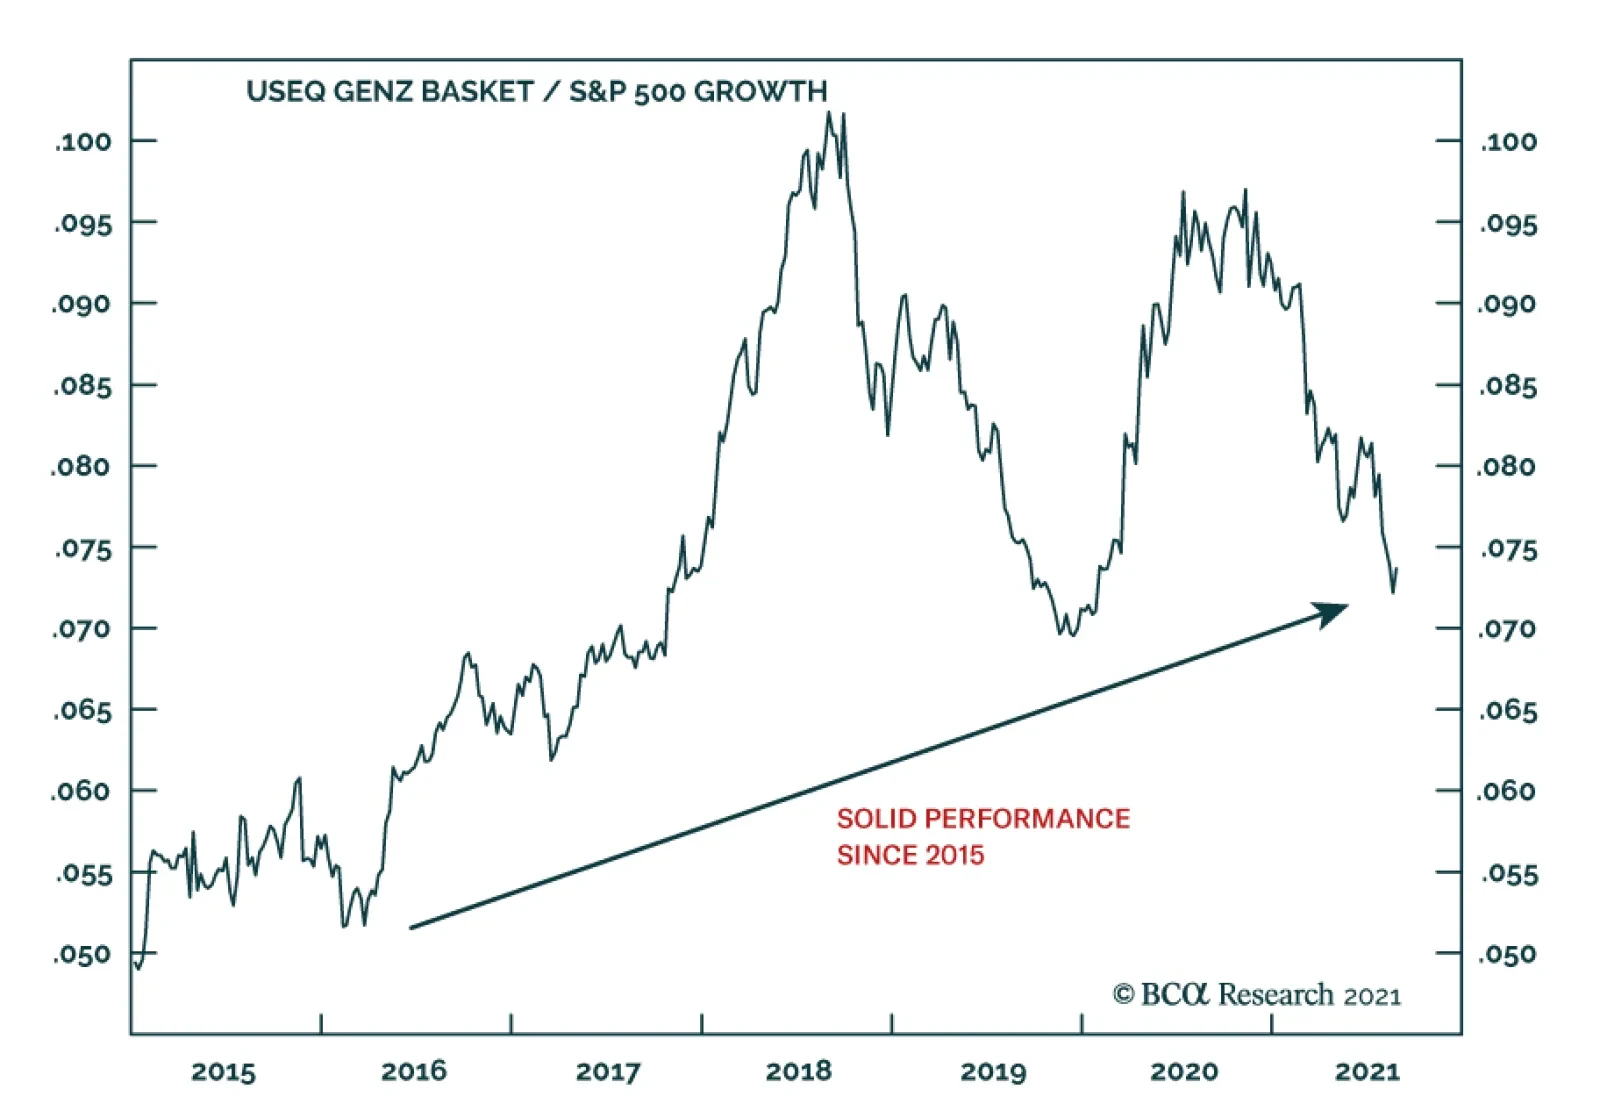
Investment Themes A host of investment themes reflects the retail preferences of Gen Z, collectively called the Gen Z basket. While some of the themes are ubiquitous (most of the US middle class aspire to maintain a healthy lifestyle), it is the quirks specific to Gen Z that we focus on. The oldest Zoomers turned 18 in 2015. Since then, the Gen Z basket has outperformed the S&P 500 Growth index by 46% (Chart 4). A word of caution: As any emerging investment theme, the basket remains volatile. Chart 4Solid Performance Since 2015
Solid Performance Since 2015
Solid Performance Since 2015
Fintech Gen Z is financially minded and risk averse. Many watched parents struggle during the Great Recession. They’re often leery of debt and credit, and thus stick to debit cards. Digital natives expect seamless connectivity, and their finances are no exception. They can't live without their digital wallets and online banking. Generation Z members are early adopters of semi-autonomous digital banking, which deploys digital cognitive agents or AI systems to help with financial decisions. It provides Zoomers with the right degree of personalization and autonomy to make smarter, faster, and better money moves. And, when it comes to money movements, 75% of Zoomers are using peer-to-peer (P2P)2 banking methods, with easy-to-use apps like Zelle and Venmo taking the lead in downloads. Similar fintech trends apply to other financial transactions, like loans and insurance. This theme may be expressed through Paypal (PYPL), Square (SQ), Lemonade (LMND) online insurance, and Social Finance (Sofi)—an online platform for student loan refinancing, private student loans, and a host of other financial products. Interest In Investing And Cryptocurrencies Zoomers are avid investors. They opened 20% of all the new investment accounts in 2020 — impressive, considering that half of the cohort are underage (Chart 5). Crypto is also very popular among digital natives. Last year, Business Insider (BI) released a survey asking if Zoomers are “likely to purchase cryptos in the next six months”. What is telling is that approximately 1/4 of responders indicated that they are likely to purchase crypto, which correlates to the percentage of Zoomers who are currently age 18 or older (Chart 6). We can play the crypto theme in the equity space by investing in Coinbase (COIN), Paypal (PYPL)—which recently started accepting crypto as a payment—and Square/Cash App (SQ). Chart 5Gen Zers Are Avid Investors...
Generation Z: The Digital Natives
Generation Z: The Digital Natives
Chart 6...Including In The Crypto Space
Generation Z: The Digital Natives
Generation Z: The Digital Natives
Alternative Reality And Online Gaming Members of Gen Z will become a key gaming demographic in the decade ahead. 91% of Gen Z males regularly play video games, compared to 84% of Millennials. In a recent study, “From Nerdy to Norm: Gen Z Connects Via Gaming” conducted by Whistle, 68% of Gen Z males agreed that gaming is an important part of their identity. The industry has responded to the mores of this incoming generation by shifting its focus towards highly stylized immersive mobile games, live dealers, and interactive experiences rather than the traditional click-to-spin style slot games. E-sports betting is also getting prominence. We have very little doubt that the proliferation of e-sports will accelerate, especially as Gen Z comes of age. The upcoming 2021 e-sports “world cup” event for just one game already has more than $40,000,000 in prize pool money secured. To express the online gaming theme, we included six stocks in our basket: Online game developers, such as Take Two Interactive (TTWO), Electronic Arts (EA), and Activision Blizzard (ATVI); Zinga (ZNGA), which develops apps for phone games; DraftKings (DKNG), a leader in online sports betting; and finally, Nvidia (NVDA), a graphic chip manufacturer that thrives as a market leader in gaming computing. There are also a couple of online gaming ETFs: GAMR and ESPO. Quality-Over-Price Shoppers As consumers, tech-savvy Zoomers are pragmatic shoppers who rely on social networks to make informed purchasing decisions. They were also found to be less price-sensitive when buying products, choosing quality over price as their top purchasing factor, while sustainability was also highlighted as an important issue. As a result, brick-and-mortar shops with a strong online presence, such as Urban Outfitters (URBN) and Lululemon(LULU) are Gen Z favorites. Vintage clothing has also recently been in vogue among these teens. Companies like Poshmark (POSH) capture this trend. High-end outdoor clothes brands also have a Zoomer following. Canadian Goose (GOOS) is one of them: For many, a “goose” jacket is a winter campus uniform. Lastly, Zoomers won’t have any qualms about buying a car online: Vroom (VRM). Online Dating Gen Z is different from any other generation in their whole-hearted acceptance of online dating. For example, Zoomers represent 40% of all Tinder users. The online dating landscape3 in the US is dominated by just two companies, Match/Tinder (MTCH) and Bumble (BMBL), an app whereby only a female can make initial contact. Pet Ownership Zoomers are lonely – 3 million adolescents had a major depressive episode,4 and there is an increase in anxiety and depression among high schoolers. Many feel isolated as a result of too much screen time. Zoomers are also known to avoid long-term relationships. It is not surprising that this cohort loves their furry friends and is more than happy to spend time and money on them. Since the worst of the pandemic, PAWZ pet care ETF has outperformed the S&P 500 growth index by 24%, while the US pet & vet services CPI series rose by 5.6%, compared to 4.6% for core CPI (Chart 7). While the love of pets is certainly not a unique characteristic of this cohort, it is a significant part of their spending basket. The following stocks capture this trend: PAWZ ETF; Chewy (CHWY), online pet supplies; Trupanion (TRUP), pet insurance; and IDEXX Labs (IDXX), the vet pharma company. Chart 7Pet Ownership Is On The Rise
Pet Ownership Is On The Rise
Pet Ownership Is On The Rise
Healthy Lifestyle Aside from gaming, pet ownership, and online dating, there are some other Gen Z behavioral shifts. This is a “green” generation that deeply cares about the planet, loves outdoors and traveling, and has a soft spot for animals, with many Zoomers identifying as vegans. This generation also prizes a healthy lifestyle and working out. Stocks like Beyond Meat (BYND), makers of meat substitute products; Planet Fitness (PLNT), a gym favored by the Zoomers; and Yeti (YETI), high-end hiking equipment (indeed, this generation chooses quality over price) are the stocks that provide exposure to these new tastes and preferences. Generation Sober Chooses Cannabis Gen Z certainly cares about their health, and most Zoomers perceive hard liquor and tobacco as harmful. Gen Z drinks 20%5 less alcohol than Millennials did at their age. Curiously, marijuana is perceived as “healthy.” BusinessWeek commissioned a survey through the polling firm Morning Consult, which found Zoomers were more than twice as likely to be regular or occasional cannabis users than the national average (Chart 8). They concluded, “It’s always hard to generalize about an entire age group, but early signs suggest it will be a generation of marijuana consumers.” CNBS, YOLO, and THCX are the biggest ETFs in this space. Other Themes Finally, our discussion about Gen Z wouldn’t be complete without mentioning economic digitalization (Amazon, Teladoc, Zoom), proliferation of social media (SNAP, PINS, FB), and the sharing economy (UBER, ABNB, FVRR). Please refer to Table 1 at the beginning of the report for a complete list of Gen Z basket constituents. Chart 8Cannabis Is Not Considered A Drug For Gen Z
Generation Z: The Digital Natives
Generation Z: The Digital Natives
Chart 9Expensive...
Expensive...
Expensive...
Fundamentals And Valuations The Gen Z basket is certainly not cheap, trading at 28x forward earnings and 5.5x sales. This is rich but on par with the S&P 500 Growth index, which trades at 28x and 5.7x respectively (Charts 9 & 10). This basket has strong sales growth and has had a healthy post-COVID recovery bounce (Chart 11 ). Chart 10...But On Par...
...But On Par...
...But On Par...
Chart 11...With The S&P 500 Growth Index
...With The S&P 500 Growth Index
...With The S&P 500 Growth Index
How To Invest In Gen Z Gen Z presents an untapped investment opportunity. We have created our own Gen Z basket, as there is no direct way to play the Gen Z theme: There are no ETFs nor dedicated active funds in this space. While we used our entire basket in our analysis, it should not be viewed as an optimal investment vehicle. Instead, we advise using the basket as a helpful starting point and then filtering through its constituents to choose stocks that better meet one’s investment mandate. We emphasize that we are not stock pickers and that our company selections are mere illustrations of the investment thesis. We recommend investors to initiate a position in Gen Z themes, as they have a tremendous runway and are yet to go through their peak growth phase. Gen Z is a cyclical and structural investment idea and offers prospects for growth. Bottom Line Gen Z is coming of age and, being one of the largest cohorts in the US with $143B in buying power, wields increasing influence over consumer trends. The Gen Z investment thesis captures a host of nascent themes that reflect new generational preferences and spending patterns, such as fintech and online gaming, and a keen interest in investing and crypto, among others. Our Gen Z basket of stocks captures these investment themes, which are yet to go through their peak growth phase and provides investors with an opportunity to profit from them over short- and long-term investment horizons. Irene Tunkel Chief Strategist, US Equity Strategy irene.tunkel@bcaresearch.com Arseniy Urazov Senior Analyst ArseniyU@bcaresearch.com Footnotes 1 Sean McDowell, "6 Trends Among Gen Z in 2016" (Nov 23, 2016) 2 https://www.pymnts.com/news/payments-innovation/2020/why-digital-payments-innovation-sticks-to-gen-z/ 3 https://www.statista.com/statistics/426066/tinder-age-distribution/ 4 Susanna Schrobsdorff, “The Kids Are Not All Right,” Time (Nov 7, 2016): 47. 5 https://www.businessinsider.com/millennials-gen-z-drag-down-beer-sales-2018-2 Recommended Allocation
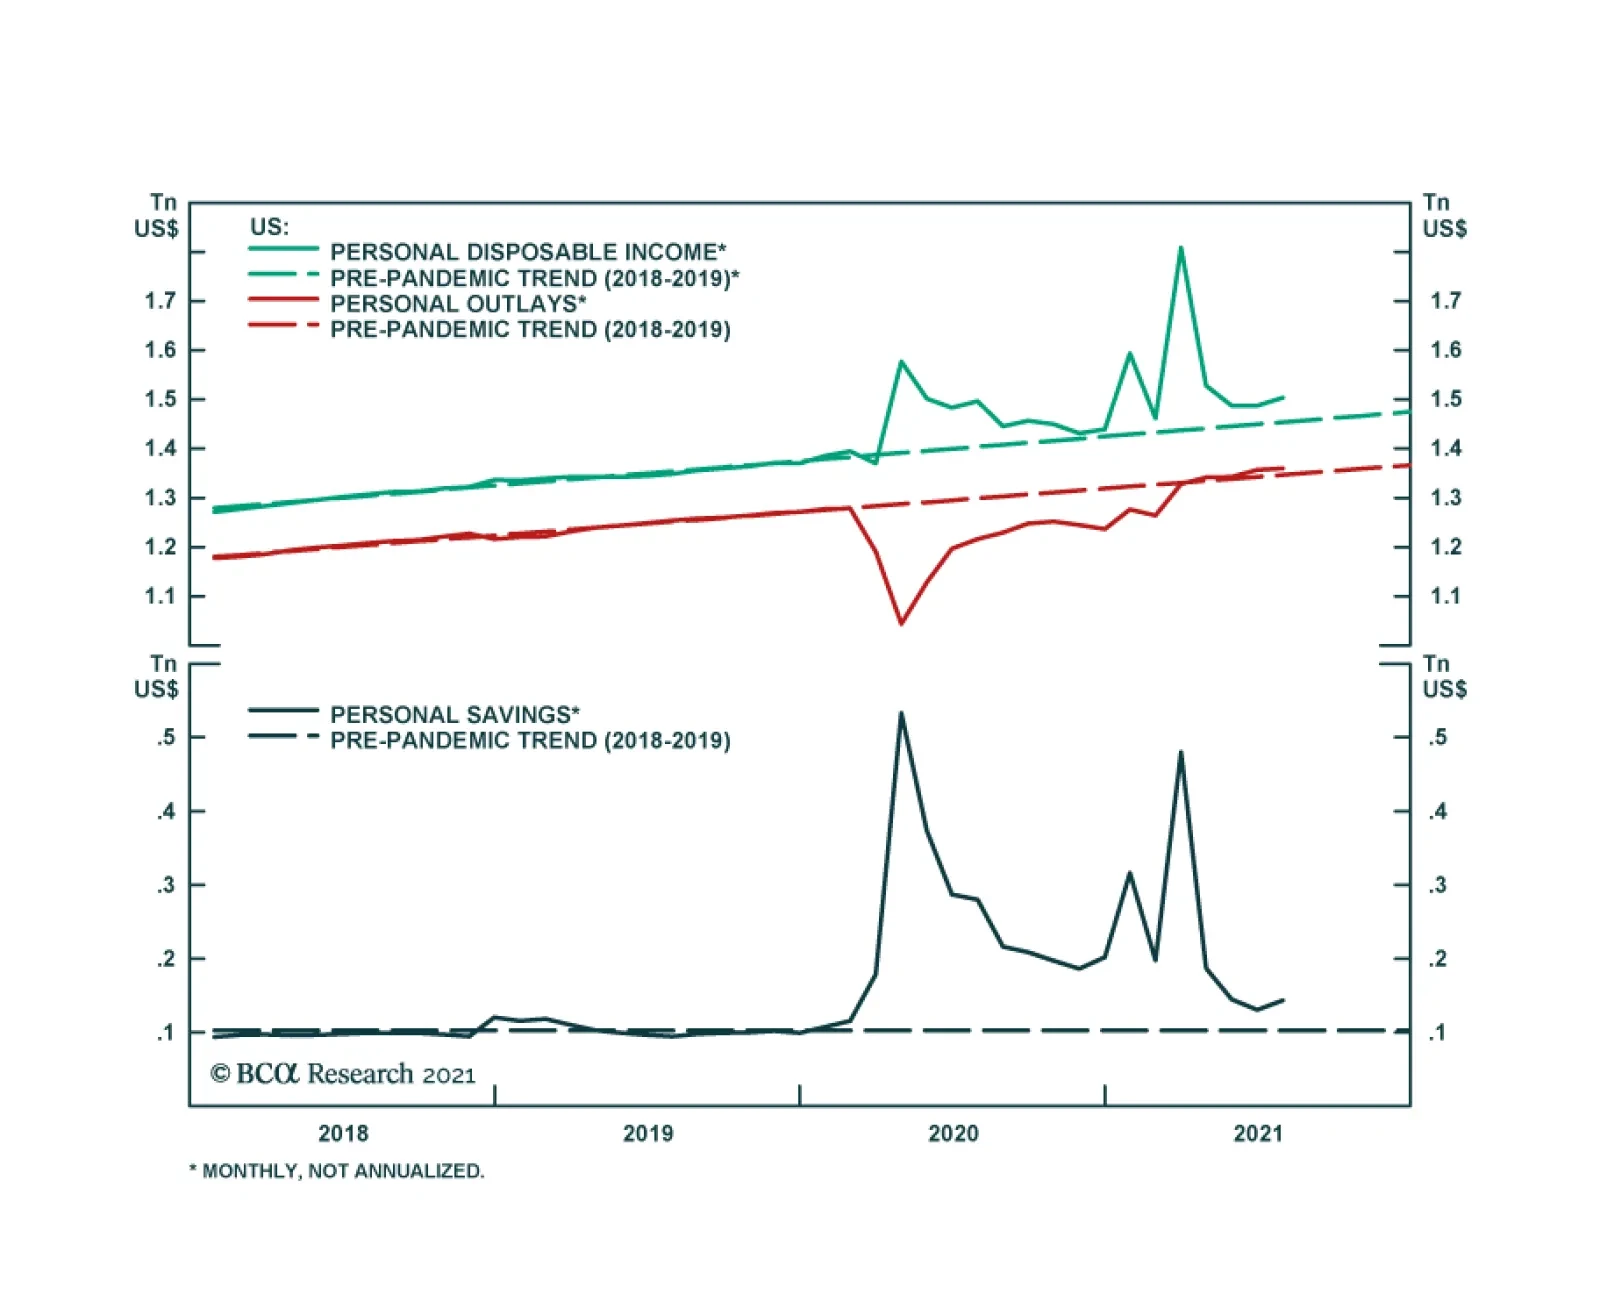
July data for US personal income, spending and savings have provided little surprises. Personal income rose 1.5% m/m in July versus 0.2% in June, spending increased 0.3% in July compared with 1.1% in June. The chart shows there has been little change…
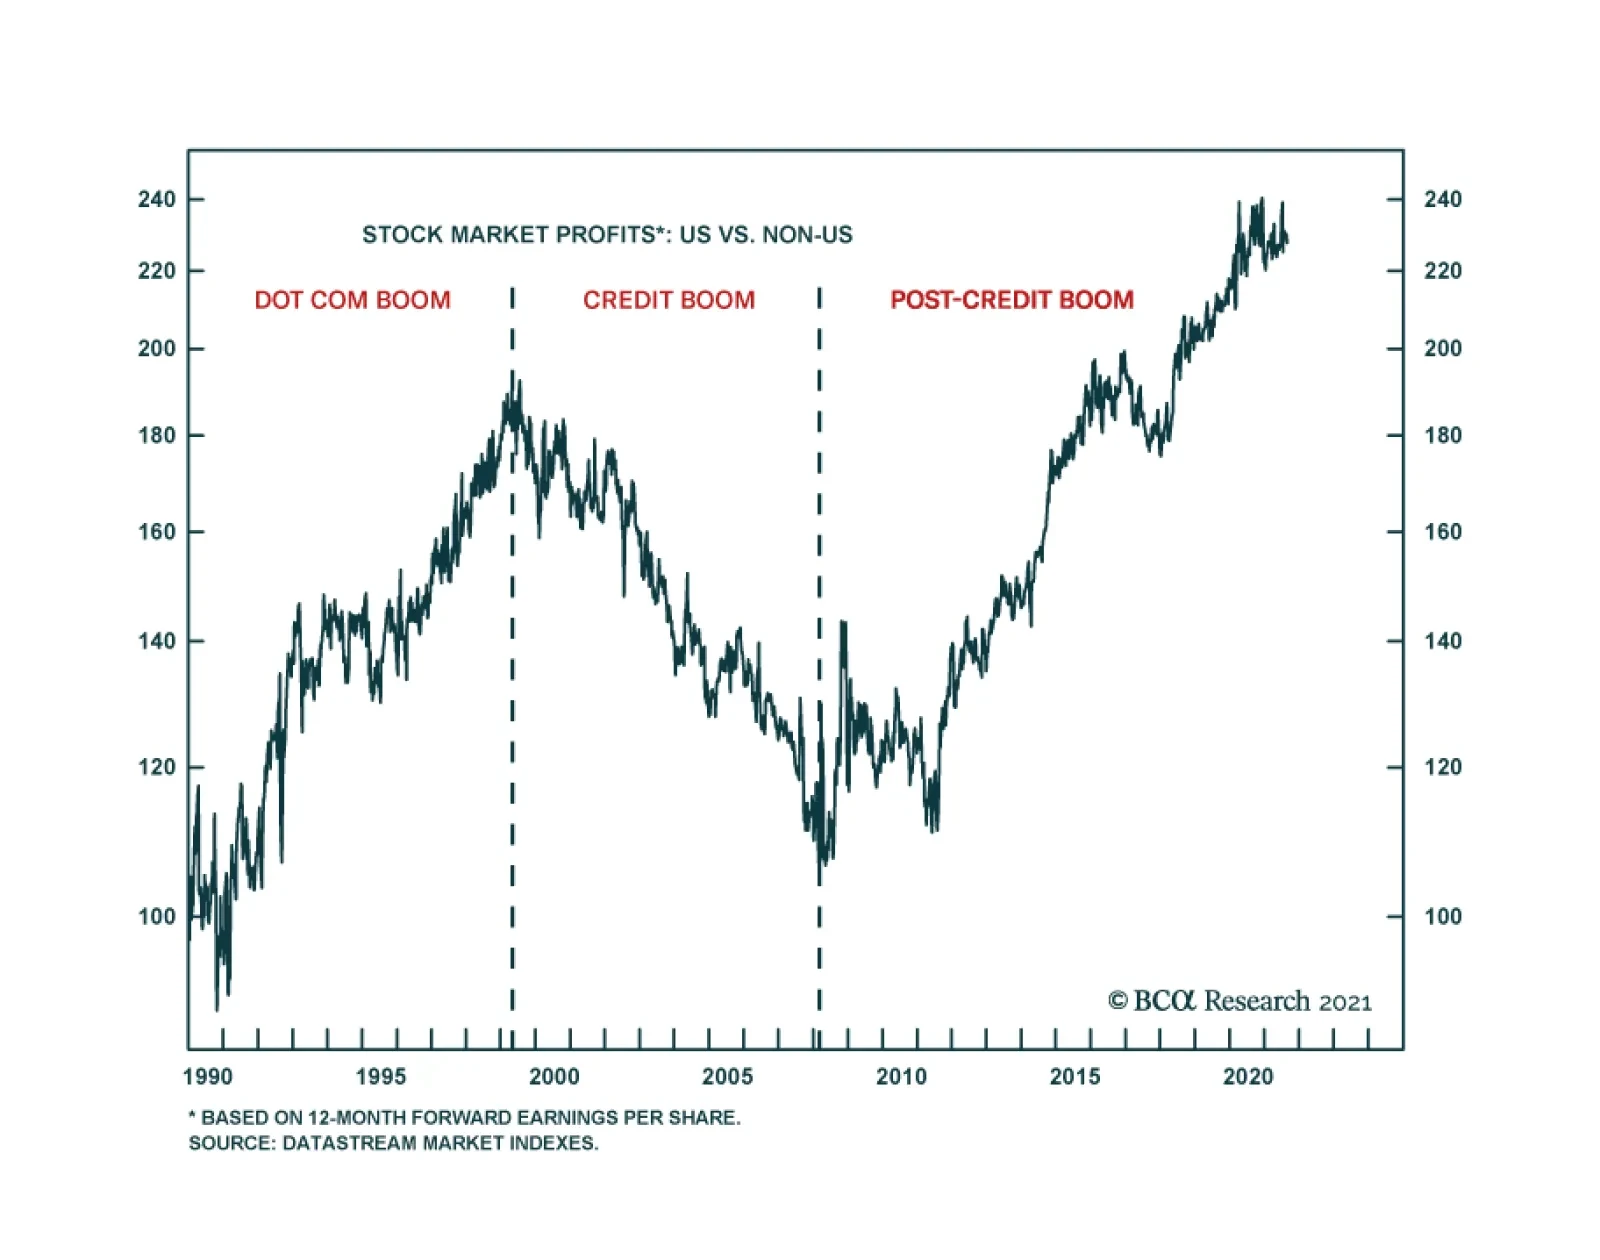
Since 1990, there have been three distinct phases for investors: the dot com boom; the credit boom; and the post-credit boom. The first phase was the 1990s build-up to the dot com boom. This phase clearly favoured growth sectors, and thereby the US stock…
Highlights The US dollar’s reserve status will remain intact for the foreseeable future. While this privilege is fraying at the edges, there are no viable alternatives just yet. There is an overarching incentive for any country to hold onto its currency’s power. For the US, it is still well within their ability to keep this “exorbitant privilege.” That said, there will be rolling doubts about the ability of the US to maintain its large currency sphere. This will create tidal waves in the currency’s path, providing plenty of trading opportunities for investors. China is on track to surpass the US in economic size, but it is far from dethroning the US in the military realm. However, it is gradually gaining the ability to deny the US access to its immediate offshore areas and may already be capable of winning a war over nearby islands like Taiwan. Watch the RMB over the next few decades. From a macro and cyclical perspective, the dollar is likely to decline as global growth picks up and the Fed lags market expectations in raising rates. From a geopolitical perspective, however, the backdrop is neutral-to-bullish for the dollar over the next three to five years. Feature Having the world’s reserve currency comes with a few advantages, which any governments would be loath to give up. The most important advantage is the ability to settle one’s balance of payments in one’s own currency. This not only facilitates trade for the reserve nation, it also reinforces the turnover of the reserve currency internationally. The value of this privilege is as much symbolic as economic. This “first mover advantage” or adoption of one’s currency internationally automatically ordains the resident central bank as the world’s bank. The primary advantage here is being able to dictate global financial conditions, expanding and contracting money supply to address domestic and global funding pressures. As compensation for this task, the world provides one with non-negligible seigniorage revenue. Being the world’s central bank also comes with another crucial advantage: being able to choose which international projects will be funded, while using cheaply issued local debt to finance these investments. Of course, any sensible society will earn more on its investments than it pays on the debt issued. There is a geopolitical angle to having the world’s reserve currency. A nation’s currency is widely held because of strategic depth—its ability to secure the people who trade in that currency and the property denominated in it. Deposits and transactions can be monitored, secured, or even halted at the behest of the sovereign. Holding the currency means one can maintain one’s purchasing power, given that it is backed by the most powerful country in the world. As the reserve currency becomes the de facto international medium of exchange, having stood the test of time through various crises, this allows the resident country to alter its purchasing power to achieve both national and international goals. Throughout history, having the world’s reserve currency has been the pursuit of many governments and kingdoms. In the current paradigm, the US enjoys this privilege. But could that change? And if so, how and when? Our goal in this report is threefold. First, why would any country want to maintain reserve status? Second, does the US still possess the apparatus to keep the dollar as a reserve asset over the next decade? And finally, are there any identifiable threats to the US dollar reserve status beyond a ten-year horizon? The Imperative To Maintain Status Quo Global trade is still largely conducted in US dollars. According to the BIS triennial central bank survey, 88.3% of transactions globally were in dollars just before the pandemic, a percentage that has been rather resilient over the last two decades (Chart I-1). It is true that currencies such as the Chinese renminbi have been gaining international acceptance, but displacing a currency that dominates almost 90% of global transactions is a herculean task. Surprisingly, the world has been transacting less often in euros and Japanese yen, currencies that also commanded international appeal in recent history. Chart I-1The US Dollar Still Dominates Global Transactions
Is The Dollar’s Reserve Status Under Threat?
Is The Dollar’s Reserve Status Under Threat?
The big benefit for the US comes from being able to settle its balance of payments in dollars. This not only lowers transaction costs (by lowering exchange rate risk), but it also provides the ability to cheaply borrow in your own currency to pay for imports. Having global trade largely denominated in US dollars also establishes a network of systems that make it much easier to settle trade in that currency. It is remarkable that, despite running a persistent current account deficit, the US dollar has tended to appreciate during crises, a privilege other deficit countries do not enjoy (Chart I-2). Strong network effects make the US dollar the currency of choice during crises. Chart I-2Despite Running A Current Account Deficit, The Dollar Tends To Rise During Crises
Is The Dollar’s Reserve Status Under Threat?
Is The Dollar’s Reserve Status Under Threat?
Chart I-3The US Generates Non-Negligible Seignorage Revenue
The US Generates Non-Negligible Seignorage Revenue
The US Generates Non-Negligible Seignorage Revenue
Being at the center of the global financial architecture comes with an important benefit beyond trade: the ability to dictate financial conditions both domestically and globally. Consider a scenario in which the US and the global economy are facing a downturn. In this scenario, the Federal Reserve can be instrumental in turning the tide: To stimulate the US economy, the Fed lowers interest rates and/or runs a wider fiscal deficit. The central bank helps finance this fiscal deficit by expanding the monetary base (benefitting from seigniorage revenue). As the Fed drops interest rates, the yield curve steepens. Banks use the positive term structure to borrow at the short end of the curve and lend at the longer end. This boosts the US money supply. As firms borrow to invest, this increases demand for imports (machinery, commodities, consumer goods), widening the US current account deficit. US trade is settled in dollars, increasing the international supply of the greenback. To maintain competitiveness, other central banks purchase these dollars from the private sector, in exchange for their local currency. As global USD reserves rise, they can be reinvested back into Treasuries and held in custody at the Fed. In essence, the US can finance its budget deficit through a strong capital account surplus. The seigniorage revenue that the US enjoys by easing both domestic and international financing conditions is about $100 billion a year or roughly 0.5% of GDP (Chart I-3). But the goodwill from being able to dictate both domestic and international financial conditions is far greater. At BCA, one of our favorite measures of global dollar liquidity is the sum of the Fed’s custody holdings together with the US monetary base. Every time this measure has severely contracted in the past, the shortage of dollars has triggered a financial crisis somewhere, typically among other countries running deficits (Chart I-4), a highlight of the importance of the US as a global financier. Chart I-4US Money Supply And Global Liquidity
US Money Supply And Global Liquidity
US Money Supply And Global Liquidity
Chart I-5Despite A Liability Shortfall, US Assets Generate A Net Profit
Despite A Liability Shortfall, US Assets Generate A Net Profit
Despite A Liability Shortfall, US Assets Generate A Net Profit
Beyond seigniorage revenue, the US enjoys another advantage—being able to earn much more on its international investments than it pays on its liabilities. The US generates an excess return of 1% of GDP from its external assets, despite having a net liability shortfall of 67% of GDP (Chart I-5). The ability to issue debt that will be gobbled up by foreigners, and in part use these proceeds to generate a higher overall return on investments made abroad, does indeed constitute an “exorbitant privilege.” In a nutshell, there is a very strong incentive for the US to keep the dollar as the world’s reserve currency. One short-term implication is that the Fed might only taper asset purchases and/or raise interest rates in an environment in which both global and US growth are strong, or it could otherwise trigger a global liquidity crisis. This will be particularly the case given the Delta variant of COVID-19 is still hemorrhaging global economic activity. An Overreach In The Dollar’s Influence There is a political advantage to the US dollar’s reserve status that is often overlooked: transactions conducted in US dollars anywhere in the world fall under US law. In simple terms, if a company in any country buys energy from Iran and the transaction is done in US dollars, the Treasury has powers to sanction the parties involved. Since most companies across the world cannot afford to be locked out of the US financial system, they will tend to comply with US sanctions. Even companies that operate under the umbrella of great powers, such as China and Russia, still tend to adhere to US sanctions, because they do not want to jeopardize their trade with US allies, such as the European Union. Of course, China, Russia, and Iran are actively seeking alternative transaction systems to bypass the dollar and US sanctions. But they do not yet trust each other’s currencies. Chart I-6A Deep And Liquid Pool Of Treasurys
A Deep And Liquid Pool Of Treasurys
A Deep And Liquid Pool Of Treasurys
The euro is the only viable alternative; however, the euro’s share of global transactions has fallen, despite the EU’s solidification as a monetary union over the past decade and despite the unprecedented deterioration of US relations with China and Russia. The EU could do great damage to the USD’s standing if it joined Russia’s and China’s efforts wholeheartedly, but the EU is still a major trading partner of the US and shares many of the same foreign policy aims. It is also chronically short of aggregate demand and runs trade and current account surpluses, depriving trade partners of euro savings or a debt market to recycle those savings (Chart I-6). Historically, having the world’s reserve currency allows the US to conduct international accords that serve both domestic and foreign interests. The Plaza Accord, signed in the 1980s to depreciate the US dollar, served both US interests in rebalancing the deficit and international interests in financing global trade. The 1980s were golden years for Japan and the Asian tigers on the back of a weak USD, allowing entities to borrow in greenbacks and profitably invest in Asian growth. Once the US dollar had depreciated by a fair amount, threatening its store of value, the US engineered the Louvre Accord to stabilize exchange rates. Ultimately, when various Asian bubbles popped, investors thought of nowhere better to flee than to the safety of the US dollar. The same thing happened after the emerging market boom of the 2000s and the eventual bust of the 2010s. Today, the US may not be able to organize an international intervention, if one should be necessary in the coming years. Past experience shows that countries act unilaterally and coordinated interventions lack staying power. Neither Europe nor Japan is in the position today to allow currency appreciation, as they were in the past. And the US has shown itself unable to combat its trading partners’ depreciation, as in the case of China, whose renminbi remains below 2014 levels. The bottom line is that there is nothing to stop the US from attempting to stretch its overreach too far, which would create a backlash that diminishes the dollar’s status. This is especially the case given trust in the US government is quite low by historical standards, which for now points to a lower dollar cyclically (Chart I-7). Chart I-7Trust In The US Government And The Dollar
Is The Dollar’s Reserve Status Under Threat?
Is The Dollar’s Reserve Status Under Threat?
This is not to say that other countries with reserve aspirations can tolerate sustained appreciation. China has recommitted to manufacturing supremacy in its latest five-year plan, as it fears the political consequences of rapid deindustrialization. As such, the renminbi will be periodically capped to maintain competitiveness. Can The US Maintain Status Quo? Chart I-8A Lifespan Of Reserve Currencies
Is The Dollar’s Reserve Status Under Threat?
Is The Dollar’s Reserve Status Under Threat?
Over the last few centuries, reserve currencies have tended to have a lifespan of about 100 years (Chart I-8). The reason is that global wars tend to knock the leading power off its geopolitical pedestal, devaluing its currency and giving rise to a new peace settlement with a new ascendant country whose currency then becomes the basis for international trade. Such was the case for Spain, France, the UK, and the United States in a pattern of war and peace since the sixteenth century. Granting that the US dollar took the baton from sterling in the 1920s and that the post-World War II peace settlement is eroding in the face of escalating geopolitical competition, it is reasonable to ask whether or not the US might lose its grip on this power. To assess this possibility, it is instructive to revisit the anatomy of a reserve currency: Typically, a reserve currency tends to be that of the “greatest” nation. For the same reason, the reserve nation tends to be the wealthiest, which ensures that its currency is a store of value and that it can act as a buyer of last resort during crisis (Chart I-9). This reasoning is straightforward when a global empire is recognizable and unopposed. But in the current context of multipolarity, or great power competition, the paradigm could start to shift. Global trade is slowing globally, but it is accelerating in Asia (Chart I-10). China is a larger trading partner than the US for many emerging markets and is slated to surpass the US economy over the next decade. The renminbi has a long way to go to rival the dollar, but it is gradually rising and its place within the global reserve currency basket is much smaller than its share of global trade or output, implying room for growth (Chart I-11). Chart I-9Wealth And Reserve Currency Status Go Hand-In-Hand
Is The Dollar’s Reserve Status Under Threat?
Is The Dollar’s Reserve Status Under Threat?
Chart I-10Trade In Asia Is Booming
Is The Dollar’s Reserve Status Under Threat?
Is The Dollar’s Reserve Status Under Threat?
Chart I-11Adoption Of The RMB Has Room To Grow
Adoption Of The RMB Has Room To Grow
Adoption Of The RMB Has Room To Grow
To maintain hegemonic power (especially controlling the vital supply routes of prosperity), the reserve nation needs military might above and beyond everyone else. It helps that US military spending remains the biggest in the world, in part financed by US liabilities (Chart I-12). China is far from dethroning the US in the military realm. But it is gradually gaining the ability to deny the US access to its immediate offshore areas and may already be capable of winning a war over nearby islands like Taiwan. Moreover, its naval power is set to grow substantially between now and 2030 (Table I-1). Already, over the past decade, the US stood helplessly by when Russia and China annexed Crimea and the reefs of the South China Sea. It is possible to imagine a series of events that erode US security guarantees in the region, even as the US loses economic primacy. Chart I-12The US Still Maintains Military Might
Is The Dollar’s Reserve Status Under Threat?
Is The Dollar’s Reserve Status Under Threat?
Table I-1China’s Economic And Naval Growth Slated To Reduce American Primacy In Asia Pacific
Is The Dollar’s Reserve Status Under Threat?
Is The Dollar’s Reserve Status Under Threat?
The reserve currency nation needs to run deficits to finance activity in the rest of the world. That requires having deep and liquid capital markets to absorb global savings. There is considerable trust or “goodwill” that makes the US Treasury market the most liquid debt exchange pool in the world. This remains the case today (previously mentioned Chart I-6). Even so, this trend is shifting. The growth in euro- and yen-denominated debt is exploding. This mirrors the gradual shift in the allocation of FX reserves away from dollars into other currencies. If the US began to use the dollar as a geopolitical weapon recklessly, foreign entities may have no other choice but to rally into other currency blocks, including the euro (and perhaps eventually the yuan). This will take years, but it is worth noting that global allocation to FX reserves have fallen from around 80% toward USDs in the 70s to around 60% today (Chart I-13). Chart I-13The Dollar Reserve Status Has Been Ebbing
The Dollar Reserve Status Has Been Ebbing
The Dollar Reserve Status Has Been Ebbing
On the political front, there is some evidence that public opinion on the dollar is fading, although it is far from damning. A Pew survey on the trust in the US government is near decade lows and has tracked the ebb and flow of changes in the dollar (previously shown Chart I-7). Trust in government will probably not get much worse in the coming years, as the pandemic will wane and stimulus will secure the economic recovery, but too much stimulus could conceivably ignite an inflation problem that weighs on trust. True, populism has driven the US government under two administrations into extreme deficit spending. With the pandemic as a catalyst, US deficits have reached WWII levels despite the absence of a war. However, the Biden administration’s $3.5 trillion spending bill will be watered down heavily – and the 2022 midterms will likely restore gridlock in Congress, freezing fiscal policy through at least 2025. In other words, fiscal policy is negative for the dollar in the very near term, but the fiscal outlook is not yet so extravagant as to suggest a loss of reserve currency status. After all, there is some positive news for the US. The US demonstrated its leadership in innovation with the COVID-19 vaccines; it survived its constitutional stress test in the 2020 election; it is now shifting from failed “nation building” abroad to nation building at home; and its companies remain the most innovative and efficient, judging by global equity market capitalization (Chart I-14). China, meanwhile, is facing the most severe test of its political and economic system since it marketized its economy in 1979. Investors should not lose sight of the fact that, since the rise of President Xi Jinping and Russia’s invasion of Ukraine, global policy uncertainty has tended to outpace US policy uncertainty, attracting flows into the dollar (Chart I-15). Given that China and Russia are both pursuing autocratic governments at the expense of the private economy, it would not be surprising to see global policy uncertainty take the lead once again, confirming the decade trend of global flows favoring the US when uncertainty rises. Chart I-14American Primacy Still Clear In Equity Market
American Primacy Still Clear In Equity Market
American Primacy Still Clear In Equity Market
Chart I-15Higher Policy Uncertainty Good For Dollar
Higher Policy Uncertainty Good For Dollar
Higher Policy Uncertainty Good For Dollar
The bottom line is that the US dollar is gradually declining as a share of the global currency reserve basket, just as the US economy and military are gradually declining as a share of global output and defense spending. Yet the US will remain the first or second largest economy and premier military power for a long time, and the dollar still lacks a viable single replacement. A major war or geopolitical crisis is probably necessary to precipitate a major breakdown. The Iranian Revolution and September 11 attacks both had this kind of effect (see 1979 and 2001 in Chart I-13 above). But COVID-19 is less clear. If China and Europe emerge as more stable than the US, then the post-pandemic aftermath will bring more bad news for the dollar. Investment Implications From a geopolitical perspective, the backdrop is neutral for the dollar beyond the next twelve to eighteen months. An escalating conflict with Iran—which is possible in the near term—would echo the early 2000s and weigh on the currency. But a deal with Iran and a strategic pivot to Asia would compound China’s domestic political problems and likely boost the greenback. Chart I-16US Twin Deficits And The Dollar
US Twin Deficits And The Dollar
US Twin Deficits And The Dollar
From a macro and cyclical perspective, however, the view is clearly negative for the dollar. Over the next five years, the U.S. Congressional Budget Office (CBO) estimates that the U.S. budget deficit will shrink and then begin expanding again to -5% of GDP. If one assumes that the current account deficit will widen somewhat, then stabilize, the twin deficits will be pinned at around -10% of GDP. Markets have typically punished the dollar on rising twin deficits (Chart I-16). This suggests near-term pressure on the dollar’s reserve status is to the downside. EM currencies may hold a key to the performance of the dollar. While most EM economies remain hostage to the virus, a coiled-spring rebound cannot be ruled out as populations become vaccinated. China’s Politburo signaled in July that it will no longer tighten monetary and fiscal policy. We would expect policy easing over the next twelve months to ensure the economy is stable in advance of the fall 2022 party congress. If the virus wanes and China’s economy is stimulated, global growth will improve and the dollar will fall. Chester Ntonifor Foreign Exchange Strategist chestern@bcaresearch.com Matt Gertken Geopolitical Strategist mattg@bcaresearch.com