United States
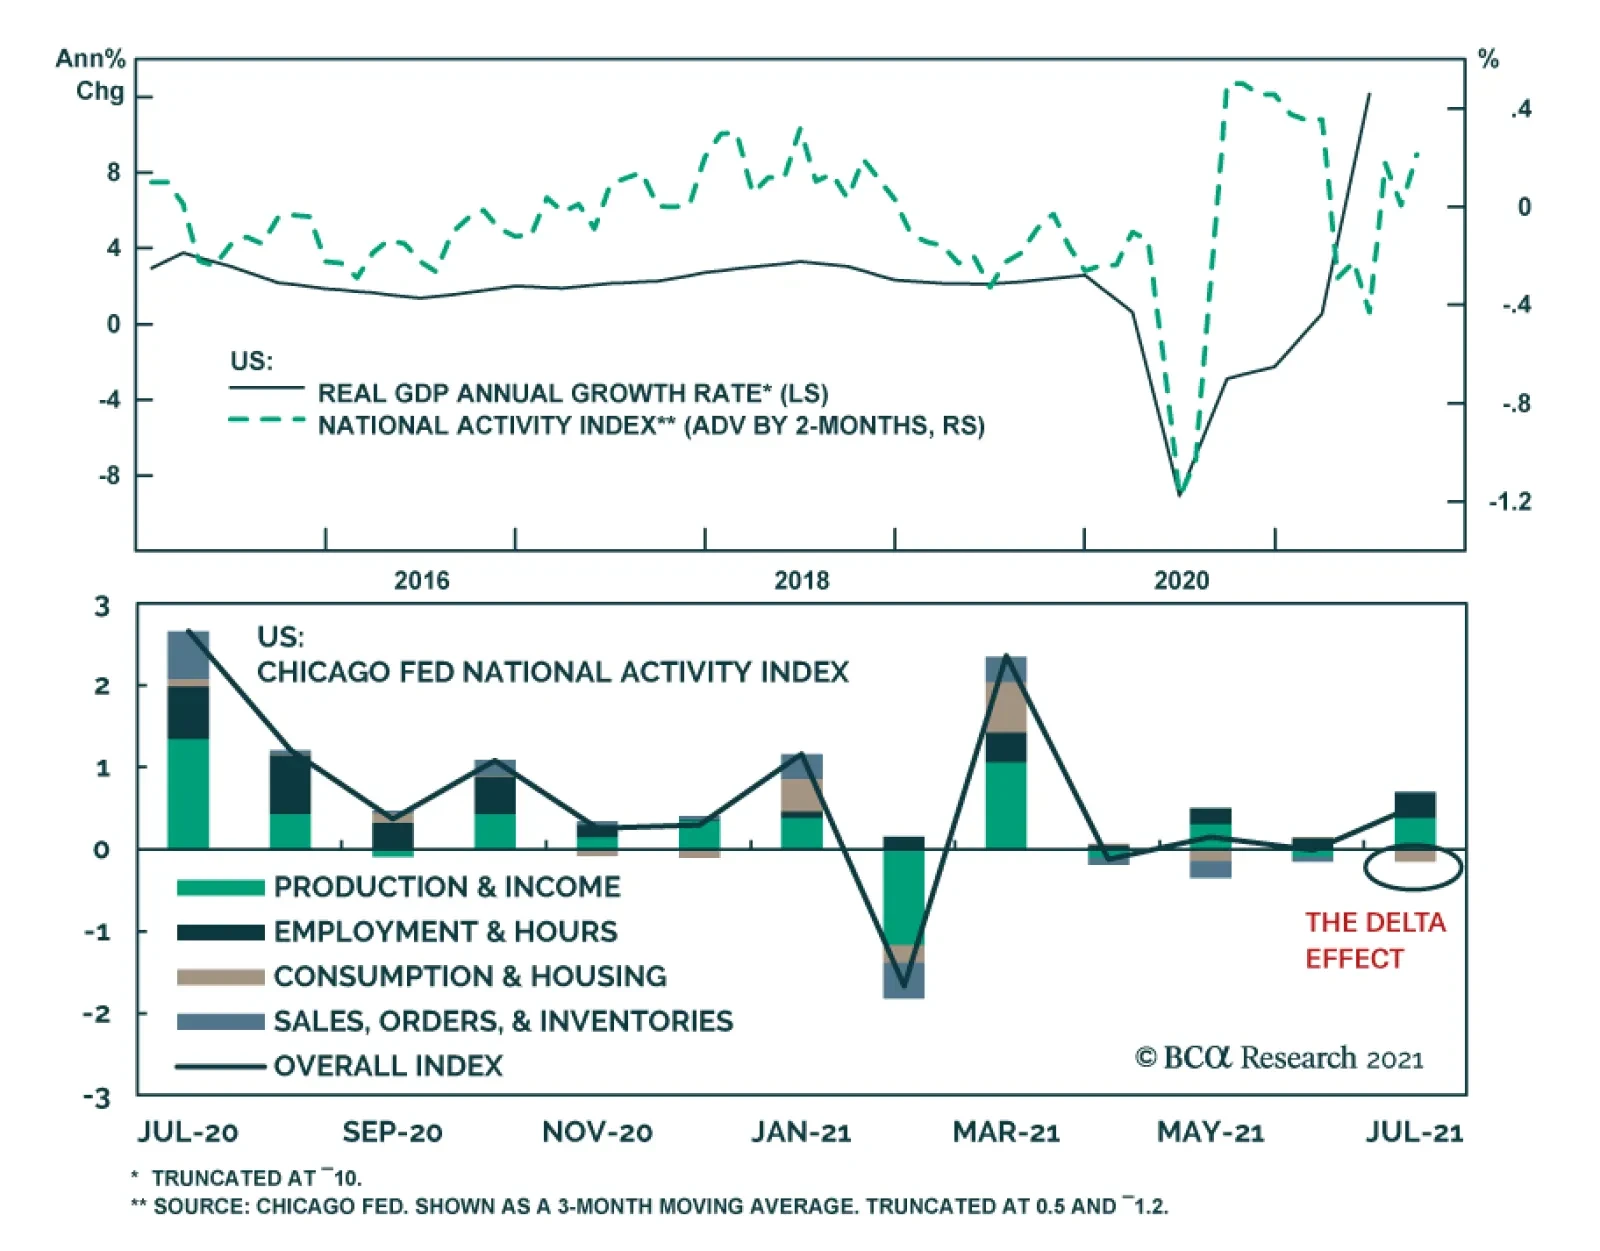
The Chicago Fed National Activity Index surprised to the upside in July, rising to 0.53 from -0.01, and beating expectations of 0.12. The positive reading suggests that the US economy grew at an above-trend pace which is favorable for the outlook for US…
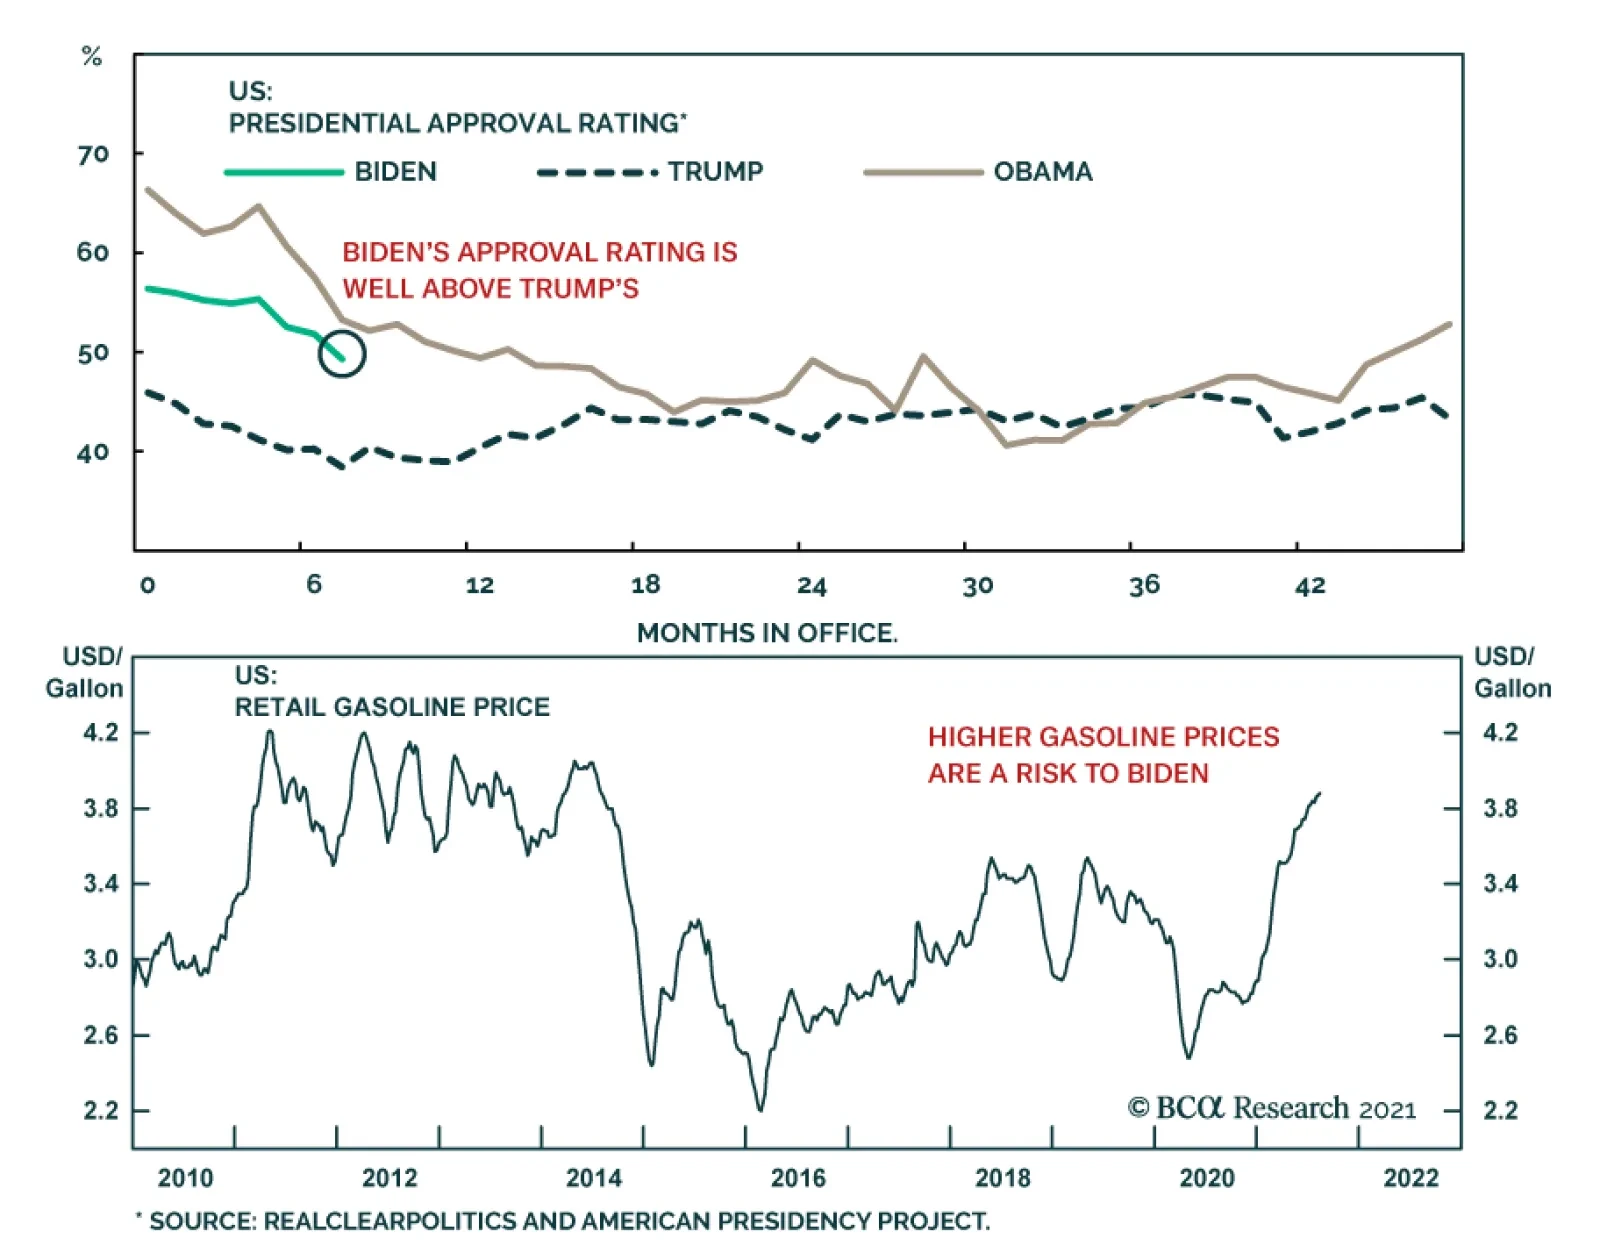
US President Joe Biden's approval rating is tumbling as earlier, optimistic statements about the fight against the pandemic and the withdrawal from Afghanistan have gone up in smoke. However, investors should not conclude that Biden's administration is…
BCA Research's US Investment Strategy service concludes that financial asset valuations are elevated, but a de-rating catalyst may not emerge any time soon. The team considers what is known and what is unknown about equity valuations and lists the series…

Dear Client, There will be no US Investment Strategy next week as we take our summer vacation. We will return on Monday, September 6th. We wish everyone a happy and safe conclusion to the summer. Best regards, Doug Peta Highlights Economy – COVID-19 and the official and individual responses to it continue to exert considerable influence over economic activity: We expect that labor force participation and employment will rise as people return to the workforce, provided that resurgent infection rates don’t provide a new reason to stay on the sidelines. Markets – Financial asset valuations are elevated, but a de-rating catalyst may not emerge any time soon: Massive infusions of fiscal aid and a Fed that is determined to err on the side of being too easy should support the fundamental backdrop, even as the Delta variant runs wild in communities with low vaccination rates. Strategy – Be alert, but stay the course unless policy makers change direction or their measures lose their force: We continue to expect that risk assets will outperform Treasuries and cash. Feature Labor Day, just two weeks away, will mark the unofficial end of summer in the United States and this year the end of August will mark its own milestone: eighteen months of the pandemic. COVID-19’s year-and-a-half residency has been filled with uncertainty and misdirection, but it now seems clear that it will be staying for good. It is disheartening to concede that we will have to accommodate an unwanted malign presence, especially when we seemed to be on the verge of cornering and trapping it. The emotional letdown may have accounted for the slide in consumer confidence, but it is important to note that the virus we’ll be living with indefinitely has morphed from a peril to a nuisance. One constant amidst the pandemic confusion has been the federal shock-and-awe campaign to protect the economy from its ravages. The Fed went big immediately, cutting the fed funds rate to zero, instituting $120 billion of monthly securities purchases and unveiling a range of novel programs to ease financial stresses. Before the first month was out, Congress passed the gigantic CARES Act package, raining money down on the unemployed and households in all but the top quartile of the income distribution. It followed up with a more modest stopgap measure in late December before embarking on the largest round of economic impact payments this spring. The net effect has been to do more than enough to buffer the economy from the pandemic and push any potential hangover beyond the range of our twelve-month investment timeframe. Away from the constant of the policy efforts, however, there is much that is uncertain about key elements of the economic and market outlook. We do not have a definitive answer about what the future holds for the labor market, consumption, or equity valuations. For each topic we consider what is known, what is unknown and list the series we’ll be monitoring to assess whether our base case is on track. We remain constructive on financial markets and the economy, though we recognize that our conviction levels must be lower given the lack of close empirical comparisons to the current backdrop. We will shift with the data series if they move in ways that convincingly challenge our base-case scenarios. The Work Force Known Factor(s): The pandemic has driven a reduction in labor force participation. After catching up from the cyclical damage inflicted by the Global Financial Crisis, the share of people age 16 and above who are working or looking for work has once again fallen well off its implied demographic pace (Chart 1, top panel). GDP and S&P 500 earnings are making new highs, but labor force participation is still down by 2%, after having fallen a whopping 4.9% at the April 2020 trough (Chart 1, bottom panel). Labor force participation typically slips during recessions, but the pandemic’s peak-to-trough decline was more than five times the decline experienced during the GFC, which held the previous record. Chart 1The Pandemic Washed Away A Chunk Of The Work Force
The Pandemic Washed Away A Chunk Of The Work Force
The Pandemic Washed Away A Chunk Of The Work Force
Unknown Factor(s): The explosion in unemployment while communities were sheltering in place was a foregone conclusion, and it’s easy to see how people might have slipped out of the labor force as they withdrew from jobs that lost their luster. There are more job openings than unemployed people now, though (Chart 2), and there are still 3.2 million fewer people in the labor force than there were before the pandemic. The persistence of high unemployment and low participation is a mystery that no study has fully explained. The most frequently cited hypotheses involve generous unemployment insurance (UI) benefits, difficulty securing care for children or adults, and fear of infection. Chart 2The Labor Market Is Unusually Tight
The Labor Market Is Unusually Tight
The Labor Market Is Unusually Tight
We are skeptical of claims that supplemental UI benefits and the additional cushion provided by the three rounds of direct payments to households are a principal driver. $3,200 per adult ($1,200 in Round 1, $600 in Round 2 and $1,400 in Round 3) is nice but it won’t replace even $10 hourly wages for more than a couple months. UI benefits can’t be blamed for the low participation rate (you can’t collect them if you drop out), and their impact on the unemployment rate may also be less than it’s been cracked up to be. We found a very weak negative relationship between state-level replacement rates (the value of average UI benefits relative to average compensation) and changes in state unemployment rates while the most generous $600 weekly federal UI benefit supplement was in effect (Chart 3). Chart 3State Unemployment Rates Were Indifferent To Replacement Rates
What We Know, What We Don’t, And What We’re Watching
What We Know, What We Don’t, And What We’re Watching
July’s state unemployment rates were inconclusive on the question of whether exiting the federal supplemental UI benefit program reduced unemployment. The 25 states that ended their participation early (Chart 4, top panel) saw a smaller decline in their average unemployment rate than the 26 (including Washington, DC) that remain in the program (Chart 4, bottom panel), but the early-exit states had a lower starting average unemployment rate. Of the 18 states that had statistically significant month-on-month unemployment rate declines, 8 have already exited the supplement UI benefit program and 10 remain. Of the 39 states with statistically significant employment gains, 17 have already exited the supplement UI benefit program and 22 remain. We expect the end of augmented benefits in early September will give the labor market a modest boost, but curtailing benefit supplements does not appear to be a silver bullet for reducing unemployment or increasing participation. Chart 4Much Ado About Nothing
What We Know, What We Don’t, And What We’re Watching
What We Know, What We Don’t, And What We’re Watching
Chart 5Fewer Care Options, Fewer Workers
Fewer Care Options, Fewer Workers
Fewer Care Options, Fewer Workers
We suspect family care burdens have been more of a drag on participation and/or exiting the unemployment rolls. Young children attending school remotely had to have adult supervision, sidelining adults who could not work remotely. Similarly, many workers who relied on outside providers to care for adult family members during the day found themselves unable to work or petrified of exposing their homebound loved ones to the virus if they did. Family care burdens regularly fall more heavily on females than males and the greater decline in aggregate female participation (Chart 5, top panel) and across the below prime-age (second panel), prime-age (third panel) and above prime-age (bottom panel) categories suggests care issues are restraining employment. Infection fears likely waned with the development of effective vaccines and their initially rapid distribution, but the spread of the Delta variant may have rekindled them, especially in areas with low vaccination rates. It will take progress in vaccinating the reluctant and the dissemination of antibodies via new infections to hasten the peak in the Delta wave, which should align with a peak in infection fears. What We’re Watching: Net nonfarm payrolls gains; labor force participation; COVID-19 infections, hospitalizations and deaths; vaccinations; schools’ ability to host in-person learning; ongoing data from states exiting the federal UI benefit; approval of vaccines for children under 12. Consumption Chart 6More Came In, Less Went Out
More Came In, Less Went Out
More Came In, Less Went Out
Known Factor(s): Increased income from fiscal transfers and decreased spending from activity constraints have allowed households to amass $2.3 trillion of excess pandemic savings (Chart 6). Some of the savings went to pay down outstanding debt, with households cutting their credit card balances by 14% before slowly starting to build them back up over the last few months (Chart 7). The combination of less debt and low rates has pushed debt-service burdens to their lowest level in four decades (Chart 8). Powered by savings, financial market gains and home price appreciation, household net worth grew at its fastest five-quarter rate ever from 1Q20 through 1Q21. Chart 7Households Actively De-levered During The Pandemic
... While Credit Card Debt Has Been Left Behind
... While Credit Card Debt Has Been Left Behind
Chart 8Plenty Of Room To Service New Debt
Plenty Of Room To Service New Debt
Plenty Of Room To Service New Debt
Unknown Factor(s): Changes in household net worth lead changes in personal consumption expenditures by two quarters, though 2020 consumption fell way short of the level predicted by the best-fit regression line. We do not know how much of last year’s consumption was lost to the pandemic and how much was merely deferred. We also don’t know where the savings rate will stabilize going forward or how much it might overshoot to the downside before settling into its new longer-run range. Simply put, we don’t know how much households will spend from their newly accumulated stash. We do know, however, that the savings rate fell steadily from the mid-seventies, when the baby boomers began entering their prime working years, to the onset of the GFC (Chart 9). In recent client meetings we have made the conservative assumption that half of the $2.3 trillion of excess savings will be spent by the end of 2022. That would amount to a tailwind equivalent to 5% of a year’s GDP and keep the US growing at well above trend in 2021 and 2022. It remains to be seen, however, how much of their excess savings households will spend and when. Chart 9The Savings Rate Will Come Down
The Savings Rate Will Come Down
The Savings Rate Will Come Down
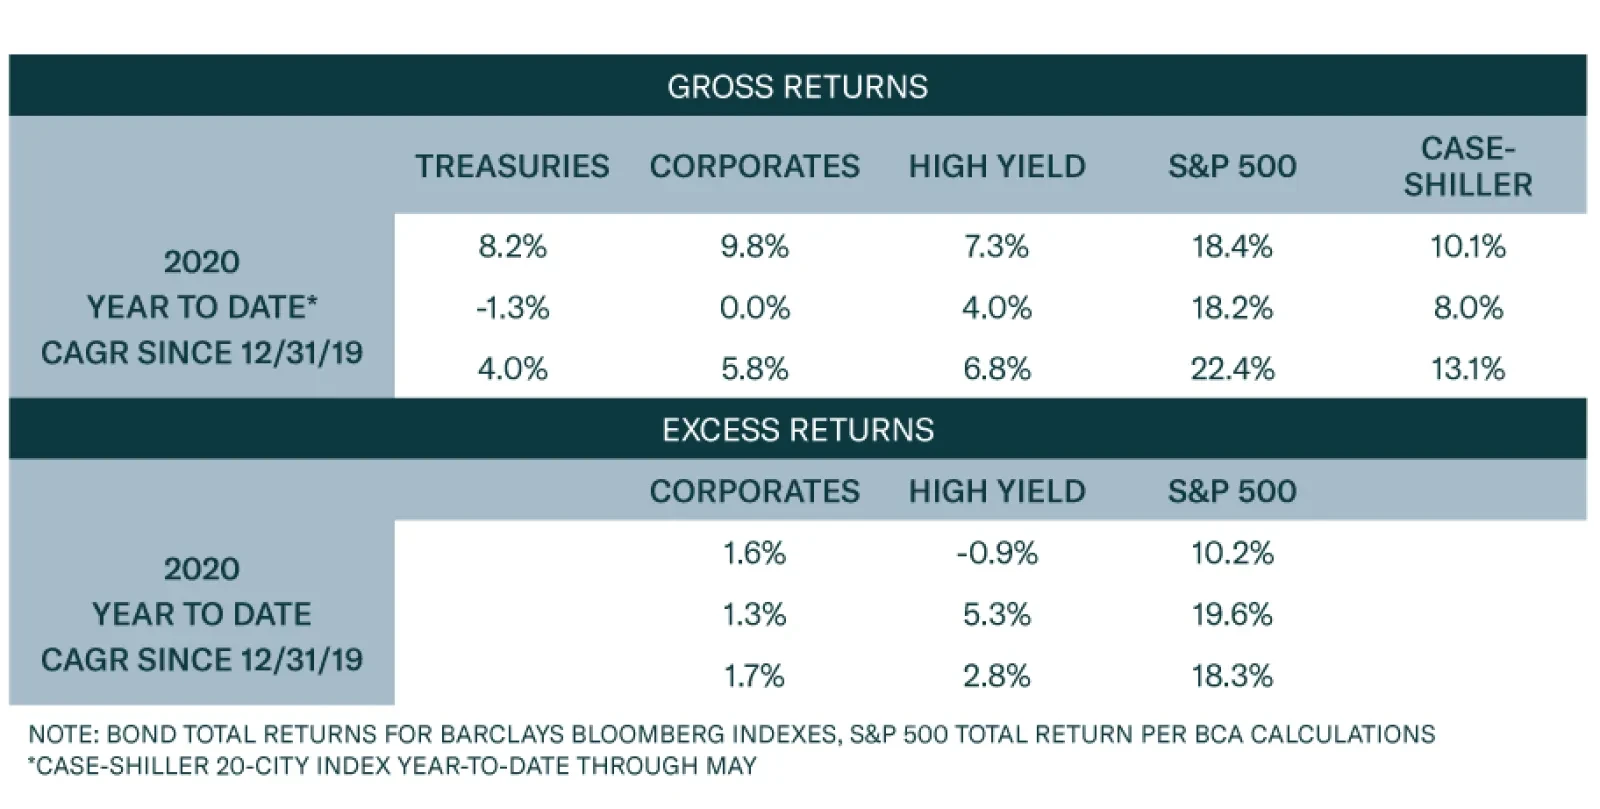
What We’re Watching: Household income, consumption, savings rate, credit card and other consumer loan balances, borrower performance, lender willingness, spending on services and spending on goods. Asset Prices Known Factor(s): Ample and immediate monetary and fiscal accommodation put a floor under financial asset prices at the beginning of the pandemic. Thanks to the policy actions, stock prices have soared, investment grade and high yield bonds have delivered solid excess returns and home prices have surged (Table 1). The S&P 500 has risen 36% on a fundamental boost from an 18% increase in forward four-quarter earnings estimates and a valuation boost in the form of a 15% forward multiple expansion (Chart 10). Investment grade and high yield spreads have tightened to near their all-time lows (Chart 11) while trailing and forecasted defaults are low and rating upgrades are outpacing rating downgrades. Table 1Riskier Assets Are Having A Great Pandemic
What We Know, What We Don’t, And What We’re Watching
What We Know, What We Don’t, And What We’re Watching
Chart 10Fundamentals Have Taken The Baton From Valuation
Fundamentals Have Taken The Baton From Valuation
Fundamentals Have Taken The Baton From Valuation
Unknown Factor(s): We have argued that the next four quarters’ S&P 500 earnings estimates, which project a 1.9% decline from last quarter’s annualized run rate, will have to be revised higher to align with expected nominal annualized GDP growth near 9% in the second half of this year and 6% in the first half of next year. The future direction of forward earnings multiples is a much harder call, as it is largely a function of sentiment. It is also influenced by investors’ asset allocation options, and it does not look to us like TINA is going to be dislodged any time soon, as caution at the major developed world central banks will keep interest rates from gaining much upward momentum and a surfeit of liquidity will keep fixed income spreads tight. We argued with high conviction in a recent Special Report that housing poses no immediate threat to US financial stability because banks have no more than modest exposure to residential mortgages and the loans they have made are eminently sound. We stand by that view and further note that home prices are well supported in the near term by tight supplies and limited new construction activity. Finally, mortgage rates are extremely low and though we expect they will rise, we think they will do so at a slow, grinding pace throughout the second half and across 2022. What We’re Watching: Corporate earnings, interest rates, mortgage availability, flows into and out of risky assets, Fed guidance and anything bearing on risk appetites. Chart 11Don't Look For Further Capital Gains On Bonds
Don't Look For Further Capital Gains On Bonds
Don't Look For Further Capital Gains On Bonds
Investment Implications Investors’ default position seems to be to assume that policy interventions will be exposed as artifice and elevated valuations will soon deflate. Neither has happened yet, however, and it doesn’t look like either will over the next twelve months. The Fed’s measures will have an extended influence because the fed funds rate will likely be zero until at least late 2022, monetary policy works with a lag and it will be a while before policy settings become truly restrictive. As for the fiscal transfers, they’ve largely been squirreled away as excess savings and their effect will only be felt as they’re consumed and/or funneled into financial markets. We don’t see elevated valuations retreating without a catalyst, given the ocean of liquidity in the US and the rest of the major developed economies. The money has to go somewhere as rapidly accelerating home prices around the world attest. Upward pressure on asset prices, especially for homes, has been a reliable source of instability but we don’t yet have concerns in the US, where mortgages have been extended to highly rated borrowers and the banking system has comparatively little exposure to residential loans. We are not saying multiples (or spreads) will remain elevated (tight) forever. We believe that today’s high prices will suppress long-term returns. Conditions look favorable for the next twelve months, however, and we think investors should take advantage of them before the longer-term adverse consequences emerge to weigh on returns. Doug Peta, CFA Chief US Investment Strategist dougp@bcaresearch.com
Dear Client, I will be on vacation next week. In lieu of our regular report, we will be sending you a Special Report written by my colleagues Chester Ntonifor, BCA Research’s Chief Foreign Exchange Strategist, and Matt Gertken, Chief Geopolitical Strategist. Their report discusses the threat to the dollar’s reserve status over the next decade. This week, Matt published a timely report entitled “Afghanistan? Watch Iran And China,” examining the global macro significance of the US withdrawal from Afghanistan. I trust you will find both reports insightful. Best regards, Peter Berezin, Chief Global Strategist Highlights Over the next 12 months, US inflation will decline fast enough to allow the Federal Reserve to maintain its accommodative monetary stance, but not as fast as investors are expecting. A number of structural forces were becoming inflationary even before the pandemic began. The pandemic will only buttress the tide. Even if the virus is eventually vanquished, the pandemic could prop up inflation by permanently reducing labor supply, hastening the retreat from globalization, and keeping fiscal policy looser than it otherwise would have been. Fixed-income investors should maintain a short duration stance. We expect the US 10-year Treasury yield to rebound to about 1.8% by early next year. Long-term bond yields in the other major economies will also rise, although not as much as in the US. In and of itself, higher inflation is not necessarily bad for equities. What makes higher inflation toxic for stocks is when it forces central banks to raise rates to punitive levels. Fortunately, such an outcome is still a few years away, justifying an overweight equity position for now. Upside Risks To Inflation In our July 23rd report, we argued that investors were asking the wrong question about inflation. Rather than asking whether higher inflation is transitory, they should be asking whether inflation will decline faster or slower than what the market is discounting. Chart 1Investors Expect Inflation To Fall Rapidly From Current Levels
Transitory At First: The Pandemic’s Long-Term Impact On Inflation
Transitory At First: The Pandemic’s Long-Term Impact On Inflation
Chart 1 shows that investors expect inflation to fall rapidly from current levels and to remain subdued thereafter. The widely followed 5-year/5-year forward TIPS breakeven inflation rate currently stands at 2.12%, below the Fed’s comfort zone of 2.3%-to-2.5% (Chart 2).1 Chart 2Below-Target Inflation Expectations And A Low R* Have Restrained Bond Yields
Below-Target Inflation Expectations And A Low R* Have Restrained Bond Yields
Below-Target Inflation Expectations And A Low R* Have Restrained Bond Yields
Downbeat long-term inflation expectations and the market’s perception that the neutral rate of interest is very low are the two main reasons why bond yields are so depressed. QE programs have also dampened yields, although not nearly as much as widely believed. Chart 3Outside Of A Few Pandemic-Related Sectors, The CPI Has Yet To Return To Trend
Outside Of A Few Pandemic-Related Sectors, The CPI Has Yet To Return To Trend
Outside Of A Few Pandemic-Related Sectors, The CPI Has Yet To Return To Trend
In our report, we contended that US inflation would come down fast enough over the next few quarters to allow the Federal Reserve to maintain its accommodative monetary stance, but not as fast as investors are expecting. On the one hand, the evidence clearly shows that most of the recent increase in US inflation has been driven by just a few pandemic-related sectors (Chart 3). On the other hand, high levels of excess household savings, the need for firms to expand capacity and rebuild inventories, and continued policy support will boost output and prices. The Long-Term Inflationary Consequences Of The Pandemic We also argued that a variety of structural forces, including the exodus of baby boomers from the labor market, a retreat from globalization, and increasing social unrest, would drive up inflation over the long haul. A key question is how the pandemic will shape these structural forces going forward. As we discuss below, there are three main overlapping channels through which the pandemic could have a lasting impact on inflation: Labor market scarring: Even if the virus is eventually vanquished, the pandemic could still permanently reduce the labor supply. Widespread worker shortages would fuel inflation. Deglobalization: Globalization has historically been a deflationary force. The pandemic could accelerate the retreat from globalization by prompting firms to bring more production back home, while exacerbating geopolitical tensions. Fiscal policy: Big budget deficits could persist in the post-pandemic period. Debt-saddled governments may turn to inflation to erode their debt burdens. Let us assess these three channels in turn. Channel #1: Labor Market Scarring Despite July’s blockbuster employment report, there are still nearly 4% fewer Americans employed than was the case in January 2020. Yet, US businesses are struggling to hire workers (Chart 4). Nationwide, the job openings rate stands at a record 6.5%, up from 4.5% on the eve of the pandemic (Chart 5). Chart 4US Companies Are Facing A Labor Shortage
US Companies Are Facing A Labor Shortage
US Companies Are Facing A Labor Shortage
Chart 5There Are Plenty Of Jobs Available
There Are Plenty Of Jobs Available
There Are Plenty Of Jobs Available
Generous unemployment benefits, less immigration, and the reluctance of many workers to expose themselves to the virus have all helped to reduce labor supply. A marked shift in the composition of spending has increased the demand for workers in some sectors while reducing demand in other sectors (Chart 6). Since labor is not perfectly fungible across sectors, this has caused overall unemployment to rise. Chart 6Which Sectors Have Gained And Which Have Lost Jobs Since The Pandemic?
Transitory At First: The Pandemic’s Long-Term Impact On Inflation
Transitory At First: The Pandemic’s Long-Term Impact On Inflation
Looking out, labor supply should increase as emergency unemployment benefits expire, immigration picks up, and more people are vaccinated. The mismatch of workers across sectors should also diminish as goods and services spending rebalances. Nevertheless, there is considerable uncertainty over how quickly all this will happen. According to Indeed, an online job posting site, unemployed workers cited having a “financial cushion” as the most popular reason for not looking for a job in July (Chart 7). Given that American households are sitting on $2.4 trillion in excess savings, it may take some time for this cushion to deflate (Chart 8). Chart 7Americans Are Not Desperate To Find Work
Transitory At First: The Pandemic’s Long-Term Impact On Inflation
Transitory At First: The Pandemic’s Long-Term Impact On Inflation
Chart 8A Lot Of Excess Savings
A Lot Of Excess Savings
A Lot Of Excess Savings
Chart 9No Jab, No Job
Transitory At First: The Pandemic’s Long-Term Impact On Inflation
Transitory At First: The Pandemic’s Long-Term Impact On Inflation
Wider vaccine mandates could also impact labor market participation. A host of major companies, ranging from Google to Citigroup, are requiring their employees to be inoculated before returning to the office (Chart 9). The Pentagon has laid out a plan endorsed by President Biden obliging members of the military to get the COVID-19 vaccine. Earlier this week, the Las Vegas Raiders became the first NFL team to require fans to produce proof of vaccination to gain entry to home games. On the one hand, vaccine mandates could encourage more people to get the jab, which should help curb the pandemic and boost employment in the service sector. While the numbers have improved in recent weeks, only 57% of Americans between the ages of 18 and 64 are fully vaccinated (Chart 10). On the other hand, some people might opt for unemployment over a vaccine. According to a recent YouGov poll, about half of all unvaccinated Americans believe that the government is using COVID-19 vaccines to microchip the population (Chart 11). The threat of losing one’s job is unlikely to sway many of them. Chart 10Many Workers Remain Unvaccinated
Transitory At First: The Pandemic’s Long-Term Impact On Inflation
Transitory At First: The Pandemic’s Long-Term Impact On Inflation
Chart 11One In Five Americans Believes The US Government Is Using The Covid-19 Vaccine To Microchip The Population
Transitory At First: The Pandemic’s Long-Term Impact On Inflation
Transitory At First: The Pandemic’s Long-Term Impact On Inflation
Pandemic-induced shifts in work-life preferences could also reduce labor supply. According to Ipsos, a polling firm, most employees would prefer to work remotely at least part of the time, with 25% indicating they do not want to return to their workplace at all (Chart 12). The same poll found that 30% of workers would consider looking for another job if their employer required them to work away from home full time (Chart 13). Chart 12Let’s Chat Around The Water Cooler On Tuesdays And Wednesdays
Transitory At First: The Pandemic’s Long-Term Impact On Inflation
Transitory At First: The Pandemic’s Long-Term Impact On Inflation
Chart 13What Is The Opposite Of A “One Size Fits All” Work Environment?
Transitory At First: The Pandemic’s Long-Term Impact On Inflation
Transitory At First: The Pandemic’s Long-Term Impact On Inflation
Chart 14Number Of Retired People Jumped During The Pandemic
Number Of Retired People Jumped During The Pandemic
Number Of Retired People Jumped During The Pandemic
If remote working boosted productivity, as some have claimed, this would not be such a bad thing. However, it is far from clear that this is the case. A recent University of Chicago study of 10,000 skilled professionals from an Asian IT company revealed that work-from-home policies decreased productivity by 8%-to-19%. Early retirement has also reduced labor supply. The share of retirees in the US population rose by 1.3 percentage points between February 2020 and July 2021, with most of the increase occurring early in the pandemic (Chart 14). Based on pre-pandemic demographic trends, the retirement rate should have risen by only 0.5 percentage points over this period. The good news, as discussed in a recent study by the Kansas City Fed, is that most of the increase in the retirement rate was driven by fewer people transitioning from retirement back into employment. The share of people transitioning from employment to retirement did not change much (Chart 15). This led the authors to conclude that “More retirees may rejoin the workforce as health risks fade, but the retirement share is unlikely to return to a normal level for some time.” Chart 15Increased Retirees: A Closer Look
Transitory At First: The Pandemic’s Long-Term Impact On Inflation
Transitory At First: The Pandemic’s Long-Term Impact On Inflation
Bottom Line: Labor supply will recover as the pandemic recedes. Nevertheless, the available pool of workers will likely be lower in the post-pandemic period than it would have otherwise been. A shortage of workers will prop up wage growth, helping to fuel inflation. Channel #2: Deglobalization Globalization was on the back foot even before the pandemic began. Having steadily increased between 1991 and 2008, the ratio of global trade-to-output was basically flat during the 2010s (Chart 16). Ironically, the pandemic has revived global trade by shifting the composition of spending away from non-tradable services towards tradable goods. This shift in spending is the key reason why shipping costs have soared in recent months (Chart 17). Chart 16Globalization Plateaued Over A Decade Ago
Globalization Plateaued Over A Decade Ago
Globalization Plateaued Over A Decade Ago
Chart 17Shipping Costs Have Soared In Recent Months
Shipping Costs Have Soared In Recent Months
Shipping Costs Have Soared In Recent Months
The rebound in trade will not endure. Already, we are seeing companies moving production back home to establish greater control over their supply chains. The pandemic has exacerbated geopolitical tensions between China and the US. Recriminations about how the pandemic began and what China could have done to stop it will not go away anytime soon. Trade bloomed during Pax Britannica, when Great Britain ruled the waves, and then again during Pax Americana, when the US controlled the commanding heights. As BCA’s geopolitical team has long stressed, the shift to a multi-polar world is likely to restrain globalization.2 Historically, globalization has been a deflationary force. Trade has allowed countries such as the US that consistently run current account deficits to satiate excess demand for goods with imports, thereby forestalling inflation. Trade has also raised productivity by allowing countries to specialize in those areas in which they have a comparative advantage, while providing a mechanism to diffuse technological know-how around the world. Standard trade theory predicts that less-skilled workers in developed economies will suffer a relative decline in wages in response to rising trade with developing countries. A number of studies have documented that this is precisely what happened after China entered the global trading system.3 Poor workers tend to spend more of their paychecks than either rich workers or the owners of capital. To the extent that deglobalization shifts the balance of economic power back towards blue-collar workers in advanced economies, this will raise overall aggregate demand. Against the backdrop of muted productivity growth, inflation could increase as a consequence. Bottom Line: Globalization is deflationary, while deglobalization is inflationary. The pandemic is likely to reinforce the trend towards deglobalization. Channel #3: Fiscal Policy There was once a time when governments trembled in fear of the bond vigilantes. Those days are long gone. After briefly rising to 4% in June 2009, the US 10-year Treasury yield trended lower over the subsequent decade, even though unemployment fell and government debt rose. The pandemic sent the bond vigilantes scurrying for cover. Negative real yields allowed governments to run budget deficits of previously unimagined proportions during the pandemic. Budget deficits will decline over the next few years, but the aversion to deficit spending will not return. Not anytime soon at least. The IMF expects the cyclically-adjusted primary budget deficit in advanced economies to average 2.6% of GDP between 2022 and 2026, up from 1% of GDP in the 2014-19 period (Chart 18). Even that is probably too conservative, since the IMF’s projections do not include pending legislation such as President Biden’s $550 billion infrastructure package and $3.5 trillion reconciliation budget bill. Chart 18Fiscal Policy: Tighter But Not Tight
Transitory At First: The Pandemic’s Long-Term Impact On Inflation
Transitory At First: The Pandemic’s Long-Term Impact On Inflation
If the growth rate of the economy exceeds the interest rate on government debt, then governments with high debt-to-GDP ratios could run larger budget deficits than governments with low ratios, while still achieving a stable debt-to-GDP ratio over time.4 The problem is that these same governments would face an exponential increase in debt-servicing costs if interest rates were to rise above the growth rate of the economy. This is not a risk for any major developed economy at the moment but could become an issue as spare capacity recedes. At that point, central banks could face political pressure to keep rates low, even if their economies are overheating. The result could be higher inflation. Higher inflation, in turn, would boost nominal GDP growth, putting downward pressure on debt-to-GDP ratios. Bottom Line: While budget deficits will come down over the next few years, governments in developed economies will still maintain looser fiscal policies than before the pandemic. High debt levels could incentivize policymakers to permit higher inflation. Investment Conclusions US inflation will decline over the next 12 months, but not as quickly as markets are discounting. A number of structural forces were becoming inflationary even before the pandemic began. The pandemic will only reinforce the inflationary tide. Fixed-income investors should maintain a short duration stance. We expect the US 10-year Treasury yield to rebound to about 1.8% by early next year as the Delta variant wave fades. Long-term bond yields in the other major economies will also rise, although not as much as in the US. In and of itself, higher inflation is not necessarily bad for equities. What makes higher inflation toxic for stocks is when it forces central banks to raise rates to punitive levels. Fortunately, such an outcome is still a few years away, justifying an overweight equity position for now. The second quarter earnings season was a strong one. Back on July 2nd, analysts expected S&P 500 companies to generate about $45 in EPS in Q2. In the end, they generated at least $52. Analysts expect earnings to decline in absolute terms in Q3 and remain below Q2 levels until the second quarter of next year, when they are projected to grow by a meagre 3.5% year-over-year (Table 1). Table 1US Earnings Estimates Have Upside
Transitory At First: The Pandemic’s Long-Term Impact On Inflation
Transitory At First: The Pandemic’s Long-Term Impact On Inflation
Earnings estimates usually drift lower over time (Chart 19). BCA’s US equity strategists think there is scope for earnings estimates for the second half of this year to rise materially from current levels. This should support US stocks. Along the same lines, above-trend global growth and attractive valuations should buoy stock markets outside the US. Chart 19Analysts Have Been Revising Up Earnings Estimates This Year
Analysts Have Been Revising Up Earnings Estimates This Year
Analysts Have Been Revising Up Earnings Estimates This Year
Peter Berezin Chief Global Strategist peterb@bcaresearch.com Footnotes 1 The Federal Reserve targets an average inflation rate of 2% for the personal consumption expenditures (PCE) index. The TIPS breakeven is based on the CPI index. Due to compositional differences between the two indices, CPI inflation has historically averaged 30-to-50 basis points higher than PCE inflation. This is why the Fed effectively targets a CPI inflation rate of about 2.3%-to-2.5%. 2 Please see Geopolitical Strategy Weekly Report “Hypo-Globalization (A GeoRisk Update),” dated July 30, 2021; and Special Report, “The Apex Of Globalization - All Downhill From Here,” dated November 12, 2014. 3 For example, economists Katharine Abraham and Melissa Kearney have estimated that increased competition from Chinese imports cost the US economy 2.65 million jobs between 1999 and 2016, almost double the 1.4 million jobs lost to automation. Similarly, David Autor and his colleagues found that increased trade with China has led to large job losses for blue-collar workers in the US manufacturing sector. 4 The steady-state debt-to-GDP ratio can be expressed as p/(r-g), where r is the interest rate, g is trend GDP growth, and p is the primary (i.e., non-interest) budget balance. Thus, for example, if the government wanted to achieve a stable debt-to-GDP ratio of 50% and r-g is -2%, it would need to run a primary budget deficit of 0.5*0.02=1% of GDP. However, if the government targeted a stable debt-to-GDP ratio of 200%, it could run a primary budget deficit of 2*0.02=4% of GDP. See Box 1 in our February 22, 2019 report for a derivation of this debt sustainability equation. Global Investment Strategy View Matrix
Transitory At First: The Pandemic’s Long-Term Impact On Inflation
Transitory At First: The Pandemic’s Long-Term Impact On Inflation
Special Trade Recommendations
Transitory At First: The Pandemic’s Long-Term Impact On Inflation
Transitory At First: The Pandemic’s Long-Term Impact On Inflation
Current MacroQuant Model Scores
Transitory At First: The Pandemic’s Long-Term Impact On Inflation
Transitory At First: The Pandemic’s Long-Term Impact On Inflation
Highlights US crude oil output will continue its sharp recovery before leveling off by mid-2022, in our latest forecast (Chart of the Week). The recovery in US production is led by higher Permian shale-oil production, which is quietly pushing toward pre-COVID-19 highs while other basins languish. Permian output in July was ~ 143k b/d below the basin's peak in Mar20, and likely will surpass its all-time high output in 4Q21. Overall US shale-oil output remains ~ 1.1mm b/d below Nov19's peak of 9.04mm b/d, but we expect it to end the year at 7.90mm b/d and to average 8.10mm b/d for 2022. We do not expect US crude oil production to surpass its all-time high of 12.9mm b/d of Jan20 by the end of 2023. Instead, exploration & production (E&P) companies will continue to prioritize shareholders' interests. This means larger shares of free cashflow will go to shareholders, and not to drilling for the sake of increasing output. While our overall balances estimates remain largely unchanged from last month, we have taken down our expectation for demand growth this year by close to 360k b/d and moved it into 2022, due to continuing difficulties containing the COVID-19 Delta variant. Our Brent crude oil forecasts for 2H21, 2022 and 2023 remain largely unchanged at $70, $73 (down $1) and $80/bbl. WTI will trade $2-$3/bbl lower. Feature Chart 1US Crude Recovery Continues
US Crude Recovery Continues
US Crude Recovery Continues
Global crude oil markets are at a transition point. The dominant producer – OPEC 2.0 – begins retuning 400k b/d every month to the market from the massive 5.8mm b/d of spare capacity accumulated during the COVID-19 pandemic. For modeling purposes, it is not unreasonable to assume this will be a monthly increment returned to the market until the accumulated reserves are fully restored. This would take the program into 2H22, per OPEC's 18 July 2021 communique issued following the meeting that produced this return of supply. Thereafter, the core group of the coalition able to increase and sustain higher production – Kuwait, the UAE, Iraq, KSA and Russia – is expected to meet higher demand from their capacity.1 There is room for maneuver in the OPEC 2.0 agreement up and down. We continue to expect the coalition to make supply available as demand dictates – a data-dependent strategy, not unlike that of central banks navigating through the pandemic. This could stretch the return of that 5.8mm b/d of accumulated spare capacity further into 2H22 than we now expect. The pace largely depends on how quickly effective vaccines are distributed globally, particularly to EM economies over the course of this year and next. US Shale Recovery Led By Permian Output While OPEC 2.0 continues to manage member-state output – keeping the level of supply below that of demand to reduce global inventories – US crude oil output is quietly recovering. We expect this to continue into 1H22 (Chart 2). Chart 2Permian Output Recovers Strongly
Permian Output Approaches Pre-Covid Peak
Permian Output Approaches Pre-Covid Peak
The higher American output in the Lower 48 states primarily is due to the continued growth of tight-oil shale production in the low-cost Permian Basin (Chart 3). This has been aided in no small part by the completion of drilled-but-uncompleted (DUC) wells in the Permian and elsewhere. Chart 3E&Ps Favor Permian Assets
Permian Output Approaches Pre-Covid Peak
Permian Output Approaches Pre-Covid Peak
Since last year’s slump, the rig count has increased; however, compared to pre-pandemic levels, the number of rigs presently deployed are not sufficient to sustain current production. The finishing of DUC wells means that, despite the low rig count during the pandemic, shale oil supply has not dipped by a commensurate amount. This is a major feat, considering shale wells’ high decline rates. Chart 4US Producers Remain Focused On Shareholder Priorities
US Producers Remain Focused On Shareholder Priorities
US Producers Remain Focused On Shareholder Priorities
DUCS have played a large role in sustaining overall US crude oil production. According to the EIA, since its peak in June 2020, DUCs in the shale basins have fallen by approximately 33%. As hedges well below the current market price for shale producers roll off, and DUC inventories are further depleted, we expect to see more drilling activity and the return of more rigs to oil fields. We do not expect US crude oil output to surpass its all-time high of 12.9mm b/ of Jan20 by the end of 2023. Instead, exploration & production (E&P) companies will continue to prioritize shareholders' interests. This means only profitable drilling supporting the free cashflow that allows E&Ps to return capital to shareholders will receive funding. US oil and gas companies have a long road back before they regain investors' trust (Chart 4). Demand Growth To Slow We expect global demand to increase 5.04mm b/d y/y in 2021, down from last month's growth estimate of 5.4mm b/d. We have taken down our expectation for demand growth this year by ~ 360k b/d and moved it into 2022, because of reduced mobility and local lockdowns due to continuing difficulties in containing the COVID-19 Delta variant, particularly in Asia (Chart 5).2 We continue to expect the global rollout of vaccines to increase, which will allow mobility restrictions to ease, and will support demand. This has been the case in the US, EU and is expected to continue as Latin America and other EM economies receive more efficacious vaccines. Thus, as DM growth slows, EM oil demand should pick up (Chart 6). Chart 5COVID-19 Delta Variant's Spread Remains Public Health Challenge
Permian Output Approaches Pre-Covid Peak
Permian Output Approaches Pre-Covid Peak
Chart 6EM Demand Growth Will Offset DM Slowdown
EM Demand Growth Will Offset DM Slowdown
EM Demand Growth Will Offset DM Slowdown
Net, we continue to expect demand for crude oil and refined products to grind higher, and to be maintained into 2023, as mobility rises, and economic growth continues to be supported by accommodative monetary policy and fiscal support. If anything, the rapid spread of the Delta variant likely will predispose central banks to continue to slow-walk normalizing monetary policy and interest rates. Global Balances Mostly Unchanged Chart 7Oil Markets To Remain Balanced
Oil Markets To Remain Balanced
Oil Markets To Remain Balanced
Although we have shifted part of the demand recovery into next year, at more than 5mm b/d of growth, our 2021 expectation is still strong. This is expected to continue next year and into 2023 although not at 2021-22 rates. Continued production restraint by OPEC 2.0 and the price-taking cohort outside the coalition will keep the market balanced (Chart 7). We expect OPEC 2.0's core group of producers – Kuwait, the UAE, Iraq, KSA and Russia – will continue to abide by the reference production levels laid out in 18 July 2021 OPEC communique. Capital markets can be expected to continue constraining the price-taking cohort's misallocation of resources. These factors underpin our call for balanced markets (Table 1), and our view inventories will continue to draw (Chart 8). Table 1BCA Global Oil Supply - Demand Balances (MMb/d, Base Case Balances) To Dec23
Permian Output Approaches Pre-Covid Peak
Permian Output Approaches Pre-Covid Peak
Our balances assessment leaves our price expectations unchanged from last month, with Brent's price trajectory to end-2023 intact (Chart 9). We expect Brent crude oil to average $70, $73 and $80/bbl in 2H21, 2022 and 2023, respectively. WTI is expected to trade $2-$3/bbl lower over this interval. Chart 8Inventories Will Continue To Draw
Inventories Will Continue To Draw
Inventories Will Continue To Draw
Chart 9Brent Prices Trajectory Intact
Brent Prices Trajectory Intact
Brent Prices Trajectory Intact
Investment Implications Balanced oil markets and continued inventory draws support our view Brent and refined-product forward curves will continue to backwardate, even if the evolution of this process is volatile. As a result, we remain long the S&P GSCI and the COMT ETF, which is optimized for backwardation. We continue to wait for a sell-off to get long the SPDR S&P Oil & Gas Exploration & Production ETF (XOP ETF). Robert P. Ryan Chief Commodity & Energy Strategist rryan@bcaresearch.com Ashwin Shyam Research Associate Commodity & Energy Strategy ashwin.shyam@bcaresearch.com Commodities Round-Up Energy: Bullish The US EIA expects natural gas inventories at the end of the storage-injection season in October to be 4% below the 2016-2020 five-year average, at 3.6 TCF. At end-July, inventories were 6% below the five-year average (Chart 10). Colder-than-normal weather this past winter – particularly through the US Midwest and Texas natural gas fields – affected production and drove consumption higher this past winter, which forced inventories lower. Continued strength in LNG exports also are keeping gas prices well bid, as Asian and European markets buy fuel for power generation and to accumulate inventories ahead of the coming winter. Base Metals: Bullish The main worker’s union at Chile's Escondida mine, the largest in the world, and BHP reached an agreement on Friday to avoid a strike. The mine is expected to constitute 5% of total mined global copper supply for 2021. China's refined copper imports have been falling for the last three months (Chart 11). Weak economic data – China reported slower than expected growth in retail sales and manufacturing output for July – contributed to lower import levels. Precious Metals: Bullish Gold has been correcting following its recent decline, ending most days higher since the ‘flash crash’ last Monday, facilitated by a drop in real interest rates. The Jackson Hole Symposium next week will provide insights to market participants regarding the Fed’s future course of action and if it is in fact nearing an agreement to taper asset purchases. According to the Wall Street Journal, some officials believe the program could end by mid-2022 on the back of strong hiring reports. This was corroborated by minutes of the FOMC meeting which took place in July, which suggested a possibility to begin tapering the program by year-end. While the Fed stressed there was no mechanical relationship between the tapering and interest rate hikes, this could be bearish for gold, as real interest rates and the bullion move inversely. On the other hand, political uncertainty and a potential economic slowdown in China will support gold prices. Ags/Softs: Neutral Grain and bean crops are in slightly worse shape this year vs the same period in 2020, according to the USDA. The Department reported 62% of the US corn crop was in good to excellent condition for the week ended 15 August 2021, compared to 69% for the same period last year. 57% of the soybean crop was in good-to-excellent shape for the week ending on the 15th vs 72% a year ago. Chart 10
US WORKING NATGAS IN STORAGE GOING DOWN
US WORKING NATGAS IN STORAGE GOING DOWN
Chart 11
Permian Output Approaches Pre-Covid Peak
Permian Output Approaches Pre-Covid Peak
Footnotes 1 Please see our report of 22 July 2021, OPEC 2.0's Forward Guidance In New Baselines, which discusses the longer-term implications of this meeting and the subsequent communique containing the OPEC 2.0 core group's higher reference production levels. It is available at ces.bcareserch.com. 2 S&P Global Platts notes China's most recent mobility restrictions throughout the country will show up in oil demand figures in the near future. We expect similar reduced mobility as public health officials scramble to get more vaccines distributed. Please see Asia crude oil: Key market indicators for Aug 16-20 published 16 August 2021 by spglobal.com. Investment Views and Themes Strategic Recommendations Commodity Prices and Plays Reference Table Trades Closed In 2021 Summary of Closed Trades
Reviewing Q2 Earnings Season
Reviewing Q2 Earnings Season
In this Monday’s Strategy Report we took a deep dive into this quarter’s earnings dynamics across sectors and styles, as well as examined where did the bulk of the market return come from. Return decomposition demonstrates that in 2020, the S&P 500 return was 26%, with 43% contributed by the multiple expansion, and 19% detracted by the earnings contraction: Over the past year, returns have been borrowed from the future, but this year is payback time. The source of the equity returns has shifted from multiple expansion to earnings growth (see chart). The implication is that 12%-17% expected EPS growth (and possibly more if we get a positive earnings surprise) in the upcoming four quarters will propel the markets higher as earnings growth will pick up the baton from multiple expansion. It will also be important to monitor analysts’ targets since this quarter the bar was set too low as a whopping 38% of companies provided negative guidance for the Q2-2021 results. Bottom Line: We are constructive on the prospects of the broad equity market. For more details on our earnings analysis, please refer to this Monday’s Strategy Report.
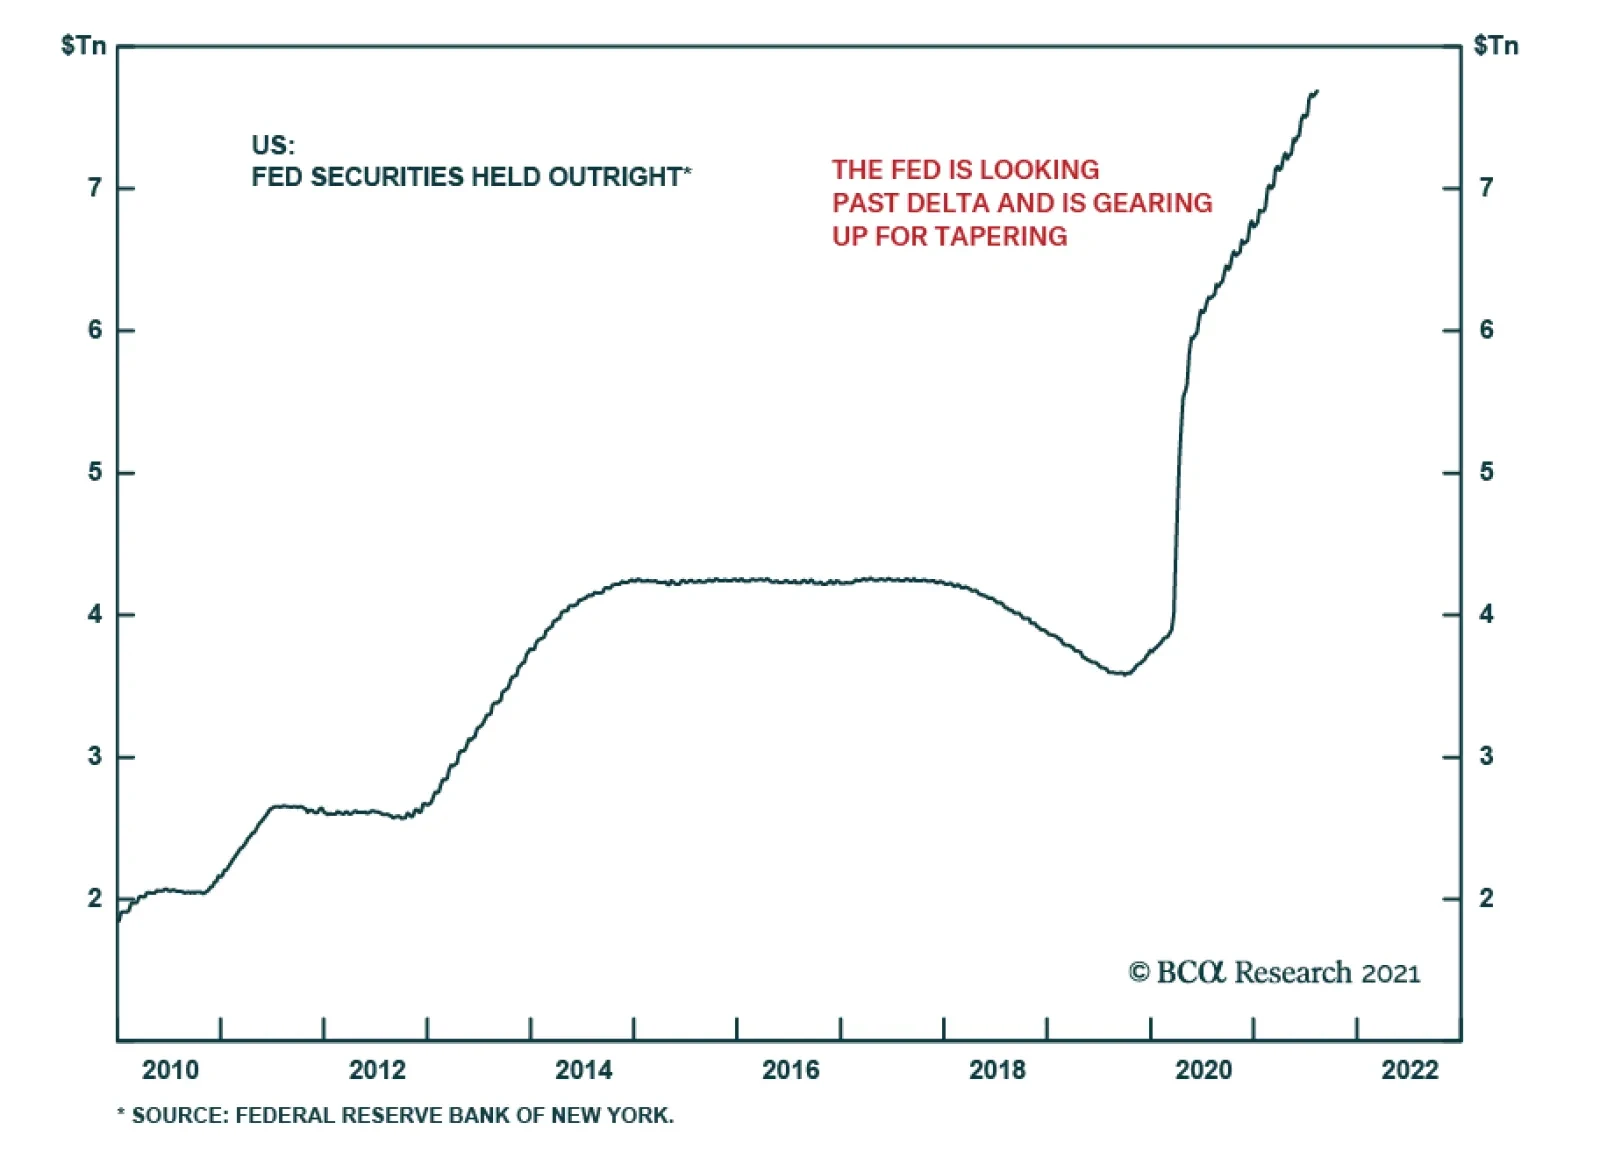
The US Federal Reserve is gearing up for tapering. This is clear from both the minutes of the July FOMC meeting, released yesterday, and the slew of Fed speakers that have lined up behind the idea in recent weeks. Specifically, the July FOMC minutes stated…
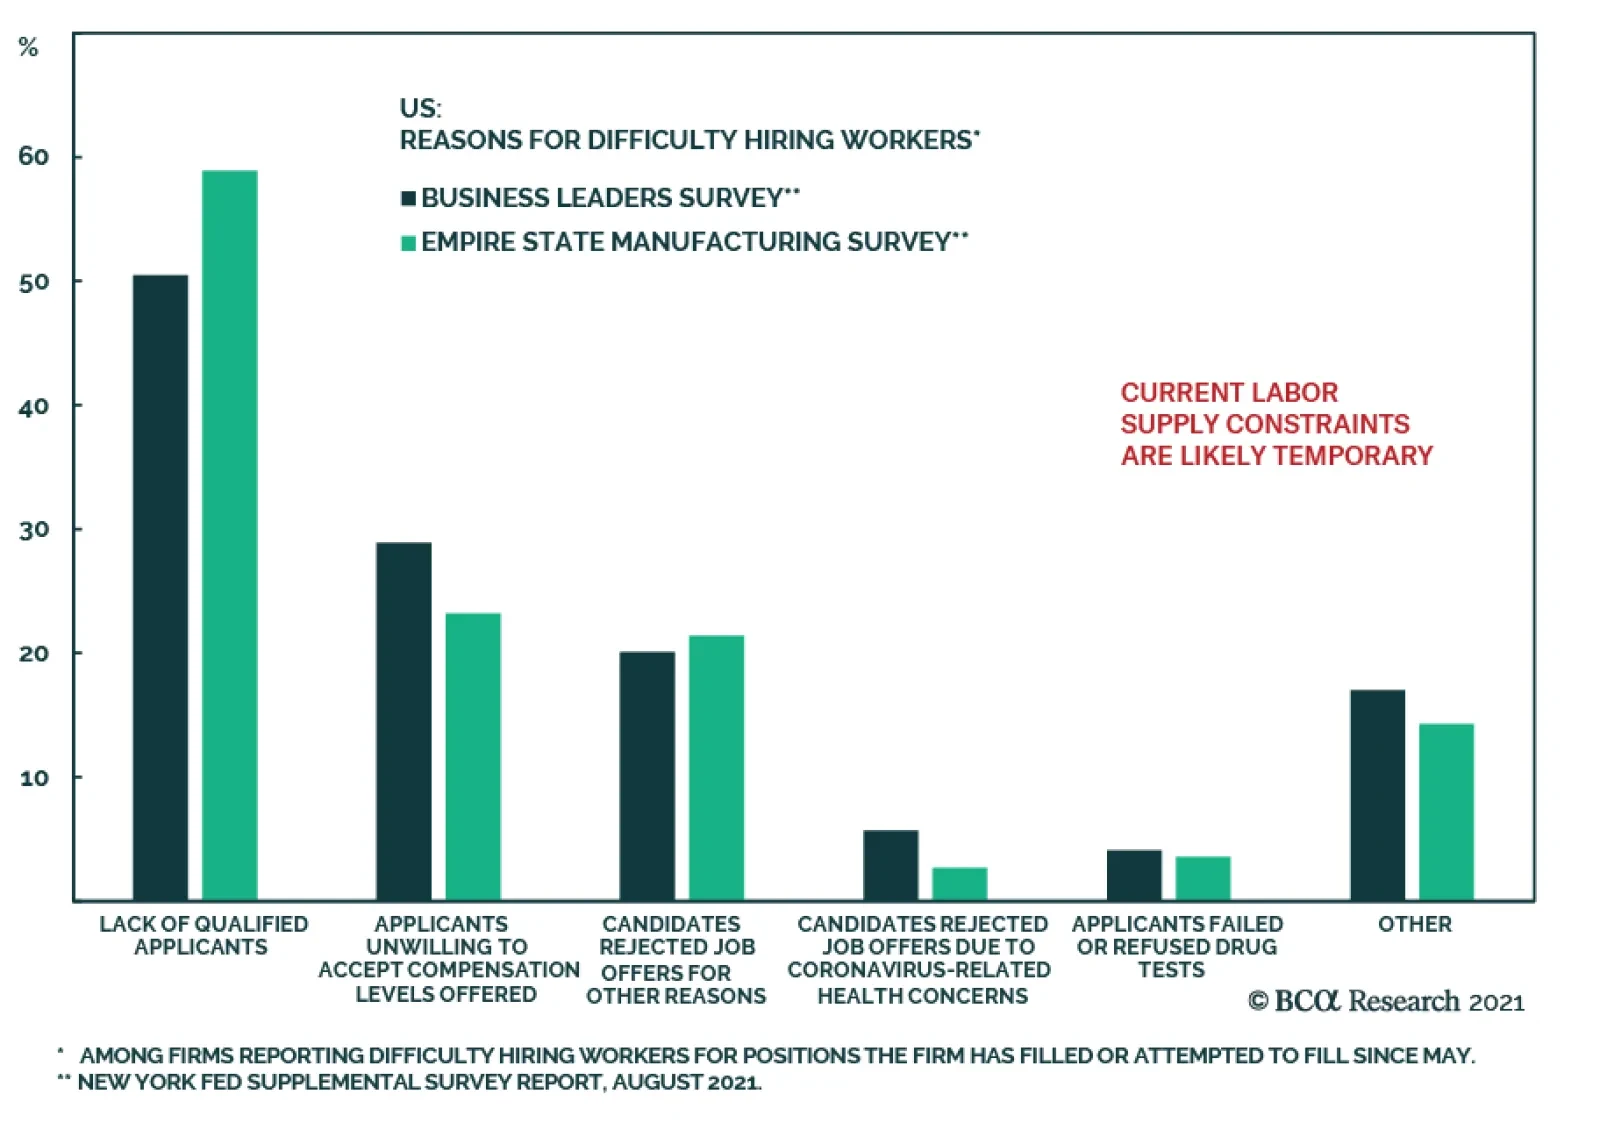
The labor market is the single most important factor for the Fed’s policy normalization timeline. Results from the New York Fed’s supplemental survey in the August Business Leaders and Empire Manufacturing surveys are instructive. Of the roughly 80% of…
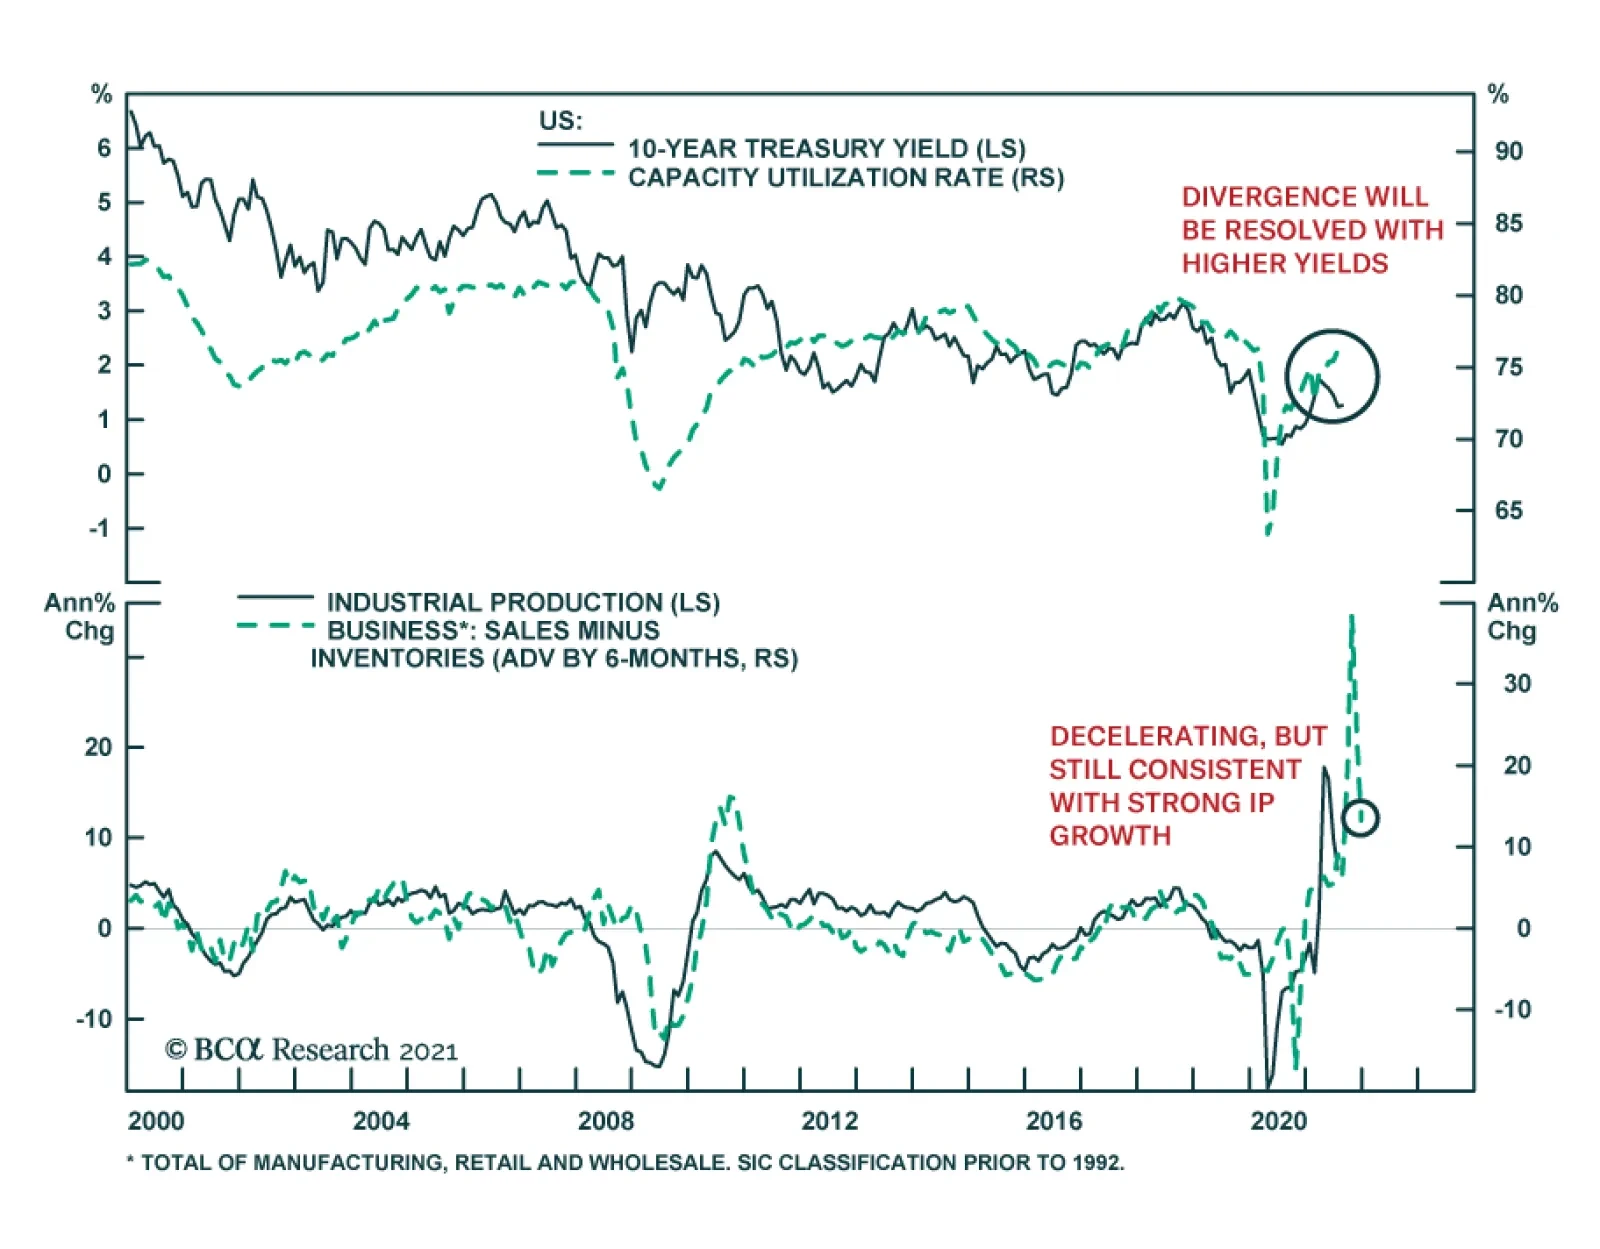
US data releases sent a mixed signal on Tuesday. While retail sales disappointed (see The Numbers), factory output surprised to the upside, rising by the most in four months. Notably, capacity utilization climbed 0.7 percentage points to 76.1%, just shy of…