United States
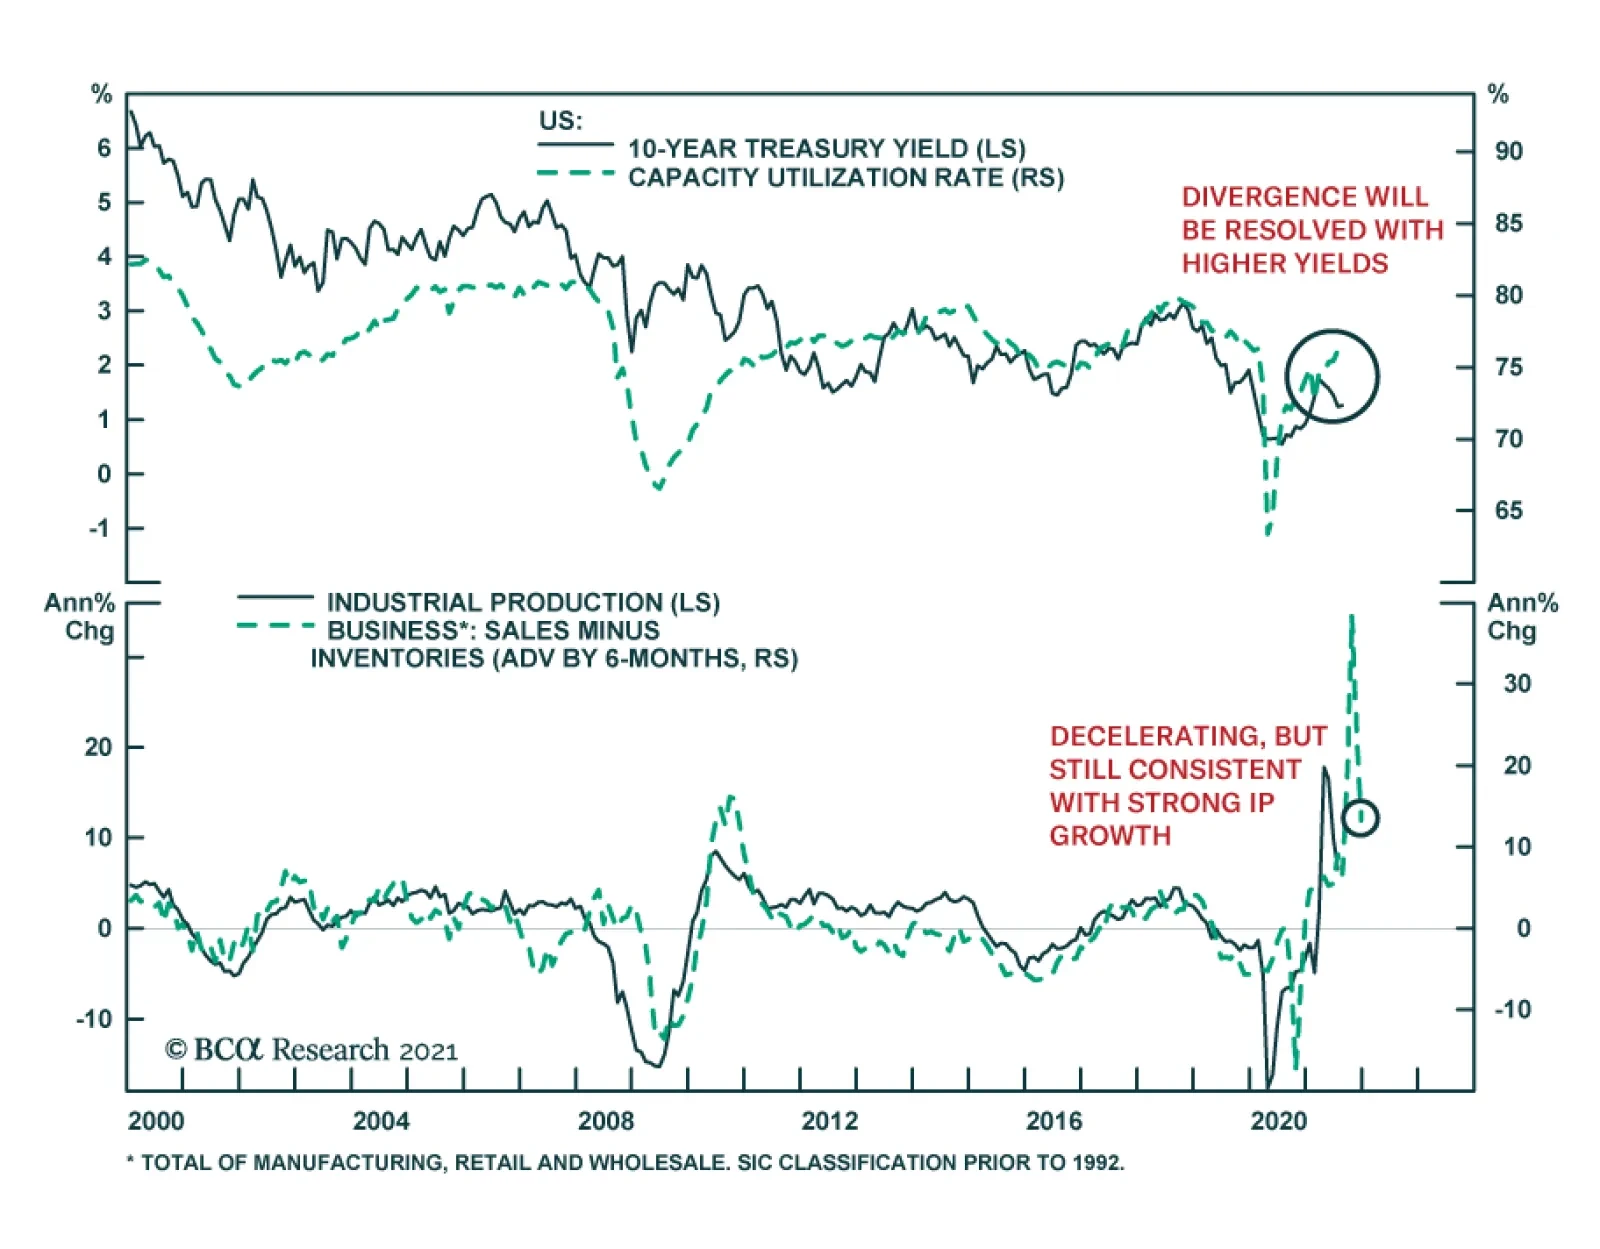
US data releases sent a mixed signal on Tuesday. While retail sales disappointed (see The Numbers), factory output surprised to the upside, rising by the most in four months. Notably, capacity utilization climbed 0.7 percentage points to 76.1%, just shy of…
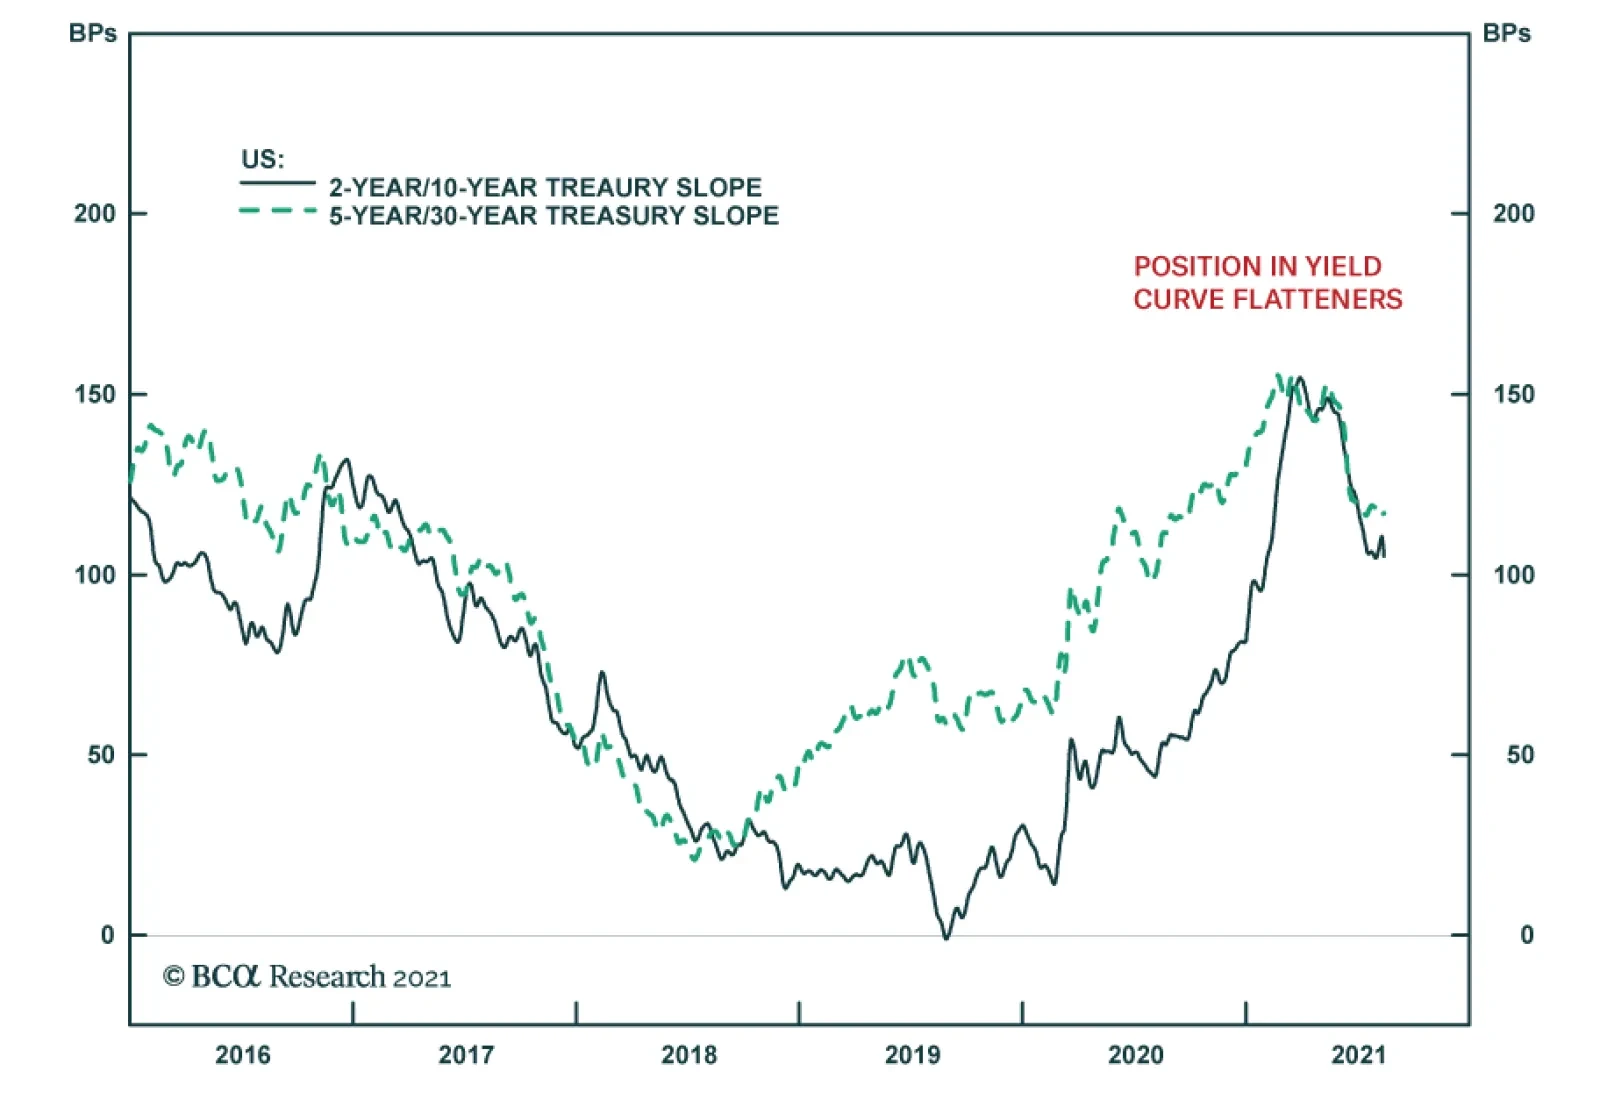
BCA Research’s US Bond Strategists have been highlighting that employment is the single most important indicator when it comes to bond yields. They expect an acceleration in the labor market recovery to spur the next leg up in bond yields and forecast the…

Is The Chip Shortage A Boon or Doom?
Is The Chip Shortage A Boon or Doom?
Overweight Today we are upgrading the Semiconductor industry group to an overweight. Semis received a lot of bad press this year as chip shortages became a major production bottleneck for a range of industries from autos to gaming computers. Semiconductor manufacturers have reduced their capacity during the pandemic and were struggling to ramp up production to meet pent up demand. This industry is highly cyclical and is a high beta play on the global recovery. The chart on the right illustrates that historically, US Semi earnings have been joined at the hip with the global sales and inventory cycles. Global inventories are at all time lows, and a new restocking cycle is in its infancy. A shortage of chips translates into higher prices and strong earnings growth, which is likely to continue far into the future. Street consensus expects 18% EPS growth over the next 12 months. Further, semis stocks have been in a consolidation mode for the first half of 2021 and have accumulated enough dry powder for a new leg higher. This industry group is trading with a 7% discount to the S&P 500 forward earnings multiple (19.8x vs 21.3x) Importantly, as our BCA colleague, Arthur Budaghyan, observed, semiconductor chip manufacturing is becoming a strategic asset, especially in a standoff between China and the US, and the country that controls the production of semis controls the production of most tech goods. This view highlight structural importance of this investment theme. Bottom Line: We are upgrading the S&P Semiconductors & Semiconductor equipment index to overweight from neutral allocation.
Dear Client, This week, the US Bond Strategy service is hosting its Quarterly Webcast (August 17 at 10:00 AM EDT, 15:00 PM BST, 16:00 PM CEST and August 18 at 9:00 HKT, 11:00 AEST). In addition, we are sending this Quarterly Chartpack that provides a recap of our key recommendations and some charts related to those recommendations and other areas of interest for US bond investors. Please tune in to the Webcast and browse the Chartpack at your leisure, and do let us know if you have any questions or other feedback. To view the Quarterly Chartpack PDF please click here. Scheduling Note: There will be no US Bond Strategy report next week. The following week (August 31), clients will receive a report written by our Global Fixed Income Strategist Rob Robis. The regular US Bond Strategy publication schedule will resume on September 8 with the publication of September’s Portfolio Allocation Summary. Best regards, Ryan Swift, US Bond Strategist
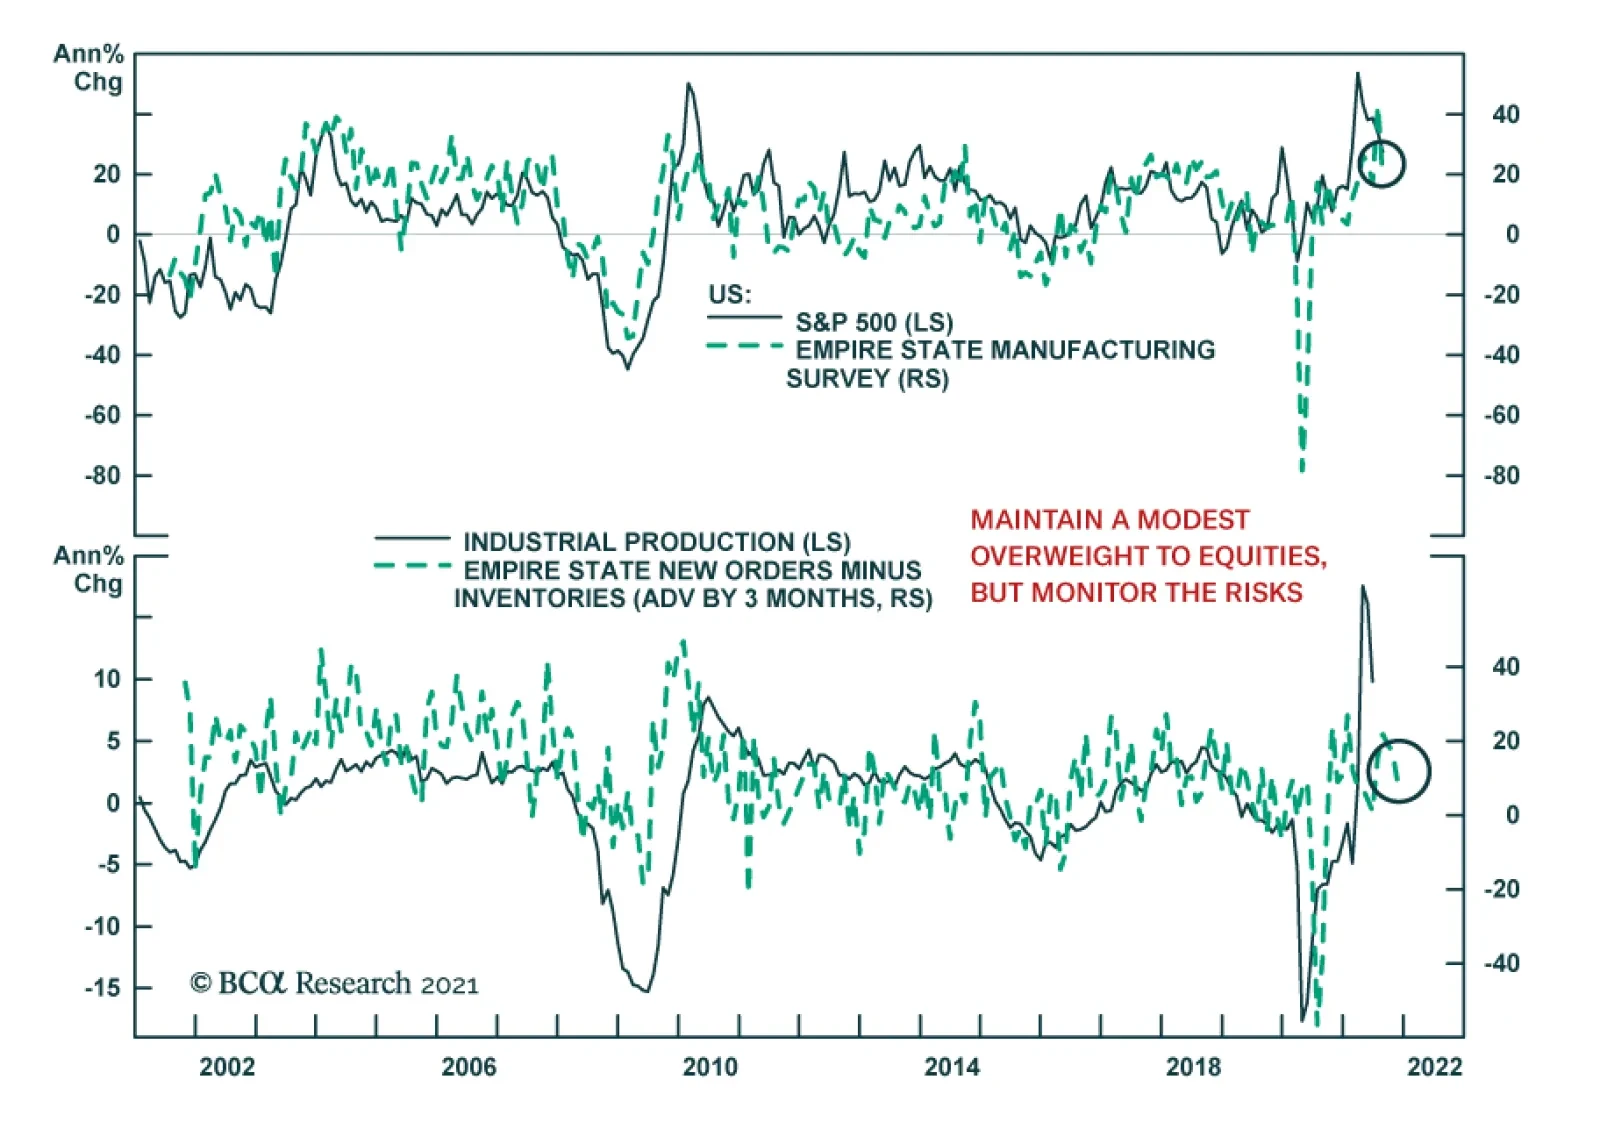
Our Global Investment strategists recently highlighted that the possibility of a “goods recession” is among the key risks they are monitoring for signs to reduce equity exposure. The New York Fed’s Empire Manufacturing Survey sent a slight warning on Monday.…
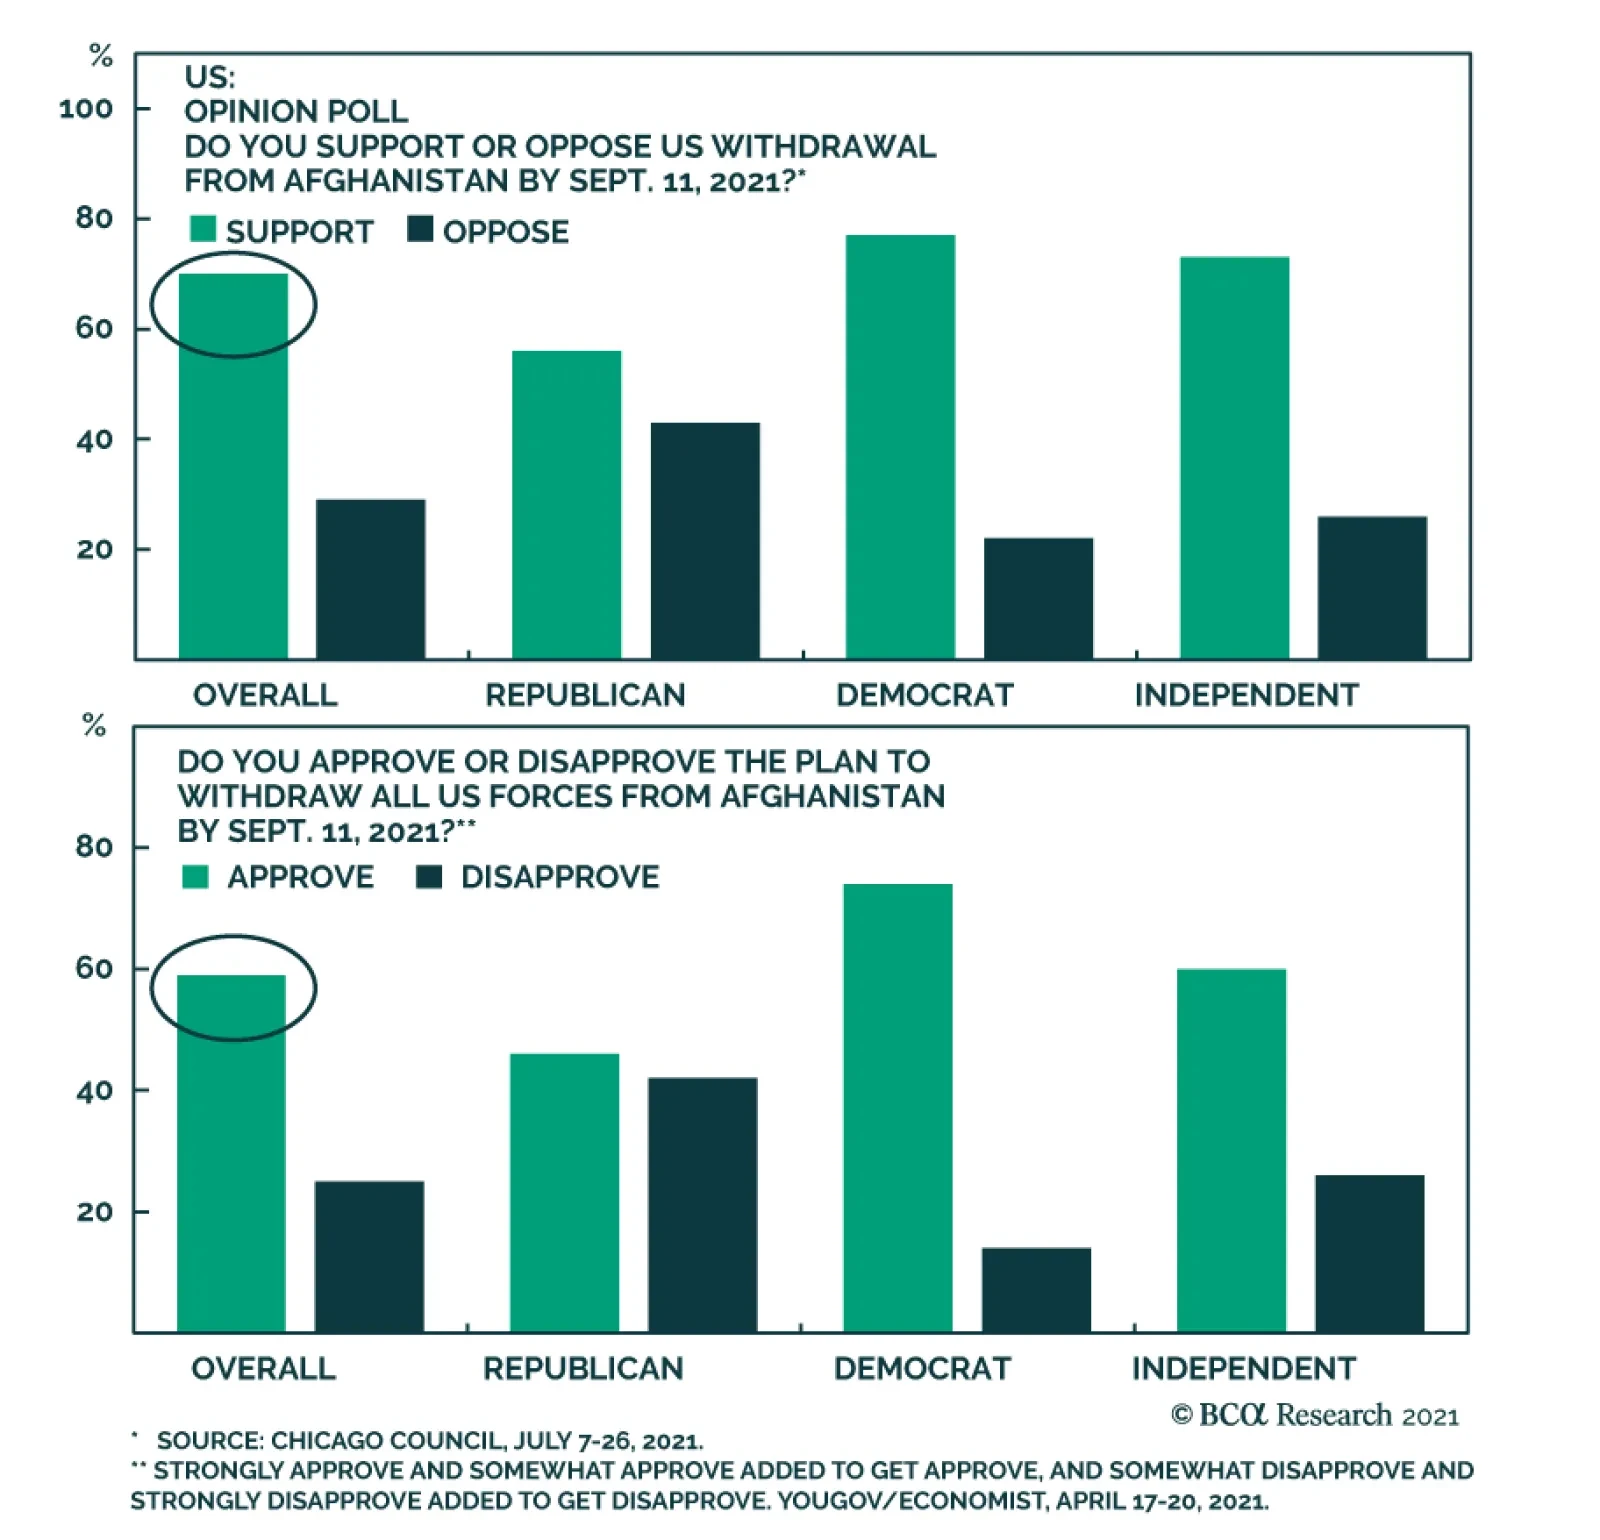
Two key motives explain the US’s withdrawal from Afghanistan. First, the US public has grown war weary. According to opinion polls, most Americans do not view the war in Afghanistan – or other wars in the Middle East – as worth fighting for. Therefore, the…
Will the S&P 500 Grow Into Its Big Valuations Shoes?
…
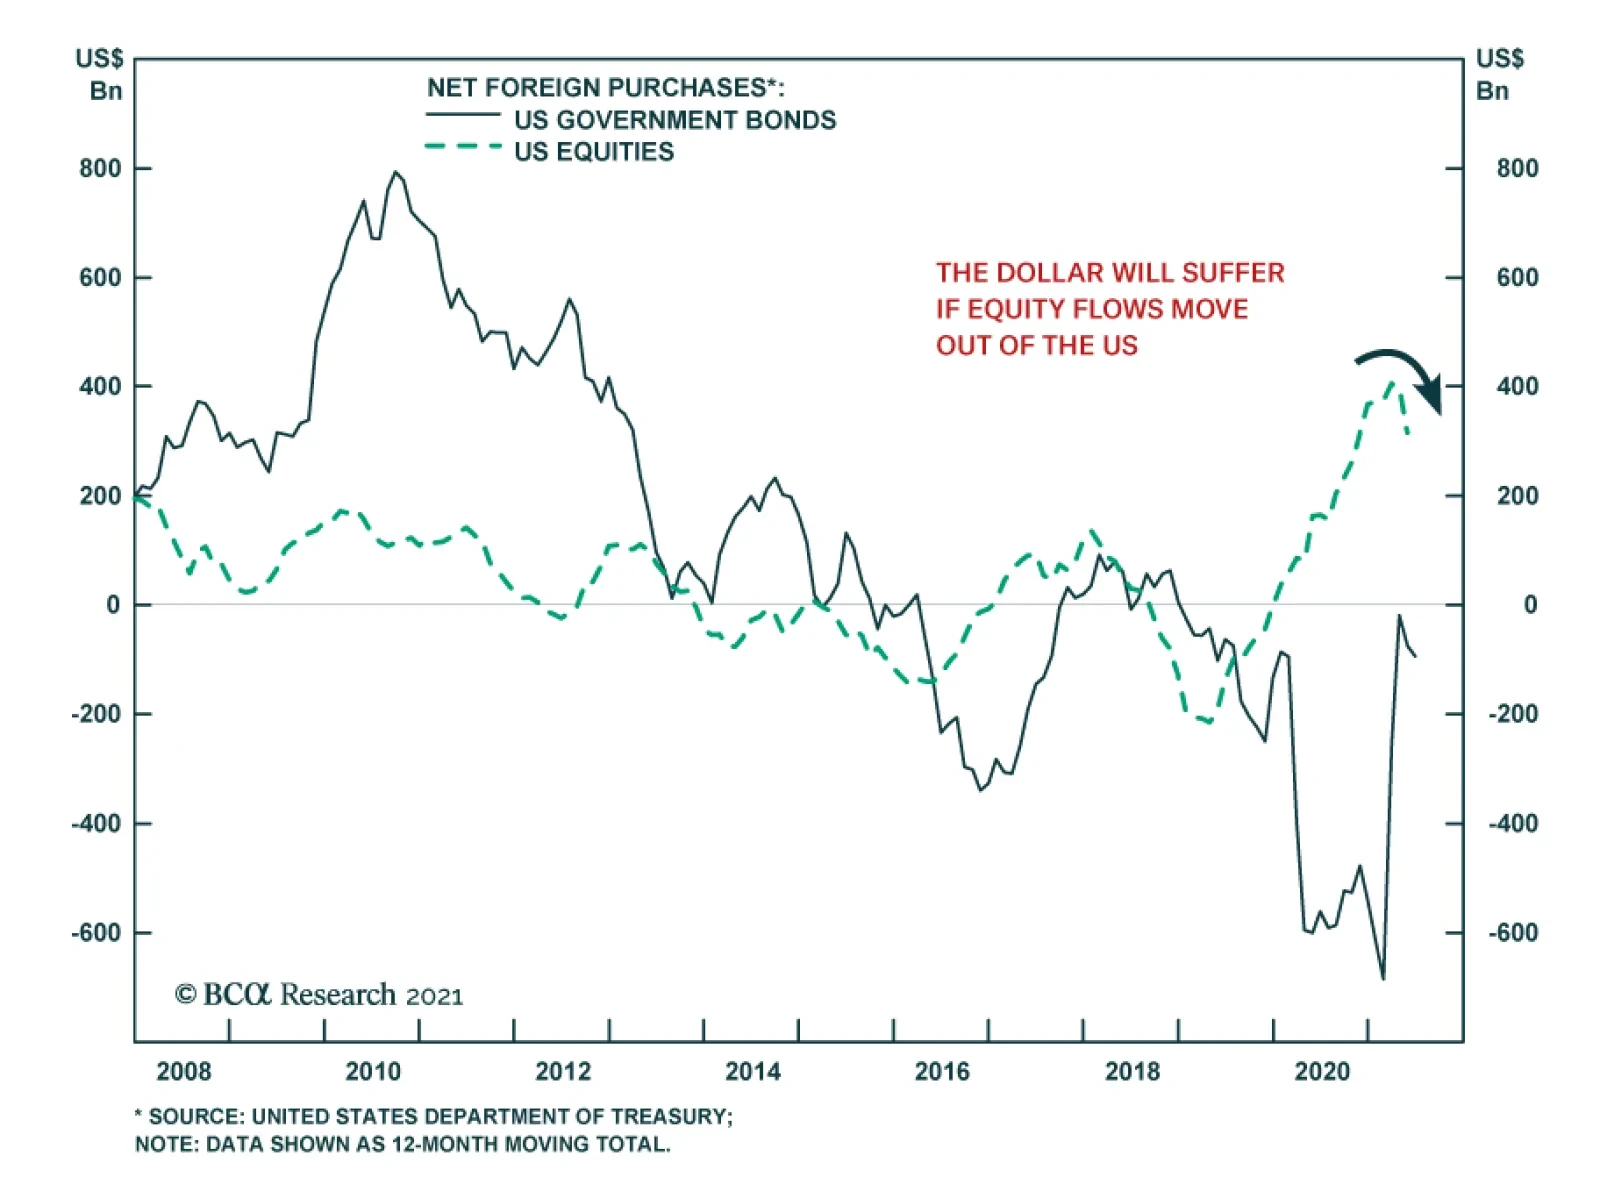
There are two key risks to our foreign exchange strategists’ bearish outlook for the US dollar. The first is if the Fed changes its reaction function in favor of a proactive approach to tackling inflation. This would entail aggressive rate hikes in an…
Highlights Earnings season was impressive, with 87% of companies beating analyst earnings expectations. Analysts’ targets were too low because a whopping 38% of companies provided negative forward guidance for the Q2-2021 results. The markets expect 12-17% earnings growth over the next 12 months. Growth is past its peak and is returning to trend. Earnings growth will pick up the baton from multiple expansion and will propel US equity markets further. Yet, returns will be lower than in the past due to high valuation “speed limit.” US equity market is expensive, and earnings growth with a 10% handle will not deliver a significant re-rating, while growth rates above 20% are unlikely. We still like the consumer theme: Earnings results were strong, and more growth is expected ahead, especially in the consumer services space. Overweight Health Care: Pent up demand for elective procedures will propel earnings growth higher. Overweight Industrials to benefit from the US manufacturing Renaissance long term, and from a rebound in earnings growth in response to the inventory restocking cycle and infrastructure spending short term. Stay underweight Materials: China slowing will take a toll on the earnings growth of industrial metals miners and on the Materials sector as a whole. Overweight Growth vs Value for now. Watch for a persistent rise in rates and steeping of the yield curve – once that happens, rotate into Value and Small Caps, which thrive in such a macroeconomic environment. Feature The Q2-2021 earnings season is coming to an end, and it is time to take stock of the companies’ results and validate our equity views on styles, sectors, and investment themes into the balance of the year. Review Of The Q2-2021 Earnings Season The S&P 500 Key Earnings Results Stats S&P 500 quarterly earnings grew 93% YoY, and sales increased by 23.5% YoY compared to the same quarter a year ago (Table 1). Q2-2021 earnings stand 29% above the Q2-2019 level, which translates into 14% annualized growth. CAGR for sales for the same period is 4.6%. 87% of the companies have beaten both sales and earnings expectations. Earnings surprise is 16%, while sales surprise is 4.6%. As our colleagues from US Investment Strategy (USIS) have observed, beats are unprecedented: Their magnitude is more than two standard deviations above the historical average (Chart 1). Table 1S&P 500 Q2-2021 Earnings And Sales Results
Decoding Earnings
Decoding Earnings
Chart 1Earnings Surprises Are Unprecedented
Decoding Earnings
Decoding Earnings
Decoding The S&P 500 Earnings Season Results While we are impressed with the earnings results delivered by the US companies, our reaction to these superb growth numbers and beats is tepid, like the market’s reaction. The average reaction to an EPS beat this earnings season was about 0.9%. Misses were penalized harshly with stocks falling 1.1%. S&P 500 is up only 2% since the beginning of the reporting season. There are a few reasons for this lukewarm reception: Analyst targets were too low: Ubiquitous beats of earnings and sales expectations indicate that the analyst targets were too low despite upgrades throughout the earnings season (downgrades are more typical). The bar was set too low because a whopping 38% of the companies provided negative forward guidance for the Q2-2021 results. Growth was lumpy: Much of the robust growth can be explained by what we can call two sides of the same coin, one being a low base for the comparisons – after all, in the summer of 2020, the economy was close to a standstill – and the other is a pent-up demand for goods and services. In other words, all the growth postponed in 2020 was delivered at once over this past couple of quarters. With that, a 14% annualized growth rate for the S&P 500 earnings since 2019, which smooths results over time, is strong but not exceptional. Corporate guidance was cautious: Many companies have warned investors that their high growth rates are unsustainable (31% of companies guided lower for Q3-2021). Since the markets are forward-looking, reported earnings growth is seen in the rearview mirror and is priced in, and it is future growth that matters. Earnings growth has returned to trend: Earnings have fully recovered from the pandemic dip. The street bottom-up EPS growth projections (according to Refinitiv) for the rest of 2021, 2022, and 2023 are based on that assumption (Chart 2). The corollary to the point above is that earnings growth has peaked (Chart 3, RHS): Earnings will grow forward along the trend line at about 6-8% annually, which is the historical average. Chart 2Earnings Growth Is Returning To Trend
Decoding Earnings
Decoding Earnings
What To Expect Over The Next Four Quarters? According to the data compiled by Refinitiv, analysts expect Q3-2021 earnings to be 5% (QoQ) below their Q2-2021 level, staying flat for the next couple of quarters and exceeding the current level only in Q2-2022 (Chart 3, LHS). Aggregating quarterly growth rates into next 12 months growth rate, analysts expect 12.6% YoY growth over the next 12 months. Chart 3Growth Has Peaked And Quarterly Earnings Are Expected To Be Almost Flat
Decoding Earnings
Decoding Earnings
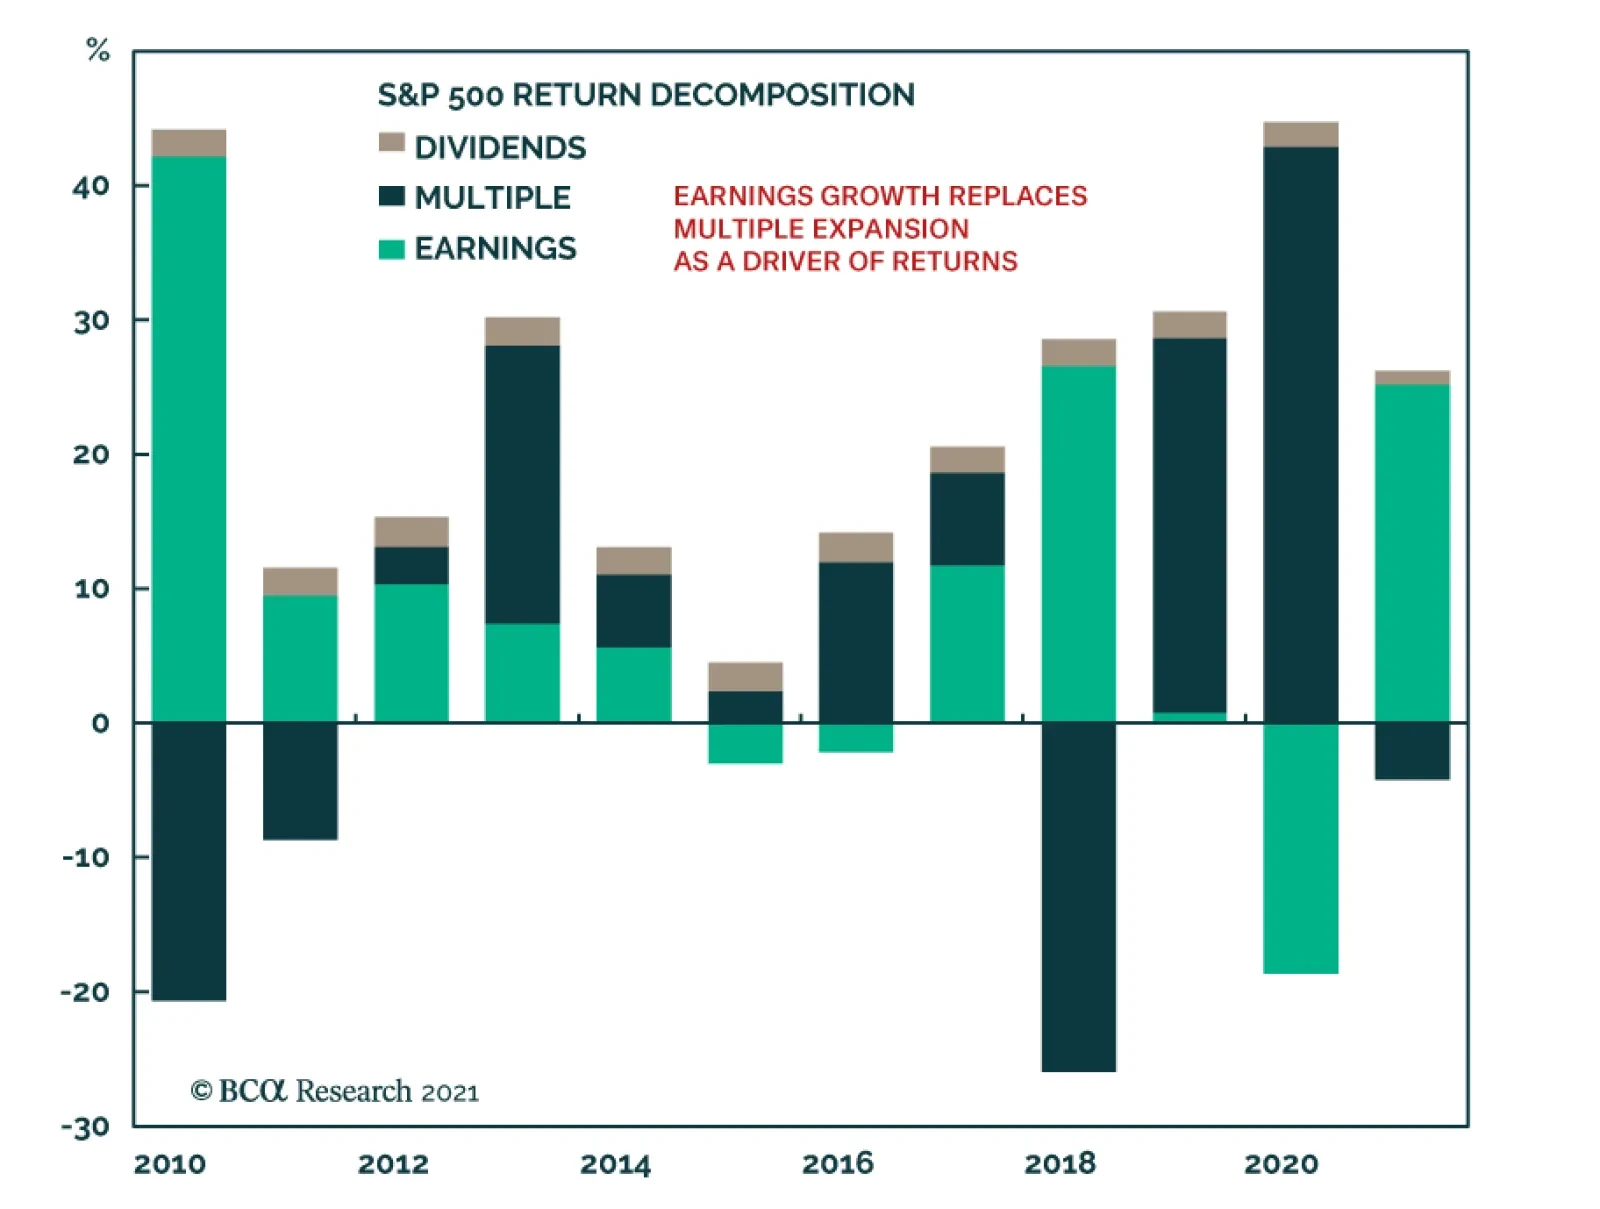
We believe that these growth expectations are too low, as they are based on the expectation that over the next four quarters EPS will stay practically flat. Therefore, most of the 12.6% YoY growth can be attributed to a base effect. It is likely that YoY growth will be higher: Some sector earnings are still at a pre-pandemic level, while others should grow simply because the economy is expanding. IBES expects EPS NTM to grow at 17% over the next 12 months, which is slightly more realistic in our opinion (Chart 4). The difference with Refinitiv is in the calculation methodology. Our working assumption is that next year’s growth will be within the 12-17% YoY range. From Multiple Expansion To Earnings Growth! Return decomposition demonstrates that in 2020, the S&P 500 return was 26%, with 43% contributed by the multiple expansion, and 19% detracted by the earnings contraction: Over the past year, returns have been borrowed from the future, but this year is payback time. The source of the equity returns is shifting from multiple expansion to earnings growth. This means that 12%-17% expected EPS growth (and possibly more if we get a positive earnings surprise) in the upcoming four quarters will propel the markets higher (Chart 5). Chart 4IBES Expect Next 12 Months Growth To Be 17%
IBES Expect Next 12 Months Growth To Be 17%
IBES Expect Next 12 Months Growth To Be 17%
Chart 5Earnings Growth Replaces Multiple Expansion As A Driver Of Returns
Decoding Earnings
Decoding Earnings
Will the S&P 500 Grow Into Its Big Valuations Shoes? Not So Fast At present, the S&P 500 is trading at 21.3x forward earnings (PE NTM), which is steep compared to a historical average of 18x. PE NTM multiples will compress if earnings growth exceeds index price appreciation. While we do expect multiple expansion to pass the baton to earnings growth over the next 12 months, we are curious to know by how much earnings would have to grow for PE to come down to 18x. To get an answer, we created a scenario analysis matrix, varying price and earnings growth simultaneously. The most likely scenario is for the earnings to grow at 3-5% each quarter over the next 12 months (13-16% annualized) and, assuming that the S&P 500 price does not move, it will trade at 20.5-21x forward earnings multiples. For PE to come down to 18x, earnings would have to grow by more than 10% every quarter, or 30% over the next 12 months, which is way above the growth rates expected by the market. Therefore, we are unlikely to see significant multiple compression without a market correction (Table 2). US equities are expensive, no excuses. Table 2Earnings Have To Grow in Double-Digits For PE NTM To Come Down To 18x
Decoding Earnings
Decoding Earnings
Zooming In On The US Equity Market Segments Table 3Style Indices Q2-21 Sales And Earnings Growth
Decoding Earnings
Decoding Earnings
Value Outgrew Growth: Earnings of Value grew 31% faster than earnings of Growth (Table 3). However, looking under the hood, annualized EPS growth of Growth was 16% p.a. since 2019, while EPS of Value contracted by 2% p.a. This means that for many Value companies, the earnings surge is a function of the base effect; earnings have not yet reached their pre-pandemic levels (Chart 6) and have room to run further. Chart 6Small Delivered Spectacular 2019-2021 Growth
Decoding Earnings
Decoding Earnings
Small Crushes Earnings: Small Caps' quarterly results have been nothing short of astonishing: EPS in Q2-21 is 10 times higher than during the same quarter a year ago. This growth surge can’t be attributed just to the base effect, as earnings are double what they were two years ago. The S&P 600 has an annualized earnings growth rate over the past two years of 42%, and sales growth of 6.2%. Sectors Sector results are characterized by a powerful rebound of the cyclical sectors: Industrials, Consumer Discretionary, Energy, Materials, and Financials have delivered triple-digit earnings growth, and double-digit sales growth (Table 4). Table 4S&P 500 Sectors' Q2-21 Sales And Earnings Growth
Decoding Earnings
Decoding Earnings
However, looking at 2019-2021 CAGR, we observe that the Industrials sector earnings are still 10% below the 2019 level, and the Consumer Discretionary sector has only grown 2% annualized, much slower than the market. The case is the same for Energy. Financials and Materials growth was very strong: The former benefited from the M&A and IPO boom, while the latter has grown thanks to stimulative Chinese policy, which has been tightened lately (Chart 7). Chart 7Cyclical Sectors Did Not Grow Much Since 2019 Despite Recent Profit Rebound
Decoding Earnings
Decoding Earnings
Profitability Is Unlikely to Return To A Previous Peak Many companies have tightened their belts during the pandemic to preserve capital in the face of uncertainty. Margins have compressed, but less than expected in such a dire situation. Currently, the majority of sectors has margins close to their historical averages (Chart 8). While most sectors, with exception of Financials and Technology, are below peak margins, it is unlikely that they will be able to return to their former highs. Sales will soar thanks to stimulative fiscal and monetary policies, strong demand by consumers, and inflation. Yet the bottom line may be impeded by the increases in labor and input costs and tighter fiscal policy, which have not yet been priced in by the market. Market Expectations For The Next 12 Months According to IBES, earnings growth will be propelled by the cyclicals, such as Industrials, Consumer Discretionary and Energy (though less so as it is a small sector). These expectations are well aligned with our investment thesis (Chart 9). Chart 8Most Sectors' Margins Are Back To Normal, But Peak Margins Are Elusive
Decoding Earnings
Decoding Earnings
Chart 9Cyclical Sectors Are Expected To Grow The Most Over The Next 12 Months
Decoding Earnings
Decoding Earnings
Investment Themes Consumers Are Flush With Cash One of our key investment themes is that the US consumer still has plenty of money to spend: Excess savings in the US currently stand at $2.5 trillion, and disposable incomes have been padded by the pandemic helicopter cash drops. While spending on goods had exceeded its historical trend and has recently turned, spending on services is still below pre-pandemic levels (Chart 10). During Q2-2021, Consumer Services earnings grew by 154%, exceeding analyst targets by 27%, though the level of earnings is only 5% above the Q2-2019 level (Chart 11). This suggests that the theme has worked, but also that it has the potential to run further only if not derailed by the fear of COVID-19 variants. However, the approach to investing in this sector needs to be granular, with overweights allocated to service industries such as hotels, restaurants, and leisure (S&P leisure products, S&P hotels, S&P restaurants). Chart 10Real Spending On Services Is At Pre-Pandemic Levels: Room For Further Rebound
Real Spending On Services Is At Pre-Pandemic Levels: Room For Further Rebound
Real Spending On Services Is At Pre-Pandemic Levels: Room For Further Rebound
Chart 11The Consumer Discretionary Sector Growth Will Stay Robust
The Consumer Discretionary Sector Growth Will Stay Robust
The Consumer Discretionary Sector Growth Will Stay Robust
We recommend staying away from Internet Retail (downgrade is pending) and the other sectors that have outsized exposure to consumer goods. Amazon earnings were a case in point: The company disappointed analysts with weaker revenue growth as well as provided a more cautious outlook as it finds it difficult to surpass its stellar pandemic numbers. Brick and mortar retail is likely to fare better, as going out to shop now falls into the “experiences” basket. China Slowdown: Underweight The Materials Sector Chinese growth is slowing, which has an adverse effect on demand for industrial metals (Chart 12). As a result, we have underweighted the Materials sector, along with the Metals and Mining industry. This call was on the money: While Materials more than doubled earnings over the past year, its earnings surprise at 6.40% is the smallest of all the sectors. The Materials sector has underperformed S&P 500 by 8% since the beginning of June. Chart 12Materials Sector Earnings Growth Is Slowing
Materials Sector Earnings Growth Is Slowing
Materials Sector Earnings Growth Is Slowing
Post-COVID-19 Normalization: Overweight The Health Care Sector We upgraded this sector to an overweight three weeks ago. We intended to add a defensive sector in our portfolio to make it more robust in the face of an imminent market pullback, likely volatility on the back of elevated valuations and the upcoming debt ceiling kerfuffle. This quarter, Health Care posted mixed results despite being among the key beneficiaries of the pandemic. There are several factors at play. One is that some US vaccine manufacturers pledged to produce vaccines at no profit (J&J). Another reason is that the pandemic forced hospitals to halt their non-emergency operations that serve as an important end-demand market for the S&P Health Care sector. Weak Q2-2021 earnings suggest untapped demand for medical services and elective procedures. Just now, hospitals started reopening, and we expect a spike in the number of hospital visits, with positive spillover effects for medical equipment manufacturers and pharmaceutical companies. We are sticking to our overweight unless Delta and Lambda take over the hospital beds. US Manufacturing Renaissance The Industrials delivered triple-digit growth, but the sector’s earnings are still below pre-pandemic levels. There was an earnings growth dichotomy at play. Manufacturing companies that derive a high percentage of earnings from abroad have been affected by a slowdown of Chinese demand and by inflationary pressures. CAT’s recent 20% drawdown in relative terms encapsulates these headwinds. Domestic and services-oriented stocks like railroads reported exceptionally strong demand. Looking ahead, we are constructive on the sector. There is still significant pent-up demand for industrial goods and services, inventories are historically low (Chart 13) and need to be replenished, Federal infrastructure spending is a near certainty, and onshoring of US manufacturing is a new structural theme. Analysts concur: Expected EPS growth for the sector over the next 12 months is 46%. Chart 13Inventories Are At All Time Low
Inventories Are At All Time Low
Inventories Are At All Time Low
Chart 14Value-Growth Earnings Growth Differential Is Closing
Value-Growth Earnings Growth Differential Is Closing
Value-Growth Earnings Growth Differential Is Closing
Rate Stabilization: Overweight Technology and Growth vs Value Technology is one of our core overweights in the portfolio and the sector fared well last quarter. One of the drivers behind the strong quarter is an accelerating shift to remote work as companies re-evaluate the need for offices, especially given the possibility of new virus variants. A similar upbeat message came from the semiconductor industry: A shortage of chips that touches all corners of manufacturing from cars to computers, translates into strong earnings growth, which is likely to continue far into the future. As our BCA colleague, Arthur Budaghyan observed, semiconductor chip manufacturing is becoming a strategic asset, especially in a standoff between China and the US, and the country that controls the production of semis controls the production of most tech goods. We have been overweight Growth vs Value in our portfolios since the beginning of June. Since then, Growth has outperformed Value by about 6%. While Value was growing faster than Growth in Q2-21, the earnings growth expectation between Growth and Value is closing. After a strong run, Growth is expensive again, trading at 28x forward earnings compared to 16x for Value. We expect the yield curve to steepen and yields to rise this fall once workers return to work and the unemployment rate falls further. In other words, we are edging closer to downgrading Growth to neutral; we are just waiting to get more visibility on the Delta variant scare. Upgrade Small vs Large When Rates Rise Again Back in June, we wrote a deep-dive report on Small / Large cap allocation and concluded that an equal-weighted allocation was warranted. This call has not worked so far as Small has underperformed Large by about 5%. Our reasons for not overweighting Small vs Large were manifold: Slowing growth, flattening yield curve, mean reversion of high-yield spreads and, most importantly, a significant downgrade of earnings expectations (Chart 15). Chart 15Small Cap Downgrades Likely Ran Their Course
Small Cap Downgrades Likely Ran Their Course
Small Cap Downgrades Likely Ran Their Course
However, we are warming up to Small: Reported earnings and sales growth was impressive. Furthermore, we expect the yield curve to steepen (helping banks in the S&P 600) as people go back to work in September, and rates to go up to as high as 1.8% by the end of the year. When the timing is right, we will swap overweight in the Growth stocks to an overweight in Small. Investment Implications The earnings season was impressive, but growth is returning to trend and is past its peak. The markets expect 12-17% earnings growth over the next 12 months. Earnings growth will pick up the baton from multiple expansion and will propel US equity markets further. Yet returns will be lower than in the past due to a high valuation “speed limit.” The US equity market is expensive, and earnings growth with a 10% handle will not deliver a significant re-rating, while growth rates above 20% are unlikely. We still like the consumer theme: Earnings results were strong, and more growth is expected ahead, especially in the consumer services space. Overweight Health Care: Pent-up demand for elective procedures will propel earnings growth higher. Overweight Industrials which will benefit from the US manufacturing Renaissance over the long term, and from a rebound in earnings growth in response to the inventory restocking cycle and infrastructure spending over the short term. Stay underweight Materials: China slowing will take a toll on the earnings growth of industrial metals miners and on the Materials sector as a whole. Overweight Growth vs Value for now. Watch for a persistent rise in rates and steeping of the yield curve – once that happens, rotate into Value and Small Caps, which thrive in such a macroeconomic environment. Bottom Line The earnings season produced peak growth, and the next phase of the cycle is earnings growth returning to trend. This normalization will be a tailwind for the equity markets and will replace multiple expansion as a driver of equity returns. We are sticking to our overweights in Industrials, Health Care and Consumer Discretionary, and our underweight in Materials. We are reconsidering our overweight in Growth and neutral positioning in Small Caps. Once rates turn up decisively, a rotation into Small and Value is warranted. Irene Tunkel Chief Strategist, US Equity Strategy irene.tunkel@bcaresearch.com Recommended Allocation
Highlights The chaotic US withdrawal from Afghanistan is symbolic – the US is conducting a strategic pivot to Asia Pacific to confront China. US-Iran negotiations are the linchpin of this pivot. If they fail, war risk will revive in the Middle East and the US will remain entangled in the region. At the moment, there is no deal, so investors should brace for a geopolitical risk premium in oil prices. That is, as long as global demand holds up despite COVID-19, and as long as the OPEC 2.0 cartel remains disciplined. We think they will in the short run. The US and Iran still have fundamental reasons to agree to a deal. If they do, the US will regain global room for maneuver while China’s and Russia’s window of opportunity will close. The implication is that markets face near-term oil supply risks – and long-term geopolitical risks due to Great Power rivalry in Eastern Europe and East Asia. Feature Events in Afghanistan have little macroeconomic significance but the geopolitical changes underway are profound and should be viewed through the lens of our second key view for 2021: the US strategic pivot to Asia. Chart 1The US Pivot To Asia Runs Through Iran Not Afghanistan
The US Pivot To Asia Runs Through Iran Not Afghanistan
The US Pivot To Asia Runs Through Iran Not Afghanistan
As we go to press the Taliban is reconquering swathes of Afghanistan while US armed forces evacuate embassy staff and civilians. The chaotic scenes are reminiscent of the US’s humiliating flight from Saigon, Vietnam in 1975. As with Vietnam, the immediate image is one of American weakness but the reality over the long run is likely to be different. Over the past decade we have chronicled the US’s efforts to disentangle itself from wars of choice in the Middle East and South Asia. In accordance with US grand strategy, Washington is refocusing its attention on its rivalries with Russia and especially China, the only power capable of supplanting the US as a global leader (Chart 1). The US has struggled to conduct this “pivot to Asia” over the past decade but the underlying trajectory is clear: while trying to manage its strategic interests in the Middle East through naval power, the US will need to devote greater resources and attention to shoring up its economic and military ties in Asia Pacific (Map 1). The Middle East still plays a critical role – notably through China’s energy import needs – but primarily via the Persian Gulf. Map 1The US Seeks Balance In Middle East In Order To Pivot To Asia And Confront China
Afghanistan? Watch Iran And China
Afghanistan? Watch Iran And China
Thus the critical geopolitical risks today stem from Iran and the Middle East on one hand, and China on the other. They do not stem from the US’s belated and messy exit from Afghanistan, which has limited market relevance outside of South Asia. First, however, we will address the political impact in the United States. US Political Implications Chart 2Americans Agree With Biden And Trump On Exit From Afghanistan
Afghanistan? Watch Iran And China
Afghanistan? Watch Iran And China
American popular opinion has long turned against the “forever wars” in Iraq and Afghanistan, which cumulatively have cost $6.4 trillion and about 7,000 American troops dead1 (Chart 2). Three presidents, from two political parties, campaigned and won election on the basis of winding down these wars. The only presidential candidate since Republicans George W. Bush and John McCain who took a hawkish stance for persistent military engagement, Hillary Clinton, nearly lost the Democratic nomination and did lose the general election to a Republican, President Trump, who had reversed his party’s stance to advocate strategic withdrawal. War hawks have been sidelined in both parties. This is notable even if it were not the case that the current President Biden, whose son Beau fought in Afghanistan, had opposed the troop surge there under Obama. True, Biden will use drones, surgical strikes, and limited troop rotations to manage the aftermath in Afghanistan, both militarily and politically. Americans are still concerned about terrorism in general and any sign of a resurgent terrorist threat to the US homeland will be politically potent (Chart 3). But neither Biden nor the US can roll back the Taliban’s latest gains or achieve anything in Afghanistan that has not been achieved over the past twenty years. Chart 3American Public Cares About Terrorism, Not Afghanistan Per Se
Afghanistan? Watch Iran And China
Afghanistan? Watch Iran And China
True, Biden will suffer a political black eye from Afghanistan. His approval rating has already fallen to 49.6%, slipping beneath 50% for the first time, in the face of the Delta variant of COVID-19 and the Afghan debacle. In both cases his early optimistic statements have now become liabilities. Biden is also 79 years old, which will make the 2024 campaign questionable, and he faces mounting problems in other areas, from lax border security and immigration enforcement to rising domestic crime. Nevertheless, Biden still has sufficient political capital to push through one or both of his major domestic legislative proposals by the end of the year, despite thin majorities in both the House and Senate. Afghanistan will not affect that, for three reasons: 1. The US economy is likely to continue to recover despite hiccups due to the lingering pandemic, since the vaccines so far are effective. The labor market is recovering and business capex and government support are robust. Setbacks, such as volatile consumer confidence, will help Biden pass bills designed to shore up the economy. 2. The public fundamentally agrees with Biden (and Trump) on military withdrawal, as mentioned. Voters will only turn against him if a major attack reinforces an image of weakness on terrorism. A major attack based in Afghanistan is not nearly as likely to succeed as it was prior to the September 11, 2001 attacks. But Biden also faces an imminent increase in tensions in the Middle East that could result in attacks on the US or its allies, or other events that reinforce any image of foreign policy failure. 3. Biden has broad popular support for his infrastructure deal, which also has bipartisan buy-in, with 19 Republican Senators already having voted for it. Further, the Democratic Party has a special fast-track mechanism for passing his social spending agenda, though conviction levels must be modest on this $3.5 trillion bill, which is controversial and will have to be winnowed to pass on a partisan vote in the Senate. If we are correct that Afghanistan will not derail Biden’s legislative efforts then it will not fundamentally affect US fiscal policy or the global macro outlook. Note, however, that a failure of Biden’s bills would be significant for both domestic and global economy and financial markets as it would suggest that US fiscal policy is dysfunctional even under single party rule and would thus help to usher back in a disinflationary context. Might Afghanistan affect the midterm elections and hence the US policy setup post-2022? Not decisively. Republicans are more likely than not to retake at least the House of Representatives regardless. This is a cyclical aspect of US politics driven by voter turnout and other factors. Democrats are partly shielded in public opinion due to the Trump administration’s attempts to pull out of foreign wars. But surely a black eye on terrorism or foreign policy would not help. Similarly, a major failure to manage the Middle East, South Asia, and the pivot to Asia Pacific would marginally hurt the Democrats in 2024, but that is a long way off. Geopolitical Implications The Taliban’s reconquest of Afghanistan has very little if any direct significance for global financial markets. Pakistan and India are the two major markets most likely to be directly affected – and their own geopolitical tensions will escalate as a result – yet both equity markets have been outperforming over the course of the Taliban’s military gains (Chart 4). Afghanistan’s impacts are indirect at best. However, the US withdrawal connects with major geopolitical currents, with both macro and market significance. Afghanistan often marks the tendency of empires to overreach. Russia’s failure in Afghanistan contributed to the collapse of the Soviet Union, though Russia’s command economy was unsustainable anyway. British failures in Afghanistan in the nineteenth and twentieth centuries did not lead to the British empire’s decline – that was due to the world wars – but Afghanistan did accentuate its limitations. Since 9/11 and the US’s wars in Iraq and Afghanistan, the US public’s economic malaise, political polarization, and loss of faith in public institutions have gotten worse. In turn, political divisions have impeded the government’s ability to respond cogently to financial and economic crisis, the resurgence of Russia, the rise of China, nuclear proliferation, constitutional controversies, and the COVID-19 pandemic. Once again Afghanistan marked imperial overreach. It is natural for investors to be concerned about the stability of the United States. And yet the US’s global power has recently stabilized (Chart 5). The US survived the 2020 stress test and innovated new vaccines for the pandemic. It is passing laws to upgrade its domestic technological, manufacturing, and infrastructural base and confronting its global rivals. Chart 4If Indo-Pak Markets Shrug Off Taliban Wins, So Can You
If Indo-Pak Markets Shrug Off Taliban Wins, So Can You
If Indo-Pak Markets Shrug Off Taliban Wins, So Can You
Chart 5US Geopolitical Power Is Stabilizing
Afghanistan? Watch Iran And China
Afghanistan? Watch Iran And China
Chart 6US Not Shrinking From Global Role
US Not Shrinking From Global Role
US Not Shrinking From Global Role
The US is not retreating from its global role, judging by defense spending or trade balances (Chart 6). While the desire to phase out wars could theoretically open the way to defense cuts, the reality is that the great power confrontation with China and Russia will demand continued large defense spending. The US also continues to run large trade deficits, due to its shortage of domestic savings, which gives it influence as a consumer and provider of dollar liquidity across the world. The critical geopolitical problem is Iran, where events have reached a critical juncture: To create a semblance of a balance of power in the Middle East, the US needs an understanding with Iran, which is locked in a struggle with Saudi Arabia over the vulnerable buffer state of Iraq. President Biden was not able to rejoin the 2015 détente with Iran prior to the inauguration of the new president, Ebrahim Raisi, who is a hawk and whose confrontational policies will lead to an escalation of Middle Eastern geopolitical risk in the short term – and, if no US-Iran deal is reached, over the long term. Iran recognizes the US’s war-weariness, as demonstrated by withdrawals from Iraq and Afghanistan. It was also exposed to economic sanctions after the US’s 2018-19 abrogation of the 2015 nuclear deal – it cannot trust the US to hold to a deal across administrations. Still, both the US and Iran face substantial strategic forces pressuring them to conclude a deal. The US needs to pivot to Asia while Iran needs to improve its economy and reduce social unrest prior to its looming leadership succession. But the time frame for negotiation is uncertain. Any failure to agree would revive the risk of a major war that would keep the US entangled in the region. Thus the pivot to Asia could be disrupted again, with major consequences for global politics, not because of Afghanistan but because of a failure to cut a deal with Iran. If the US succeeds in reducing its commitments to the Middle East and South Asia, the window of opportunity that China and Russia have enjoyed since 2001 will close. They will face a United States that has greater room for maneuver on a global scale. This is a threat to their own spheres of influence. But neither Beijing nor Moscow has an interest in a nuclear-armed Iran, so a US-Iran deal is still possible. Unless and until the US and Iran normalize relations, the Middle East is exposed to heightened geopolitical risk and hence oil supply risk. Global oil spare capacity is sufficient to swallow small disturbances but not major risks to stability, such as in Iraq or the Strait of Hormuz. Investment Takeaways Chart 7Near-Term US-Iran Risks Help Oil...Long-Term US-China Risks Help Dollar
Near-Term US-Iran Risks Help Oil...Long-Term US-China Risks Help Dollar
Near-Term US-Iran Risks Help Oil...Long-Term US-China Risks Help Dollar
Back in 2001, the combination of American war spending, and conflict in the Middle East, combined with China’s massive economic opening after joining the WTO, led to a falling US dollar and an oil bull market. Today the US’s massive budget deficits and current account deficits present a structural headwind to the US dollar. Yet the greenback has remained resilient this year. While the pandemic will fade as long as vaccines continue to be effective, China’s potential growth is slowing even as it faces an unprecedented confrontation with the US and its allies. Until the US and Iran normalize relations, geopolitics will tend to threaten Middle Eastern oil supply and put upward pressure on oil prices. However, if the US manages the pivot to Asia, China will face more resolute opposition in its sphere of influence, which will tend to strengthen the dollar. The dollar and oil still tend to move in opposite directions. These geopolitical trends will be influential in determining which direction prevails (Chart 7). Thus geopolitics poses an upward risk to oil prices for now. Matt Gertken Vice President Geopolitical Strategy mattg@bcaresearch.com Footnotes 1 Please see Crawford, Neta, "United States Budgetary Costs and Obligations of Post 9/11 Wars Through FY 2020: $6.4 trillion", Watson Institute, Brown University.