United States
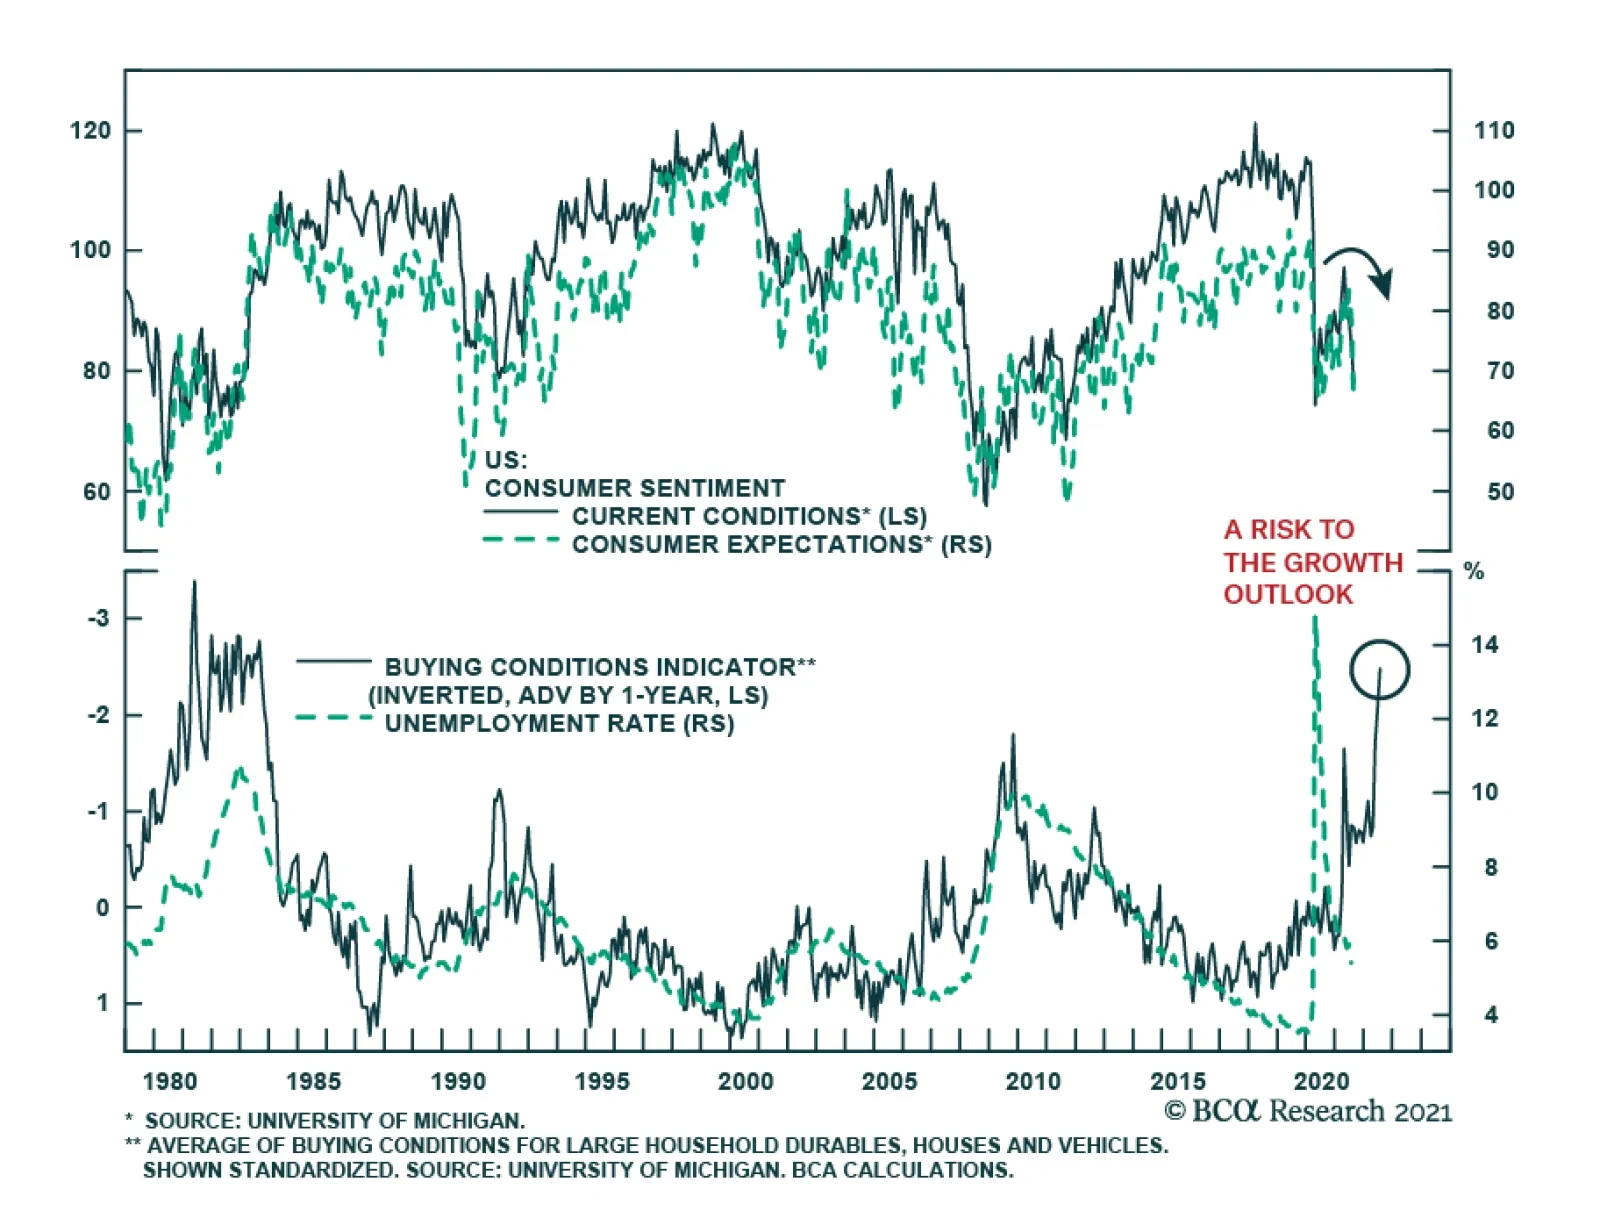
Heightened pandemic concerns are weighing down on US consumer confidence. The University of Michigan consumer sentiment survey’s headline index fell 11 points to a pandemic low of 70.2 in August, disappointing expectations it would remain unchanged. The…
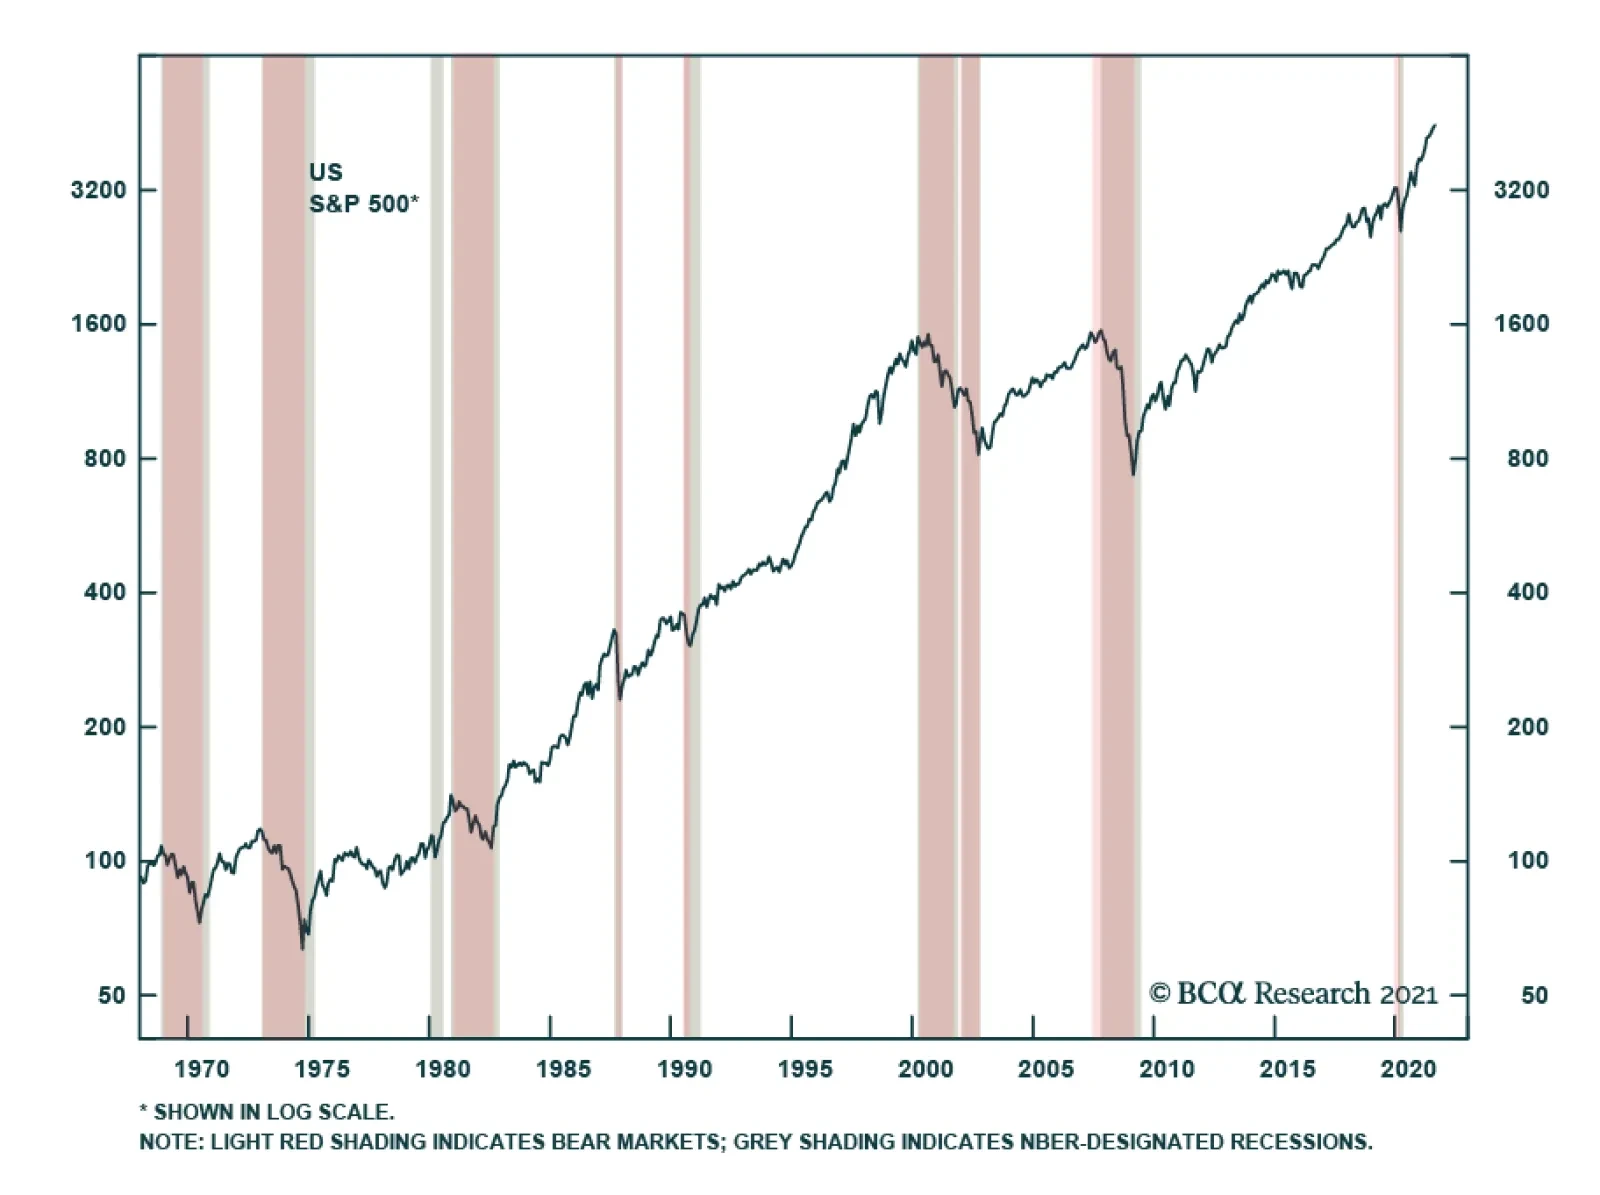
BCA Research’s Global Investment Strategy service is monitoring five risks for signs that it is time to reduce equity exposure. Equity bear markets rarely occur outside of major business cycle downturns. Nevertheless, there are different shades of…

Following up on yesterday’s Sector Insight report where we addressed the question of “how much inflation is too much” for the SPX multiple, today we conduct a similar analysis, but for earnings. Table 1 below illustrates that as long as inflation remains below 3%, earnings are not affected by the rising prices. However, crossing the 3% mark results in turbulence, especially once inflation accelerates beyond 4%. Specifically, column 6 of the table that corresponds to CPI rising above 4% displays mean and median YOY LTM earnings growth of negative 11% and negative 18%, respectively. One of the reasons why earnings suffer during high inflation is because companies have trouble passing on cost increases and are forced to sacrifice margins and earnings. These results are also consistent with the interplay between inflation and SPX multiple we showed yesterday. Bottom Line: While inflation is a concern, our view remains that as long as long-term inflation readings stay below 3%, equity earnings growth will shrug off price increases. Table 1Inflation Lagged 12 months vs LTM Earnings YoY
Inflation Vs. Earnings
Inflation Vs. Earnings
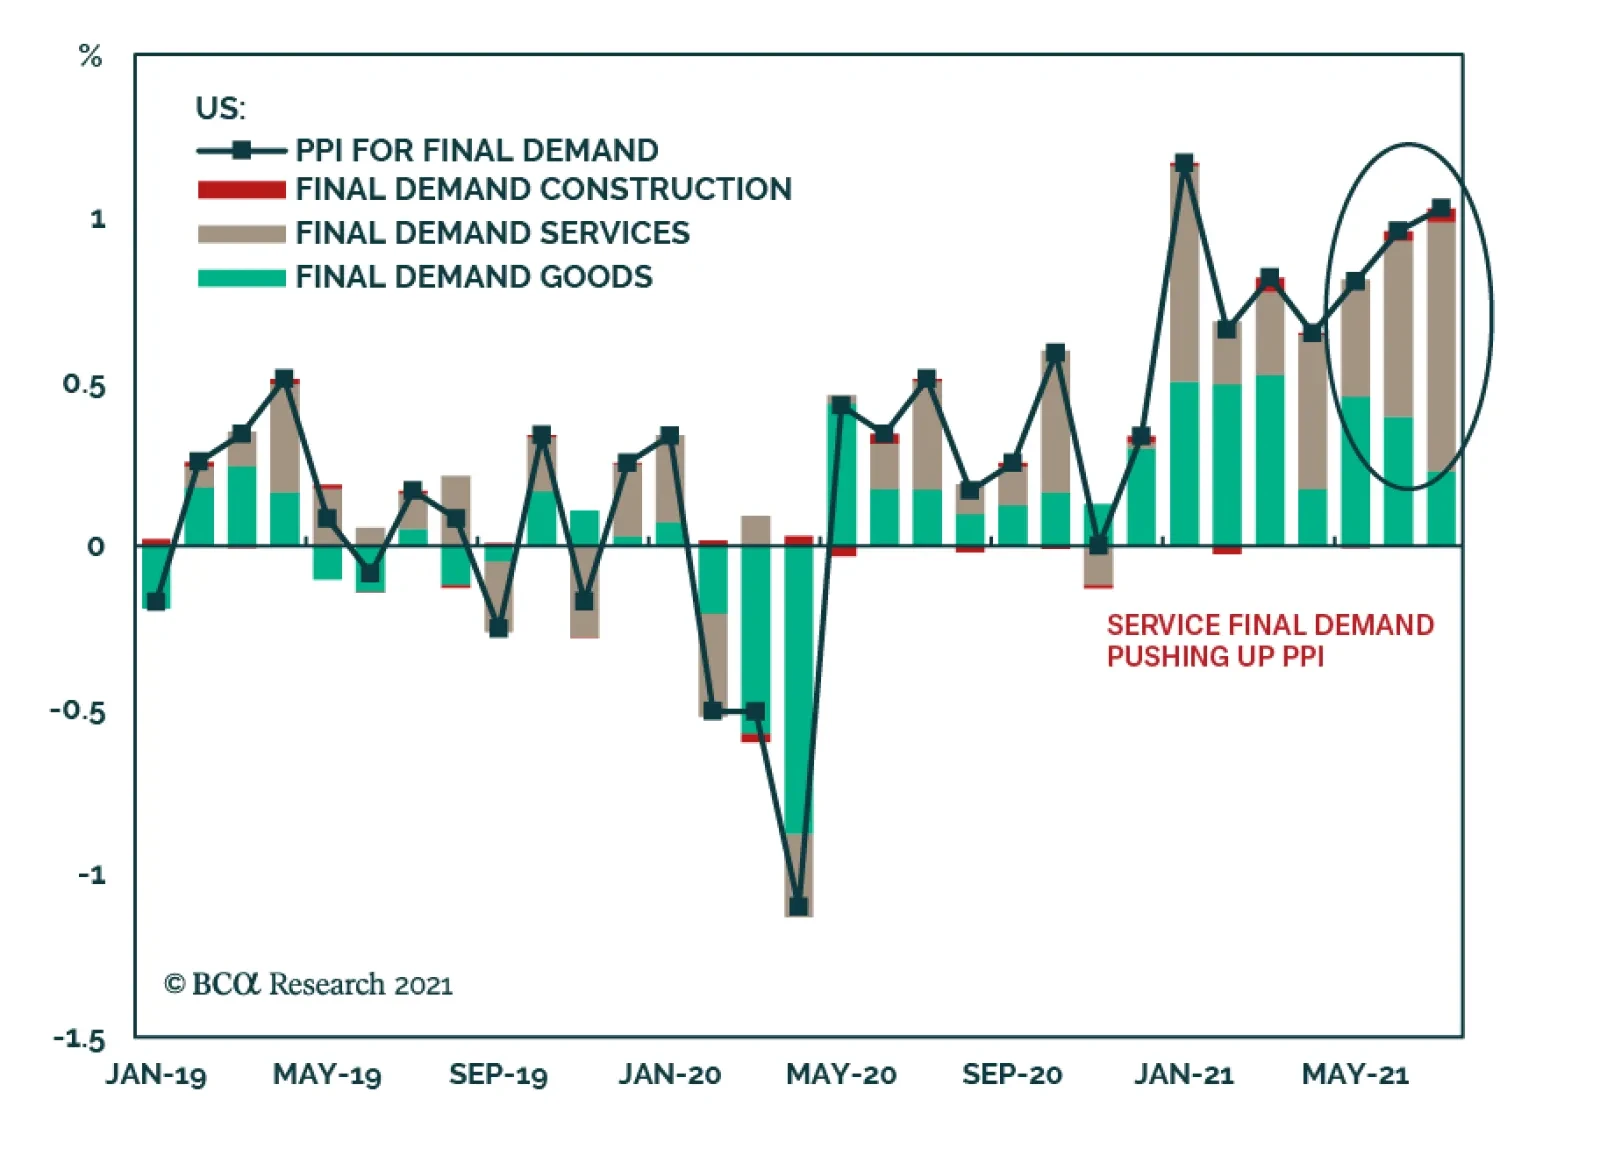
The US producer price index (PPI) report surprised to the upside in July. Both the headline PPI for final demand as well as the core measure of final demand PPI remained unchanged at 1.0% m/m, disappointing expectations they would ease to 0.6% and 0.5%,…
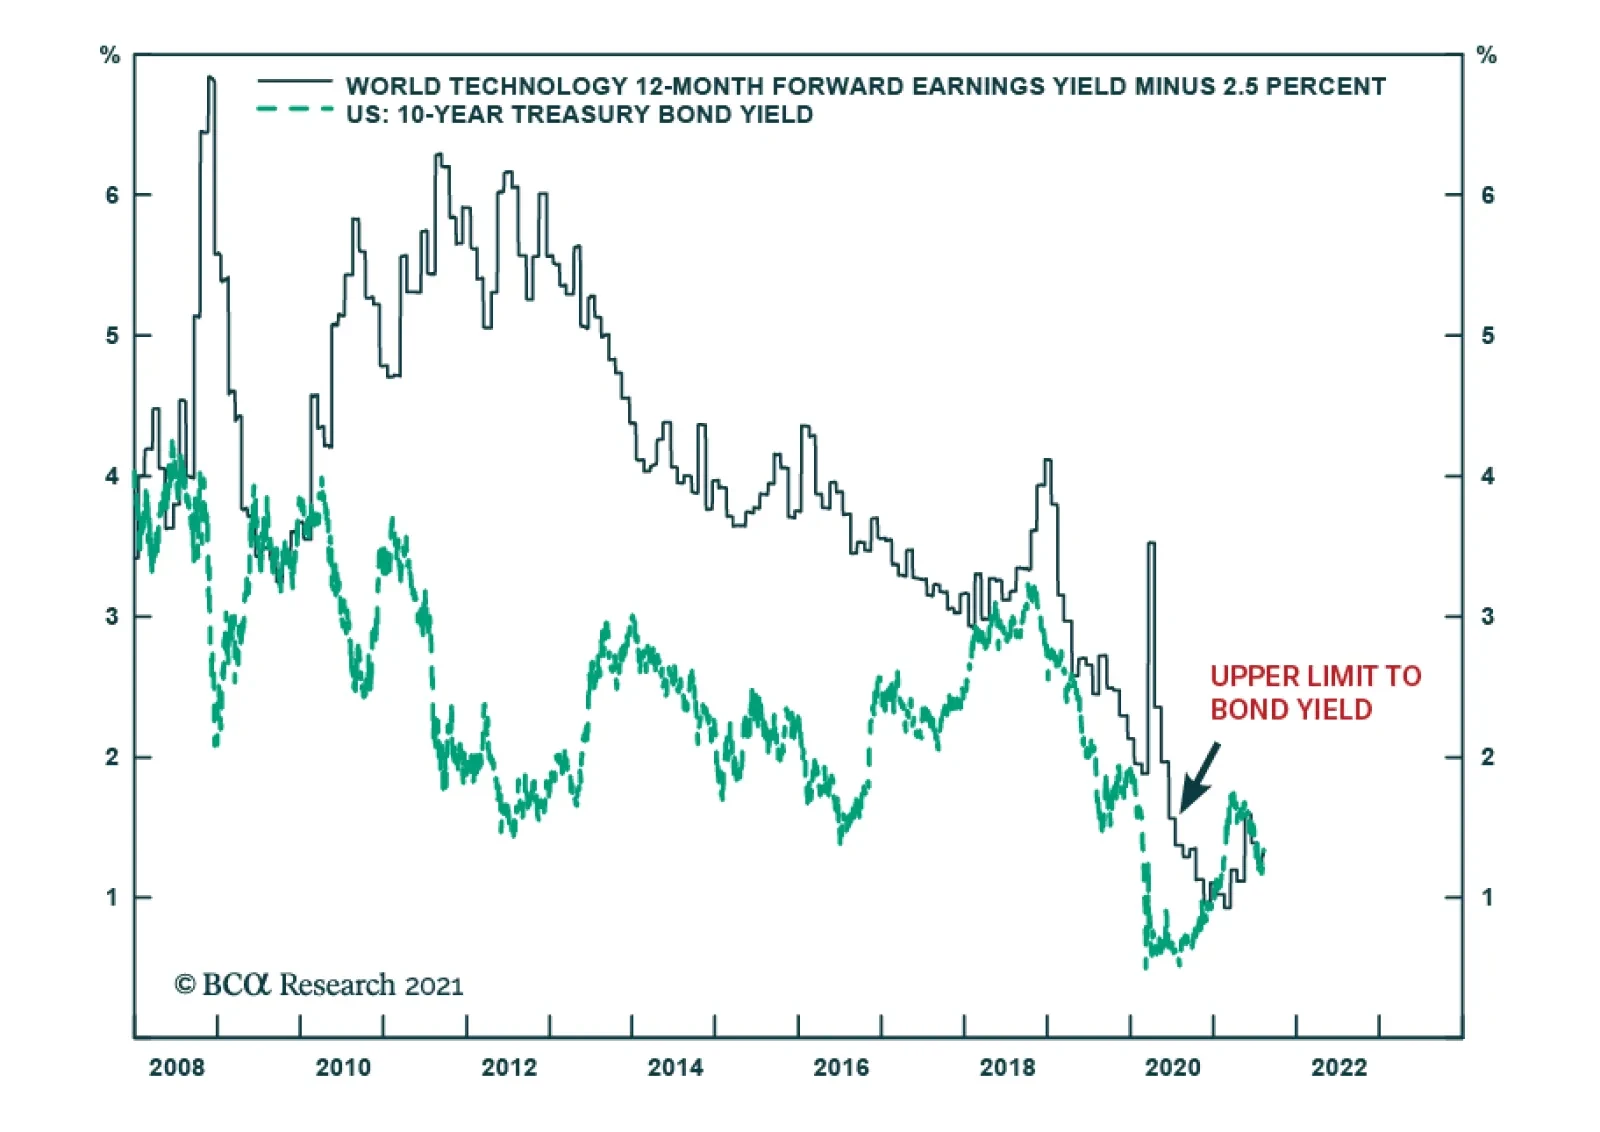
Our colleagues at BCA Research’s Counterpoint Strategy service observe that since 2008, a remarkable financial relationship has held true. The 10-year T-bond yield has struggled to exceed the earnings yield on technology stocks minus a constant of 2.5…
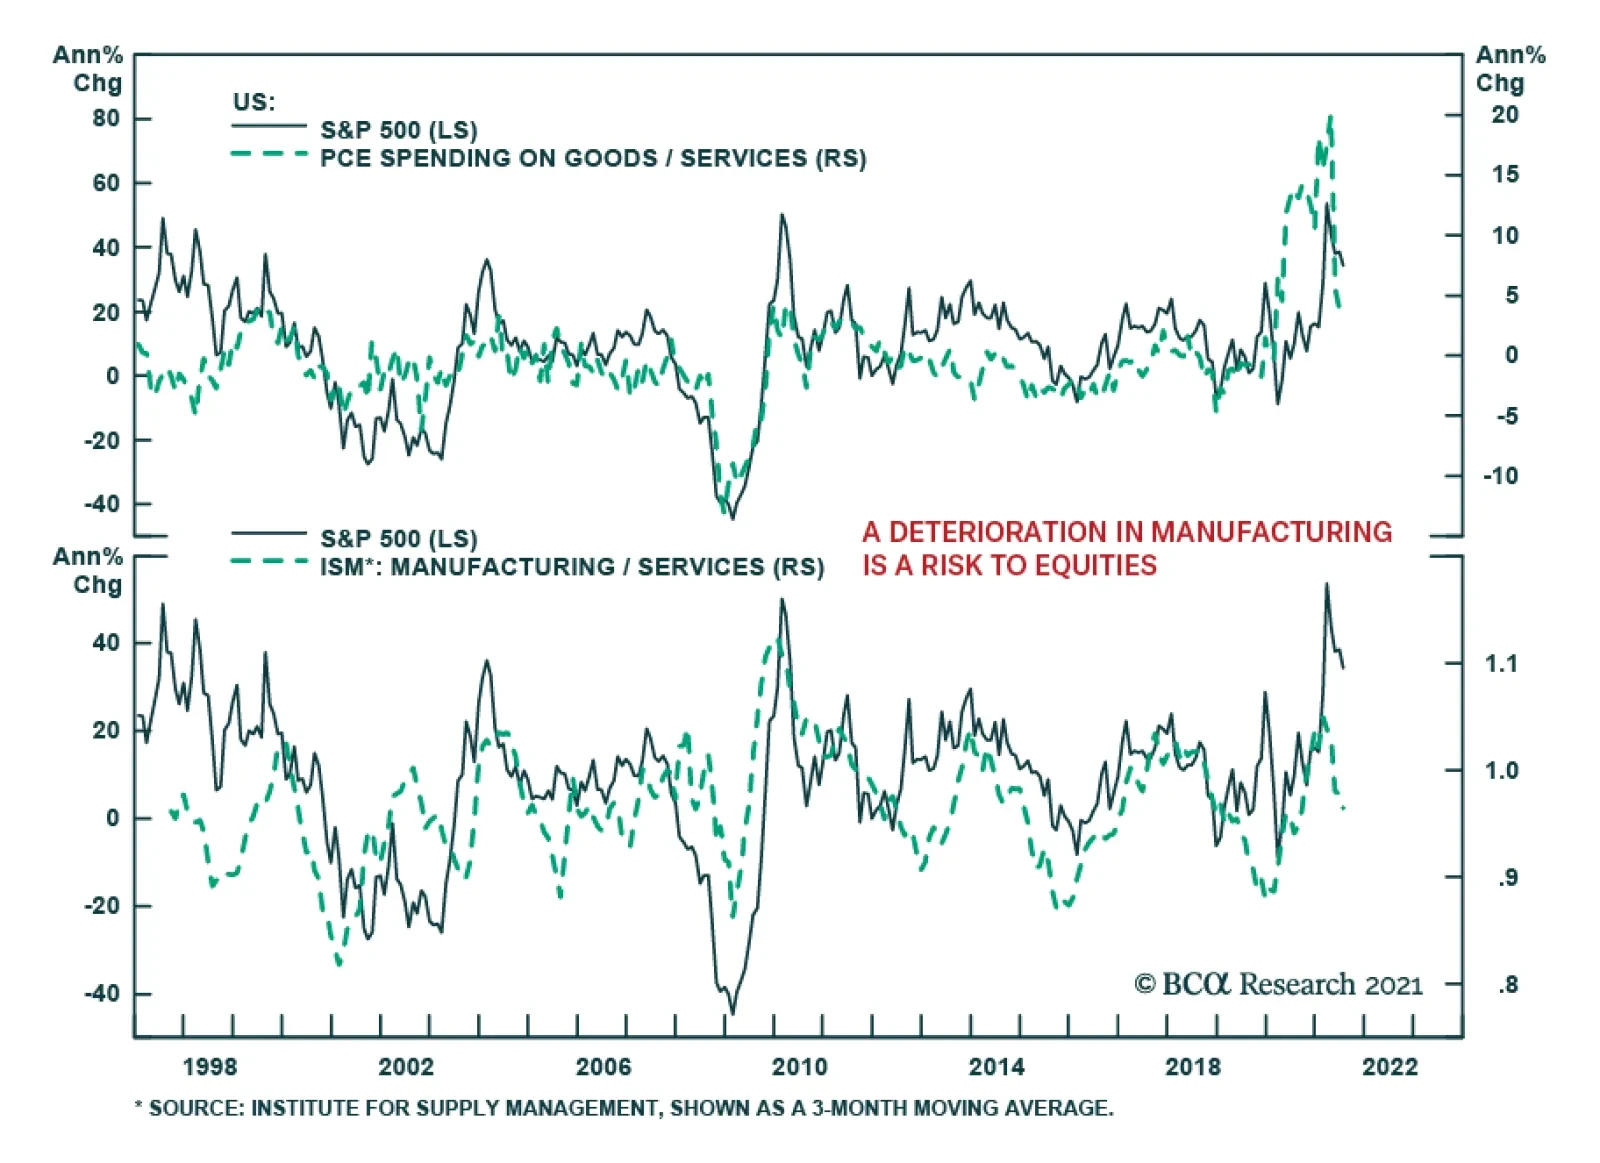
The chart above highlights that US equities benefit whenever spending on goods outpaces services spending. Similarly, US equities gain whenever the manufacturing ISM is accelerating relative to the services ISM. These relationships are intuitive. American…
Highlights Going into the new crop year, we expect the course of the broad trade-weighted USD to dictate the path taken by grain and bean prices (Chart of the Week). Higher corn stocks in the coming crop year, flat wheat stocks and lower rice stocks will leave grain markets mostly balanced vs the current crop year. Soybean stocks and carryover estimates from the USDA and International Grains Council (IGC) are essentially unchanged year-on-year (y/y). In the IGC's estimates, changes in production, trade, and consumption for the major grains and beans largely offset each other, leaving carryovers unchanged. Supply-demand fundamentals leave our outlook for grains and beans neutral. This does not weaken our conviction that continued global weather volatility will tip the balance of price risk in grains and beans over the coming year to the upside. Our strategically bearish USD view also tips the balance of price risk in grains – and commodities generally – to the upside. We believe positioning for higher-volatility weather events and a lower US dollar is best done with index products like the S&P GSCI and the COMT ETF, which tracks a version of the GSCI optimized for backwardation. Feature Chart of the WeekUSD Will Drive Global Grain Markets
USD Will Drive Global Grain Markets
USD Will Drive Global Grain Markets
Chart 2Opening, Closing Grain Stocks Will Be Largely Unchanged
Global Grain, Bean Markets Balanced; USD Expected To Drive '21/22 Prices
Global Grain, Bean Markets Balanced; USD Expected To Drive '21/22 Prices
Going into the new crop year, opening and closing stocks are expected to remain flat overall vs the current crop years, with changes in production and consumption largely offsetting each other in grain and bean markets (Chart 2).1 This will leave overall prices a function of weather – which no one can predict – and the path taken by the USD over the coming year. The IGC's forecast calls for mostly unchanged production and consumption for grains and beans globally, with trade volumes mostly flat y/y. This leaves global end-of-crop-year carryover stocks essentially unchanged at 594mm tons. The USDA expects wheat ending stocks at the end of the '21/22 crop year up a slight 0.5%; rice down ~ 4.5%, and corn up ~ 4%. Below we go through each of the grain and bean fundamentals, and assess the impact of COVID-19 on global trade in these commodities. We then summarize our overall view for the grain and bean complex, and our positioning recommendations. Rice The IGC forecasts higher global rice production and consumption, and, since they expect both to change roughly by the same amount, ending stocks are projected to remain unchanged in the '21/22 crop year relative to the current year (Chart 3). The USDA, on the other hand, is expecting global production to increase by ~ 1mm MT in the new crop year, with consumption increasing by ~ 8mm MT. This leaves ending inventories for the new crop year just under 8mm MT below '20/21 ending stocks, or 4.5%. Chart 3Global Rice Balances Roughly Unchanged
Global Rice Balances Roughly Unchanged
Global Rice Balances Roughly Unchanged
Corn The IGC forecasts global corn production will rise 6.5% to a record high in the '21/22 crop year, while global consumption is expected to increase 3.6%. Trade volumes are expected to fall ~ 4.2%, leaving global carryover stocks roughly unchanged (Chart 4). In the USDA's modelling, global production is expected to rise 6.6% in the '21/22 crop year to 1,195mm MT, while consumption is projected to rise ~ 2.4% to 1,172mm MT. The Department expects ending balances to increase ~ 11mm MT, ending next year at 291.2mm MT, or just over 4% higher. Chart 4Corn Balances Y/Y Remain Flat
Corn Balances Y/Y Remain Flat
Corn Balances Y/Y Remain Flat
Wheat The IGC forecasts global wheat production in the current crop year will increase by ~ 16mm MT y/y, which will be a record if realized. Consumption is expected to rise 17mm MT, with trade roughly unchanged. This leaves expected carryover largely unchanged at ~ 280mm MT globally (Chart 5). The USDA's forecast largely agrees with the IGC's in its ending-stocks assessment for the new crop year. Global wheat production is expected to increase 16.6mm MT y/y in '21/22, and consumption will rise ~ 13mm MT, or 1.7% y/y. Ending stocks for the new crop year are expected to come in at just under 292mm MT, or 0.5% higher. Chart 5Ending Wheat Stocks Mostly Unchanged
Ending Wheat Stocks Mostly Unchanged
Ending Wheat Stocks Mostly Unchanged
Soybeans Both the IGC and USDA expect increases in soybean ending stocks for the '21/22 crop year. However, the USDA’s estimates for ending stocks are nearly double the IGC projections.2 We use the IGC's estimates in Chart 6 to depicts balances. USDA - 2021/22 global soybean ending stocks are set to increase by ~3 mm MT to 94.5 mm MT, as higher stocks from Brazil and Argentina are partly offset by lower Chinese inventories. US production is expected to make up more than 30% of total production, rising 6% year-on-year. Chart 6Higher Bean Production Meets Higher Consumption
Higher Bean Production Meets Higher Consumption
Higher Bean Production Meets Higher Consumption
Impact Of COVID-19 On Ags Trade Global agricultural trade was mostly stable throughout the COVID-19 pandemic. China was the main driver for this resilience, accounting for most of the increase in agricultural imports from 2019 to 2020. Ex-China, global agricultural trade growth was nearly zero. During this period, China was rebuilding its hog stocks after an outbreak of the African Swine Flu, which prompted the government to grant waivers on tariffs in key import sectors, which increased trade under the US-China Phase One agreement. As a result, apart from COVID-19, other factors were influencing trade. Arita et. al. (2021) attempted to isolate the impact of COVID on global agricultural trade.3 Their report found that COVID-19 – through infections and deaths – had a small impact on global agricultural trade. Government policy restrictions and reduced mobility in response to the pandemic were more detrimental to agricultural trade flows than the virus itself in terms of reducing aggregate demand. Policy restrictions and lower mobility reduced trade by ~ 10% and ~ 6% on average over the course of the year. Monthly USDA data shows that the pandemic was not as detrimental to agricultural trade as past events. Rates of decline in global merchandise trade were sharper during the Great Recession of 2007 – 2009 (Chart 7). Many agricultural commodities are necessities, which are income inelastic. Furthermore, shipping channels for these types of commodities did not require substantial human interactions, which reduced the chances of this trade being a transmission vector for the virus, when governments declared many industries using and producing agricultural commodities as necessities. This could explain why agricultural trade was spared by the pandemic. Amongst agricultural commodities, the impact of the pandemic was heterogenous. For necessities such as grains or oilseeds, there was a relatively small effect, and in few instances, trade actually grew. For example, trade in rice increased by ~4%. The value of trade in higher-end items, such as hides, Chart 7COVID-19 Spares Ag Trade
Global Grain, Bean Markets Balanced; USD Expected To Drive '21/22 Prices
Global Grain, Bean Markets Balanced; USD Expected To Drive '21/22 Prices
Chart 8Grains Rallied During Pandemic
Global Grain, Bean Markets Balanced; USD Expected To Drive '21/22 Prices
Global Grain, Bean Markets Balanced; USD Expected To Drive '21/22 Prices
tobacco, wine, and beer fell during the pandemic. This was further proof of the income inelasticity of many agricultural products which kept global trade in this sector resilient. Indeed, the UNCTAD estimates global trade for agriculture foods increased 18% in 1Q21 relative to 1Q19. Over this period, Bloomberg's spot grains index was up 47.08% (Chart 8). Investment Implications We remain neutral grains and beans based on our assessment of the new crop-year fundamentals. That said, we have a strong-conviction view global weather volatility will tip the balance of price risk in grains over the coming year to the upside. Our strategically bearish USD view also tips the balance of price risk in grains – and commodities generally – to the upside. Weather-induced grain and bean prices volatility is supportive for our recommendations in the S&P GSCI and the COMT ETF, which tracks a version of the GSCI optimized for backwardation. These positions are up 5.8% and 7.9% since inception, and are strategic holdings for us. Robert P. Ryan Chief Commodity & Energy Strategist rryan@bcaresearch.com Ashwin Shyam Research Associate Commodity & Energy Strategy ashwin.shyam@bcaresearch.com Commodities Round-Up Energy: Bullish US natural gas prices remain well supported by increased power-generation demand due to heat waves rolling through East and West coasts, lower domestic production and rising exports. The US EIA estimates natgas demand for July rose 3.9 bcf/d vs June, taking demand for the month to 75.8 bcf/d. Exports – pipeline and LNG – rose 0.4 bcf/d to 18.2 bcf/d, while US domestic production fell to 92.7 bcf/d, down 0.2 bcf/d from June's levels. As US and European distribution companies and industrials continue to scramble for gas to fill inventories, we expect natgas to remain well bid as the storage-injection season winds down. We remain long 1Q22 call spreads, which are up ~214% since the position was recommended April 8, 2021 (Chart 9). Base Metals: Bullish Labor and management at BHP's Escondida copper mine – the largest in the world – have a tentative agreement to avoid a strike that would have crippled an already-tight market. The proposed contract likely will be voted on by workers over the next two days, according to reuters.com. Separately, the head of a trade group representing Chile's copper miners said prices likely will remain high over the next 2-3 years as demand from renewables and electric vehicles continues to grow. Diego Hernández, president of the National Society of Mining (SONAMI), urged caution against expecting a more extended period of higher prices, however, mining.com reported (Chart 10). We remain bullish base metals generally, copper in particular, which we expect to remain well-bid over the next five years. Precious Metals: Bullish US CPI for July rose 0.5% month-over-month, suggesting the inflation spike in June was transitory. While lower inflation may reduce demand for gold, it will allow the Fed to continue its expansionary monetary policy. The strong jobs report released on Friday prompted markets and some Fed officials to consider tapering asset purchases sooner than previously expected. The jobs report also boosted an increasing US dollar. A strong USD and an increase in employment were negative for gold prices on Monday. There also were media reports of a brief “flash crash” caused by an attempt to sell a large quantity of gold early in the Asian trading day, which swamped available liquidity at the time. This also was believed to trigger stops and algorithmic trading programs, which exacerbated the move. The potential economic impact of the COVID-19 Delta variant is the only unequivocally supportive development for gold prices. Not only will this increase safe-have demand for gold, but it will also prevent the Fed from being too hasty in tapering its asset purchases and subsequently raising interest rates. Chart 9
Natgas Prices Recovering
Natgas Prices Recovering
Chart 10
Copper Prices Going Down
Copper Prices Going Down
Footnotes 1 The wheat crop year in the US begins in June; the rice crop year begins this month; and the corn and bean crop years begin in September. 2 Historical data indicate this difference is persistent, suggesting different methods of calculating ending stocks. The USDA estimates ending stocks for the '21/22 crop year will be 94.5mm tons, while the IGC is projecting a level of 53.8mm. 3 Please refer to ‘Has Global Agricultural Trade Been Resilient Under Coronavirus (COVID-19)? Findings from an Econometric Assessment. This is a working paper published by Shawn Arita, Jason Grant, Sharon Sydow, and Jayson Beckman in May 2021. Investment Views and Themes Strategic Recommendations Tactical Trades Commodity Prices and Plays Reference Table Trades Closed in 2021 Summary of Closed Trades
Image
BCA Research’s US Political Strategy service concludes that uncertainty about the passage of Biden’s budget reconciliation bill and the debt ceiling will cause volatility to rise in financial markets. With a one-seat de facto majority in the Senate, and a…
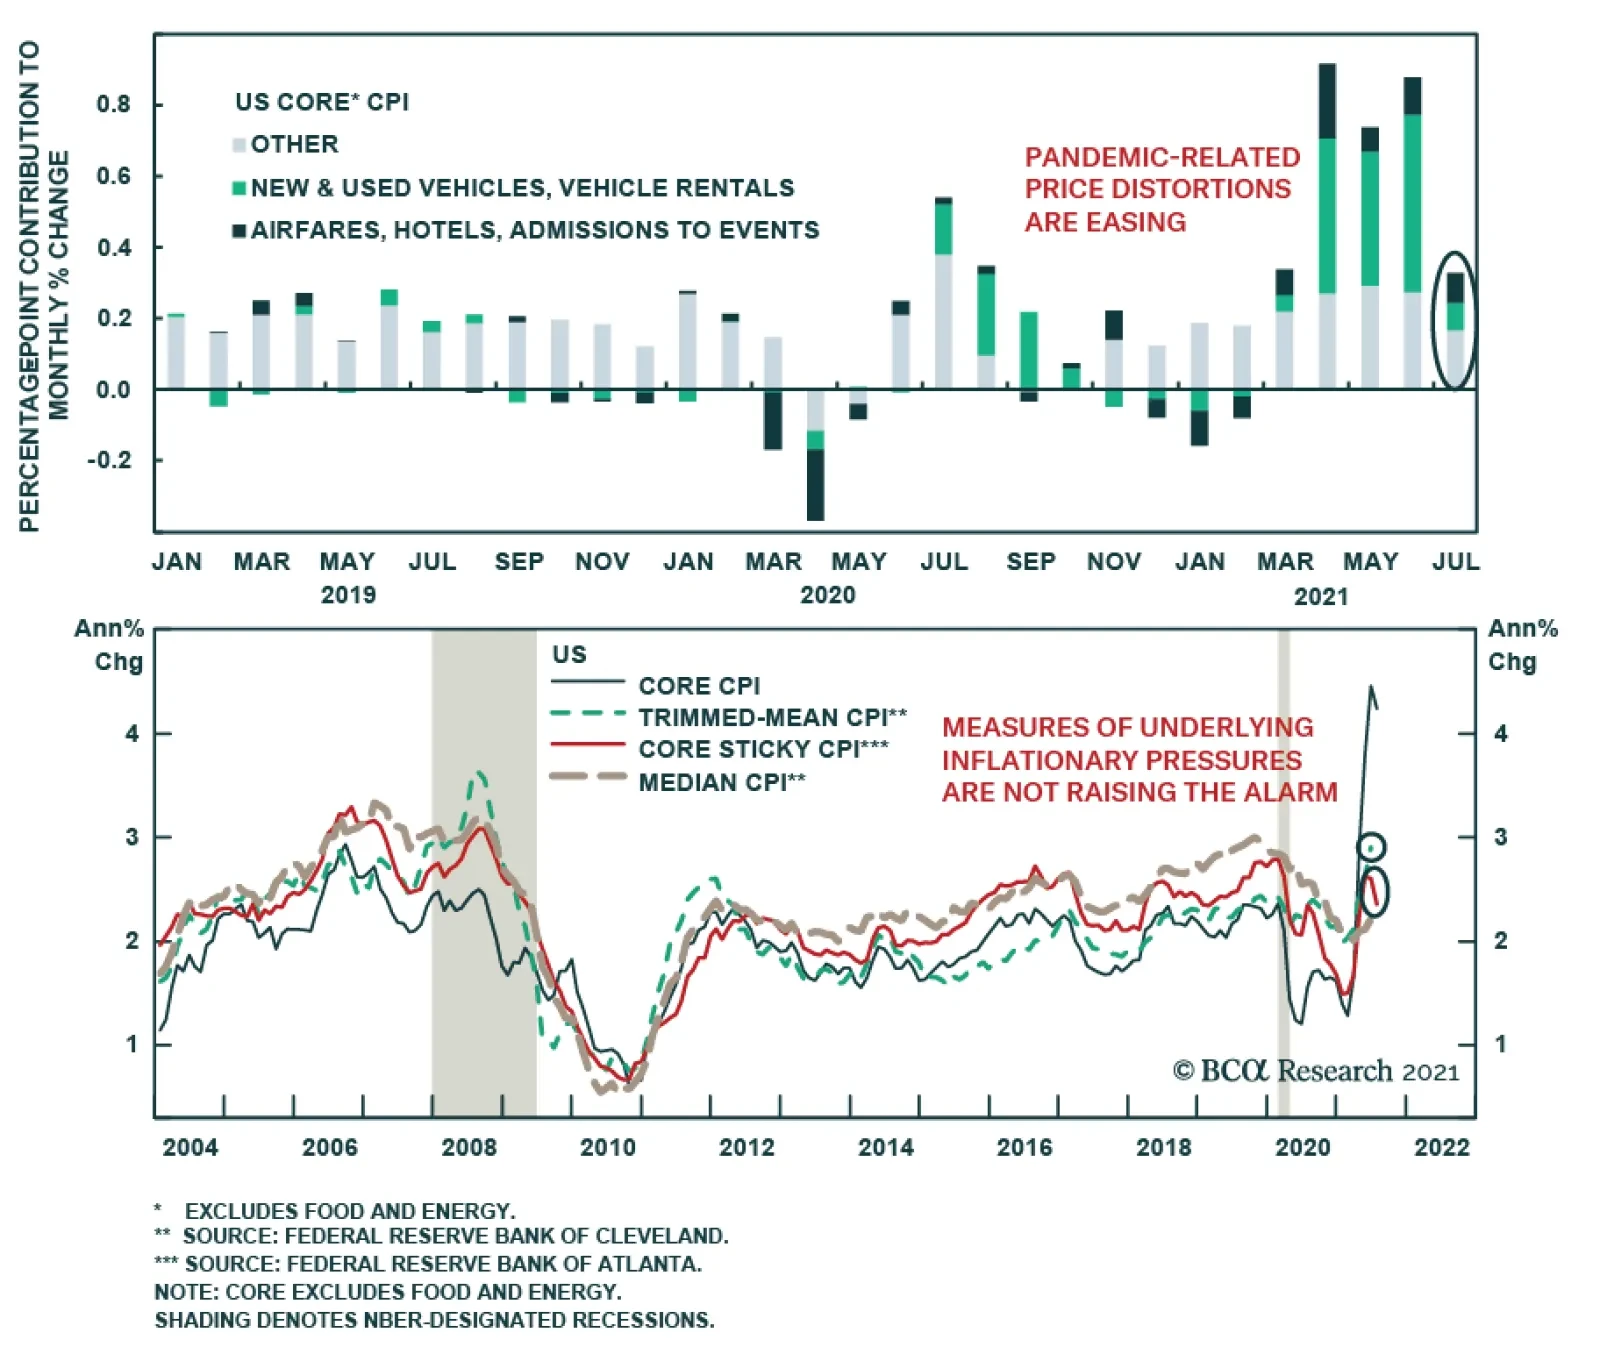
As expected, US Inflation moderated in July. The headline index slowed to 0.5% m/m from 0.9% m/m and core inflation eased to 0.3% m/m from 0.9% m/m. Notably, pandemic-related sectors that have been accounting for the bulk of the month-on-month inflation…
Highlights The greatest legislative battle of the Biden presidency will unfold between now and the end of the year. Biden’s bipartisan infrastructure deal is likely to pass the Senate soon but will have to cross several hurdles before passage in the House of Representatives. We maintain our 80% subjective odds that it will pass one way or another. Assuming the infrastructure bill does not fall apart, we will upgrade the odds that Biden’s budget reconciliation bill will pass this fall from 50% to 65%. The latter comprises a nominal $3.5 trillion in social spending and tax hikes that will be watered down and revised heavily by the time it passes, which may take until Christmas. Uncertainty about passage will cause volatility to rise in financial markets. Democrats left the debt ceiling out of their fiscal 2022 budget resolution, which ostensibly means they cannot raise the debt limit via a simple majority but will need 10 Republican senators to join. A bruising standoff will ensue that will add to volatility. Ultimately Republicans will comply as they cannot afford to be held responsible for a default on the national debt. The party is currently unpopular and tarred with accusations of insurrection. If Biden succeeds in passing both bills, US fiscal policy will be frozen in place through at least 2025, though endogenous disinflationary fears will largely be dispelled. Feature The biggest domestic political battle of the Joe Biden presidency is likely to occur between now and Christmas. With a one-seat de facto majority in the Senate, and a four-seat majority in the House, Biden is barely capable of passing his two outstanding legislative proposals. The first of these is the $550 billion bipartisan infrastructure deal, which we have given an 80% subjective chance of passing and which passed the Senate on a 69-30 vote margin as we went to press. The second is the $3.5 trillion partisan reconciliation package, based on the remainder of Biden’s American Jobs and Families Plan, which we have given a 50% chance of passage. We will upgrade these odds to 65% if bipartisan infrastructure does not fall through in the House. Next year will be consumed by campaigning for the 2022 midterms so it will be hard to pass any major legislation with such thin majorities (though bipartisan anti-trust legislation could pass and poses a risk to the equity market). The midterms are likely – though not guaranteed – to result in Republicans taking at least the House. The result will be gridlock in which only the rare bipartisan bill can pass. In other words, after Christmas, Biden’s domestic legislative capability and hence US fiscal policy will likely be frozen in place through 2025. In this report we provide a road map for the budget battle that will define the Biden presidency. Buy The Dip … Unless New Variants Change The Game First, a brief word regarding the COVID-19 pandemic. The Delta variant is ramping up, particularly in states where vaccination rates have lagged and social restrictions are minimal (Chart 1). The new lambda variant is also causing concerns that vaccines may be inadequate. Equity markets could easily suffer more downside in the near term but US-dedicated investors should consider the following: Scientists have created one vaccine for COVID-19 and can create others. There has been a concrete reduction in uncertainty since November 2020. Vaccination rates will never be perfect – many people smoke cigarettes and refuse to wear seat belts! – but greater infection rates and hospitalizations are leading to improvements in vaccination coverage. While new lockdowns are not impossible, the public will only support them as a last resort. Not only is the White House still officially opposed to new lockdowns but also the authority to impose lockdowns rests with governors. If hospital systems are crashing then even Republican governors will endorse new social restrictions. Otherwise, restrictions will not be draconian unless a much more virulent variant emerges (one that is more deadly or that has a worse impact on children). Monetary and fiscal stimulus will ramp up if a new variant is more deadly or the economy otherwise starts to slide back. In the US, additional fiscal stimulus will come faster than in other countries because new short-term measures can easily be tacked onto major bills that are already coming down the pike. Chart 1Stay Constructive Amid Delta Jitters
The Defining Budget Battle Of The Biden Presidency
The Defining Budget Battle Of The Biden Presidency
Might the White House leverage a renewed sense of crisis to get its main fiscal bills passed? We can see that. The last thing Biden needs is a sluggish recovery to translate into congressional gridlock in the 2022 midterms – the bane of the Obama administration. Rather, the goal is to harness the sense of crisis to pass stimulus. Biden’s approval rating is falling, as is the norm with modern presidents. However, it is still “above water” (net positive) and still sufficient to get his legislative initiatives across the line. Biden’s forthcoming bills will reinforce economic recovery and sentiment (Chart 2) Chart 2Biden’s Approval Comes Down To Earth
The Defining Budget Battle Of The Biden Presidency
The Defining Budget Battle Of The Biden Presidency
What if a variant evades vaccination? Especially if it is more deadly and/or more harmful to children? That would be a game changer and would cause at least a market correction. Still, investors would want to buy the dip given what they know today relative to what they knew in early 2020 (and given that they bought the dip in March 2020 even not knowing what they know today). Bipartisan Structural Reform Our second key view for 2021 – “bipartisan structural reform” – is coming to fruition with the Senate’s 69-30 vote passage of the American Infrastructure and Jobs Act as we go to press. Major bipartisan deals are rare in highly polarized America but we have given an 80% subjective chance of passage to this bill. Passage in the Senate reinforces that view, though the odds of final passage remain the same as there will be hurdles in the House. We include infrastructure as a “structural reform” because of its ability to increase the productivity of an economy. The bill contains funding for traditional infrastructure, like roads, bridges, and ports, as well as non-traditional infrastructure such as subsidies for electric vehicles and high-speed internet (Table 1). Table 1What’s In The Bipartisan Infrastructure Deal?
The Defining Budget Battle Of The Biden Presidency
The Defining Budget Battle Of The Biden Presidency
Table 2 shows the 19 Republican senators who voted in favor of this bipartisan deal, along with their ideological ranking and state support rates. This tally provides a nine-seat buffer in case the House version of the bill requires another Senate vote. It also provides a measure of the support that might be brought to bear for bipartisan causes later, such as funding the government, suspending the debt ceiling, or passing bills on popular issues (such as regulating Big Tech) in 2022-24. All Democrats voted in unison for the bill. Table 2Republican Senators Who Voted For Biden’s Bipartisan Infrastructure Bill
The Defining Budget Battle Of The Biden Presidency
The Defining Budget Battle Of The Biden Presidency
Our high confidence on infrastructure spending stems both from its popular support (Chart 3) and from the fact that even if bipartisanship fails, there remains a partisan option: budget reconciliation. This is still true today. The bipartisan infrastructure bill could still die in the House, given Speaker Nancy Pelosi’s determination to make its passage contingent on the success of the larger reconciliation bill, which is anathema to Republicans. But if it dies, Democrats would take up the key provisions in the reconciliation bill – and the odds of that bill passing would go up, not down, since Democrats would need to close ranks to clinch a legislative victory ahead of the midterms. Chart 3Popular Support For Bipartisan Infrastructure Deal
The Defining Budget Battle Of The Biden Presidency
The Defining Budget Battle Of The Biden Presidency
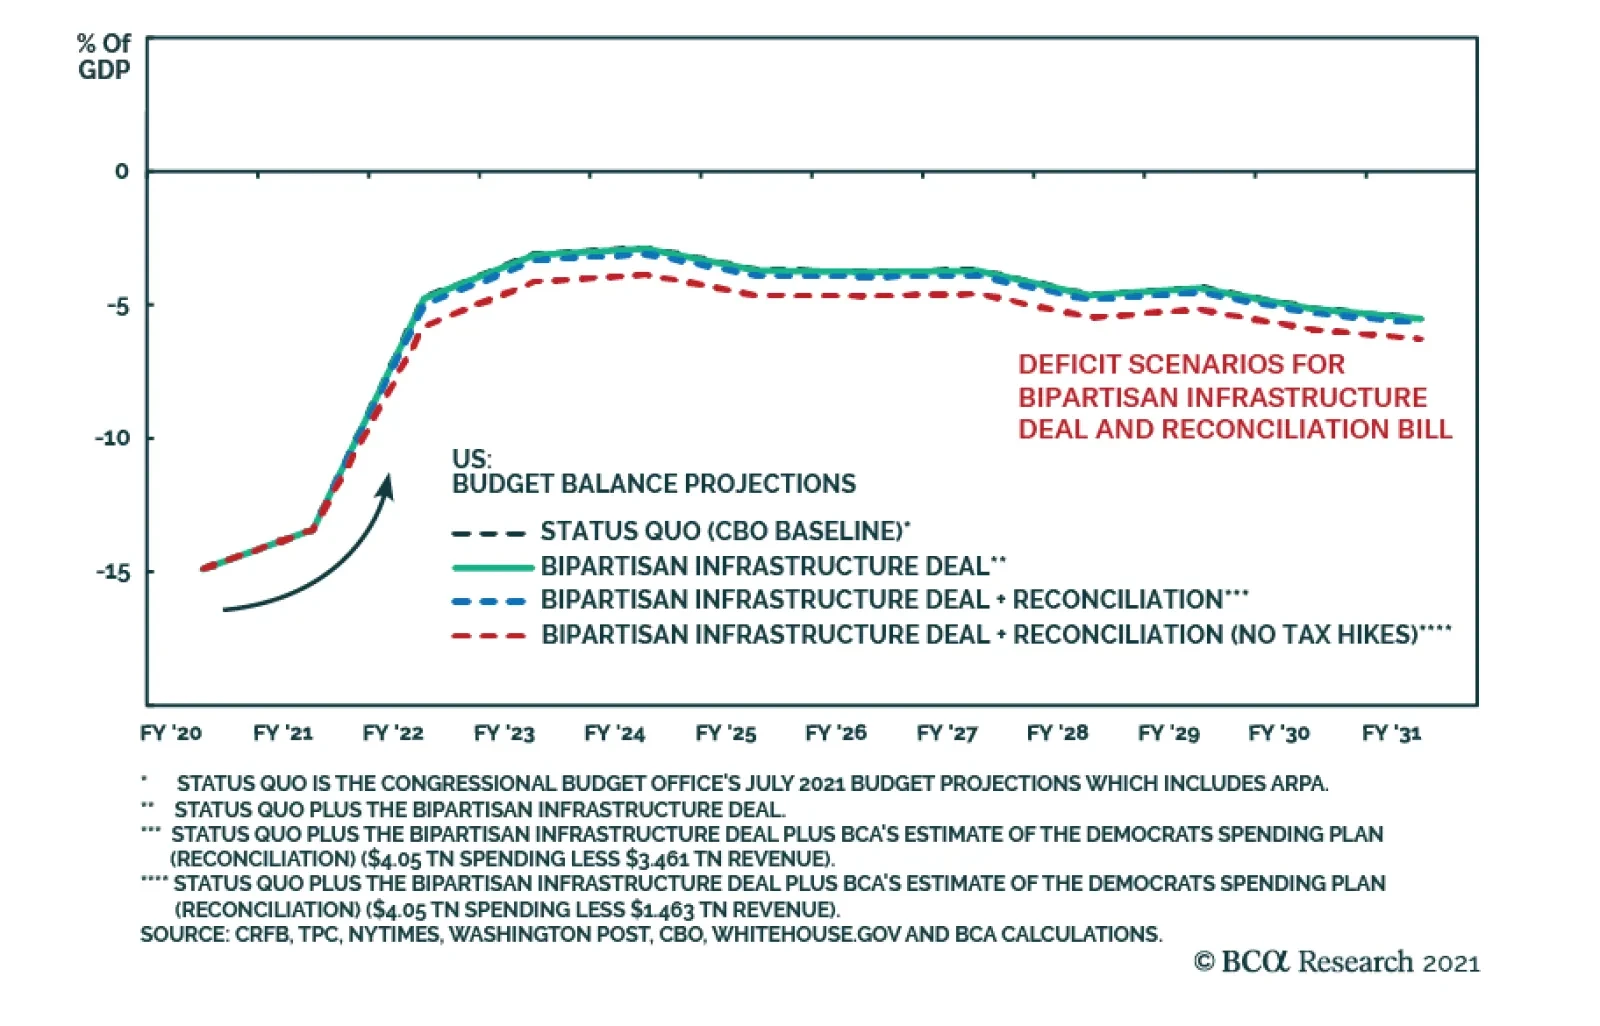
Thus the real risk is not that infrastructure spending will fail but that its success will reduce the political capital needed to pass the more controversial reconciliation bill, which we discuss below. Over the short and medium term, this bipartisan infrastructure deal emblematizes the sea change in US fiscal policy – the shift against austerity – and thus serves to dispel fears of disinflation. At the same time, the deal epitomizes America’s long-term fiscal predicament. Democrats only want to increase spending while Republicans only want to decrease taxes. The former will not make budget cuts while the latter will not hike taxes. The result, inevitably, is higher budget deficits. This is precisely what occurred with the latest agreement: tax measures to pay for new infrastructure spending are mostly chimerical – the Congressional Budget Office (CBO) estimates that only $200 billion of the new spending will be offset with new revenue. The other $350 billion will add directly to deficits and debt. The difference is small but the political signal is notable. Chart 4 highlights the increase in the deficit likely to occur, with the CBO’s more realistic assessment delineated from the nominal bill. From a macro point of view, the takeaway is that the US economy faces a stark withdrawal of government support in 2022 but this bill slightly cushions the blow. Continued recovery will depend on consumers and businesses (which look to be in good shape). Beginning in 2025 deficits will start to rise again and hence the overall picture is one in which US government support for the economy has taken a step up for the decade. Chart 4Bipartisan Deal Not Paid For = Fiscal Stimulus
The Defining Budget Battle Of The Biden Presidency
The Defining Budget Battle Of The Biden Presidency
Side note: Chart 4 is worrisome for President Biden if his reconciliation bill fails, as it points to fiscal drag through 2024, the election year. Bottom Line: We still see an 80% chance that Biden’s infrastructure proposals will pass, as the Democrats have a backup plan if the bipartisan deal somehow collapses in the House. Biden’s Greatest Legislative Battle Up till now we have assigned 50% odds of passage to the subsequent part of the Biden agenda, the American Families Plan, which covers social spending and tax hikes (corporate and individual). If bipartisan infrastructure passes promptly, we would upgrade the reconciliation bill’s odds of passing to 65%. The reason is twofold: first, reconciliation only requires a simple majority consisting of all 50 Senate Democrats plus the vice president; second, hesitant moderate senators ultimately will be forced to recognize that sinking the bill would render the Biden presidency defunct and fan the flames of populist rebellion on both sides of the political spectrum. And yet, since Biden cannot spare a single vote, conviction levels cannot be high. Therefore 65% seems appropriate. On August 9 Senate Democrats presented a $3.5 trillion budget resolution that will form the basis of the reconciliation bill this fall. The bill contains a wish list of spending priorities, as outlined in Table 3. Most of these are familiar from last month when the Senate Budget Committee first put forward its framework. The hang-up stems from House Speaker Pelosi. Knowing that infrastructure’s passage will suck away political capital from social spending, Pelosi is attempting to link the two bills. If the Senate fails to pass the reconciliation bill, the House will not pass the infrastructure bill. This gambit will create a big increase in uncertainty this fall as the legislative battle heats up. Republicans cannot support the infrastructure bill if it is directly tied to the Democrats’ “Nanny State” debt blowout, which will be the basis for their campaign against Democrats in future. They need plausible deniability. If Pelosi insists on linking the two bills, Republican support will evaporate. True, Democrats would then proceed to partisan reconciliation – but they would need to sacrifice other agenda items, such as subsidies for green tech, college, health care, and manufacturing (see Table 3 above). Table 3Senate Democratic FY22 Budget Resolution (July 2021)
The Defining Budget Battle Of The Biden Presidency
The Defining Budget Battle Of The Biden Presidency
Biden and the Senate are now united on the infrastructure bill. Biden and Democrats in marginal seats need a legislative victory ahead of the midterms – and a bipartisan victory on a popular policy like infrastructure is critical. A bird in the hand is worth two in the bush. Therefore, Pelosi will probably have to concede, after gaining assurances from moderate Senate Democrats that they will not sink reconciliation. Moderate Democrats, in turn, will need to see the reconciliation bill watered down, both on spending and taxes. Table 4 shows both bills together, as Biden’s “Build Back Better” agenda, with a baseline net deficit impact. Budget deficit scenarios are then updated in Chart 5. Once again what stands out is the large fiscal drag in 2022, the fiscal thrust for the remainder of the decade, and (in this case) minimal fiscal drag for 2024. Table 4Face Value Impact Of Biden’s Spending Proposals Before Congress (Baseline)
The Defining Budget Battle Of The Biden Presidency
The Defining Budget Battle Of The Biden Presidency
Chart 5Deficit Scenarios For Bipartisan Infrastructure Deal And Reconciliation Bill
The Defining Budget Battle Of The Biden Presidency
The Defining Budget Battle Of The Biden Presidency
This is true even if tax hikes fail to make it into the final reconciliation bill. We still maintain that the corporate tax rate will rise above Senator Joe Manchin’s ideal 25% rate (if not all the way to Biden’s 28%) while individual tax rates will return to pre-Trump levels. It is not clear if capital gains tax hikes will make the final cut. Most likely some tax hikes will occur but they will fall short of Biden’s plan, producing, at most, a one percentage point increase in the budget deficit relative to the Congressional Budget Office’s baseline estimate (Chart 6). Chart 6What Happens If Tax Hikes Fail To Pass Congress?
The Defining Budget Battle Of The Biden Presidency
The Defining Budget Battle Of The Biden Presidency
In Table 5 we update our various legislative scenarios, each consisting of different mixes of spending and tax hikes. We assume that the size of the bipartisan infrastructure deal will not be reduced in the House; that the revenue offsets of that deal will be $200 billion maximum; that moderate Senate Democrats will have greater success in watering down tax hikes than spending programs; and that the government overestimates its ability to collect revenue through tougher tax enforcement. Finally we assume that Senate Democrats’ spending proposals will not be cut – an extremely generous assumption that will not hold up in practice. Table 5Legislative Scenarios For Bipartisan Infrastructure Deal And FY22 Reconciliation Bill
The Defining Budget Battle Of The Biden Presidency
The Defining Budget Battle Of The Biden Presidency
Each legislative scenario’s impact on the deficit is shown in Table 6. The result is a wide range of deficit impacts, from the baseline of $588 billion to Scenario 6, with $2.59 trillion (zero tax offsets). The more realistic range is from $1 trillion to $2.3 trillion (i.e. all scenarios except the baseline and Scenario 5). Within this range the result depends on the moderate senators’ negotiation skills. Conservatively, the impact will range from $1-$1.5 trillion (Scenarios 1, 2, 4), with moderate senators preventing a $2 trillion price tag as politically impracticable (e.g. Scenario 3). Table 6Scoring Of Legislative Scenarios For Bipartisan Infrastructure Deal And FY22 Reconciliation Bill
The Defining Budget Battle Of The Biden Presidency
The Defining Budget Battle Of The Biden Presidency
There are two other aspects of Biden’s massive legislative battle this fall: regular government budget appropriations and the debt ceiling. Government appropriations are supposed to be passed by the end of the fiscal year, September 30, but often run over and likely will this time. Republicans will not support regular spending increases given that Democrats will ram through a partisan spending blowout. Therefore Congress will have to settle for a continuing resolution (a stop-gap measure) that keeps spending levels the same. Otherwise a government shutdown will occur. A shutdown is possible but would weigh heavily on Republicans’ public image, which is already at a low point in recent memory following the scandals of the Trump presidency. That is not all – there is also the debt ceiling (limit on national debt). Democrats made a major gambit by not including a suspension or increase of the debt ceiling in their fiscal 2022 budget resolution. If they had included it, then they could have raised the debt ceiling on their own with a simple majority when they passed their reconciliation bill. Instead they are attempting to make Republicans share the blame. Republicans, however, will mount an aggressive resistance, as they do not want to be seen as authorizing the debt increase necessary to accommodate the Democrats’ “socialist” spending spree. The “X date,” when the Treasury Department runs out of the ability to use extraordinary measures to make payments due on US debt, is expected sometime in October or November, though Treasury Secretary Janet Yellen warns it could come sooner and will try to pressure lawmakers. After this date the US would technically default on national debt obligations, triggering financial turmoil and potentially a global crisis. A debt ceiling showdown is virtually inevitable and volatility will rise – but ultimately a default will be averted, as we outlined in a recent report. First, Democrats still have the ability to revise the budget resolution so as to include a debt ceiling suspension in their final reconciliation bill. While Republicans could arguably block this attempt via a filibuster in the Budget Committee, they would have no interest in doing so (they could abstain and thus keep their hands clean of any debt ceiling increase). Second, Republicans can be forced to agree to a suspension of the debt ceiling when they fund the government, since it is necessary to do so anyway to fund their own infrastructure deal. Suspending the debt ceiling is not the same as raising it. New battles would be set up for later, in 2022 and beyond. But Republicans do not have the political ability to force a default on the public debt of the United States in the same year that Democrats accuse them of raising an insurrection against its Congress. Bottom Line: This fall will see the great legislative battle of the Biden presidency. Infrastructure spending has an 80% chance of passing. Pelosi will not be able to withstand Biden and the Senate in passing this deal separately from the more partisan reconciliation bill. If it passes, then Biden’s reconciliation bill will rise from 50% to 65% odds of passage. The latter will be watered down to a net deficit impact of $1-$1.5 trillion to secure the votes of moderate Senate Democrats, who ultimately will not betray their party to neuter Biden’s presidency. Thin margins in the House and Senate do not permit higher odds of passage or a high level of confidence. Investment Takeaways Political polarization has fallen sharply (Chart 7). This is connected to our view that the Republican Party is split, while Biden’s key initiative (infrastructure) has bipartisan support. However, Biden’s bipartisanship has resulted in a larger loss of Democratic support than a gain of Republican support (Chart 7, bottom panel). And the upcoming reconciliation bill will reignite Republican opposition. Moreover, polarization will remain at historically elevated levels, even to the point of generating domestic terrorist attacks, as we have argued. Biden’s approval rating has fallen but not enough to sink his legislative proposals. The overall economy is strong judging by both consumer confidence (Chart 8) and capital spending (Chart 9). Any soft patch in the economy in the near term will assist Biden in his legislative battles. Passage of either or both major bills will boost his approval rating, potentially ameliorating the Democrats’ challenging situation in the 2022 midterms. Chart 7Bipartisan Biden Lowers Polarization As Dems Waver
Bipartisan Biden Lowers Polarization As Dems Waver
Bipartisan Biden Lowers Polarization As Dems Waver
Chart 8US Consumer Confidence Soars
US Consumer Confidence Soars
US Consumer Confidence Soars
Chart 9US Capital Spending At Peak Levels
US Capital Spending At Peak Levels
US Capital Spending At Peak Levels
Still, we expect investors to “buy the rumor and sell the news” of Biden’s upcoming stimulus bills. After the Senate passes the reconciliation measure, investors will have to look forward to the combined impact of tax hikes, the Fed’s tapering of asset purchases and eventual rate hikes, and the various troubles with global growth and geopolitical risk. Until that time, investors must weigh the risks of the COVID-19 variants against actions by both American and Chinese policymakers to dispel deflationary tail risks. Thus for now we are sticking with our key trades of the year: value stocks, materials, and infrastructure plays (Chart 10). After Biden wins his big legislative battles, we will reassess. Matt Gertken Vice President Geopolitical Strategy mattg@bcaresearch.com Jesse Anak Kuri Associate Editor jesse.Kuri@bcaresearch.com Chart 10Buy Rumor, Sell News On Biden Plan
Buy Rumor, Sell News On Biden Plan
Buy Rumor, Sell News On Biden Plan
Appendix Table A1USPS Trade Table
The Defining Budget Battle Of The Biden Presidency
The Defining Budget Battle Of The Biden Presidency
Table A2Political Risk Matrix
The Defining Budget Battle Of The Biden Presidency
The Defining Budget Battle Of The Biden Presidency
Chart A1Presidential Election Model
The Defining Budget Battle Of The Biden Presidency
The Defining Budget Battle Of The Biden Presidency
Chart A2Senate Election Model
The Defining Budget Battle Of The Biden Presidency
The Defining Budget Battle Of The Biden Presidency
Table A3Political Capital Index
The Defining Budget Battle Of The Biden Presidency
The Defining Budget Battle Of The Biden Presidency
Table A4APolitical Capital: White House And Congress
The Defining Budget Battle Of The Biden Presidency
The Defining Budget Battle Of The Biden Presidency
Table A4BPolitical Capital: Household And Business Sentiment
The Defining Budget Battle Of The Biden Presidency
The Defining Budget Battle Of The Biden Presidency
Table A4CPolitical Capital: The Economy And Markets
The Defining Budget Battle Of The Biden Presidency
The Defining Budget Battle Of The Biden Presidency
Footnotes