United States

Highlights Portfolio Duration: The decline in US bond yields is overdone. We anticipate that strong US employment data will catalyze a jump in bond yields this fall and that the 10-year US Treasury yield will reach a range of 2% - 2.25% by the time that the Fed is ready to lift rates, likely by the end of 2022. Maintain below-benchmark duration in bond portfolios. US Yield Curve: Investors should position for a rebound in bond yields but not a reversal of recent US Treasury curve flattening. In fact, we advocate owning 2/10 flatteners on the US Treasury curve as we see ample room for further curve flattening as Fed rate hikes approach in late-2022. ECB: The ECB’s new forward interest rate guidance has moved it that much closer to the Fed’s ultra-accommodative stance. This reinforces the defensive nature of the European bond market. Investors should overweight European bonds within global fixed income portfolios with a particular emphasis on peripheral European bond markets like Italy and Spain. Feature Chart 1Can The Bond Rally Continue?
Can The Bond Rally Continue?
Can The Bond Rally Continue?
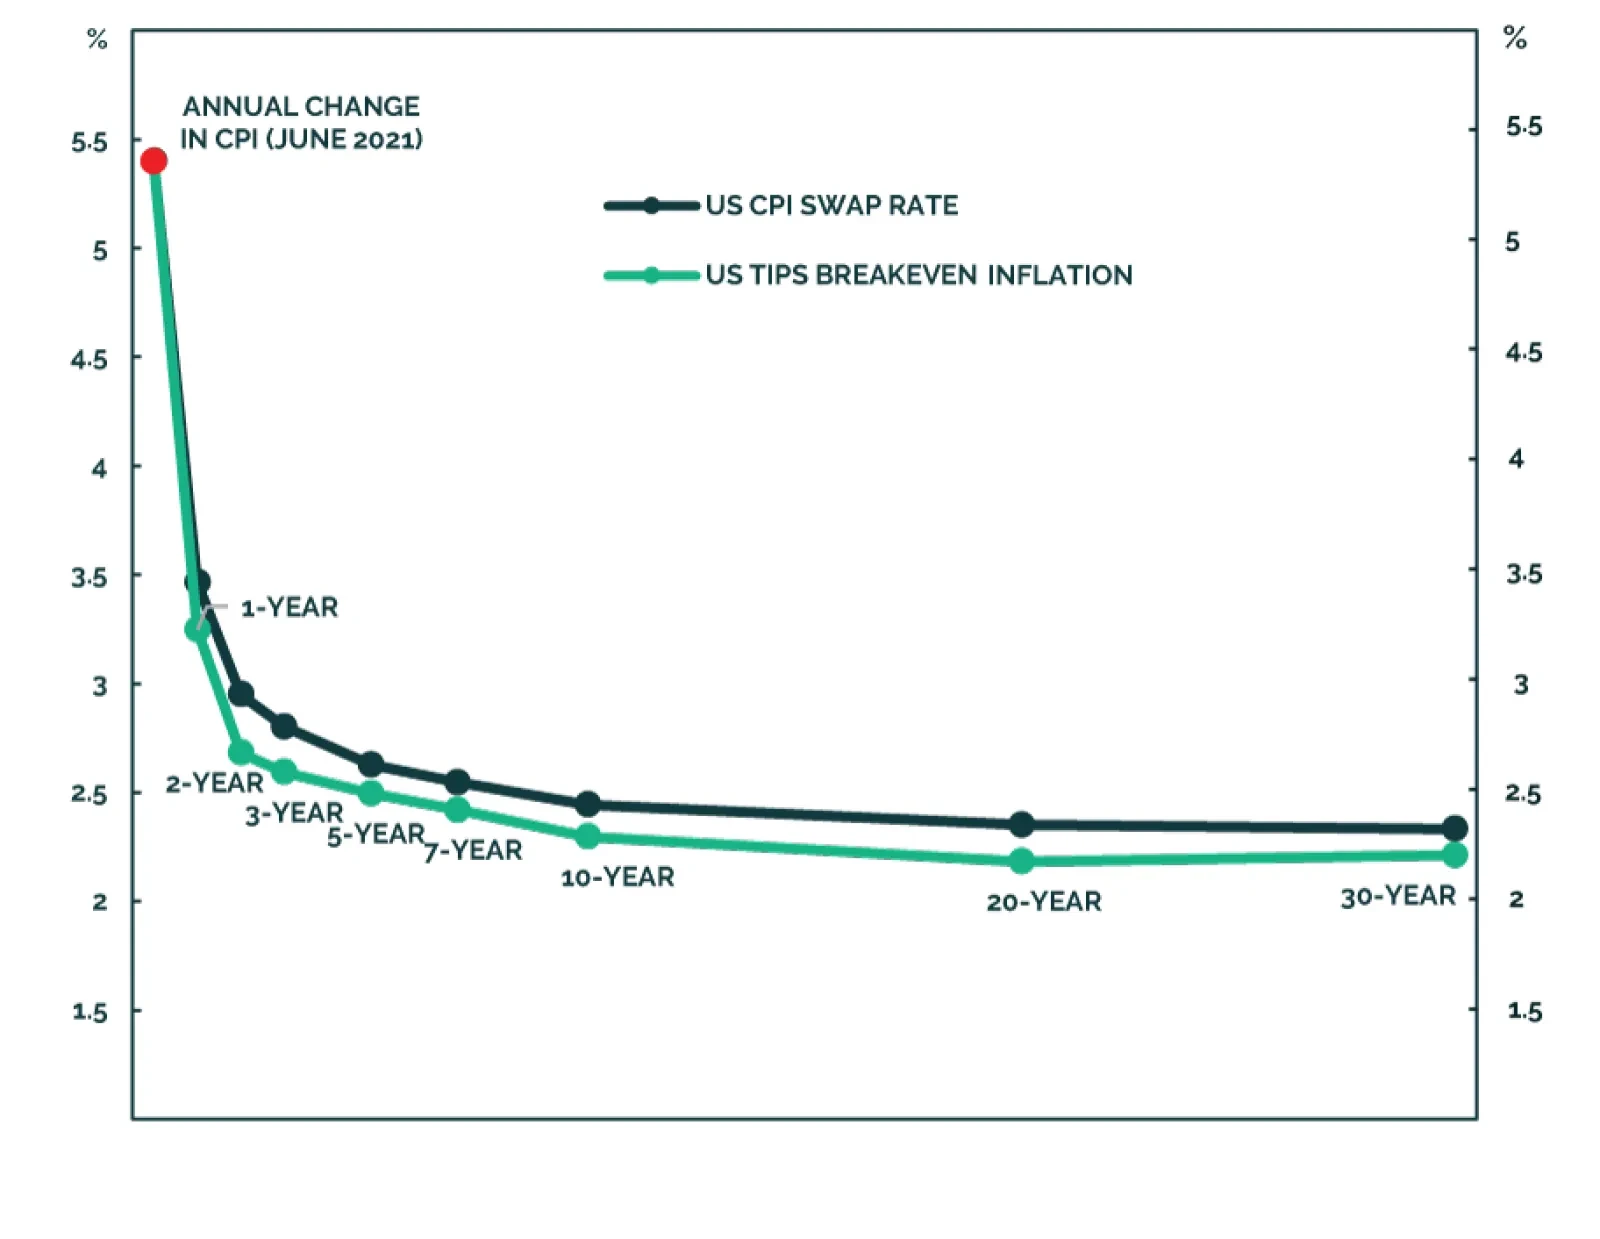
The bond rally continues to rip. The selloff that started last August when Jay Powell officially announced the Federal Reserve’s adoption of an Average Inflation Target ended on March 31st 2021. Since then, the 10-year US Treasury yield has retraced from 1.74% to 1.29% and the Bloomberg Barclays US Treasury index has clawed back 285 bps of excess return versus cash, partially offsetting the 465 bps that were lost between August 2020 and March 2021 (Chart 1). The US Bond Strategy Weekly Report from two weeks ago and last week’s Global Fixed Income Strategy Weekly Report both discuss the reasons for recent bond market strength.1 We won’t re-hash those arguments this week except to reiterate our conclusion that the decline in US bond yields is overdone. We anticipate that strong US employment data will catalyze a jump in bond yields this fall and that the 10-year US Treasury yield will reach a range of 2% - 2.25% by the time that the Fed is ready to lift rates, likely by the end of 2022. The first section of this week’s report looks at whether correlations between different asset classes have held up during the recent bond rally, with a focus on whether those relationships give us any information about the near-term direction for bond yields. The second section considers the outlook for the slope of the US Treasury curve and the third section discusses the recently released results of the European Central Bank’s strategy review. Cross-Market Correlations During The Bond Rally The bond rally has been just as intense as the prior sell-off. The US Treasury index has outperformed a position in cash by an annualized 9% since March 31st, matching the annualized losses of 9% seen between August 2020 and March 2021 (Chart 2). An important question to answer is whether this bond market performance is consistent with other asset classes. If it is, then it may suggest that the economy is experiencing a deflationary episode and that bond yields have further downside. If it isn’t, then it is more likely that the drop in bond yields will be temporary. Chart 2Bonds Versus Credit And Equities
Bonds Versus Credit And Equities
Bonds Versus Credit And Equities
Bonds Versus Equities And Corporate Credit Chart 3Equity Sector Performance Consistent With Yields
Equity Sector Performance Consistent With Yields
Equity Sector Performance Consistent With Yields
Looking first at corporate bonds, we find that – consistent with stronger Treasury performance – excess US corporate bond returns have slowed since March 31st. Baa-rated corporates have been outperforming at an annualized rate of 3% since March 31st compared to an annualized rate of 12% between August 2020 and March 2021 (Chart 2, panel 2). Equities, on the other hand, have maintained their strong performance. The S&P 500 returned an annualized 30% between August 2020 and March 2021 and has returned an even greater 42% (annualized) since the end of March (Chart 2, panel 3). Extremely tight spreads are the most likely explanation for lower corporate bond excess returns. Meanwhile, the fact that equities continue to perform well is an indication that the drop in bond yields may be overdone. Interestingly, while overall equity returns haven’t dropped in line with bond yields, the relative performance of equity sectors has been totally consistent with the movement in yields (Chart 3). Cyclical equity sectors (Industrials, Energy and Materials) have underperformed defensive equity sectors (Healthcare, Telecoms, Consumer Staples and Utilities) and Banks have underperformed the overall index. The correlation between long-maturity real Treasury yields and the relative performance of value and growth stocks has also held up, with growth stocks outperforming since the end of March (Chart 3, bottom panel). Bonds Versus Commodities Chart 4Commodities And Bonds Have Diverged
Commodities And Bonds Have Diverged
Commodities And Bonds Have Diverged
We see the biggest divergence in relative performance between bond yields and commodities. Historically, the ratio between the CRB Raw Industrials commodity price index and Gold is tightly correlated with the 10-year US Treasury yield. However, the CRB/Gold ratio has increased since the end of March while bond yields have fallen (Chart 4). In our view, this is the strongest piece of evidence suggesting that bond yields have overshot to the downside. Bonds Versus Currencies Chart 5Bonds Versus Currencies
Bonds Versus Currencies
Bonds Versus Currencies
Finally, we observe that the US dollar has strengthened as bond yields have dropped. This is not that unusual. There are other periods when significant declines in US bond yields have coincided with dollar strength, 2019 and 2014/15 immediately come to mind (Chart 5). The common theme of those prior episodes is that the global economy was experiencing a deflationary shock. Commodity prices also fell during those periods and Emerging Market (EM) currencies depreciated versus the dollar. However, so far this year, EM currencies have held firm versus the dollar (Chart 5, bottom panel) and commodity prices continue to rise. On balance, financial markets don’t appear to be pricing-in a deflationary economic shock. In summary, since US Treasury yields peaked on March 31st, we have observed a sector rotation within US equities, but overall stock market performance has been strong. Corporate bonds continue to outperform Treasuries, though gains are limited by tight valuations. Commodity prices have held up and while the US dollar has firmed, dollar strength has not bled into EM currency weakness. All in all, we don’t view financial market performance as consistent with a deflationary economic episode. This suggests that bond yields are an outlier within the financial landscape and that the recent drop in yields won’t persist. A Quick Word On Sentiment And Positioning Chart 6A Rebound In Yields May Require A Shift In Sentiment
A Rebound In Yields May Require A Shift In Sentiment
A Rebound In Yields May Require A Shift In Sentiment
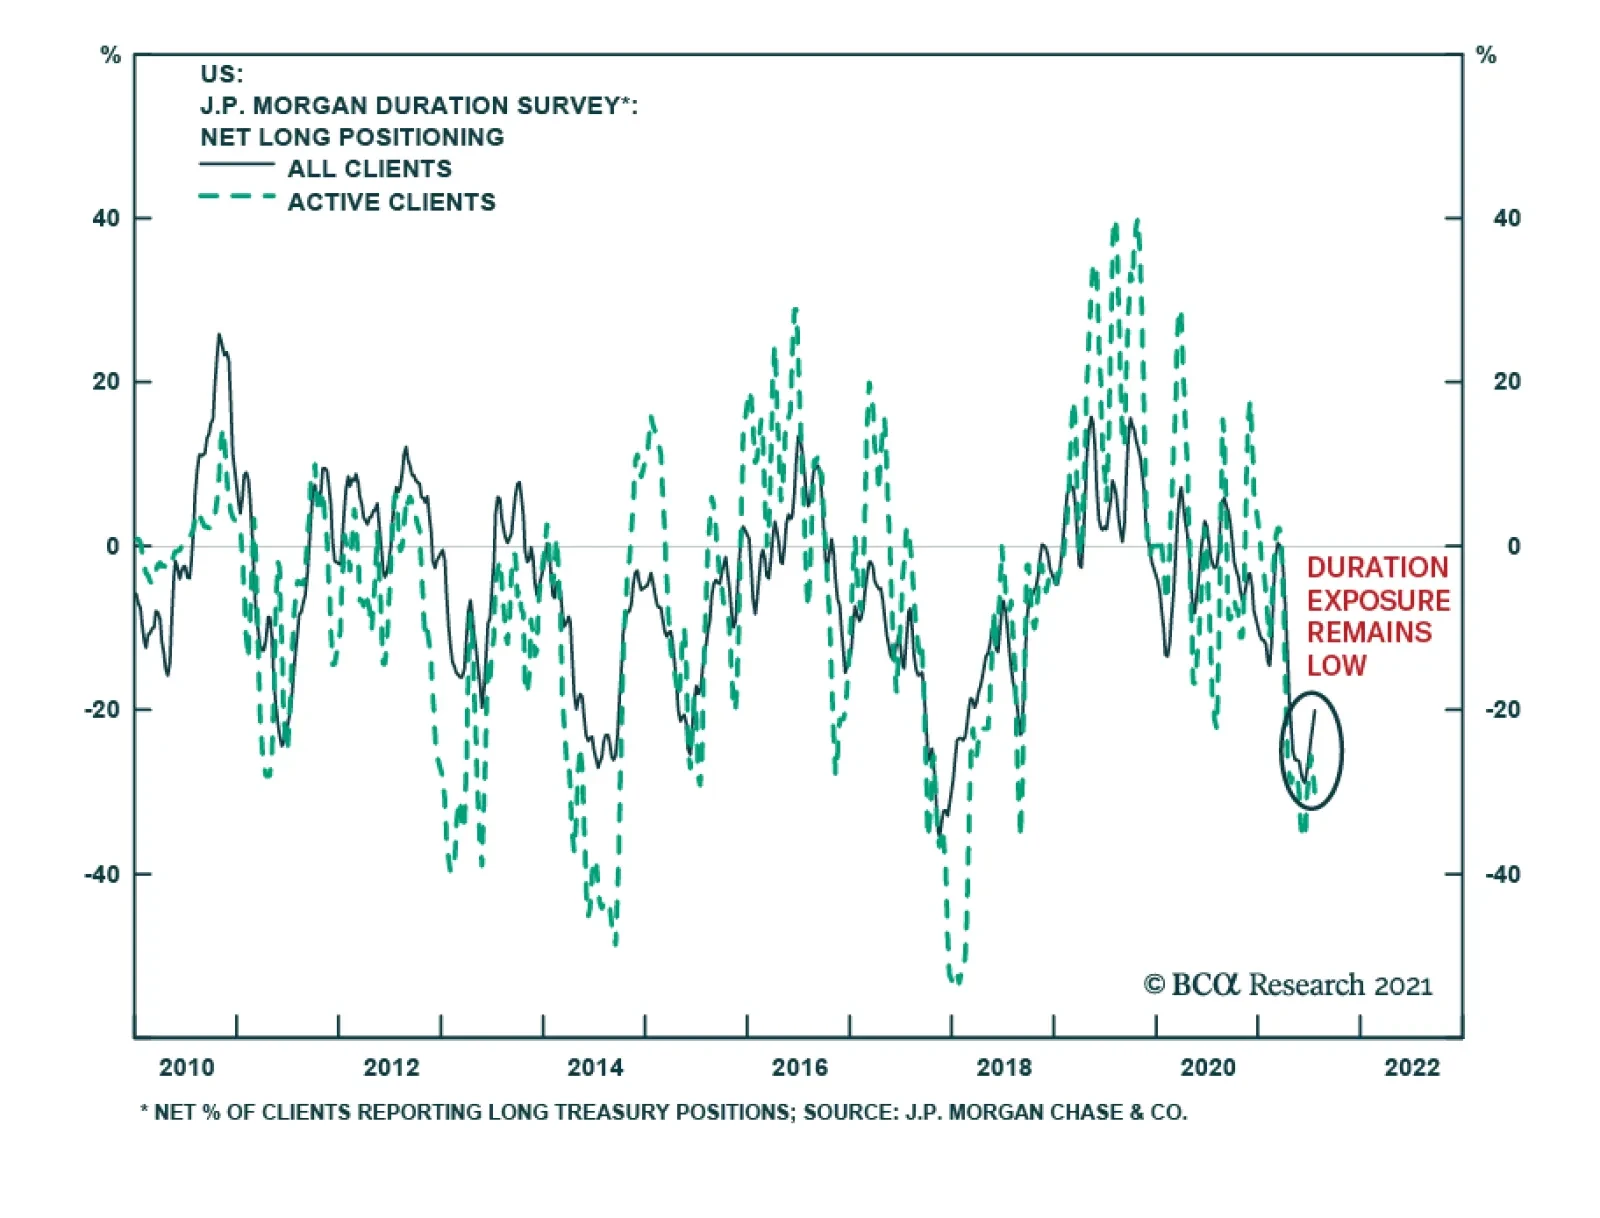
One possible reason why bond performance has been inconsistent with some other markets is that there had simply been too much consensus around the “bond-bearish trade”. It’s certainly true that portfolio managers have been running large net-short positions and that the MarketVane survey of bond bullish sentiment is much less bullish than it was last year (Chart 6). We suspect that we may need to see bond market positioning and sentiment get more bullish before yields move meaningfully higher. Chart 6 shows that major troughs in the 30-year US Treasury yield often occur when portfolio manager positioning is “net long” bonds and when bond bullish sentiment is significantly higher than current levels. For this reason, we don’t anticipate an immediate rebound in bond yields. Rather, we suspect that yields will remain near current levels for the next month or two before strong employment data in the fall sets off the next phase of bearish bond action. Position For A Rebound In Bond Yields, But Don’t Expect Much Curve Steepening Chart 7The 5-Year/5-Year Yield Remains Close To Target
The 5-Year/5-Year Yield Remains Close To Target
The 5-Year/5-Year Yield Remains Close To Target
We see bond yields re-gaining their March 2021 highs, and then some, on a 6-12 month investment horizon. However, we don’t think this rebound in yields will coincide with a significant re-steepening of the US Treasury curve. For context, the 2/10 US Treasury slope peaked at 159 bps near the end of March. It is currently 51 bps lower, at 108 bps. We can categorize periods of yield curve steepening as falling into two categories. Bull-steepening: The curve steepens as yields fall. This tends to occur when the Fed is cutting interest rates. Bear-steepening: The curve steepens as yields rise. We can identify these periods as being when the 5-year/5-year forward Treasury yield rises from low levels toward its fair value range. Since 2012, we can identify a fair value range for the 5-year/5-year forward US Treasury yield using survey estimates of the long-run neutral fed funds rate. At present, the fair value range from the New York Fed’s Survey of Primary Dealers is from 2.06% to 2.50%, with a median of 2.31%. The fair value range from the New York Fed’s Survey of Market Participants is from 1.75% to 2.50%, with a median of 2.00%. The 5-year/5-year forward US Treasury yield is currently 1.93% (Chart 7). We identify seven significant periods of 2/10 Treasury curve steepening since 2009 (Table 1). Six of those episodes were bear-steepening episodes that coincided with an increase in the 5-year/5-year yield, the other was a bull-steepening episode that coincided with Fed rate cuts in 2019/20. If we assume that our fair value ranges provide a reasonable target for how high the 5-year/5-year forward US Treasury yield can rise during the next bear-steepening move, it means that – at most – we could see an increase of 57 bps in the 5-year/5-year yield as it moves all the way up to the 2.50% top-end of our target ranges. A linear regression of changes in the 2/10 slope versus changes in the 5-year/5-year forward yield during the six bear-steepening episodes we identified suggests that a 57 bps increase in the 5-year/5-year yield would lead to 12 bps of 2/10 curve steepening (Chart 8). In fact, we can see in both Table 1 and Chart 8 that it would take about 100 bps of upside in the 5-year/5-year yield to bring the 2/10 slope back to its March highs. This is extremely unlikely. Table 1Periods Of US Treasury Curve Steepening In The Zero-Lower-Bound Era
A Bump On The Road To Recovery
A Bump On The Road To Recovery
Chart 8Bear-Steepening Episodes Since 2009
A Bump On The Road To Recovery
A Bump On The Road To Recovery
In fact, if the 5-year/5-year forward Treasury yield only rises back to the middle of its fair value range – somewhere between 2% and 2.31% - then our regression suggests that the yield curve slope will probably stay close to its current level. The bottom line is that while investors should position for a rebound in bond yields by keeping portfolio duration low, they should avoid US Treasury curve steepeners. In fact, we advocate owning 2/10 flatteners on the US Treasury curve as we see ample room for further curve flattening as Fed rate hikes approach in late-2022. The ECB’s New Guidance Solidifies The Defensive Nature Of European Bonds Last week, the European Central Bank (ECB) revised its forward rate guidance in light of its recently concluded Strategy Review.2 The ECB’s new rate guidance is as follows: In support of its symmetric two per cent inflation target and in line with its monetary policy strategy, the Governing Council expects the key ECB interest rates to remain at their present or lower levels until it sees inflation reaching two per cent well ahead of the end of its projection horizon and durably for the rest of the projection horizon, and it judges that realised progress in underlying inflation is sufficiently advanced to be consistent with inflation stabilising at two per cent over the medium term. This may also imply a transitory period in which inflation is moderately above target.3 This may sound familiar, and it should. Though not explicitly an Average Inflation Target, the ECB has moved a long way toward the Federal Reserve’s new dovish reaction function. Specifically, both the ECB and Federal Reserve now acknowledge that a temporary period of above-2% inflation will be tolerated, if not explicitly sought. Also, both central banks have linked the timing of the first rate increase to some form of outcome-based forward guidance. The Federal Reserve has explicitly said that it will not lift rates until inflation is above 2% and the economy has reached “maximum employment”. The ECB now claims that interest rates won’t rise until inflation is seen reaching 2% “well ahead of its projection horizon”, a criterion that Christine Lagarde described as having an element of outcome-based guidance.4 The ECB’s new forward guidance may not be as explicitly dovish as the Fed’s. The ECB has no “maximum employment” target and its inflation trigger for lifting rates still relies on the Governing Council’s forecasts. But for investors, the big signal is that the ECB has recognized that the risk of tightening policy prematurely is greater than the risk of remaining on hold for too long. This gives us even more confidence that there will be no ECB tightening on the horizon, and we should continue to view European bond markets as being highly defensive. This is hardly news. European bond markets performed relatively well during the bearish bond episode that lasted from August 2020 to March 2021, they have then gained less than cyclical bond markets (like US and Canada) since March (Table 2). The ECB’s new reaction function ensures that this relationship will remain place for many years to come. Table 27-10 Year Government Bond Returns (In USD, %)
A Bump On The Road To Recovery
A Bump On The Road To Recovery
The new reaction function is also a boon for peripheral European bond markets (like Italy and Spain) where yields trade at a spread above German bunds. The ECB’s commitment to staying dovish will only reinforce the downward pressure on peripheral European bond spreads versus Germany (Chart 9). Chart 9Grab The Extra Spread In Spanish And Italian Bonds
Grab The Extra Spread In Spanish And Italian Bonds
Grab The Extra Spread In Spanish And Italian Bonds
The bottom line is that investors should continue to overweight European bonds within global fixed income portfolios, with a particular emphasis on peripheral European bond markets like Italy and Spain. The defensive nature of European bonds will protect investors from losses during the next move higher in global yields. Italian and Spanish bond markets may not perform quite as well during the next bond bear market as they did between August 2020 and March 2021, as spreads have already compressed a lot. But ultra-accommodative ECB policy will limit the amount of spread widening that can occur, making any additional spread worth grabbing. Ryan Swift US Bond Strategist rswift@bcaresearch.com Footnotes 1 Please see US Bond Strategy Weekly Report, “Overreaction”, dated July 13, 2021 and Global Fixed Income Strategy Weekly Report, “The Message From Falling US Bond Yields”, dated July 21, 2021. 2 The results of the Strategy Review itself are discussed in Global Fixed Income Strategy Weekly Report, “The Reflationary Backdrop Is Still In Place”, dated July 14, 2021. 3 https://www.ecb.europa.eu/press/pr/date/2021/html/ecb.mp210722~48dc3b436b.en.html 4 https://www.ecb.europa.eu/press/pressconf/2021/html/ecb.is210722~13e7f5e795.en.html Recommended Portfolio Specification Other Recommendations
A Bump On The Road To Recovery
A Bump On The Road To Recovery
Treasury Index Returns
A Bump On The Road To Recovery
A Bump On The Road To Recovery
Spread Product Returns
A Bump On The Road To Recovery
A Bump On The Road To Recovery
Highlights Upgrade The Health Care Sector To An Overweight: Expressed through an overweight position in Health Care Equipment and Services, and an equal weight position in Pharmaceuticals and Biotech The Sector Faces A Few Tailwinds: Recovery of delayed elective procedures and hospital visits will accelerate health care sector sales and profit growth into the balance of the year Aging baby boomers and longer life expectancy will further boost health care spending The Democratic Party’s “blue wave” victory in 2020 has had little effect on health care policy, as the Biden administration has sidelined the party’s most ambitious proposals to deal with the pandemic. This is hardly a tailwind, but the political backdrop for the sector is better than was initially expected There Are Also Headwinds: Reducing or capping drug prices is a bipartisan interest, and may result in imports, price regulation, or inflation indexing, further increasing price pressures The Biden administration’s anti-trust stance may preclude mergers that allow medtech companies to acquire new technology and help hospitals realize economies of scale and preserve razor thin margins Patent expiration for blockbuster drugs is expected to peak in 2023, reducing overall drug spending by $160 billion from 2019 to 2023, and further increasing price pressure from the generic drug manufacturers Overweight Health Care: This as a defensive sector, which will fare well during the slowdown stage of the business cycle. Its performance will also be aided by post-Covid-19 tailwinds. The sector is cheap, and profitability is improving (Chart 1, top panel). Overweight Health Care Equipment And Service Providers: We prefer this industry group to Pharmaceuticals and Biotech, as it faces less intense price pressures, does not face bipartisan political scrutiny, is more profitable, and enjoys resilient profit margins (Chart 1, second panel). Equal Weight Pharma: This industry faces many challenges, such as upcoming patent cliff and generic competition, political and regulatory uncertainty, and declining profitability, which explains the significant valuation discount but makes it risky (Chart 1, bottom panel). Feature In conjunction with our colleagues from the US Political Strategy Team (USPS), today we publish a “deep dive” report on the US Health Care sector. The sector faces significant long-term political and regulatory headwinds, and understanding the political landscape is necessary to making the right investment decisions. The Health Care sector consists of two industry groups: Pharmaceuticals and Biotech, and Health Care Equipment and Services. In this report, we will assess the overall attractiveness of the sector in terms of its investment characteristics, as well as its outlook in the context of the current macroeconomic backdrop and potential political developments. Further, we will drill down into each industry group to provide more granular investment recommendations. We upgrade the Health Care sector to an overweight, expressed through an overweight position in Health Care Equipment and Services, and an equal weight position in Pharmaceuticals and Biotech. Chart 1Fundamentals Are Improving
Fundamentals Are Improving
Fundamentals Are Improving
Recent Performance Being a defensive sector, Health Care outperformed the S&P 500 by about 12% in the midst of the pandemic, only to lag the market during the recovery rally (Chart 2). Chart 2Health Care Outperformed During The Lockdowns, But Lagged In A Recovery Rally
Health Care Outperformed During The Lockdowns, But Lagged In A Recovery Rally
Health Care Outperformed During The Lockdowns, But Lagged In A Recovery Rally
Chart 3Health Care Sector Breakdown By Key Segment
Checking The Pulse: Deep Dive Into The Health Care Sector
Checking The Pulse: Deep Dive Into The Health Care Sector
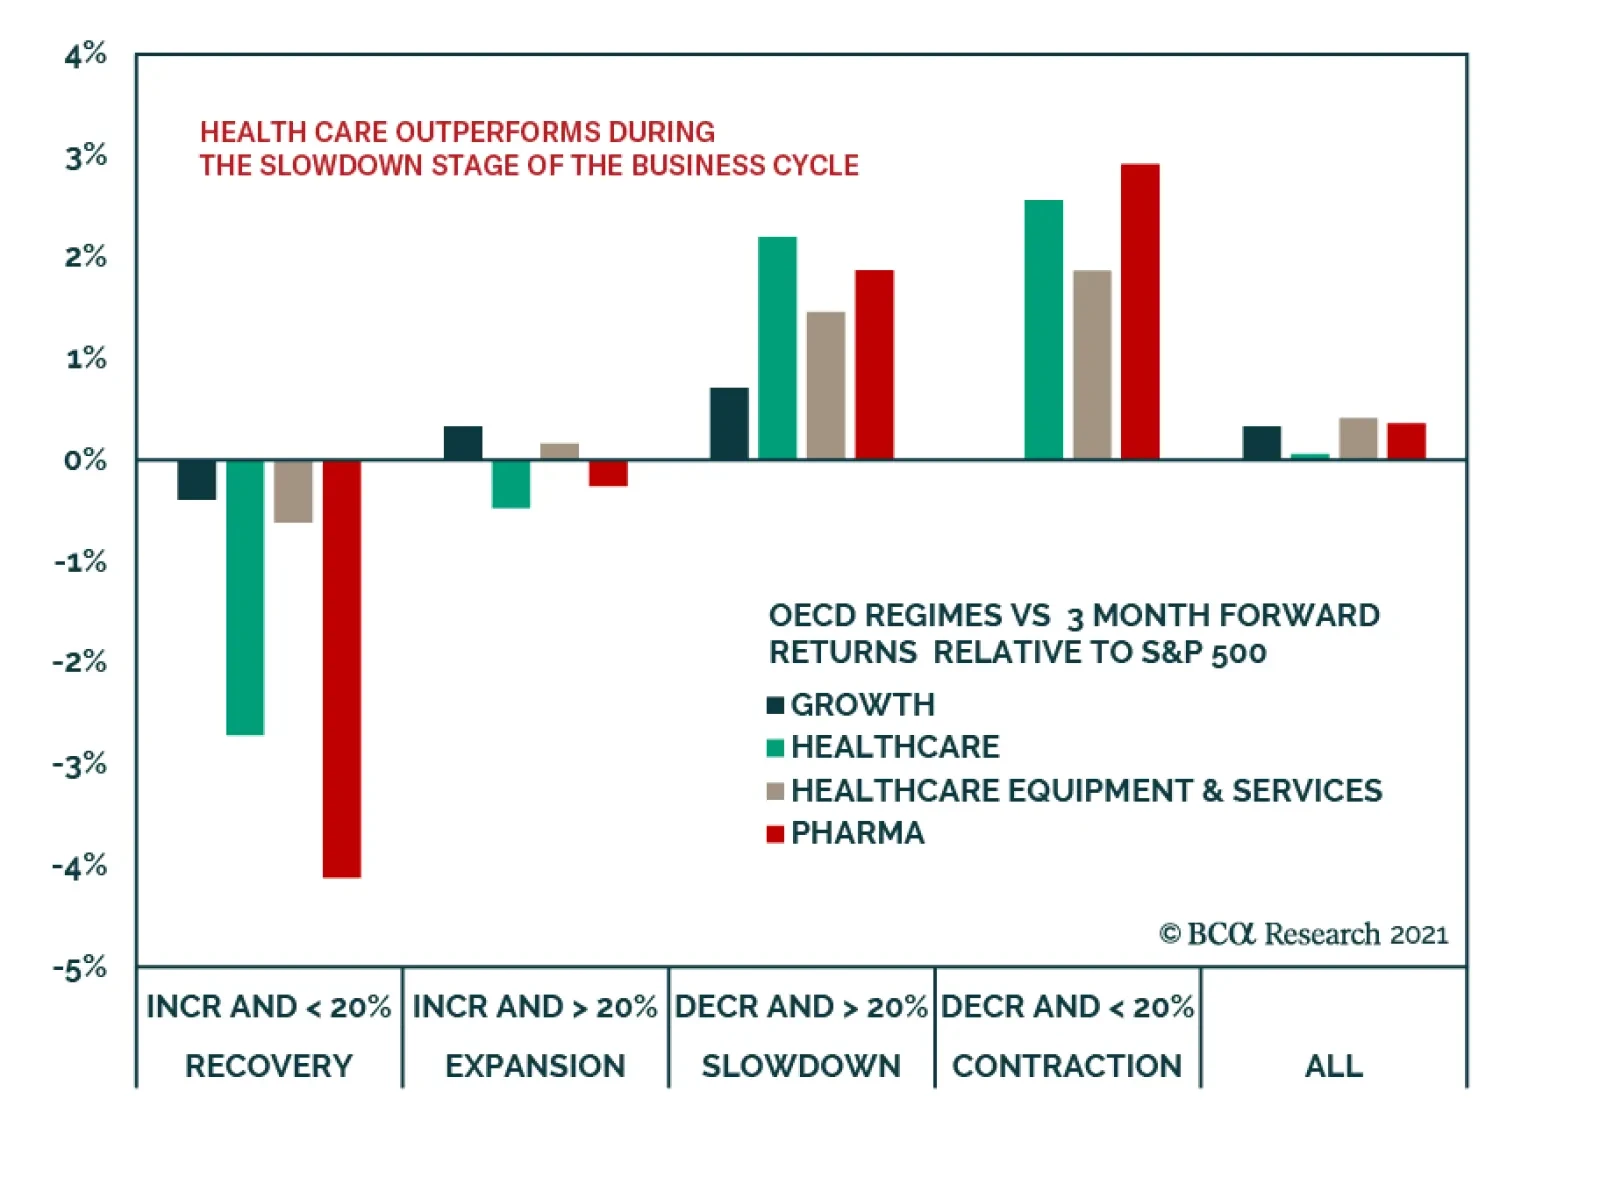
Health Care Sector Overview Health Care sector is very important to the US economy. After all, the US commands the highest health care spending in the world – 17% of GDP, $500B in sales annually. The sector constitutes about 13% of the S&P 500 index by market capitalization and is split equally between Pharmaceuticals and Biotech, and Health Care Equipment and Services, which itself consists of Health Care Providers and Equipment Manufacturers (Chart 3). Health Care Providers is a category which includes major hospitals, health insurers, and pharmacy chains, is the largest segment of the sector, and contributes 49% of the sector revenue. However, this is an industry under a significant price pressure from well-organized buyers such as private and government health insurance and has EBIT margins of only 8%. Pharma and Biotech is the second largest segment and delivers 33.5% of the sector revenue. This industry group faces its own unique challenges, such as patent expirations, politics, and competition from generic drug manufacturers. Yet, thanks to limited time patent protection, this industry manages to achieve EBIT margins of 12.2%. Health Care Equipment and Services is the smallest, contributing only 17% of all sector revenue, but it is the most promising and profitable segment, with EBIT margins circa 20%. The medical devices industry was able to preserve some its pricing power. Health Care Sector Tailwinds Recovery of Delayed Procedures And Hospital Visits Continues While health care earnings were relatively resilient throughout 2020, growth will accelerate into the balance of the year thanks to the recovery of delayed elective procedures and hospital visits following the easing of lockdown measures. These procedures are not only most lucrative for hospitals, but also increase demand for prescription drugs and translate into profits for medtech. Moreover, there is still a significant backlog of delayed procedures to work through. According to CFRA, medical utilization will not only recover, but will also increase by about 3% over a 2019 base by the year-end. Aging Baby Boomers Will Further Accelerate Health Care Spending Global demographic trends bode well for long-term health care spending: The share of the world’s population aged 65 years or over increased to 9.3% in 2020. People live longer thanks to medical innovations and increases in per-capita spending on health care. Longer life expectancy contributes to the rising incidence of chronic diseases, increases in spending on prescription drugs, medical facilities, and services. It also helps that in the developed world, and in the US in particular, baby boomers are the most affluent demographic group. The M&A Environment Has Been Hot M&A activity is booming for Health Care Equipment and Services. Medical equipment companies continue to seek to increase their exposure to nascent technologies with significant growth potential, while hospital chains consolidate to realize economies of scale and increased influence over suppliers and customers. However, as for pharma, many companies already carry high levels of debt, which precludes significant M&A activity. Blue Wave Has Had Little Effect On Health Care Policy (So Far) In principle, the blue wave was perceived as unfavorable to the Health Care sector, but in practice, so far, its effect has been neutral. The narrow margins in the House (4 seats) and Senate (0 seats, de facto 1 seat) reduce the effectiveness of the blue wave. Moreover President Biden has sidelined the party’s interests on health care for the time being. He did not include a public health insurance option in his American Families Plan, nor did he push for Medicare to take an active role in negotiating drug prices. He even sidelined the Democrats’ plan to expand the eligibility age for Medicare. Of course, he is still formally committed to these policies, and he will try to revisit health care in 2022. But by then it will be campaign season for the 2022 midterms and the odds of getting significant legislation passed will fall sharply. Of course, the current White House health care policy is hardly a tailwind. It is still conceivable (albeit low odds) that House Speaker Nancy Pelosi could convince the Senate leadership to insert the party’s more ambitious aims into the American Families Plan as the final draft of this fall’s budget reconciliation bill is prepared. Plus the Department of Health and Human Services will unveil a slew of new rules and regulations as the administration tries to compensate for the lack of bold initiatives. But on the margin the political backdrop for the sector is less negative than initially expected. Health Care Sector Headwinds While the sector enjoys these tailwinds, there are a few dark clouds gathering on the horizon, creating a lot of uncertainty and a more challenging policy backdrop. Reducing Or Capping Drug Prices Is A Bipartisan Issue Reducing or capping the price of drugs is one of the few bipartisan legislative priorities. Trump focused on this issue as well as Biden, which shows it is a vote getter as both parties are courting older voters. Executive orders are pushing key federal agencies to promote generics and biosimilars to reduce name-brand drug prices. Some of the ideas being circulated are: Allow drug imports from Canada and other countries (a big legal battle looms but the initiative is bipartisan and popular). Negotiate drug prices over Medicare with pharmaceuticals instead of having the companies freely set the prices. Limit high-launch prices of novel specialty drugs. (The administration is still formally committed to this.) Link drug price increases to inflation or an International Pricing Index. (Likely to occur at some point.) Having said that, while the situation remains fluid, so far health care and drug prices have not been a priority for Biden. A single lost vote in the Senate could derail his signature American Jobs and Families Plan reconciliation bill. Therefore he wants the bill to focus on $200 billion in subsidies for the existing Affordable Care Act. He does not want to add new controversial measures and revive the Obama administration’s bruising political battles over government involvement in health care. He also does not want to take any actions seen as punitive for the industries that cared for people during the pandemic and invented the vaccines. Biden Administration Anti-Trust Stance Biden’s administration is positioning itself to be very forward on anti-trust issues, which is a big change from the previous administration. Executive Order 14036 on anti-trust and competition takes aim at hospital consolidation, which is said to cause a low supply of health care and higher prices. Indeed, hospitals have been gobbling up smaller providers for over a decade to prop up their razor thin margins. Other M&As across the sector have occurred, like drug retailers buying insurers. The order also says that health insurers need to standardize the options they provide – limiting company flexibility and straight-jacketing pricing schemes. This policy development has a caveat, which may mitigate some of the clauses. The executive order does not involve concrete action that would stop this process. But it does exhort the Department of Health and Human Services and the Federal Trade Commission to develop new rules. Note that there are legislative constraints to muscular anti-trust enforcement, namely that new interpretations of anti-trust are unlikely to pass judiciary review. Therefore, there is a need for new legislation to overrule the judiciary/courts. But, as mentioned, Biden is not willing to risk his larger legislative priorities and hardly any big bills will pass in 2022. This means that the primary risk for now comes from agency rule-making, or new executive orders. Hence there is a shift in executive approach to these issues that will create a lot of uncertainty and put downward pressure on the performance of the sector. This risk could grow later, after the market prices in the positive news that Biden has not prioritized bold legislation in this sector. Patent Cliff Patent cliff is one of the key headwinds the pharmaceutical industry is facing: patent expiration for blockbuster drugs with global revenues exceeding $1B, is expected to peak in 2023. According to IQVIA, the decrease in spending on branded medicines is expected to reduce overall drug spending by $160 billion from 2019 to 2023. Macroeconomic Backdrop Is Favorable To The Health Care Sector Growth Is Slowing: Defensives Rule The business cycle has shifted into a slowdown stage. The earnings cycle has also peaked (Chart 4). We have written about this over the past few weeks, and by now it is baked into the market consensus. To position for a slowdown, we recommended rotation to Growth in the beginning of June. Defensive sectors like Health Care also thrive when growth rolls over. In fact, according to our analysis (Chart 5), Health Care and its constituent Industry Groups tend to do even better than Growth style during a slowdown. Chart 4Earnings Have Rolled Over
Earnings Have Rolled Over
Earnings Have Rolled Over
Chart 5Health Care Outperforms During The Slowdown Stage Of The Business Cycle...
Checking The Pulse: Deep Dive Into The Health Care Sector
Checking The Pulse: Deep Dive Into The Health Care Sector
Health Care is also a sector that benefits from rate stabilization, as it can be characterized as a “stable, quality growth”, as much of its cash flow growth extends far into the future (Chart 6). Chart 6...And When Rates Are Falling
Checking The Pulse: Deep Dive Into The Health Care Sector
Checking The Pulse: Deep Dive Into The Health Care Sector
Health Care Is A Domestic Industry Health Care is a relatively domestically focused industry, as it derives about 39% of its sales from outside the US – compared with 42% for the S&P 500, and 58% for the Technology sector. As a result, investors perceive Health Care to be a safe haven in times of appreciating USD, as its earnings are more insulated from currency moves. As a result, Health Care relative returns are positively correlated with the DXY (Chart 7). The dollar has been appreciating since the beginning of June, which bodes well for the outperformance of the sector (Chart 8). Chart 7Health Care Is Domestically Focused And Is Insulated From An Appreciating Dollar
Checking The Pulse: Deep Dive Into The Health Care Sector
Checking The Pulse: Deep Dive Into The Health Care Sector
Chart 8Positive Correlation With The Dollar
Positive Correlation With The Dollar
Positive Correlation With The Dollar
Fundamentals Sector Is Cheap The Health Care sector is inexpensive and is trading with an about 20% discount to the S&P 500, both on a trailing and forward basis. According to the BCA Valuation Indicator, it’s trading 2 std below its long-term average (Chart 9). Within the sector, Pharma and Biotech is the cheapest industry group and its valuation discount is dictated by its unique challenges (Table 1). Chart 9Unloved & Undervalued?
Unloved & Undervalued?
Unloved & Undervalued?
Table 1Summary Of Valuations And Growth Expectations
Checking The Pulse: Deep Dive Into The Health Care Sector
Checking The Pulse: Deep Dive Into The Health Care Sector
Earnings Growth Expectations Are Stable For Health Care Valuation discount may be explained by the fact that sector earnings growth expectations for the next 12 months are about half of those for the broad index, i.e., 10% vs 20% (Table 1). For Q2-21, analysts expect YoY growth of 36% for the sector and 68% for the S&P 500. However, this earnings differential is misleading as Health Care earnings were resilient throughout the pandemic, while the cyclical components of the S&P 500 have collapsed. Thus, differences in expectation are mostly due to the 2020 base effect. Indexing 12 months forward EPS to one in July 2019, we see that Health Care earnings have been stable, and now exceed the level of S&P 500 earnings (Chart 10). Chart 10Health Care Earnings Are Resilient
Checking The Pulse: Deep Dive Into The Health Care Sector
Checking The Pulse: Deep Dive Into The Health Care Sector
Margins Are Under Pressure While immediate earnings growth expectations look good, the degree to which the sector is losing pricing power is a source for concern (Chart 11). Health Care sector margins have been eroding for years now (Chart 12). Pricing pressure is a perennial concern for the sector as third-party payers, including the government and private health insurance chains seek to reduce the mounting costs of health care in the US. Chart 11Pricing Power Is Fading
Pricing Power Is Fading
Pricing Power Is Fading
Chart 12Margins Have Been Eroding For Years
Margins Have Been Eroding For Years
Margins Have Been Eroding For Years
Medicare and Medicaid have recently become a larger proportion of revenues for health care facilities, which is unfavorable for these companies because government health programs tend to have lower reimbursement rates than private sector payers. In turn, large hospital chains put price pressure on drug manufacturers and medical equipment suppliers. Lastly, Pharma faces competition from the generic drug manufacturers with which they have little product differentiation. R&D And Capex Are Rebounding During the pandemic, aiming to preserve cash in their war chests, companies in the sector have reduced their investments into R&D and Capex. More recently, both Capex and R&D have rebounded, cutting into margins. Indeed, the Health Care sector, especially pharma and medtech, is held hostage to R&D and Capex. EvaluatePharma estimates that large investments, typically around $4 billion in R&D, are required for pharma companies before any new products could be approved to be marketed. R&D is the “backbone” of novel drugs, and thus, the extent of R&D spending serves as an important metric to show a company’s commitment to finding new drugs. Medtech is held to similar demands as companies spend more and more to research and develop innovative new products, which are also subject to FDA approval. The only silver lining is that some analysts forecast that increased use of big data analytics or artificial intelligence to enhance processes has the potential to reduce growth in R&D and Capex (Chart 13 & Chart 14). Chart 13Capex Picked Up...
Capex Picked Up...
Capex Picked Up...
Chart 14...So Did R&D
...So Did R&D
...So Did R&D
Technicals Suggest Healthcare Is Oversold According to the BCA Technical Indicator, the Health Care sector is significantly oversold. This is a contrarian indicator, and positioning suggests that the sector is ripe for a rebound (Chart 15). Cash Yield Is Expected To Pick Up Last but not least, Health Care is one of the highest cash yielding sectors in the S&P 500. In Q1-21 the sector paid shareholders around $20B, the third highest payout in the index behind Financials and Tech. Cash yield is currently around 3% and the sector is in a strong position to ramp up payouts as its cash flows rebound. Chart 15A Good Entry Point
A Good Entry Point
A Good Entry Point
Pharmaceuticals And Biotech Faces Many Challenges Pharmaceuticals is one of the most challenging businesses to be in: not only does R&D takes years, and thousands, if not millions, of chemical compounds tested, but also there is absolutely no guarantee of success. And each promising compound has to go through rounds of arduous FDA trials to get approval for a new drug. The price of the new drug is protected for ten to twenty years, after which the original manufacturers face competition from generic drug manufacturers. Generics already account for the majority of drug spending around the world. Many traditional manufacturers have entered the generic drug manufacturing business: if you can’t beat them, join them! As such, the covid-19 vaccine rollout was the biggest catalyst for pharma sales this cycle with millions of people still awaiting their first shot in both developed and emerging countries. Given the steady drip of news about emerging virus variants, we can assume that the pandemic-driven demand for pharma products is here to stay. However, there is a caveat to the story. A number of pharma producers, such as AstraZeneca and Johnson & Johnson, pledged to supply vaccines not for profit, which is also evident in the data. Chart 16& Chart 17 show that while pharma sales took off during the pandemic, both EBIT and margins contracted. Chart 16Vaccines Boost Sales...
Vaccines Boost Sales...
Vaccines Boost Sales...
Chart 17...But Not Profits
...But Not Profits
...But Not Profits
Of course, decline in profits and margins was transitory since the pandemic also reduced hospital visits for non-Covid patients as well as delayed other procedures like non-urgent surgeries that both require drug usage. As demand for these two categories that positively contribute to profits and margins is starting to bounce back, we expect bottom-line growth numbers to recover for pharma stocks. However, we are more concerned about a longer-term trend in Pharma margins: here we see the effect of patent cliff, the ubiquitous shift to generics, and price pressures from insurers and hospital chains. The political backdrop exacerbates the situation: reducing or capping the price of drugs is one of the few bipartisan priorities, which creates a lot of uncertainty for the industry, and could be a drag on margins for years to come. This poisoned chalice that the industry is facing explains why Pharma trades with a 34% discount to the S&P 500 PE NTM, and 17% discount to Health Care (14.3x, 21.6x and 17.3x respectively). This is the largest discount in the past 25 years. This valuation discount is likely to close – after all, there is a price for everything. However, for now we remain cautious about the prospects for Pharma and Biotech, especially in the context of political uncertainty. Health Care Equipment And Services Is Thriving Increases in hospital visits and resumption of elective medical procedures is great news both for the medical service providers and for medical equipment manufacturing. With 56% of Americans age 12 or older vaccinated, medical utilization is swiftly recovering. Chart 18 shows that sales for the industry group have surged by nearly 20% from the darkest days of the pandemic. This industry group was also able to manage costs during the downturn and exited the pandemic with higher margins. Also, unlike Pharma and Biotech, this industry group is not experiencing a long-term margin erosion trend. Pricing pressures for this industry group are less severe than for Pharma. Competition in certain product categories is often limited to several key players due to various challenges, such as regulation, product liability, and substantial R&D and Capex outlays required to enter the industry. As such, sales growth translates into income growth (Chart 19), and the industry group is able to maintain its margins. Chart 18Equipment Manufacturers Are Thriving
Equipment Manufacturers Are Thriving
Equipment Manufacturers Are Thriving
Chart 19Strong Earnings All-around
Strong Earnings All-around
Strong Earnings All-around
Further, political pressures on the industry group appear less severe than those on Pharma and Biotech. True, Democrats are inclined to tax devices and impose price caps, but their initiatives to expand health care access increase overall demand for equipment and services. Another sign, that the current administration focus is not on equipment and services, is that President Biden temporarily exempted medical tech from his “right to repair” executive order, which prevents manufacturers from restricting the right of third parties to repair their devices. While it is a small issue, it signals that Biden is not aggressive on this industry thus far. Overall, we believe that Health Care Equipment And Services is attractive, and it is less affected by some of the negative trends in the sector, but benefits from reopening and demographic tailwinds. Investment Implications Upgrade Health Care Sector - Overweight Health care sector earnings are aided by a number of secular and structural tailwinds: Recovery in hospital visits and volume of elective procedures which also translates into pickup in the use of health care equipment and drugs A large and affluent cohort of aging baby boomers who enjoy a longer life expectancy, but also will spend more on medical procedures and prescription drugs Political backdrop is less negative than expected – and longer-term political risks will likely be stalled for campaigning in 2022 US growth rolling over is also favoring Health Care as a defensive sector that tends to outperform during period of economic slowdown. Further, this sector is cheap and stable earnings growth looks favorable compared to the broad market. Pharmaceuticals And Biotech Industry Group – Equal Weight Like the rest of the sector, this industry group is enjoying post-covid-19 recovery tailwinds. Sales growth has stabilized, but profit margins are perennially depressed. We do believe that over the short term both profits and margins may rebound. However, we are concerned about structural headwinds: political backdrop is unfavorable and will add to the price pressures traditional pharma is facing from generic competition, exacerbated by an upcoming patent cliff. Health Care Equipment and Service Providers – Overweight Like Pharma, this industry group benefits from a resurgence of hospital visits and an increase in the volume of medical procedures. However, it faces much fewer headwinds: the Biden administration has not made the regulation of hospital and medical equipment manufacturers as one of its legislative priorities. This industry group also faces fewer pricing pressures than Pharma. Health Care Equipment and Service Providers is trading with a slight discount to a broad market, while its profitability and margins are expected to pick up significantly. Bottom Line: Overweight Health Care, which is a defensive sector and will fare well in the slowdown stage of the business cycle. Its performance will also be aided by post-covid-19 tailwinds such as resumption in the delayed elective procedures, a significant demand for health care from aging baby boomers, and benign political backdrop. Within the sector we favor Health Care Equipment and Service Providers over Pharmaceuticals and Biotech, as this industry group faces less intense price pressures, is more profitable, and enjoys resilient profit margins, and is currently is flying under “regulatory radar”. Pharma not only suffers from upcoming patent cliff and generic competition, but also faces potential regulatory pressures: these headwinds have affected its long-term profitability and weigh on its performance and valuations. Irene Tunkel Chief Strategist, US Equity Strategy irene.tunkel@bcaresearch.com Matt Gertken Vice President Geopolitical Strategy mattg@bcaresearch.com Recommended Allocation
Checking The Pulse: Deep Dive Into The Health Care Sector
Checking The Pulse: Deep Dive Into The Health Care Sector
Footnotes
The recent sharp rally in the US government bond market was short-lived. US Treasuries already lost all of their gains from early last week. This raises the question: Have Treasury yields troughed? The 10-year Treasury yield is now back down below its…
The US 10-year Treasury yield is up roughly 16 bps off last Tuesday’s intra-day low. However, sectoral returns during this period have been somewhat contradictory. S&P 500 sectors that are heavy in tech and growth stocks – which usually underperform when…
BCA Research’s US Equity Strategy and US Political Strategy services upgraded the health care sector to overweight. The sector enjoys a few tailwinds: Recovery of delayed elective procedures and hospital visits will accelerate health care sector…
Highlights Economy – The inevitable deceleration has arrived, but the economy is still growing far faster than trend and will continue to do so through 2022: A wide range of data series shows that US growth has likely peaked but deceleration from way, way above the long-run potential growth rate to way above it is not cause for concern. Markets – Growth worries pulled equities lower for one day last week before investors rushed back in to buy the dip: Stock volatility made a brief return at the beginning of the week before the S&P 500 snapped back to resume taking aim at new highs. Fundamentals supported the reversal as earnings are on a path to blow away expectations for the fifth consecutive quarter. Strategy – Investors should stay the course by overweighting risk assets in multi-asset portfolios: As long as the spread of the Delta variant does not lead to punishing new restrictions, the economy will continue to grow at an extremely rapid clip and the strong-growth, easy-policy backdrop will continue to support equities and credit. Feature The S&P 500 had its worst one-day performance since early April last Monday, shedding 1.6% and sending the VIX above 20 for only the ninth time since it broke into the teens in March (Chart 1). We do not read too much into day-to-day moves in financial markets, but the tumult seems to have resulted from equities’ delayed reaction to investor unease about decelerating growth. It makes intuitive sense that forward-looking markets often assign greater importance to the direction of a key data series than its level. In Wayne Gretzky terms, the level is largely an indication of where conditions have been, while the direction offers more insight into where they are headed. Direction does not always trump level, however, and investors should bear in mind that the current pace of growth is extremely elevated. The Bloomberg consensus of economists is calling for 6.6% real GDP growth in 2021 and 4.2% in 2022. Those figures project a tapering, especially from quarter to quarter (Table 1), but they still represent red-hot growth for an economy with an annual long-term potential growth rate in the range of 1.75% to 2%. They also reflect a gentle tapering, with growth expected to remain comfortably above trend through 2023. Chart 1Lower Highs, Lower Lows
Lower Highs, Lower Lows
Lower Highs, Lower Lows
Table 12% Is So Last Decade
Thrill Ride
Thrill Ride
We are far less concerned about deceleration from high single-digit growth than we would be about sub-trend readings. Falling below trend was the persistent fear in the aftermath of the Global Financial Crisis when economists and investors alike worried that the economy would not be able to stay above stall speed. Growth likely peaked in the second quarter, and supply bottlenecks and wavering confidence in the face of the spread of COVID-19’s Delta variant have brought the economic surprise index back down to earth (Chart 2). To take one example of a series that recently generated a negative surprise, however, we think the month-over-month decline in the ISM non-manufacturing index has less to say about the economy than its fourth straight reading in the 60s, a level it had reached just eight times in the previous 23 years (Chart 3). Chart 2The Economy Is Cooling Off, ...
The Economy Is Cooling Off, ...
The Economy Is Cooling Off, ...
Chart 3... But It's Still Quite Hot
Thrill Ride
Thrill Ride
Is The Bond Market Trying To Warn Us? Chart 4Inflation Fears Have Ebbed
Inflation Fears Have Ebbed
Inflation Fears Have Ebbed
We did not foresee the steep decline in 10-year Treasury yields that has played out since mid-June and it has led us to ask if underlying economic conditions are weaker than we perceived. Based on the available data, we do not think so. It seems like the rally in long-dated Treasuries can be attributed to an unwinding of inflation fears, concerns about slowing growth and the reversal of a Treasury sell-off that had gone too far too fast. We remain constructive on the economy, assuming vaccine-resistant COVID-19 variants do not emerge, and we still expect the 10-year Treasury yield will end the year north of 1.75%. Inflation fears have cooled considerably, with 10-year TIPS breakevens having retreated to the lower end of the Fed’s desired range, while the 5-year-on-5-year series (the 5-year breakeven five years from now) has dropped out of it (Chart 4). Though we do not expect inflation to become a problem for the economy for another couple of years, we do expect that it will re-emerge as a worry for investors once the primary impediments to labor supply disappear in September, especially if the year-over-year CPI readings continue to come in way above 2%. Our Global Fixed Income Strategy service stresses that investors should watch the mix of components driving inflation. If accelerated wage gains appear to be on their way to becoming entrenched or the rate of growth in rents inflects higher, the transitory inflation narrative might begin to weaken, leading the Fed to dial back accommodation sooner and/or faster than the bond market currently anticipates. Though we are not concerned about a widely anticipated peak in the rate of growth, a revival of COVID-19 after it seemed to have been defanged would throw a spanner into the works. A surge in new infections, even in countries like the UK and the US which have been ahead of the pack in terms of vaccinations, indicates that the Delta variant is especially transmissible. The spike in infections here (Chart 5, top panel) and abroad has apparently dampened economic optimism, helping to push Treasury and other developed world sovereign yields lower. The good news, however, is that the Delta variant does not appear to be particularly lethal (Chart 5, bottom panel) and the leading Pfizer and Moderna vaccines have acquitted themselves well against it. We are watching virus developments carefully, but we do not yet see evidence that suggests new rounds of activity restrictions are in store and we therefore expect virus variants will ultimately have little economic impact. Chart 5The Delta Variant Is More Contagious But Less Serious
The Delta Variant Is More Contagious But Less Serious
The Delta Variant Is More Contagious But Less Serious
Aside from the pendulum shifting from too-hot concerns to too-cold concerns, much of the Treasury rally appears to have been a reaction to the speed and extent of the backup in yields. Our Global Fixed Income Strategy colleagues point out that Treasuries became quite oversold in the first quarter. The 10-year yield got as far above its 200-day moving average as it did during the taper tantrum in 2013 (Chart 6, second panel), with both real-money investors (Chart 6, third panel) and speculators (Chart 6, bottom panel) shunning duration. Speculators have trimmed their short positions but the real money has yet to capitulate, suggesting that yields may be able to hang around current levels or edge even lower before returning to a level that better aligns with underlying economic strength, robust inflation readings and the future path of the fed funds rate. Earnings Continue To Crush Expectations Every equity investor is familiar with the earnings season dance. About halfway through the quarter, companies begin to guide analysts’ expectations lower. Analysts duly adjust their estimates down a few percentage points over the ensuing ten weeks before companies begin to report. Company earnings then come in about the level initially expected midway through the quarter and – voila! – three-quarters of S&P 500 constituents beat expectations and the overall index beats by around 3%. The typical pattern looks very much like it did across 2019 (Chart 7, top panel). Chart 6The Treasury Selloff Was Overdone
The Treasury Selloff Was Overdone
The Treasury Selloff Was Overdone
Chart 7Not The Same Old Song-And-Dance
Thrill Ride
Thrill Ride
Beginning with the second quarter of 2020, when the most stringent lockdown measures meant to stymie the spread of the pandemic were fully in force, the picture has been very different. S&P 500 constituents have barely guided down heading into earnings before proceeding to demolish estimates by close to 20% (Chart 7, bottom panel). The established practice of companies guiding analysts to position the bar at a height they think they can comfortably clear produced a narrow and consistent dispersion of earnings beats across the 32 quarters from 2012 to 2019, with a mean of 3.7% and a standard deviation of 1.4%, all clustered within a narrow 1-to-6% range (Chart 8). Chart 8Blasting Out Of The Old Range
Thrill Ride
Thrill Ride
Something else entirely has unfolded over the last four quarters, when earnings beat by an average of 19.5%, more than three times above the previous eight years’ peak and five times their mean. Even with the pandemic numbers pushing the mean higher and quadrupling the standard deviation, the four quarters’ beats have been 3.2, 2.2, 1.8 and 3.1 standard deviations above the mean, respectively. With a quarter of the S&P 500 having reported results through last Friday, the second quarter appears to be on a path to extend the blowout streak to five quarters (Chart 7, bottom panel). Investors, conditioned to the S&P 500 unfailingly beating earnings, don’t seem to be cognizant of how unusual the magnitude of the beats has been. Gigantic year-over-year earnings gains, which will peak this quarter, also seem to have obscured how low the bar has been set on a quarter-over-quarter basis. As our US Equity Sector Strategy colleagues have highlighted, year-over-year comparisons that span pandemic-distorted quarters are of limited use. To get a more relevant read, they compare 2021 results to 2019 results. (For the full year, 2021 earnings per share for the S&P 500 are projected to come in 18.2% above 2019, for 8.7% annualized growth). Table 2A Remarkably Low Bar
Thrill Ride
Thrill Ride
We have been tracking quarter-over-quarter changes and were surprised to see that forward four-quarter earnings were expected to decline 2% from their first-quarter run rate ($196.52, annualized) when the reporting season began, with the second quarter declining by 8% (Table 2). Given manifold signs of economic revival, an 8% sequential contraction strikes us as highly improbable. With real GDP expected to grow by 9% on an annualized quarter-over-quarter basis, or better than 12% in nominal terms, 2% growth seems reasonable, so we see $50 as a more realistic and easily attainable ballpark estimate, which would have earnings beat by 11%. Regardless of where earnings end up, the bar has been set extremely low – the analyst consensus has not forecasted contraction in any forward four-quarter period since 1980 (Chart 9). Our takeaway is that earnings estimates have scope to move higher, taking the S&P 500 with them if multiples don’t contract, or giving valuations a chance to cool if the index moves sideways or turns lower. Chart 9An Odd Time To Call For The First Contraction In 40 Years
An Odd Time To Call For The First Contraction In 40 Years
An Odd Time To Call For The First Contraction In 40 Years
Investment Implications Our investment strategy recommendations follow from our ongoing analysis of the business cycle, the credit cycle, the monetary policy cycle and (when applicable) the sentiment cycle. Although the consistency of our risk-friendly asset allocation recommendations may have begun to seem boring, nothing in our cycle analysis calls for a change in our views. There is no reason to expect a recession when households are sitting on $2.4 trillion of excess savings, household net worth has advanced at the fastest rate on record, retail inventories have been depleted to record-low levels and payrolls are set to continue expanding at a furious rate over the next year-plus. The credit cycle is set to continue its charmed path, as rising incomes, cash-stuffed households and businesses, and zero interest rate policy suppress borrower distress and keep lenders eager to make loans. Monetary policy may get incrementally less accommodative as asset purchases shrink, but a rate hike is more than a year away. One can make a reasonable argument that the Fed will be unable to lift the fed funds rate to a truly restrictive level in the next policy tightening cycle once it begins to hike rates, even if it’s not our base case. We are certain that monetary policy settings will remain extremely easy well beyond our one-year investment timeframe. Sentiment is generally buoyant, but it is not at extreme levels that would warrant factoring it into our strategy as a contrarian indicator. We will therefore stay the course, while monitoring pandemic developments and keeping a sharp lookout for signs that we’re wrong about inflation or growth. If we are correct that the threat from COVID-19 will remain contained, we expect that earnings revisions will ensure that the next catalyst for equities will be a positive one. The consensus expectation for a decline in the earnings run rate is simply incompatible with observed conditions on the ground. Doug Peta, CFA Chief US Investment Strategist dougp@bcaresearch.com
Last Monday’s violent bond rally pushed the 10-year Treasury yield down to 1.19% – the lowest level since February. However, since then, bonds have been selling off and yields ultimately ended the week higher than they started it. Did last Monday mark…
According to BCA Research’s Global Investment Strategy service, investors are asking the wrong question about inflation. Investors keep asking whether the recent increase in US inflation is transitory. Annualized core CPI inflation reached 10.6% in the…
Highlights The Delta variant will continue causing jitters but there is much greater evidence today than there was in early 2020 that humanity can curb the virus, both with vaccines and government stimulus. Delta jitters will reinforce the Fed’s dovishness and will, if anything, increase the odds that President Biden passes his mammoth spending package this fall. The very near term could easily see more volatility but by the end of the year the reflationary cast of global policy will have won the day. Tax hikes and rate hikes lurk beyond 2021. There is still no stabilization in US-China policy and the US and its allies have called out China for cyber aggression, signaling a new front of open competition. A cyber event is one of the leading contenders for the next negative shock to the global economy. Structural factors strongly support rising concerns among the global elite about cyber insecurity. Stick to this year’s key themes and views: long gold, long value over growth, long international stocks, long Mexico, long aerospace and defense, and short emerging market “strongmen” regimes. Feature Global equities sank and rose over the past week as investors struggled with “peak growth” in the US and China, the prospect of monetary policy normalization, and other risks on the horizon, including immediate concerns over the Delta variant of COVID-19. The rapid rebound, including for cyclicals like European stocks, suggested that investors are still buying the dip given a very supportive macro and policy backdrop (Chart 1). The BCA House View consists of accommodative policy, economic recovery, a weakening dollar, and the outperformance of cyclical risk assets. We largely agree, with the caveat that there will be “No Return To Normalcy” in the geopolitical realm. Meaning that over the medium and long term the US dollar will remain firmer than expected and cyclical economies and sectors will face headwinds. Chart 1Equity Market Hits Wall Of Worry
Equity Market Hits Wall Of Worry
Equity Market Hits Wall Of Worry
The pandemic will have unforeseen consequences, such as social unrest and regime failures, while China’s secular slowdown and the Great Power competition between the US and its rivals will intensify. Not only is China slowing but also President Joe Biden has been confirmed as a China hawk, coopting President Trump’s aggressive stance and courting US allies to pile the pressure on Beijing. For most of this year the “normalcy” narrative has prevailed. Now investors are becoming fearful of the “abnormalcy” narrative. The US dollar has surprised its doubters on the basis of relative growth and interest rate differentials (Chart 2). Chart 2Dollar Remains Firm, Reflation Indicator Abates
Dollar Remains Firm, Reflation Indicator Abates
Dollar Remains Firm, Reflation Indicator Abates
Over the next six months, the key point is that until these geopolitical risks boil over and explode, they reinforce the bullish macro view, since government spending will surge to address national challenges. The rich democracies have awoken to the threat posed by malaise at home and autocracy abroad. They have reactivated fiscal policy to rebuild their states and expand the social safety net. They are increasing investments in infrastructure, renewables, and defense. This trend is especially positive for US allied economies, global manufacturers ex-China, commodity prices, and commodity producing emerging markets, at least until the next shock erupts. We discuss the risk of a cyber shock as well as the points above in this report. Policy Responses To The Delta Variant The Delta variant began in India and has now swept the world. So far the variants respond to COVID vaccines, which are being rolled out globally. National and local political leaders will promote vaccination campaigns first – only if hospital systems are clogged will they resort to social restrictions. New infections have risen much faster than hospitalizations and deaths, although the latter are lagging indicators and will eventually follow cases (Chart 3). But financial markets will largely look past the scare, as they looked past the various waves of the original virus over the past 15 months. Today investors have greater evidence of humanity’s ability to curb the virus and can expect government spending to tide over the economy if new restrictions are necessary. New social restrictions should not be ruled out. They are not politically impossible. Public opinion in the developed countries shows that about 77% of people believe restrictions were about right or should have been tighter, while only 23% believe there should have been fewer restrictions (Chart 4). About 40% of Germans oppose the lifting of restrictions even for the vaccinated! Chart 3Delta Variant: A Limited Risk Unless Hospitals Clog
Delta Variant: A Limited Risk Unless Hospitals Clog
Delta Variant: A Limited Risk Unless Hospitals Clog
Chart 4ANew Lockdowns Not Impossible
Stay The Course (But Gird For Cyber War)
Stay The Course (But Gird For Cyber War)
Chart 4BNew Lockdowns Not Impossible
Stay The Course (But Gird For Cyber War)
Stay The Course (But Gird For Cyber War)
Any financial or economic distress from virus variants will reinforce ultra-accommodative monetary policy. The European Central Bank adopted a symmetric inflation target of 2% as it completed its strategic review, up from a previous goal which simply aimed at inflation just under 2%. It is likely to expand rather than taper asset purchases (Chart 5). At the Fed, the balance of power between hawks and doves on the Federal Open Market Committee reflects the political and geopolitical trends of the day. In the wake of the Great Recession, the doves overwhelmed the hawks (Chart 6). The institution has fully transitioned today – it now aims to generate an inflation overshoot – and it will not jeopardize its new average inflation targeting regime by tightening policy too soon this year or next. Chart 5Central Banks Will Delay Normalization If COVID Crisis Persists
Central Banks Will Delay Normalization If COVID Crisis Persists
Central Banks Will Delay Normalization If COVID Crisis Persists
Chart 6Doves Firmly In Ascendancy At Federal Reserve
Stay The Course (But Gird For Cyber War)
Stay The Course (But Gird For Cyber War)
The Delta variant makes it more likely that governments will increase fiscal support. The European Union’s Recovery Fund has a modest impact but the EU Commission is not patrolling budget deficits anymore, in the event that new social restrictions set back the recovery. The Democratic Party will pass President Biden’s $3.5-$4.1 trillion American Jobs and Families Plan through Congress by Christmas (with a net deficit increase of $1.3-$2.5 trillion over eight years). Support rates among independents and Democrats suggest Biden will come up with the votes (Chart 7). A renewed sense of crisis will compel any straggling senators. Chart 7ADelta Variant Makes Biden Stimulus Even More Likely To Pass
Stay The Course (But Gird For Cyber War)
Stay The Course (But Gird For Cyber War)
Chart 7BDelta Variant Makes Biden Stimulus Even More Likely To Pass
Stay The Course (But Gird For Cyber War)
Stay The Course (But Gird For Cyber War)
Markets will cheer more government spending as they have done throughout the vast surge in budget deficits across the world, not least in the developed markets, where austerity stunted the recovery in the wake of the Great Recession (Chart 8). Beyond Delta jitters and reactive stimulus, there are clouds forming on the horizon over the medium and long term. Budget deficits will start contracting, central banks will start hiking rates, and taxes will go up (and not only in the US). Geopolitical risks that are suppressed today will erupt later. Bottom Line: The very near term could easily see more volatility but by the end of the year the reflationary cast of global economic policy will have won the day. The bigger problems come clearly into review after the ink dries on the last installment of the great Biden budget blowout. Chart 8Market Will Cheer Another Round Of Government Spending
Market Will Cheer Another Round Of Government Spending
Market Will Cheer Another Round Of Government Spending
China Policy And Cyber War What might the next major negative shock be? A leading candidate is China, with its confluence of internal and external risks. China’s policymakers opened the floodgates of credit-and-fiscal stimulus to combat the global pandemic in 2020. They quickly shifted to tightening policy to prevent destabilizing asset bubbles. Now they are easing again. Stimulus and growth have both peaked. Authorities are on the verge of overtightening policy but tactical shifts in economic policy often occur in July. Right on cue the State Council ordered across-the-board cuts to bank reserve requirements on July 9. The Politburo’s July meeting on economic policy will bring an even more important policy signal. The concrete impact of the RRR cut should not be overstated. China has been lowering RRRs since late 2011 as its broad money growth has continually declined. The trend is indicative of China’s secular slowdown. A new series of RRR cuts is often attended by a global equity selloff (Chart 9). Chart 9China Blinked - But One RRR Cut Will Not Prevent A Global Selloff
China Blinked - But One RRR Cut Will Not Prevent A Global Selloff
China Blinked - But One RRR Cut Will Not Prevent A Global Selloff
Our China Investment Strategy highlights that policy remains restrictive in other areas. Local governments have been told not to borrow if they have hidden debts. Moreover the crackdown on China’s tech sector also continues apace. These regulatory crackdowns are characteristic of the Xi Jinping administration and can continue for a while as it further consolidates power in advance of the twentieth National Party Congress in fall 2022. The US-China conflict is getting worse. The Biden administration took several punitive actions over the past month. It warned businesses against investing in Hong Kong and Xinjiang. It rejected a restart of the strategic and economic dialogue. While a bilateral summit between Biden and Xi Jinping is possible on October 30-31, it is not yet scheduled and would only temporarily improve relations. One of Biden’s more significant recent moves was to orchestrate a joint statement with allies condemning China for aggressive behavior in cyber space.1 A massive cyber attack should be high up on any investor’s list of “gray rhino” events (high-probability, high-impact events). The world has suffered large shocks from global terrorism, financial crisis, and pandemic. Lightning rarely strikes the same place twice. Of course, nobody knows what will cause the next upset. But a devastating cyber event has been underrated in the investment community and that is changing (Table 1). Fed Chair Powell, asked by a reporter what was the chief risk to the global financial system, said “cyber risk.” To quote in full: So you would worry about a cyber event. That's something that many, many government agencies, including the Fed and all large private businesses and all large private financial companies in particular, monitor very carefully, invest heavily in. And that's really where the risk I would say is now, rather than something that looked like the global financial crisis.2 Table 1Cyber Event Underrated In Consensus View Of Global Risks
Stay The Course (But Gird For Cyber War)
Stay The Course (But Gird For Cyber War)
Here are six structural reasons that cyber risk will continue to escalate: Cyber space is one of the truly ungoverned spaces. The US is the preponderant power in cyber space, as elsewhere, but there is no regular order or code of conduct. The US cyber bureaucracy is decentralized and uncoordinated while its opponents are centrally commanded, aggressive, and sophisticated. Great power competition is escalating. The US is struggling with China, Russia, and Iran and all sides seek to intimidate enemies and gain allies. Cyber capabilities enhance essential tasks like spying, sabotage, and information warfare. The tech race is intensifying, with companies and governments investing heavily in innovation and industry, while US export controls exacerbate China’s frantic efforts to obtain advanced tech by any means. The pandemic boosted digital dependency across industry and commerce, creating a “perfect storm” for cyber attacks and hacking.3 The US and its allies are threatening to retaliate more actively against cyber attacks, which may initially lead to an increase in the total number of attacks. In addition, Israel will need to sabotage Iran’s nuclear program if it is not halted by diplomacy. The US is polarized and war-weary yet claiming greater commitment to its allies, a paradox that encourages foreign rivals to use cyber tools to foment US divisions; strike at regional opponents that lack US security guarantees; and test the US commitment to its allies. The current US-Russia negotiations toward a truce against cyber attacks on critical infrastructure are the sole example of a potential structural improvement. The US and Russia could conceivably lay down some rules of the road in cyber space. There may be a basis for an agreement in that already this year the US refrained from blocking the Nordstream II pipeline with Germany while Russia refrained from re-invading Ukraine. However, a Russo-American truce would not dispel the risk of a global cyber surprise. It could even increase the odds. Russia this year alone showed with the Colonial Pipeline hack and the JBS meat-packing hack that its proxies can disrupt critical US infrastructure. It would make sense to agree to a truce so that the US does not demonstrate the same capability against Russia. Even without a truce, Russia does not benefit from provoking massive US cyber attacks. The US is the world’s leading cyber power and has pledged that it will retaliate. Rather Russia will concentrate its efforts closer to home: suppressing dissent, intimidating the former Soviet Union, and testing the US’s willingness to defend its allies. It would be useful for Russia to use cyber attacks to undermine NATO unity and demonstrate that the US is reluctant to defend NATO members’ critical infrastructure. Remember the cyber strike against Estonia in 2007. Hence huge shocks could still emerge in Europe or elsewhere even if the US and Russia make a ceasefire regarding their own critical infrastructure. The same can be said for China, Iran, and North Korea. Attacks in their neighborhood are even more likely than direct provocations against the United States now that the US is threatening graver consequences. Beijing is concentrating its cyber power on technological acquisition. But it will also try to intimidate its neighbors into neutrality and test America’s commitment to its allies. This applies to markets like Taiwan, South Korea, the Philippines, and Vietnam. Not all cyber attacks would cause a global shock but the danger of Biden’s emphasis on alliances and multilateralism is that the US will be tested and its commitments will expand. Local cyber attacks could escalate if the US believes it must prove its resolve. Bottom Line: Cyber firms’ share prices have risen since we made our contrarian buy call back in March. True, fundamentals are poor despite the strong geopolitical tailwind. The BCA Equity Analyzer shows that valuations, debt, liquidity, and return on equity have deteriorated relative to the global large cap equity universe (Chart 10). Still, as long as liquidity is ample and geopolitical risk is high we expect cyber firms’ share prices to keep grinding upward. Chart 10Cyber Stocks: Poor Fundamentals But Geopolitics A Secular Driver
Stay The Course (But Gird For Cyber War)
Stay The Course (But Gird For Cyber War)
Investment Takeaways We are sticking with our key themes and views: long gold; long value over growth; long DM-ex-US stocks such as FTSE100 (Chart 11) and European industrials; long US neighbors Mexico and Canada; long defense and cyber stocks; and short the assets of emerging market “strongman” regimes from China and Russia to Brazil, Turkey, and the Philippines. Taking several of our trade recommendations alongside the copper-to-gold ratio, a key measure of global reflation, there could be more near-term downside (Chart 12). Nevertheless these are strategic trades designed to bear rewards over 12 months and beyond. Mainland Chinese investors should book gains on long Chinese 10-year government bonds. We would not rule out a bigger bond rally later given China’s risks at home and abroad, but RRR cuts often lead to a selloff and the signal is that the socialist policy “put” remains in place. Book gains on long Italian / short Spanish equities. This tactical trade is now hitting the top of its range and will likely mean revert. We are still optimistic on European stocks and the euro as a whole and view the German election as a positive catalyst almost regardless of outcome. Chart 11Stay The Course: Long Value Over Growth
Stay The Course: Long Value Over Growth
Stay The Course: Long Value Over Growth
Matt Gertken Vice President Geopolitical Strategy mattg@bcaresearch.com Chart 12Stick To Cyclical Trades Over Near-Term Volatility
Stick To Cyclical Trades Over Near-Term Volatility
Stick To Cyclical Trades Over Near-Term Volatility
Footnotes 1 White House, “The United States, Joined by Allies and Partners, Attributes Malicious Cyber Activity and Irresponsible State Behavior to the People’s Republic of China,” July 19, 2021, whitehouse.gov. 2 “Jerome Powell: Full 2021 60 Minutes Interview Transcript,” CBS News, April 11, 2021, cbsnews.com. 3 Connor Fairman, “2020: Cybercrime’s Perfect Storm,” Council on Foreign Relations, January 20, 2021, cfr.org.
Highlights The decline in US Treasury yields has once again reduced the appeal of US paper, relative to foreign developed and emerging market bonds. Historically, lower US bond yields relative to other markets has been dollar bearish. The caveat is that if declining yields are due to a flight to safety, the dollar initially benefits due to US bond inflows. The academic research on which yields matter for currencies is mixed. Historically, short rates have mattered more. But with short-term interest rates anchored at zero, there is evidence investors are moving out the curve. Our bias is that looking across the yield curve will provide a more accurate picture of the countries that will benefit from bond inflows. More importantly, it is the sum of portfolio flows that drive a currency. This means equity flows will be important as well. Feature Global bond yields have rolled over, driven by the long end of the curve. The US 10-year yield has fallen from a high of 1.74% at the end of March to 1.29% today. While other bond yields have rolled over, the move has been more pronounced in the US. For example, the spread between the US 10-year Treasury and the 10-year German bund has narrowed from 200bps to 175bps. Given the correlation between relative interest rates – especially in real terms – and the dollar, a rare divergence has opened up in favor of short dollar positions (Chart I-1). A fall in yields can be driven by prospects of either slowing growth, lower inflation expectations, or a combination of the two. In the case of the US and to a certain extent the eurozone, the culprit behind lower yields has been a drop in both the real and the nominal component. This suggests that the markets are worried about central banks becoming too hawkish at the exact moment global growth is set to slow. Across maturities, the US yield curve has thus flattened (Chart I-2). Chart I-1Real Yields And Currencies Have Diverged
Real Yields And Currencies Have Diverged
Real Yields And Currencies Have Diverged
Chart I-2Flattening Yield Curves
Flattening Yield Curves
Flattening Yield Curves
A few questions arise from the setup above. How do you trade the dollar in the current environment? What is the future path for yields, especially relative yields? Should investors focus on a specific maturity as a signal for future currency moves? Finally, are yields the key driver of currencies in the current environment or should investors focus on other factors as well? Explaining Recent Dollar Strength Chart I-3Rising Demand For Hedges
Rising Demand For Hedges
Rising Demand For Hedges
If the decline in rates globally has been led by the US, then why has the dollar remained strong? The first reason is rising safe-haven demand, especially as global growth peaks. Usually, as a counter-cyclical currency, the dollar benefits in a risk-off environment. The latest Treasury International Capital (TIC) data show that foreign inflows into US bonds have been part of the reason for the decline in Treasury yields since March. A reset in equity markets has also been a driver. The DXY index has been very closely correlated with the put-call ratio in the US, and increased demand for hedges, including long dollar positions, have benefited the greenback (Chart I-3). This has been consistent with the outperformance of the more defensive US equity market. The third reason has been a slowdown in relative economic momentum between the G10 and the US. Chart I-4 shows that the Citigroup economic surprise index for the euro area relative to the US remains strong but has rolled over. The story is similar using relative PMIs between the US and the rest of the G10. Relative economic performance has usually tended to dictate currency movements in the near term. Chart I-4Relative Economic Momentum Is Slowing
Relative Economic Momentum Is Slowing
Relative Economic Momentum Is Slowing
Finally, as we highlighted a fortnight ago, the dollar was oversold and due for a tactical bounce. Leveraged funds have been covering their short positions in recent weeks, while speculators are now long the dollar (Chart I-5). Chart I-5Speculators Are Now Long The Dollar
Speculators Are Now Long The Dollar
Speculators Are Now Long The Dollar
Going forward, most of these trends should reverse. While the Delta variant of COVID-19 is raging across countries, hospitalizations are low, and thus the case for renewed lockdowns is weak. Meanwhile, non-US growth should regain the upper hand, especially in countries like Japan where vaccinations are ramping up quite fast. Global yields should also rise, as output gaps close and inflation remains well anchored. The Dollar And Interest Rates: Real Versus Nominal? As Chart 1 highlights, it is important to think about relative rates when looking for the next move in the dollar. The historical evidence is that there is little correlation between the dollar and the absolute level or direction of bond yields. Over the last few decades, global bond yields have collapsed while the dollar has undergone rolling bull and bear markets. Currencies react more to the path of relative real rates than nominal rates. By definition, a currency is the mechanism by which prices are equalized across borders. Rising inflation lowers the purchasing power of a currency, which in turn forces the currency to adjust lower in a globally competitive pricing system. Across the G10, there has been a longstanding relationship between real interest rate differentials and the path of the currency (Chart I-6). Chart I-6Negative Real Rates In The US Across The Curve
Negative Real Rates In The US Across The Curve
Negative Real Rates In The US Across The Curve
Chart I-7The US Sports A Very Negative ##br##Real Yield
Which Rates Matter For Currencies?
Which Rates Matter For Currencies?
Importantly, US real rates, especially at the short end of the curve, are very depressed. In fact, compared to other G10 countries, the US sports one of the worst 2-year real yields (Chart I-7). Based on the historical precedent illustrated in Chart I-6, a significant increase in US real rates is required to allow the dollar to rise on a structural basis. What About Hedged Yields? It is true that hedged yields in the US are positive for foreign investors. For example, hedged 10-year US yields for German bond investors provide 97 bps of pickup. For a Japanese investor, the yield pickup in the US is 96 bps, and for a British investor, it is 73 bps (Chart I-8A, Chart I-8B, Chart I-8C). Chart I-8BUS Hedged Yields For Japanese Investors
US Hedged Yields For Japanese Investors
US Hedged Yields For Japanese Investors
Chart I-8AUS Hedged Yields For Euro Investors
US Hedged Yields For Euro Investors
US Hedged Yields For Euro Investors
Chart I-8CUS Hedged Yields For British Investors
US Hedged Yields For British Investors
US Hedged Yields For British Investors
However, there is little correlation between the hedged yields and currency performance, and for good reason: Under covered interest rate parity, a hedged yield will be an arbitrage opportunity, which should be duly uncovered by efficient markets. This arbitrage window for hedged yields disappears if you extend the maturity of your hedging, as economic theory suggests. For example, hedging a 10-year bond with a 3-month currency forward can lead to massive losses as you roll over these contracts. This is because the cost of hedging in the short term tends to have wild fluctuations. For example, hedging in euros for a German investor buying Treasurys was over 300bps at the end of 2018. This wiped out the positive spread between the two bonds. Many investors do not hedge currency exposure. In fact, the “least regrets” approach of hedging 50% of currency exposure has been quite popular.1 Therefore, focusing on the real yield, rather than the hedged or nominal yield (Chart I-9), has been a far more robust solution in gauging the direction of currencies. By definition, a hedged yield means buying a currency at spot and selling it forward. This should be currency neutral, and especially, arbitrage away the yield differential. Chart I-9Hedged Yields And Currencies: No Correlation
Hedged Yields And Currencies: No Correlation
Hedged Yields And Currencies: No Correlation
Which Bond Yields Matter? The academic evidence suggests that short-term interest rates matter more for currencies, especially when policy is close to the zero bound. According to a BIS paper,2 not only has the FX impact of monetary policy grown significantly in the last few years, but short maturity bonds have had the strongest impact. Moreover, at a lower level of interest rates, the foreign-exchange impact is greater as the adjustment burden falls onto the exchange rate. Looking purely through the lens of the US dollar, our view is more nuanced. Foreign inflows into US long-term Treasurys have been improving tremendously, while flows into T-bills are relapsing (Chart I-10). This suggests longer-term rates have been a bigger driver of inflows into the US, and, more recently, the dollar rally. It is similar to what occurred at beginning of the dollar bull market last decade. Admittedly, the picture shifted over time, with shorter term flows becoming increasingly important as the Fed began to hike interest rates. Taking a step back, bond investors tend to span the duration spectrum, with pension funds investing in bonds many years out. As 1-year and 2-year yield differentials are not meaningfully different across countries (Chart I-11), this curtails the appeal of short-term paper. If inflation differentials are considered, it reduces the appeal of US paper even further. Chart I-10Long-Term Versus Short-Term Flows
Long-Term Versus Short-Term Flows
Long-Term Versus Short-Term Flows
Chart I-11Narrow Gap In Short Term Yields
Narrow Gap In Short Term Yields
Narrow Gap In Short Term Yields
Let’s not forget quantitative easing. If a central bank explicitly targets a bond yield near zero, like in Japan or Australia, that makes it difficult for that same yield tenor to generate positive inflows or send a reliable signal about the economy. This suggests a better method is looking at a spectrum of indicators, including yields at various maturities. Charts I-12 plots the yield differentials across maturities and countries. It shows that currencies have been correlated across the relative yield maturity spectrum. As such, we recommend investors monitor both short- and long-term yields in evaluating currency decisions. Chart I-12AYield Differentials Across Different Maturities
Yield Differentials Across Different Maturities
Yield Differentials Across Different Maturities
Chart I-12BYield Differentials Across Different Maturities
Yield Differentials Across Different Maturities
Yield Differentials Across Different Maturities
Chart I-12CYield Differentials Across Different Maturities
Yield Differentials Across Different Maturities
Yield Differentials Across Different Maturities
Chart I-12DYield Differentials Across Different Maturities
Yield Differentials Across Different Maturities
Yield Differentials Across Different Maturities
Chart I-12EYield Differentials Across Different Maturities
Yield Differentials Across Different Maturities
Yield Differentials Across Different Maturities
Chart I-12FYield Differentials Across Different Maturities
Yield Differentials Across Different Maturities
Yield Differentials Across Different Maturities
Chart I-12GYield Differentials Across Different Maturities
Yield Differentials Across Different Maturities
Yield Differentials Across Different Maturities
Chart I-12HYield Differentials Across Different Maturities
Yield Differentials Across Different Maturities
Yield Differentials Across Different Maturities
Chart I-12IYield Differentials Across Different Maturities
Yield Differentials Across Different Maturities
Yield Differentials Across Different Maturities
Other Asset Classes There are multiple drivers of exchange rates. Bond yields are just one of them. Equity and other flows also matter. It is the sum of portfolio flows that drive a currency. In fact, inflows into US equities and agency bonds have been the bigger drivers of the US dollar this year (Chart I-13). Outside the US, the correlation between interest rates and the currency can be very weak. The Canadian dollar is much more correlated with terms of trade than with real interest rate differentials. Rising oil prices attract inflows into Canadian corporate bonds and equities, which are positive for the currency. The key point is that flows tend to gravitate to capital markets with the highest expected returns. As such, monitoring flows other than government bond purchases is important. We expect that yields will be higher on a cyclical horizon. This will be beneficial for cyclical stocks, especially banks. This will also be beneficial for flows into non-US bourses, that have a higher weighting of cyclical stocks.. In short, the US equity market has become very tech heavy. Rising interest rates will hurt higher duration sectors such as technology and health care. At the margin, this hurts the relative performance of US equities (Chart I-14). Given that equity inflows have been a key driver of the US dollar, this will also hurt at the margin Chart I-13Agency Bonds And Equity Purchases Have Driven US Inflows
Agency Bonds And Equity Purchases Have Driven US Inflows
Agency Bonds And Equity Purchases Have Driven US Inflows
Chart I-14US Valuations Benefit From ##br##Lower Rates
US Valuations Benefit From Lower Rates
US Valuations Benefit From Lower Rates
Concluding Thoughts US real interest rates have deteriorated relative to the rest of the world. As such, it will require a significant rise in US real rates to seriously question a dollar bearish view. Meanwhile, a modest rise in global rates will also be bearish for US stocks compared to non-US bourses. US rates are usually high beta, and so could rise more in an improving growth environment. But relative rates are correlated to relative growth. As such, if non-US growth picks up relative to the US, like the IMF expects, this will provide a modest fillip to non-US yields (Chart I-15). US real rates are also very negative, so the bar to create a genuine dollar rally is very high. Finally, the market still expects the Federal Reserve to lead the hiking cycle. This means that there is still potential for an upside surprise in interest rates outside the US, compared to within (Chart I-16). Chart I-15Relative Bond Yields And Relative Economic Momentum
Relative Bond Yields And Relative Economic Momentum
Relative Bond Yields And Relative Economic Momentum
Chart I-16The Market Is Still Relatively Hawkish On The Fed
The Market Is Still Relatively Hawkish On The Fed
The Market Is Still Relatively Hawkish On The Fed
Housekeeping Our long Scandinavian basket was triggered at our buy point of a -2% pullback from July 9th levels. As such, we are now short EUR/NOK, USD/NOK, EUR/SEK, and USD/SEK. We were also stopped out of our long silver/short gold position for a small loss. We will be looking to reopen this trade in the coming weeks. Chester Ntonifor Foreign Exchange Strategist chestern@bcaresearch.com Footnotes 1 Michenaud, S., and Solnik, B., , “Applying regret theory to investment choices: Currency hedging decisions,” Journal of International Money and Finance 27, 2008, 677-694. 2 Ferrari, Massimo, Kearns, Jonathan and Schrimpf, Andreas, “Monetary policy’s rising FX impact in the era of ultra-low rates,” Bank of International Settlements, April 2017. Currencies U.S. Dollar Chart II-1USD Technicals 1
USD Technicals 1
USD Technicals 1
Chart II-2USD Technicals 2
USD Technicals 2
USD Technicals 2
Data out of the US this week was mixed: June retail sales came in better than expected. The control group rose 1.1% month on month, versus a -1.4% decline in May. For July, the University of Michigan survey showed inflation expectations continue to edge higher, but the sentiment of current conditions and expectations was well below consensus. Inflows into US assets reversed in May, with net outflows of $30.2bn. Existing home sales rose by 1.4% month on month in June to 5.9 million units. The US dollar DXY index rose modestly this week. Technically, the dollar is now approaching overbought territory. Our intermediate-term indicator has broken above 60, speculators are now long the dollar and sentiment on the greenback has turned up at a time when real rates remain negative in the US. This suggests much optimism is in the price. Report Links: Arbitrating Between Dollar Bulls And Bears - March 19, 2021 The Dollar Bull Case Will Soon Fade - March 5, 2021 Are Rising Bond Yields Bullish For The Dollar? - February 19, 2021 The Euro Chart II-3EUR Technicals 1
EUR Technicals 1
EUR Technicals 1
Chart II-4EUR Technicals 2
EUR Technicals 2
EUR Technicals 2
Data out of the eurozone this week was robust: The trade balance came it at €9.4bn for May. Final June CPI was in line with expectations – 1.9% for headline and 0.9% for core. The ECB kept rates unchanged in their July 22 meeting, but added to their framework of forward guidance. The euro fell by 40bps this week. Following Christine Lagarde’s Bloomberg interview last week, the ECB made some policy changes. First, they will allow for an inflation overshoot should this be consistent with longer-term inflation at 2%. They will also likely extend the PEPP beyond the March deadline, so no tapering before then. Finally, interest rates are expected to remain negative as far as the eye can see. This is nudging the euro towards becoming a low-beta currency. Report Links: Relative Growth, The Euro, And The Loonie - April 16, 2021 The Euro Dance: One Step Back, Two Steps Forward - April 2, 2021 On Japanese Inflation And The Yen - January 29, 2021 The Japanese Yen Chart II-5JPY Technicals 1
JPY Technicals 1
JPY Technicals 1
Chart II-6JPY Technicals 2
JPY Technicals 2
JPY Technicals 2
There was some positive news out of Japan this week: Exports rose 48.6% year on year in June. Imports also expanded at a 32.7% year-on-year pace, signaling rising domestic demand momentum. National CPI for June was in line with expectations. The core measure was at 0.2%. Supermarket sales continued to improve in June. The yen was down 0.3% against the dollar this week. The yen is the most shorted developed-market currency, and our intermediate-term indicator is at bombed-out levels. This is occurring at a time when domestic data is on the mend. This is bullish from a contrarian perspective. Report Links: The Case For Japan - June 11, 2021 The Dollar Bull Case Will Soon Fade - March 5, 2021 On Japanese Inflation And The Yen - January 29, 2021 British Pound Chart II-7GBP Technicals 1
GBP Technicals 1
GBP Technicals 1
Chart II-8GBP Technicals 2
GBP Technicals 2
GBP Technicals 2
There was some mixed data out of the UK this week: Rightmove house prices rose 5.7% year on year in July. The CBI survey was softer than expected in July. Total orders fell from 19 to 17, while the component of selling prices and business optimism fell 4 and 5 points respectively. The pound fell by 0.5% against the US dollar this week. Momentum on the pound continues to suggest near-term downside. Our intermediate term indicator is still blasting downward, and speculators are cutting their long positions from very aggressive levels. This suggests continued near-term downside in cable. Report Links: Why Are UK Interest Rates Still So Low? - March 10, 2021 Portfolio And Model Review - February 5, 2021 Thoughts On The British Pound - December 18, 2020 Australian Dollar Chart II-9AUD Technicals 1
AUD Technicals 1
AUD Technicals 1
Chart II-10AUD Technicals 2
AUD Technicals 2
AUD Technicals 2
There was scant data out of Australia this week: NAB business confidence for Q2 fell from 19 to 17. The RBA minutes confirmed that the central bank will stay dovish in the near term. The AUD fell by 0.7% this week against the USD, the worst performing G10 currency. COVID-19 will continue to dictate near-term developments in Australia, with the latest lockdowns having slowed economic activity. Speculators have started shorting the AUD on this basis (in addition to the risk of a decline in metal prices). In the end, if the COVID-19 crisis proves transient, it will create a coiled spring response for the AUD. Report Links: The Dollar Bull Case Will Soon Fade - March 5, 2021 Portfolio And Model Review - February 5, 2021 Australia: Regime Change For Bond Yields & The Currency? - January 20, 2021 New Zealand Dollar Chart II-11NZD Technicals 1
NZD Technicals 1
NZD Technicals 1
Chart II-12NZD Technicals 2
NZD Technicals 2
NZD Technicals 2
The was scant data out of New Zealand this week: Credit card spending rose 6.3% year on year in June. The performance services index rose from 56.1 to 58.6 in June. The NZD was down 23bps versus the US dollar this week. Last week’s rally in the NZD, following the signal that the RBNZ will end QE this week, is fizzling. From a technical standpoint, speculators are neutral the NZD, but our intermediate-term indicator has not yet bottomed out. We are long CHF/NZD, as a reset in global asset prices could increase currency volatility and benefit the pair. Report Links: How High Can The Kiwi Rise? - April 30, 2021 Portfolio And Model Review - February 5, 2021 Currencies And The Value-Versus-Growth Debate - July 10, 2020 Canadian Dollar Chart II-13CAD Technicals 1
CAD Technicals 1
CAD Technicals 1
Chart II-14CAD Technicals 2
CAD Technicals 2
CAD Technicals 2
Data out of Canada this week has been robust: June housing starts came in at 282.1K versus expectations of 270K. Foreigners continued to accumulate Canadian securities in June, to the tune of C$20bn. House prices remain on fire. The Teranet/National Bank index rose 16% year on year in June. The Bloomberg Nanos Confidence index held steady at 66.3. The CAD rose by 0.2% this week, performing better than other G10 currencies. The longer-term outlook for the loonie is clearly positive as the BoC will hike interest rates ahead of the Federal Reserve. Near term, USD/CAD could retest the 1.28 level as our intermediate-term indicator continues to work off overbought conditions. Ultimately, we will be selling this pair between 1.28 and 1.30. Report Links: Relative Growth, The Euro, And The Loonie - April 16, 2021 Will The Canadian Recovery Lead Or Lag The Global Cycle? - February 12, 2021 The Outlook For The Canadian Dollar - October 9, 2020 Swiss Franc Chart II-15CHF Technicals 1
CHF Technicals 1
CHF Technicals 1
Chart II-16CHF Technicals 2
CHF Technicals 2
CHF Technicals 2
There was scant data out of Switzerland this week: Exports fell 3% month on month in June. However, watches continued to sell well, with exports rising 71% year on year. Total sight deposits were unchanged at CHF 712 bn for the week of July 16. The Swiss franc was down 0.2% this week. A rebound in global bond yields is a threat to franc long positions. However, we believe the period of volatility in both economic data and equity markets is not over. As such, the franc will benefit from safe-haven inflows. We are long the CHF/NZD cross on this basis. Report Links: An Update On The Swiss Franc - April 9, 2021 Portfolio And Model Review - February 5, 2021 The Dollar Conundrum And Protection - November 6, 2020 Norwegian Krone Chart II-17NOK Technicals 1
NOK Technicals 1
NOK Technicals 1
Chart II-18NOK Technicals 2
NOK Technicals 2
NOK Technicals 2
Data out of Norway is improving: Industrial confidence came in at 11.3 for Q2, from 8.6 the previous quarter. The NOK was down by 0.5% this week against the dollar. This triggered our limit-buy on Scandinavian currencies at the -2% trigger level we had originally been targeting. As such, we are now short EUR/NOK and USD/NOK. With real yields in Norway much higher than in the US or Europe, portfolio flows should benefit the NOK. Report Links: The Norwegian Method - June 4, 2021 Portfolio And Model Review - February 5, 2021 Revisiting Our High-Conviction Trades - September 11, 2020 Swedish Krona Chart II-19SEK Technicals 1
SEK Technicals 1
SEK Technicals 1
Chart II-20SEK Technicals 2
SEK Technicals 2
SEK Technicals 2
Recent data from Sweden have been somewhat mixed: There is a slight upward revision to the Bloomberg economic forecasts. GDP growth is now expected to be 4% year on year in 2021, from a previous estimate of 3.5%. However, CPI was revised down 10bps to 1.7% this year, and 1.4% next year, considering the disappointing CPI print last week. The SEK was down 20bps this week. The SEK remains one of our most potent plays on a global growth recovery. Historically, the SEK has correlated very well with global growth variables and relative economic growth between Sweden and the rest of the world. This week, our limit-buy on Scandinavian currencies was triggered. As such, we are now short EUR/SEK and USD/SEK. Report Links: Revisiting Our High-Conviction Trades - September 11, 2020 More On Competitive Devaluations, The CAD And The SEK - May 1, 2020 Sweden Beyond The Pandemic: Poised To Re-leverage - March 19, 2020 Trades & Forecasts Forecast Summary Core Portfolio Tactical Trades Limit Orders Closed Trades