United States

Dear Client, We will be presenting our quarterly webcast next week, and, as a result, will not be publishing on 29 July 2021. We will cover our major calls for the quarter and provide a look-ahead. I look forward to the Q+A, and am hopeful you will tune in. Bob Ryan Chief Commodity & Energy Strategist Highlights Chart Of The WeekOPEC 2.0's Hand Strengthened By Production Agreement
OPEC 2.0s Hand Strengthened By Production Agreement
OPEC 2.0s Hand Strengthened By Production Agreement
The deal crafted by OPEC 2.0 over the weekend to add 400k b/d of oil every month from August preserves the coalition, and sends a credible signal of its ability to raise output after its 5.8mm b/d of spare capacity is returned to market next year.1 KSA and Russia will remain primi inter pares, but the position of OPEC 2.0's core producers – not just the UAE, which negotiated an immediate baseline increase – was enhanced for future negotiations. This deal explicitly recognizes they are the only ones capable of increasing output over an extended period. We assume the revised production baselines for core OPEC 2.0 effective May 2022 reflect the coalition's demand expectations from 2H22 onward. Our modeling indicates core OPEC 2.0's output will almost converge on the revised baseline production of 34.3mm b/d by 2H23, when we expect these producers to be at ~ 33.4mm b/d. Holding our demand estimates constant from last week, our revised supply expectations prompt us to move our forecast closer to our June forecast. We expect Brent to average $70/bbl in 2H21, with 2022 and 2023 averaging $74 and $80/bbl (Chart of the Week). Feature The deal concluded by OPEC 2.0 over the weekend will do more than add 400k b/d of spare capacity to the market every month beginning next month. It also does more than preserve the producer coalition's successful production-management strategy. The big take-away from the deal is the clear message being sent by the coalition's core members – KSA, Russia, Iraq, UAE and Kuwait – that they are able to significantly increase output after their 5.8mm b/d of spare capacity has been returned to the market over the next year or so. It does so by raising the baselines of the core producers starting in May 2022, clearly indicating the capacity and willingness to raise output and keep it there (Table 1). Table 1Baseline Increases For Core OPEC 2.0
OPEC 2.0's Forward Guidance In New Baselines
OPEC 2.0's Forward Guidance In New Baselines
What OPEC 2.0's Deal Signals Internally, the deal is meant to recognize the investment made by the UAE in particular, which was not being accounted for in its current baseline. Externally – i.e., to competitors outside the coalition – the deal signals OPEC 2.0's successful production management strategy will continue, by raising the likelihood the coalition will remain intact. This has kept the level of supply below demand over the course of the COVID-19 pandemic (Chart 2), and is responsible for the global decline in inventories (Chart 3). Chart 2OPEC 2.0 Durability Increases
OPEC 2.0 Durability Increases
OPEC 2.0 Durability Increases
Chart 3Inventories Will Remain Under Control
Inventories Will Remain Under Control
Inventories Will Remain Under Control
Specifically, the massive spare capacity still to be returned to the market between now and 2H22 can be accomplished with minimal risk of a market-share war breaking out among the core OPEC 2.0 members seeking to monetize their off-the-market production before the other members of the coalition. Most importantly, the revised benchmark production levels that becomes effective May 2022 signal the coalition members with the capacity to increase production can do so. Longer-Term Forward Guidance We assume the revised production baselines for core OPEC 2.0 effective May 2022 reflect the coalition's demand expectations from 2H22 onward. Our modeling indicates core OPEC 2.0's output will approach the revised baseline reference levels of 34.3mm b/d, hitting 33.4mm b/d for crude and liquids output by 2H23 (Table 2). Table 2BCA Global Oil Supply - Demand Balances (MMb/d, Base Case Balances) To Dec23
OPEC 2.0's Forward Guidance In New Baselines
OPEC 2.0's Forward Guidance In New Baselines
This implies the core group expects to be able to cover production declines within the coalition and to meet demand increases going forward. The estimates are far enough into the future to prepare ahead of time to increase production. Our estimates for core OPEC 2.0 production reflects our assumption the revised baseline levels do reflect demand expectations of the coalition. In estimating the coalition's production, we rely on historical data from the US EIA, which allows us to estimate future production using regressors we consider reliable (e.g., GDP estimates from the IMF and World Bank). Non-OPEC 2.0 Production We use EIA historical data for non-OPEC 2.0 production as well. In last week’s balances, we substituted the EIA's estimates for non-OPEC 2.0 producers ex-US for our estimates, which resulted in lower supply numbers throughout our forecast sample. This threw off our balances estimates in particular, as we did not balance the decrease in supply from this group using the new data set with an increase from another group. We corrected this oversight this week: We will continue to use EIA estimates for non-OPEC 2.0 ex-US countries, but will balance the decrease in oil production from this cohort with increased supply from other countries. Chart 4US Shales Are The Marginal Barrel
US Shales Are The Marginal Barrel
US Shales Are The Marginal Barrel
For US oil production, we will continue to estimate it as a function of WTI price levels, the forward curve and financial variables – chiefly high-yield rates, which serve as a good proxy for borrowing costs for the marginal US shale producer, which we view as the quintessential marginal producer in the global price-taking cohort (Chart 4). Our research indicates US shale producers – like all producers, for that matter – are prioritizing shareholder interests first and foremost. This means they will focus on profitability and margins. While we have observed this tendency for some time, it appears it is gaining speed, as oil and gas producers are now considering whether they want to retain their existing exposure to their hydrocarbon assets.2 There appears to be a reluctance among resource producers generally – this is true in copper, as we have noted – to substantially increase capex. This could be the result of covid uncertainty, demand uncertainty, monetary-policy uncertainty or a real attempt to provide competitive returns. We think it is a combination of all of these, but the picture is clouded by the difficulty in separating all of these uncertainties. Income Drives Oil Demand Chart 5Income Drives Oil Demand
Income Drives Oil Demand
Income Drives Oil Demand
Our demand estimates will continue to be driven by estimates of GDP from the IMF and the World Bank. We have found the level of oil consumption is highly correlated with GDP, particularly for EM states (Chart 5). Holding our demand estimates constant from last week, our revised supply expectations prompt us to move our forecast closer to our June forecast. This week, we also will adjust our inventory calculations, which will rely less on EIA estimates of OECD stocks. In the recent past, these estimates played a sizeable role in our forecasts. From this month on, they will play a smaller part. This is why, even though our supply estimates have risen from last week, there is not a significant change to our inventory levels. Investment Implications Holding our demand estimates constant from last week, our revised supply expectations prompt us to move our forecast closer to our June forecast. We expect Brent to average $70/bbl in 2H21, with 2022 and 2023 averaging $74 and $80/bbl. We remain bullish commodities in general, given the continued tightness in these markets. We expect this to persist, as capex remains elusive in oil, gas and metals markets. This underpins our long S&P GSCI and COMT ETF commodity recommendations, and our long MSCI Global Metals & Mining Producers ETF (PICK) recommendation. Robert P. Ryan Chief Commodity & Energy Strategist rryan@bcaresearch.com Ashwin Shyam Research Associate Commodity & Energy Strategy ashwin.shyam@bcaresearch.com Commodities Round-Up Energy: Bullish US natural gas exports via pipeline to Mexico averaged just under 7 bcf/d in June, according to the EIA. Exports hit a record high of 7.4 bcf/d on 24 June 2021. The record high for the month was 7.4 Bcf/d on June 24. The EIA attributes the higher exports to increases in industrial and power demand, and high temperatures, which are driving air-conditioning demand south of the US border. Close to 5 bcf/d of the imported gas is used to generate power, according to the EIA. This was up close to 20% y/y. Increases in gas-pipeline infrastructure are allowing more gas to flow to Mexico from the US. Base Metals: Bullish China reportedly will be selling additional copper from its strategic stockpiles later this month, in an effort to cool the market. According to reuters.com, market participants expect China to auction 20k MT of Copper on 29 July 2021. This will bring total sales via auction to 50k MT, as the government earlier this month sold 30k MT at $10,500/MT (~ $4.76/lb). Prior to and since that first auction, copper has been trading on either side of $4.30/lb (Chart 6). Market participants expected a higher volume than the numbers being discussed as we went to press. In addition to auctioning copper, the government reportedly will auction other base metals. Precious Metals: Bullish Interest rates on 10-year inflation-linked bonds remain below -1%, as U.S. CPI inflation rises. US 10-year treasury yields have rebounded since sinking to a five-month low at the beginning of this week. The positive effect of negative real interest rates on gold is being balanced by a rising USD (Chart 7). Safe-haven demand for the greenback is being supported by uncertainty caused by COVID-19’s Delta variant. Gold prices are still volatile after the Fed’s ‘dot shock’ in mid-June.3 This volatility is reducing safe-haven demand for the yellow metal despite rising economic and policy uncertainty. Ags/Softs: Neutral Hot, dry weather is expected over most of the grain-growing regions of the US for the balance of July, which will continue to support prices, according to Farm Futures. Chart 6Copper Prices Going Down
Copper Prices Going Down
Copper Prices Going Down
Chart 7Weaker USD Supports Gold
Weaker USD Supports Gold
Weaker USD Supports Gold
Footnotes 1Please see 19th "OPEC and non-OPEC Ministerial Meeting concludes" published by OPEC 18 July 2021. 2Please see "BHP said to seek an exit from its petroleum business" published by worldoil.com July 20, 2021. 3Please refer to ‘“Dot Shock” Continues To Roil Gold; Oil…Not So Much’, which we published on July 1, 2021 for additional discussion. It is available at ces.bcaresearch.com. Investment Views and Themes Strategic Recommendations Tactical Trades Commodity Prices and Plays Reference Table Trades Closed In 2021 Summary of Trades Closed
OPEC 2.0's Forward Guidance In New Baselines
OPEC 2.0's Forward Guidance In New Baselines
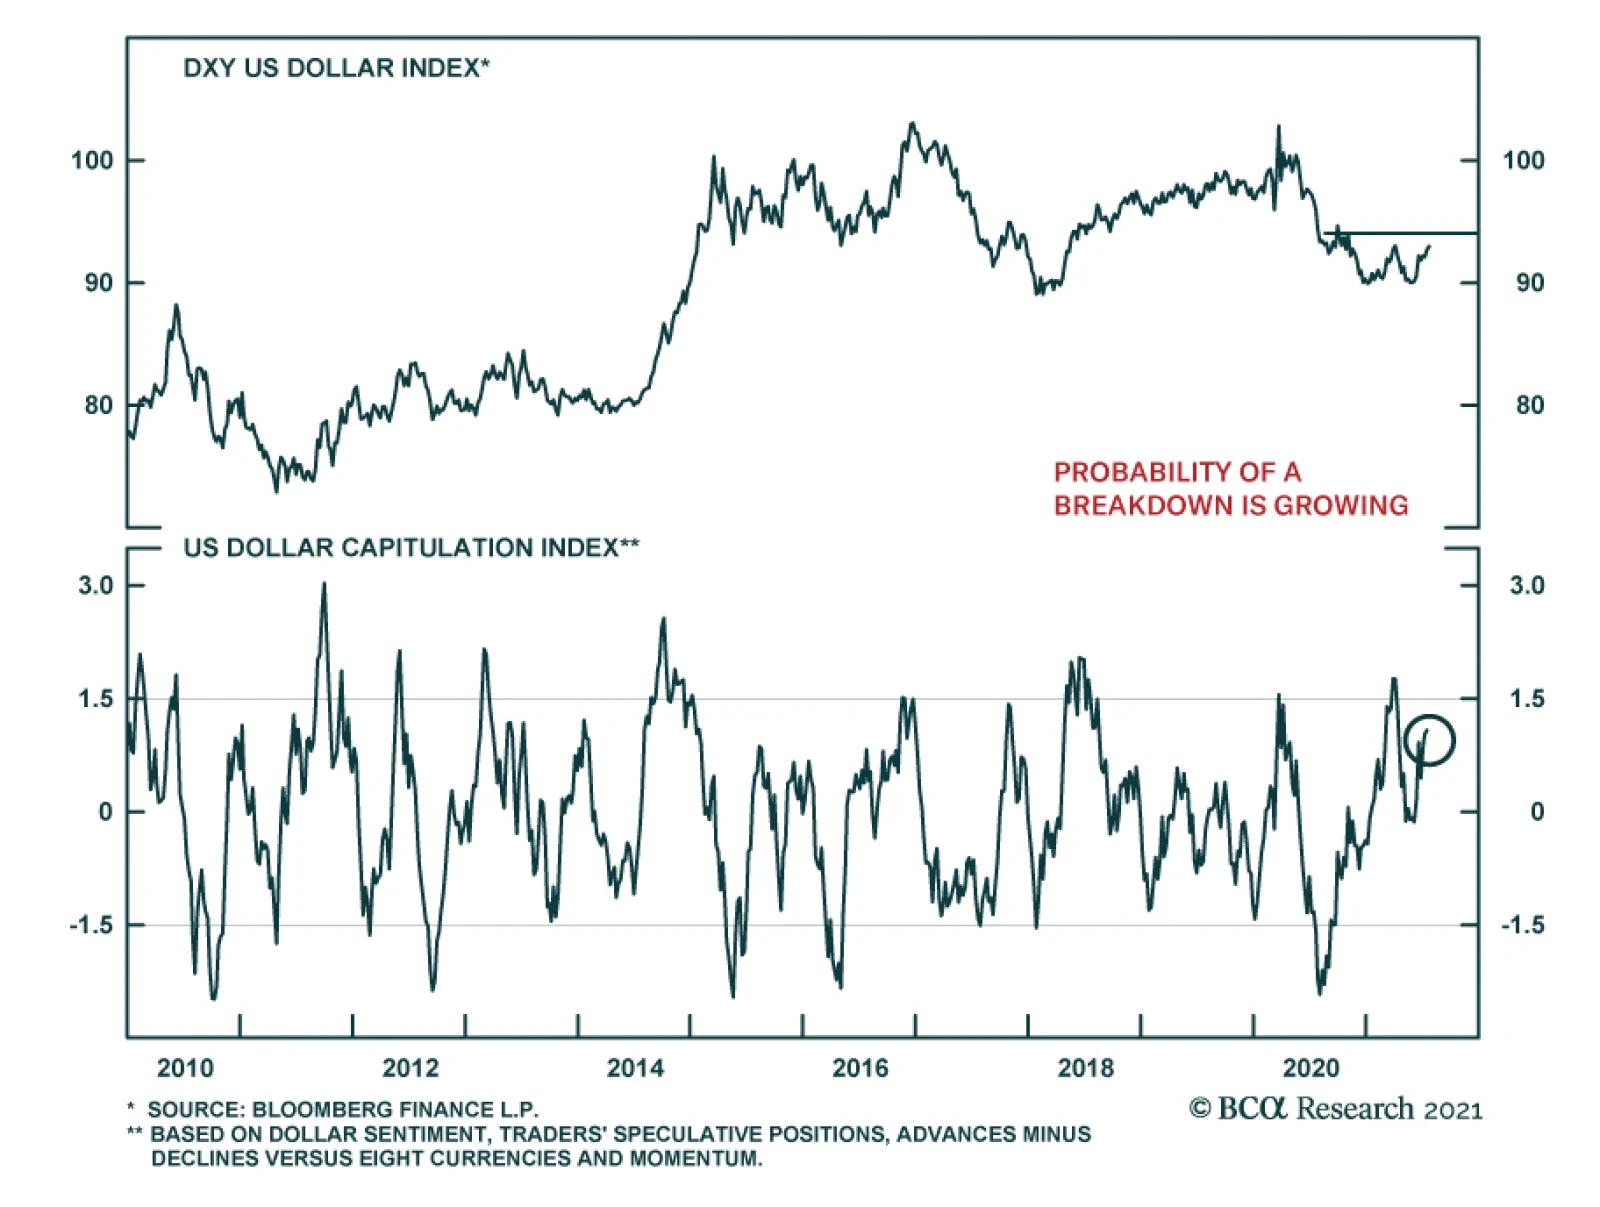
The DXY failed to break below the 89 critical resistance level earlier this year and has instead been appreciating since the beginning of June. The global growth scare which is testing the reflation narrative is fueling the rally in this counter-cyclical…
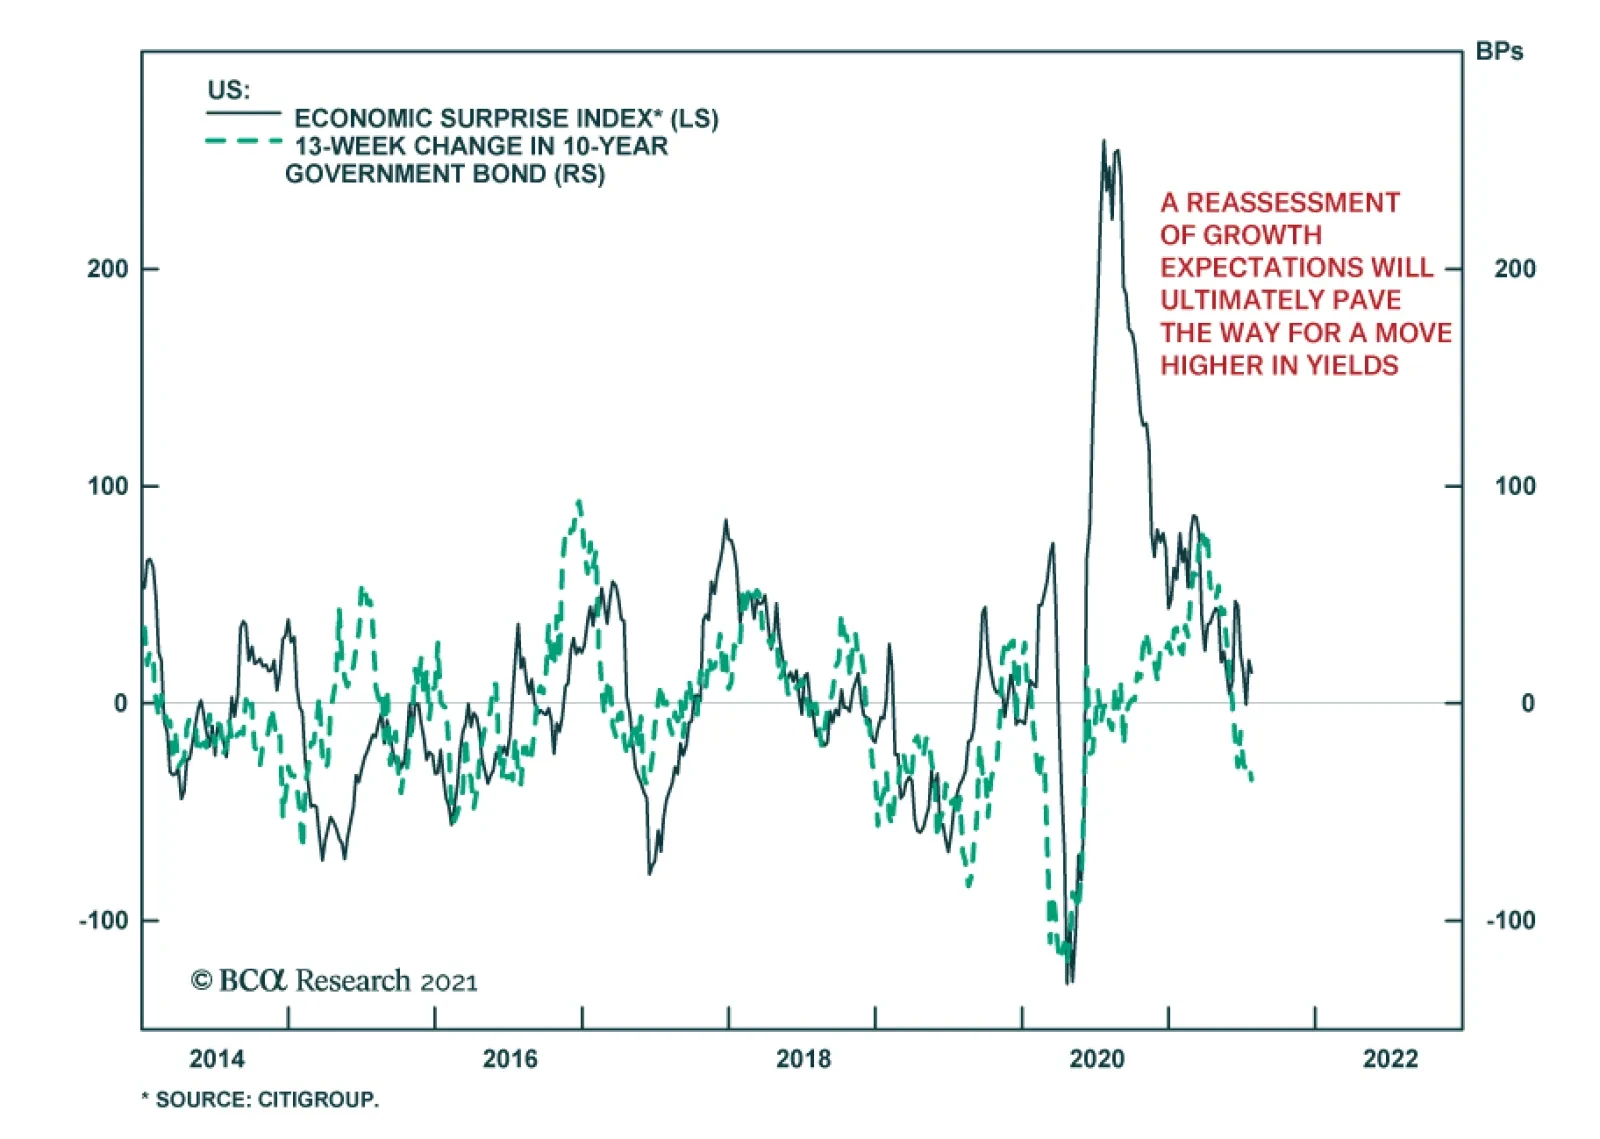
After hitting a peak of 1.74% in the end of March, US 10-year Treasury yields have been declining consistently. The rally intensified recently, pushing yields down to 1.19 on Monday. Although both the inflation expectations and the real components of yields…
Highlights US Treasuries: Peaking global growth expectations and the growing spread of the Delta variant are challenging the “reflation and reopening” narrative that drove bond yields higher in Q1 of this year. Underlying growth, however, is likely to stay above-trend in most developed economies over the next 1-2 years, leading to tighter labor markets, increased domestic inflation pressures, and less dovish central banks - especially in the US. We continue to recommend an overall below-benchmark duration position in global bond portfolios, with an underweight stance on US Treasuries, on a strategic (6-24 month) basis. New Zealand: House prices, inflation, and the overall economic backdrop justify the RBNZ’s recent hawkish shift. However, government bond and interest rate swap markets have not fully priced in how quickly, and how far, the RBNZ can hike during the upcoming tightening cycle. As a play on further RBNZ hawkishness, we are entering a new recommended tactical trade: a 2-year/5-year yield curve flattener in New Zealand government bonds. Feature Dear Client, We will be taking a summer break over the next two weeks to recharge our batteries for what is shaping up to be an eventful time for global financial markets over the remaining months of 2021. Next week, you will be receiving a report written by our Chief US Bond Strategist, Ryan Swift. The following week, there will be no Global Fixed Income Strategy report published. We will return to our normal publishing schedule on Tuesday, August 10. Best Regards, -Rob Robis The World’s Most Important Asset Price We spent much of last week talking with clients (still virtually, sadly) in the US and Europe. In all the meetings, the first - and in some cases, only - topic of discussion was how to interpret the fall in longer-maturity US Treasury yields over the past few months. With the benchmark 10-year US yield hitting the lowest level since February earlier this week, breaching the 1.20% level, the message from the Treasury market will remain very much top of mind for investors - and for us, too - especially with bond yields in other countries also following US yields lower. Chart 1
bca.gfis_wr_2021_07_21_c1
bca.gfis_wr_2021_07_21_c1
The falling trend in US yields can be attributed to a number of factors, some of which are more legitimately bond bullish than others. Investors are increasingly convinced that global growth momentum has peaked, including in the US. While the global manufacturing PMI is still at the highest levels seen over the past decade, our global leading economic indicator (LEI) is rolling over from a very high level (Chart 1). The plunge in the global LEI diffusion index suggests that the dip in the global LEI is broad based across all the countries in the LEI (Chart 1, middle panel). This is not a sign that growth is slowing now, though, given the long lags between the swings in the diffusion index and the LEI, and between the LEI and actual economic growth. Importantly, US leading indicators like the Conference Board LEI are not rolling over and continue to signal that US growth will remain solid over the next 6-12 months. US consumer and business confidence are still upbeat, labor demand remains robust and corporate profits are growing smartly in the Q2 earnings data available so far. US growth will inevitably decelerate from the overheated pace of Q2 that was boosted by the rapid reopening from pandemic restrictions. Yet the US economy will continue to expand at an above-trend pace into 2022 – especially with an extra boost from fiscal stimulus - that is likely to tighten US labor markets and keep the Fed on the path towards bond-bearish tapering and, eventually, rate hikes by the end of next year. The renewed pickup in COVID-19 cases in the US could damage that positive narrative on US economic confidence. The uptick in the Delta variant raises the risk of a new wave of economic restrictions, even with nearly half the US population now fully vaccinated (Chart 2). To date, the latest surge in cases has not resulted in significant surges in hospitalizations and deaths in the US and, more importantly, the UK where the Delta variant has spread far more rapidly. If the hospitalization figures were to accelerate, investors would likely interpret that as a sign that a) vaccine efficacy against the variants is not as robust as for the original strain of the virus; and/or b) the next wave of COVID has arrived before the US could achieve herd immunity. At the moment, there is little political will to impose a new wave of growth-crushing - and bond bullish – economic restrictions in the US, especially with case numbers still low compared to previous waves of the virus amid ample vaccine supplies. Even in New York City, the epicenter of the first wave of the pandemic in the US in 2020 and one of the last major cities to reopen, the mayor said this week that a return to a mask-wearing mandate was not on the table (the city’s preference is to push for more of the unvaccinated to get their jabs to fight the variant). Lower US bond yields also reflect a growing belief that the rise in US inflation will prove to be transitory, as the Fed expects. Headline CPI inflation in the US reached 5.4% in June on a year-over-year basis, but was an even faster 8.8% on a 6-month annualized basis (Chart 3). Soaring US inflation rates have been dismissed by many as simply a function of temporary supply squeezes and favorable base effect comparisons versus the pandemic-fueled price collapses in Q2/2020. Yet the longer the inflation acceleration continues, the more the narrative will shift from “transitory” to “persistent” inflation, especially if inflation also keeps moving higher outside the US as well. Chart 2Delta Variant: Highly Contagious, But Not Lethal
Delta Variant: Highly Contagious, But Not Lethal
Delta Variant: Highly Contagious, But Not Lethal
Investors, and the Fed, will not be able to assess if the US inflation surge is truly a short-lived phenomenon until at least 2-3 more inflation data prints are available. Chart 3Is This 'Transitory' Inflation?
Is This 'Transitory' Inflation?
Is This 'Transitory' Inflation?
This means the “transitory or not” question will linger until the September inflation data is available in mid-October. What will be critical is the mix of US inflation. If more domestically generated inflation rates – rents, wages, etc. – accelerate, that would result in overall US inflation being driven more by stickier core inflation rather than surging non-core inflation fueled by rising commodity prices. That implies a higher floor for headline inflation, and a more bond-bearish challenge to the “transitory” narrative as the Fed would be even more emboldened to begin dialing back monetary accommodation sooner, or faster, than the current forward guidance. Beyond the fundamentals, the Treasury market continues to work off the technically oversold condition that developed in the first quarter of 2021, leading to short-covering that is pushing yields lower. The 10-year Treasury yield became extremely stretched versus the underlying trend in yields, defined by the 200-day moving average, with survey and positioning data showing large short positioning and below-benchmark duration exposures among bond investors (Chart 4). As the factors underpinning the US “reflation trade” in Q1 have come into question in Q2, speculators have covered much of the huge short positioning that built up in the 30-year Treasury, according to the CFTC (bottom panel). However, the JP Morgan survey of client duration positioning still shows a large number of clients are running duration exposures below that of their benchmark, suggesting that real money investors have not yet capitulated even as Treasury yields have moved lower. In a report published back in June, we looked at previous episodes where the 10-year US yield became stretched versus its underlying trend over the past two decades.1 We concluded that it could take until at least August before the 10-year Treasury worked off its oversold condition, defined as the yield returning to its 200-day moving average using daily closing prices, based on the average length of those past episodes. The US 10-year yield is now below its 200-day moving average of 1.28%, but it is still too soon to declare this oversold episode over given the still large underweight duration position visible in the JP Morgan survey. Some reduction in that tilt will be necessary before longer-term Treasury yields can begin to climb again. Summing it all up, the uncertainty over global growth momentum, the Delta variant, and the underlying pace of US inflation will likely keep Treasury yields under some downward pressure, especially with short positioning not yet completely cleaned out. We suspect that it will take a reacceleration of US employment growth before US Treasury yields can begin to move higher once again. That would not begin to be visible until at least the September payrolls data – a month when extended US federal unemployment benefits expire and children return to in-person learning at school, freeing up some of the supply bottlenecks in US labor markets. Our base case scenario is that the current pickup in COVID-19 cases will not derail the US economic recovery from the pandemic. A tightening US labor market and stickier-than-expected US realized inflation will lead the Fed to announce in December a tapering of its asset purchases starting in January 2022. A shift to a less dovish Fed, and eventual rate hikes beginning at the end of 2022 after tapering is complete, will be the driver of the next upleg in US Treasury yields. Looking outside the US, our Central Bank Monitors continue to highlight that developed economy central banks are all under cyclical pressure to begin dialing back the massive monetary accommodation put in place to fight the temporary economic shock of COVID-19 (Chart 5). Yet pricing in Overnight Index Swap (OIS) markets highlight the diverging messages from policymakers. Chart 4USTs Still Working Off Oversold Condition
USTs Still Working Off Oversold Condition
USTs Still Working Off Oversold Condition
Chart 5A Clear Message From Our Central Bank Monitors
The Message From Falling US Bond Yields
The Message From Falling US Bond Yields
A rate hike is now expected before year-end in New Zealand and by July 2022 in Canada (Table 1) “Liftoff” is now expected in January 2023 in the US, Australia and the UK; while rates are expected to remain unchanged until November 2023 in the euro area and February 2024 in Sweden. The bigger future issue for markets, however, is the pace of rate hikes given how little tightening is expected after liftoff. Table 1Bond Markets Are Vulnerable To Hawkish Monetary Policy Shifts
The Message From Falling US Bond Yields
The Message From Falling US Bond Yields
OIS curves are only discounting a handful of rate hikes to occur by the end of 2024 in most countries. Beyond that, 5-year/5-year forward OIS rates – a good proxy for the so-called “terminal rate”, or how high rates will end up in the next tightening cycle – show that markets have downgraded their assessment of how high global interest rates can possibly go. With global growth likely to remain above trend over the next 1-2 years, the current surge in global inflation will likely not be as transitory as the Fed and other central banks expect, leading to a faster pace of monetary tightening than markets are discounting (outside of Europe and Japan) and a renewed move higher, on average, for global bond yields led by US Treasuries. Bottom Line: Peaking global growth expectations and the growing spread of the Delta variant are challenging the “reflation and reopening” narrative that drove bond yields higher in Q1 of this year. Underlying growth, however, is likely to stay above-trend in most developed economies over the next 1-2 years, leading to tighter labor markets, increased domestic inflation pressures, and less dovish central banks - especially in the US. We continue to recommend an overall below-benchmark duration position in global bond portfolios, with an underweight stance on US Treasuries, on a strategic (6-24 month) basis. New Zealand: Primed For Liftoff Recent news from New Zealand has confirmed the market pricing of the Reserve Bank of New Zealand (RBNZ) as one of the most hawkish central banks within the developed economies. We have been of the view that the RBNZ would be among the first to withdraw the monetary accommodation put in place because of the pandemic, and recommended that investors avoid New Zealand sovereign debt in our Special Report on global house prices earlier this year.2 Increasingly, that view is being borne out, with the RBNZ delivering a hawkish surprise last week by announcing an end to the Large-Scale Asset Purchase (LSAP) program by July 23. On the surface, New Zealand’s situation does not appear that different from other higher-yielding bond markets in the developed world such as the US, UK, Australia, and Canada. However, there are a number of factors that make higher interest rates more appropriate for this economy: An unsustainable housing market If nothing else, the RBNZ’s hawkish turn can be attributed to the country’s wildly unsustainable housing market (Chart 6). Nominal house prices have been in an unimpeded accelerating trend since mid-2019, and are now growing at a whopping 28% year-over-year as of June. The anecdotal stories of housing market frothiness in New Zealand are at times unbelievable, like the recent sale of a run-down house in an Auckland suburb, with no bathroom or toilet, for a whopping two million dollars.3 The housing boom has undoubtedly been caused by accommodative monetary policy, with mortgage rates reaching all-time lows during the pandemic. While the RBNZ has implemented macroprudential measures such as increased loan-to-value restrictions on mortgages, it will take a significant pickup in mortgage rates to truly curb the acceleration in house prices. Housing affordability – or, more accurately, unaffordability - has reached a point where a 20% down payment on the median national house price is equal to 223% of the median disposable income, according to the RBNZ (Chart 6, middle panel). A similar measure, the OECD’s house price-to-income ratio, is most elevated in New Zealand among the developed economies. The overheating housing market also poses a major financial stability risk. New Zealand also leads the pack when it comes to the housing exposure of commercial bank balance sheets (Chart 6, bottom panel). With nearly half of commercial bank balance sheets composed of housing loans, New Zealand’s financial system is especially susceptible to a housing downturn. The takeaway is clear - even in the absence of other factors, the housing situation alone would be enough to force the RBNZ to act. Inflation accelerating above target The RBNZ tapering decision came a mere two days before the release of a very strong CPI print for Q2/2021, with consumer prices rising 1.3% during the quarter and 3.3% on a year-over-year basis – the fastest pace since 2011 (Chart 7). The central bank had been expecting some near-term spikes in headline inflation owing to temporary supply shortfalls and high oil prices. However, the RBNZ does not see all inflation as “transitory” and acknowledges that rising capacity pressures and labor shortages could continue to push up inflation going forward Chart 6The RBNZ's Housing Headache
The RBNZ's Housing Headache
The RBNZ's Housing Headache
Chart 7A Broad-Based Spike In NZ Inflation
A Broad-Based Spike In NZ Inflation
A Broad-Based Spike In NZ Inflation
Inflation has also been broad-based, with both tradables and non-tradables inflation running above the upper band of the RBNZ’s 1-3% inflation target. Although the bank does, on net, favor a lower New Zealand dollar (NZD) for the export-driven New Zealand economy, the depreciation in the NZD could push up tradeables inflation further, making urgent action from the RBNZ all the more necessary. Also important are the sources of inflation. The housing basket was responsible for more than a third of the rise in prices in Q2 (Chart 8). With housing affordability now a politically fraught issue creating major headaches for the RBNZ, expect the bank to be extra-sensitive to this sort of inflation. Accelerating food prices also create the risk that the “sticker shock” of rapidly rising costs for everyday spending items pushes up consumer inflation expectations past the RBNZ target range. Chart 8Prices Are Rising For 11 Out Of The 12 Groups In The NZ CPI Basket
The Message From Falling US Bond Yields
The Message From Falling US Bond Yields
Chart 9The RBNZ Is Running Out Of Bonds To Buy
The RBNZ Is Running Out Of Bonds To Buy
The RBNZ Is Running Out Of Bonds To Buy
An asymmetric monetary policy backdrop The monetary policy backdrop in New Zealand also favors a withdrawal of stimulus, on the margin. After only sixteen months of quantitative easing, the RBNZ now owns nearly half of all the sovereign debt outstanding in the country. That is a level of ownership on par with the ECB, which has had a long-running asset purchase program, and far exceeds the shares held by peers such as the Fed and Bank of Canada (Chart 9). Had they not terminated purchases, the RBNZ would have been limited by the simple fact that there is not enough government bond issuance for it to buy up without starting to impair the liquidity of the bond market Looking beyond the end of the LSAP, the central bank may have to push policy rates considerably higher to contain inflation. At only 0.25%, the official cash rate is 165bps below the mean estimate of the neutral rate —the rate at which monetary policy would be neither restrictive or stimulative – derived from the RBNZ’s suite of quantitative models (Chart 10). There is also some uncertainty around this number, with the upper end of the range of estimates as high as 4.5%. This signals that the RBNZ could hike rates quite a bit without choking off the economy. Chart 10The Market Is Pricing In An Extremely Slow RBNZ Hiking Cycle
The Market Is Pricing In An Extremely Slow RBNZ Hiking Cycle
The Market Is Pricing In An Extremely Slow RBNZ Hiking Cycle
In this context, market pricing in the New Zealand OIS curve, which discounts a very slow hiking cycle with the policy rate not expected to reach the median RBNZ neutral rate estimate until 2028, appears overly dovish. A buoyant economic backdrop Lastly, the RBNZ has arguably already satisfied its mandate to support the economic recovery coming out of the pandemic (Chart 11). Real GDP and aggregate employment are both above pre-COVID levels, while business and consumer confidence are continuing the recovery started last year. Yields have picked up across the New Zealand government bond curve, reflecting this improvement in growth and sentiment. Even though some pandemic restrictions remain in place, the vaccination program has shown steady progress and is likely to ramp up further as the government has just acquired a large shipment of the Pfizer vaccine. Looking at the broader picture, there appears to be little remaining justification for the RBNZ to remain as accommodative as it is right now. The economic recovery from the pandemic is largely complete and the upside inflation and financial stability risks are too important to ignore. After such an abrupt end to the RBNZ’s LSAP program, rate hikes are likely just around the corner. Yet with the OIS curve now discounting a full rate hike by October of this year, markets have adjusted to a sooner than expected RBNZ liftoff date. However, we believe that the New Zealand sovereign yield curve has not fully priced in how much the RBNZ - historically one of more active central banks that is not afraid to raise or lower interest rates aggressively - will need to tighten, and how flat the curve will get, once the rate hikes begin. Although the entire New Zealand government bond curve has already flattened somewhat, experience from previous hiking cycles shows that the curve usually continues to flatten well after rate hikes begin, usually reaching zero or inverting slightly by the time the RBNZ is done hiking rates. This is especially true for the yield curve between two and five years, which is the maturity range that is most sensitive to rate hike expectations (Chart 12). Chart 11The NZ Economy Has Recovered For The Most Part
The NZ Economy Has Recovered For The Most Part
The NZ Economy Has Recovered For The Most Part
Chart 12Monetary Policy And The NZ Yield Curve
Monetary Policy And The NZ Yield Curve
Monetary Policy And The NZ Yield Curve
Currently, the 2-year/5-year New Zealand yield curve is 22bps, leaving ample room for the curve the flatten further once the RBNZ begins to hike rates. Meanwhile, implied forward rates are currently priced for a re-steepening of the curve in the short term, making a 2-year/5-year flattener an especially attractive trade in New Zealand with the RBNZ set to tighten. This is also a “cleaner” play on monetary policy expectations over a cyclical horizon than, for example, a 2s/10s flattener where the longer-maturity yield could be boosted by higher inflation expectations (and where some flattening is already discounted in the forwards). Today, we are initiating a new recommended 2-year/5-year curve flattener trade in New Zealand using cash government bonds. This trade involves selling a 2-year bond, and using the proceeds to buy a combination of a 5-year bond and a 3-month treasury bill that has the same duration as the 2-year bond. This makes the trade both duration-neutral and “proceeds-neutral” by fully investing the cash from the sale of the 2-year bond. Details of the trade, including the duration weightings and specific bonds used, can be found in our Tactical Trade Overlay table on page 17. Bottom Line: House prices, inflation, and the overall economic backdrop justify the RBNZ’s hawkish shift. However, government bond and interest rate swap markets have not fully priced in how quickly, and how far, the RBNZ can hike during the upcoming tightening cycle. As a play on further RBNZ hawkishness, we are entering a new recommended tactical trade – a 2-year/5-year yield curve flattener in New Zealand government bonds. Robert Robis, CFA Chief Fixed Income Strategist rrobis@bcaresearch.com Shakti Sharma Senior Analyst ShaktiS@bcaresearch.com Footnotes 1 Please see BCA Research Global Fixed Income Strategy Report, "A Summer Nap For Global Bond Yields", dated June 9, 2021, available at gfis.bcaresearch.com. 2 Please see BCA Research Global Fixed Income Strategy Special Report, "Global House Prices: A New Threat For Policymakers", dated May 28, 2021, available at gfis.bcaresearch.com. 3https://www.theguardian.com/world/2021/jul/15/house-with-no-toilet-sells-for-2m-as-new-zealand-property-market-soars Recommendations The GFIS Recommended Portfolio Vs. The Custom Benchmark Index
The Message From Falling US Bond Yields
The Message From Falling US Bond Yields
Duration Regional Allocation Spread Product Tactical Trades Yields & Returns Global Bond Yields Historical Returns
The credit risk premium in US bonds has shrunk considerably during the past 16 months. While BCA Research’s US Bond Strategy service doesn’t foresee a period of significant spread widening any time soon, lower spreads mean lower excess corporate bond returns.…
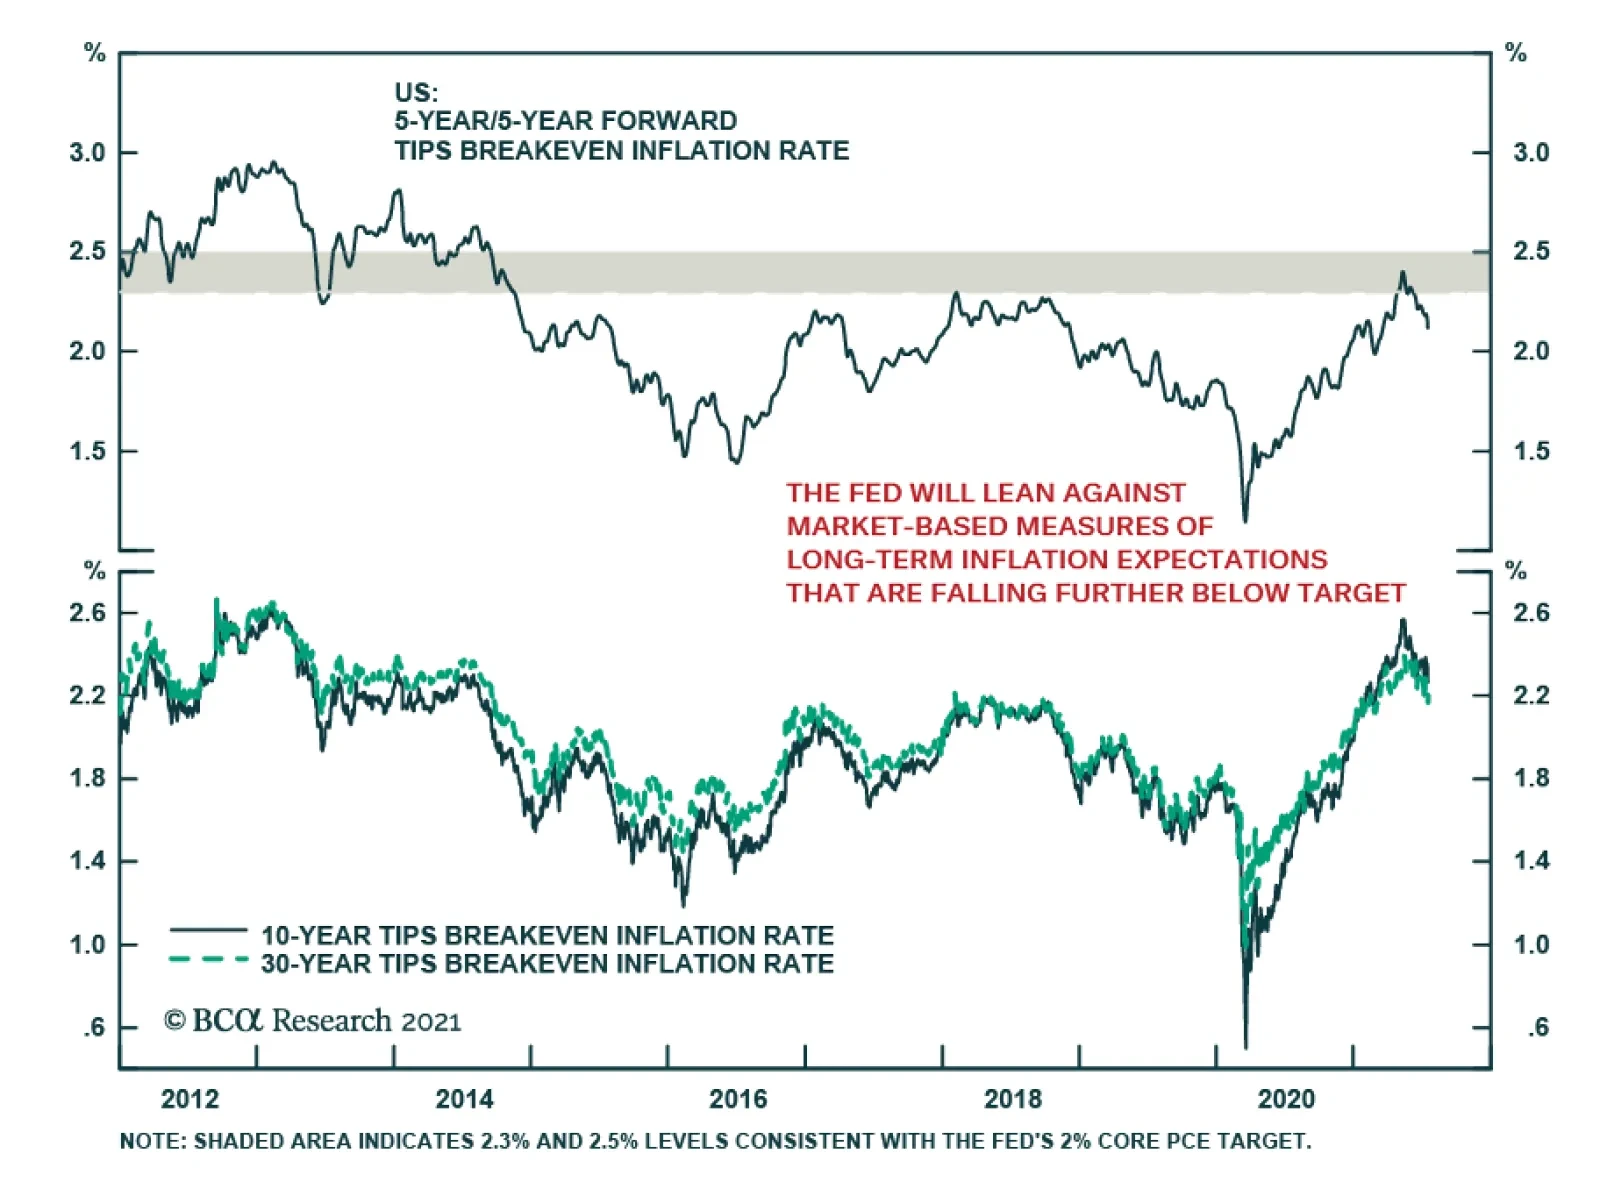
After rising to levels consistent with the Fed’s 2% core PCE target in May and June, the 5-year/5-year forward TIPS breakeven inflation rate has continued to decline, falling further below the Fed’s target zone. On Monday, this market-based measure of…
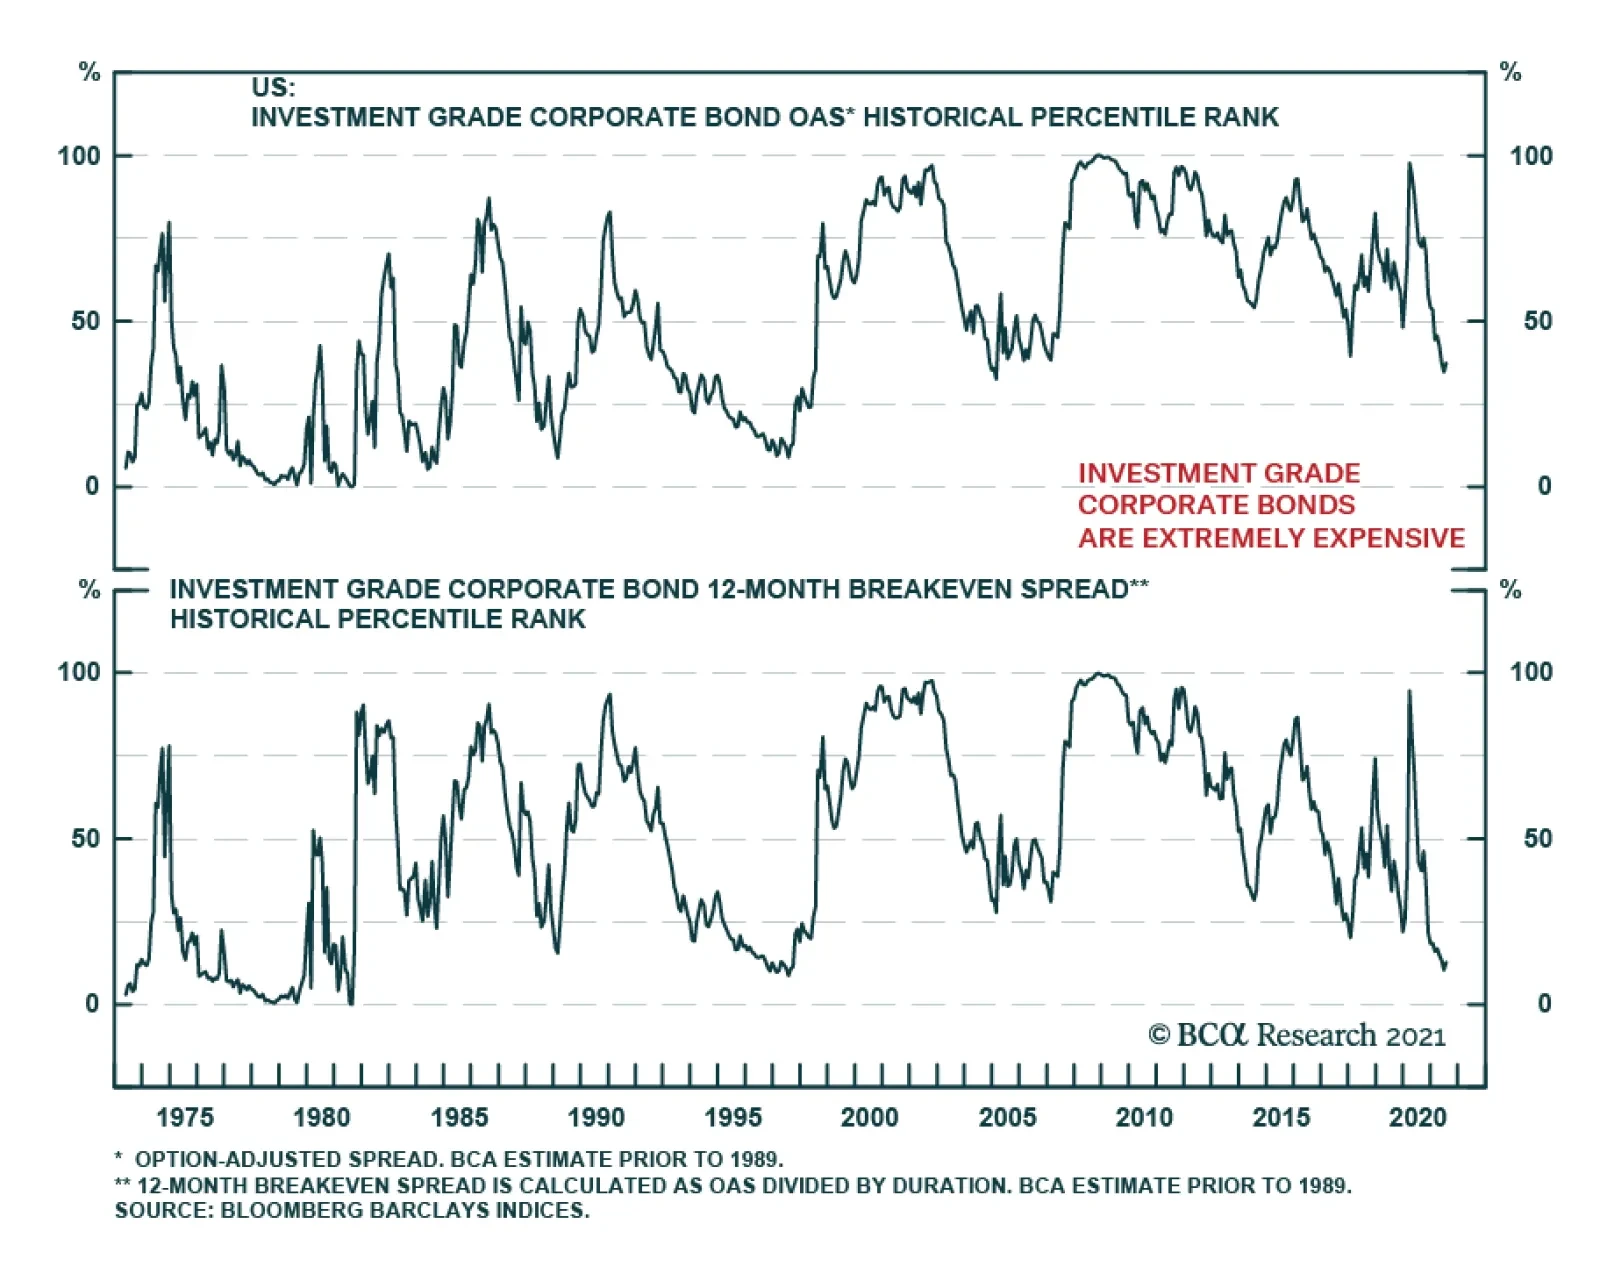
Highlights Spread Product: The credit risk premium has shrunk considerably during the past 16 months. While we don’t foresee a period of significant spread widening any time soon, lower spreads mean lower excess corporate bond returns. We recommend three ways for investors to grab extra spread and increase their excess corporate bond returns: (i) move down in quality, (ii) extend maturity, (iii) favor high-DTS industry groups. Corporate Bond Sectors: High-DTS industry groups like Energy, Communications, Utilities and Basic Industry offer the best risk-adjusted spread pick-up within both investment grade and junk bonds. Consumer Noncyclicals and Transportation also look attractive within high-yield. Municipal Bonds: Investors can increase the average after-tax yield of their bond portfolios without taking greater credit or duration risk by favoring long-maturity tax-exempt municipal bonds (both GO and Revenue). EM Bonds: Investors can increase the average yield of their US bond portfolios by shifting out of investment grade US corporates and into USD-denominated EM Sovereign and Corporate bonds. Feature US bond yields have been on a wild ride since the pandemic struck in March 2020. The 10-year Treasury yield collapsed to 0.52% last year. It then rebounded to a high of 1.74% in March 2021 before falling back to its current 1.21%. But throughout all this volatility in rates markets, the steady outperformance of credit risk has been a constant. For the past 16 months, accommodative monetary policy has spurred a steady flow of investment into spread product, a trade that was amplified by the Fed’s extraordinary intervention in the corporate bond market. On March 23rd 2020, the Fed essentially announced a back-stop of the corporate bond market that gave investors the green light to pile into the sector. Since then, the investment grade corporate bond index has outperformed a duration-matched position in Treasury securities by 24% and the high-yield index has outperformed by 39%. Of course, the result of this consistent flow of funds into spread product has been a collapse in credit spreads. The average spread on the investment grade corporate bond index is only slightly below its post-1973 median, but it is at its tightest level since the mid-1990s (Chart 1). When we adjust for the fact that the index’s average duration has increased significantly since the 1970s, we find that the spread has only been tighter 13% of the time since 1973 (Chart 1, bottom panel). What’s more, this analysis doesn’t control for the fact that the average credit rating of the index has fallen significantly during the past few decades. In short, investment grade corporate bonds are extremely expensive and are quite possibly the most expensive they have ever been in risk-adjusted terms. Chart 1Investment Grade Corporate Bond Valuation
Investment Grade Corporate Bond Valuation
Investment Grade Corporate Bond Valuation
How should bond investors proceed in this environment? Of course, tight credit spreads will cause us to exit our recommended spread product overweight earlier in the cycle than would otherwise be the case. But for the time being, we still see quite a bit of life left in credit markets. We showed in a recent report that corporate bond excess returns tend not to turn negative until the 3/10 Treasury slope is below 50 bps, even during periods when credit spreads are tight.1 At 88 bps, the slope still has a ways to go before breaching that threshold. In the meantime, we advise investors to run high levels of credit risk in their bond portfolios, grabbing attractive risk premiums where they can be found. As for what investors can do to find attractive risk premiums, we have a few suggestions. Move Down In Quality The most obvious way to add spread to a bond portfolio is to move down in quality. Charts 2A-2E show the extra spread that can be picked up by moving down one credit tier at a time. We show both the raw spread pick-up since 1995 and the spread pick-up after adjusting for duration risk (i.e. the 12-month breakeven spread). The additional spread on offer for moving out of Aa-rated bonds and into A-rated bonds is currently 17 bps, very low compared to history (Chart 2A). The extra compensation looks a little better after adjusting for duration risk (Chart 2A, bottom panel), but it is still well below its historical mean. Similarly, investors only earn an additional 38 bps by moving out of A-rated bonds and into Baa-rated bonds (Chart 2B). This is very low compared to history and it looks even worse in duration-adjusted terms (Chart 2B, bottom panel). A move down in quality within the investment grade space may still be worth it, even though the reward for doing so is meager in historical terms. However, investors can get much more bang for their buck by moving out of investment grade entirely and into junk bonds. The additional spread earned in Ba-rated bonds compared to Baa-rated bonds (130 bps) is below its historical average, but it has been much lower in the recent past (Chart 2C). This is also true in duration-adjusted terms (Chart 2C, bottom panel). A move out of Ba-rated bonds and into B-rated bonds looks even better (Chart 2D). Yes, the raw 116 bps spread pick-up in the B-rated index compared to the Ba-rated index is well below its historical mean, but after adjusting for the lower duration of the B-rated index we see that the duration-adjusted spread pick-up in B-rated bonds is above its average historical level (Chart 2D, bottom panel). Finally, we observe that investors earn an extra 159 bps by moving out of the B-rated sector and into the Caa-rated sector (Chart 2E). This is extremely low compared to history, but it looks considerably more appealing in duration-adjusted terms (Chart 2E, bottom panel). All in all, we think it makes sense for investors to grab extra spread by moving down the quality ladder. In particular, investors should favor high-yield bonds over investment grade and focus on the B-rated credit tier where the duration-adjusted spread is most attractive. Chart 2AA Versus Aa
A Versus Aa
A Versus Aa
Chart 2BBaa Versus A
Baa Versus A
Baa Versus A
Chart 2CBa Versus Baa
Ba Versus Baa
Ba Versus Baa
Chart 2DB Versus Ba
B Versus Ba
B Versus Ba
Chart 2ECaa Versus B
Caa Versus B
Caa Versus B
Extend Maturity As an alternative to moving down in quality, investors can also increase the average spread of their credit portfolios by extending maturity within corporate bonds. Compared to history, we find that long maturity investment grade and junk bonds offer above-average compensation relative to their shorter-maturity counterparts (Chart 3A). Of course, implementing this trade means either taking more duration risk in your portfolio or offsetting the increased duration on the credit side by taking less duration risk within your government bond holdings. It’s also worth mentioning that extending maturity within corporate credit is rarely, if ever, an attractive proposition in risk-adjusted terms. The spread per unit of duration for long-maturity corporates is almost always below that of short-maturity corporates (Chart 3B). However, this risk-adjusted spread differential tends to be highest when overall corporate bond spreads are tight. In other words, it is during periods of expensive corporate bond valuations, like today, when it makes most sense to extend maturity within corporate bond portfolios. Chart 3ASpreads: Long Versus Short
Spreads: Long Versus Short
Spreads: Long Versus Short
Chart 3BRisk-Adjusted Spreads: Long Versus Short
Risk-Adjusted Spreads: Long Versus Short
Risk-Adjusted Spreads: Long Versus Short
Favor High-Beta Sectors Finally, investors can chase better returns within the corporate bond space by favoring those industry groups with the highest Duration-Times-Spread (DTS). DTS functions as a rough proxy for corporate bond excess return volatility. In other words, bonds with high (low) DTS tend to perform best during periods of spread tightening (widening) and worst during periods of spread widening (tightening). We can also look at the correlation between DTS and excess returns to get a sense of the excess return earned by taking an extra unit of DTS risk. For example, Chart 4A shows annualized excess returns for the 10 major investment grade industry groups relative to starting DTS for the period that ran from the March 23rd 2020 peak in spreads until the end of last year. The slope of the trendline is 79 bps, meaning that investors earned 79 bps of extra return for taking one extra unit of DTS risk. Notably, this credit risk premium fell to 35 bps per unit of DTS risk this year (Chart 4B), as tighter spreads led to a lower realized credit risk premium. Chart 4AInvestment Grade Credit Risk Premium: March 23 2020 To Dec 31 2020
The Collapsing Credit Risk Premium
The Collapsing Credit Risk Premium
Chart 4BInvestment Grade Credit Risk Premium: Year-To-Date
The Collapsing Credit Risk Premium
The Collapsing Credit Risk Premium
Interestingly, we don’t observe the same declining credit risk premium in high-yield. Investors earned 95 bps per unit of DTS risk between March 23rd 2020 and Dec 31st 2020 (Chart 4C), but they have earned an even greater 98 bps per unit of DTS risk so far this year (Chart 4D). The steeper line is mostly due to the Energy sector that has delivered strong excess returns and that continues to offer an enticing spread in both absolute and risk-adjusted terms. Chart 4CHigh-Yield Credit Risk Premium: March 23 2020 To Dec 31 2020
The Collapsing Credit Risk Premium
The Collapsing Credit Risk Premium
Chart 4DHigh-Yield Credit Risk Premium: Year-To-Date
The Collapsing Credit Risk Premium
The Collapsing Credit Risk Premium
The next section of this report dives into the relative attractiveness of different corporate bond industry groups. For now, we just want to stress that it makes sense for credit investors to increase their spread pick-up by favoring those industry groups with the highest DTS. Bottom Line: The credit risk premium has shrunk considerably during the past 16 months. While we don’t foresee a period of significant spread widening any time soon, lower spreads mean lower excess corporate bond returns. We recommend three ways for investors to grab extra spread and increase their excess corporate bond returns: (i) move down in quality, (ii) extend maturity, (iii) favor high-DTS industry groups. Sector Opportunities The previous section recommended three ways to increase the spread pick-up within a corporate bond portfolio. In this section, we identify sectors that offer attractive spreads in risk-adjusted terms. That is, we are looking for attractive spreads relative to other fixed income sectors with similar duration and credit rating. We specify three opportunities: 1. Corporate Bond Industry Groups Chart 5 plots a measure of risk-adjusted spread for each of the 10 major investment grade corporate bond industry groups relative to that industry group’s DTS. The risk-adjusted spread is the residual from a cross-sectional regression of sector spreads versus average credit rating and duration. The prior section noted that investors should favor high-DTS industry groups within investment grade corporate bonds, and Chart 5 reveals that those high-DTS sectors are also the most attractive in risk-adjusted terms. Energy, Utilities, Basic Industry and Communications all stand out as offering elevated risk-adjusted spreads. While the Transportation and Consumer Cyclical sectors offer low risk-adjusted spreads, the Airlines group within Transportation and the Lodging group within Consumer Cyclicals also stand out as being attractive.2 Chart 5Investment Grade Corporate Sector Valuation
The Collapsing Credit Risk Premium
The Collapsing Credit Risk Premium
Chart 6 shows the results of the same analysis performed on high-yield industry groups. Once again, we see that the high-DTS sectors look best in risk-adjusted terms. Communications, in particular, offers an extraordinarily high risk-adjusted spread that is driven by issuers in the Media: Entertainment and Wirelines sub-sectors. Overall, high-DTS industry groups like Energy, Communications, Utilities and Basic Industry offer the best risk-adjusted spread pick-up within both investment grade and junk bonds. Consumer Noncyclicals and Transportation also look attractive within high-yield. Chart 6High-Yield Corporate Sector Valuation
The Collapsing Credit Risk Premium
The Collapsing Credit Risk Premium
2. Long-Maturity Municipal Bonds Another opportunity to add risk-adjusted spread to a US bond portfolio lies in tax-exempt municipal bonds. In particular, investment grade rated tax-exempt municipal bonds at the long-end of the curve. Chart 7A shows the yield offered by the Bloomberg Barclays Municipal General Obligation (GO) index at different maturity points alongside the US Credit index yield that has the same credit rating and duration. The average credit rating for GO maturity buckets ranges from Aa1/Aa2 to Aa3/A1. Chart 7B translates the yields shown in Chart 7A into breakeven tax rates. That is, it shows the tax rate that would make an investor indifferent between owning the GO muni and the US Credit index. While the breakeven tax rates are quite high at the front-end of the curve, they fall dramatically as maturity is extended. The breakeven tax rate falls to 29% for the 8-12 year maturity bucket, 13% for the 12-17 year bucket and a mere 3% for 17-year+ maturities. In other words, any investor faced with a tax rate above 3% would be better off owning a long-maturity GO muni than a long-maturity US corporate bond. Chart 7AGeneral Obligation Munis Versus US Credit: Yields
The Collapsing Credit Risk Premium
The Collapsing Credit Risk Premium
Chart 7BGeneral Obligation Munis Versus US Credit: Breakeven Tax Rates
The Collapsing Credit Risk Premium
The Collapsing Credit Risk Premium
Charts 8A and 8B show the results of the same analysis performed for Municipal Revenue bonds relative to the US Credit index. All Revenue Muni maturity buckets have an average credit rating of Aa3/A1. We find that Revenue bonds look even more attractive than GO bonds, though once again the attractive yields are found at the long-end of the curve. The negative breakeven tax rate shown for the 22-year+ maturity bucket means that the muni bond actually offers a before-tax yield pick-up compared to the corporate credit. Chart 8ARevenue Munis Versus US Credit: Yields
The Collapsing Credit Risk Premium
The Collapsing Credit Risk Premium
Chart 8BRevenue Munis Versus US Credit: Breakeven Tax Rates
The Collapsing Credit Risk Premium
The Collapsing Credit Risk Premium
USD-denominated Emerging Market Sovereigns and Corporates Chart 9EM Sovereign And Corporate Spreads
The Collapsing Credit Risk Premium
The Collapsing Credit Risk Premium
Finally, as we noted in a recent report,3 USD-denominated Emerging Market (EM) Sovereign and Corporate bonds offer an attractive yield pick-up relative to US corporate credit. Chart 9 shows the spreads of both the EM Sovereign and EM Corporate indexes relative to duration and credit rating matched positions in the US Credit index. First, we observe that both indexes offer a significant yield advantage over the US Credit index across all investment grade credit tiers. Second, we also observe that EM Corporates look much more attractive than Sovereigns within the A and Baa credit tiers, but that Sovereigns have the advantage within the Aa credit tier. The elevated Aa Sovereign spread is the result of USD bonds issued by the UAE and Qatar that offer yields above 2%. Bottom Line: US bond investors can increase the average yield of their portfolios without taking greater credit or duration risk by focusing on high-DTS industry groups (Energy, Communications, Utilities, Basic Industry) within both investment grade and high-yield corporate bond indexes. This can also be achieved by shifting allocation into long-maturity tax-exempt municipal bonds (both GO and Revenue) and USD-denominated EM Sovereign and Corporate debt. Ryan Swift US Bond Strategist rswift@bcaresearch.com Footnotes 1 Please see US Bond Strategy Weekly Report, “The Post-FOMC Credit Environment”, dated June 29, 2021. 2 A version of this chart with all 40 industry groups can be found in our monthly Portfolio Allocation Summary. Please see US Bond Strategy Portfolio Allocation Summary, “On Track For 2022 Liftoff”, dated July 6, 2021. 3 Please see US Bond Strategy Weekly Report, “The Post-FOMC Credit Environment”, dated June 29, 2021. Recommended Portfolio Specification Other Recommendations
The Collapsing Credit Risk Premium
The Collapsing Credit Risk Premium
Treasury Index Returns
The Collapsing Credit Risk Premium
The Collapsing Credit Risk Premium
Spread Product Returns
The Collapsing Credit Risk Premium
The Collapsing Credit Risk Premium
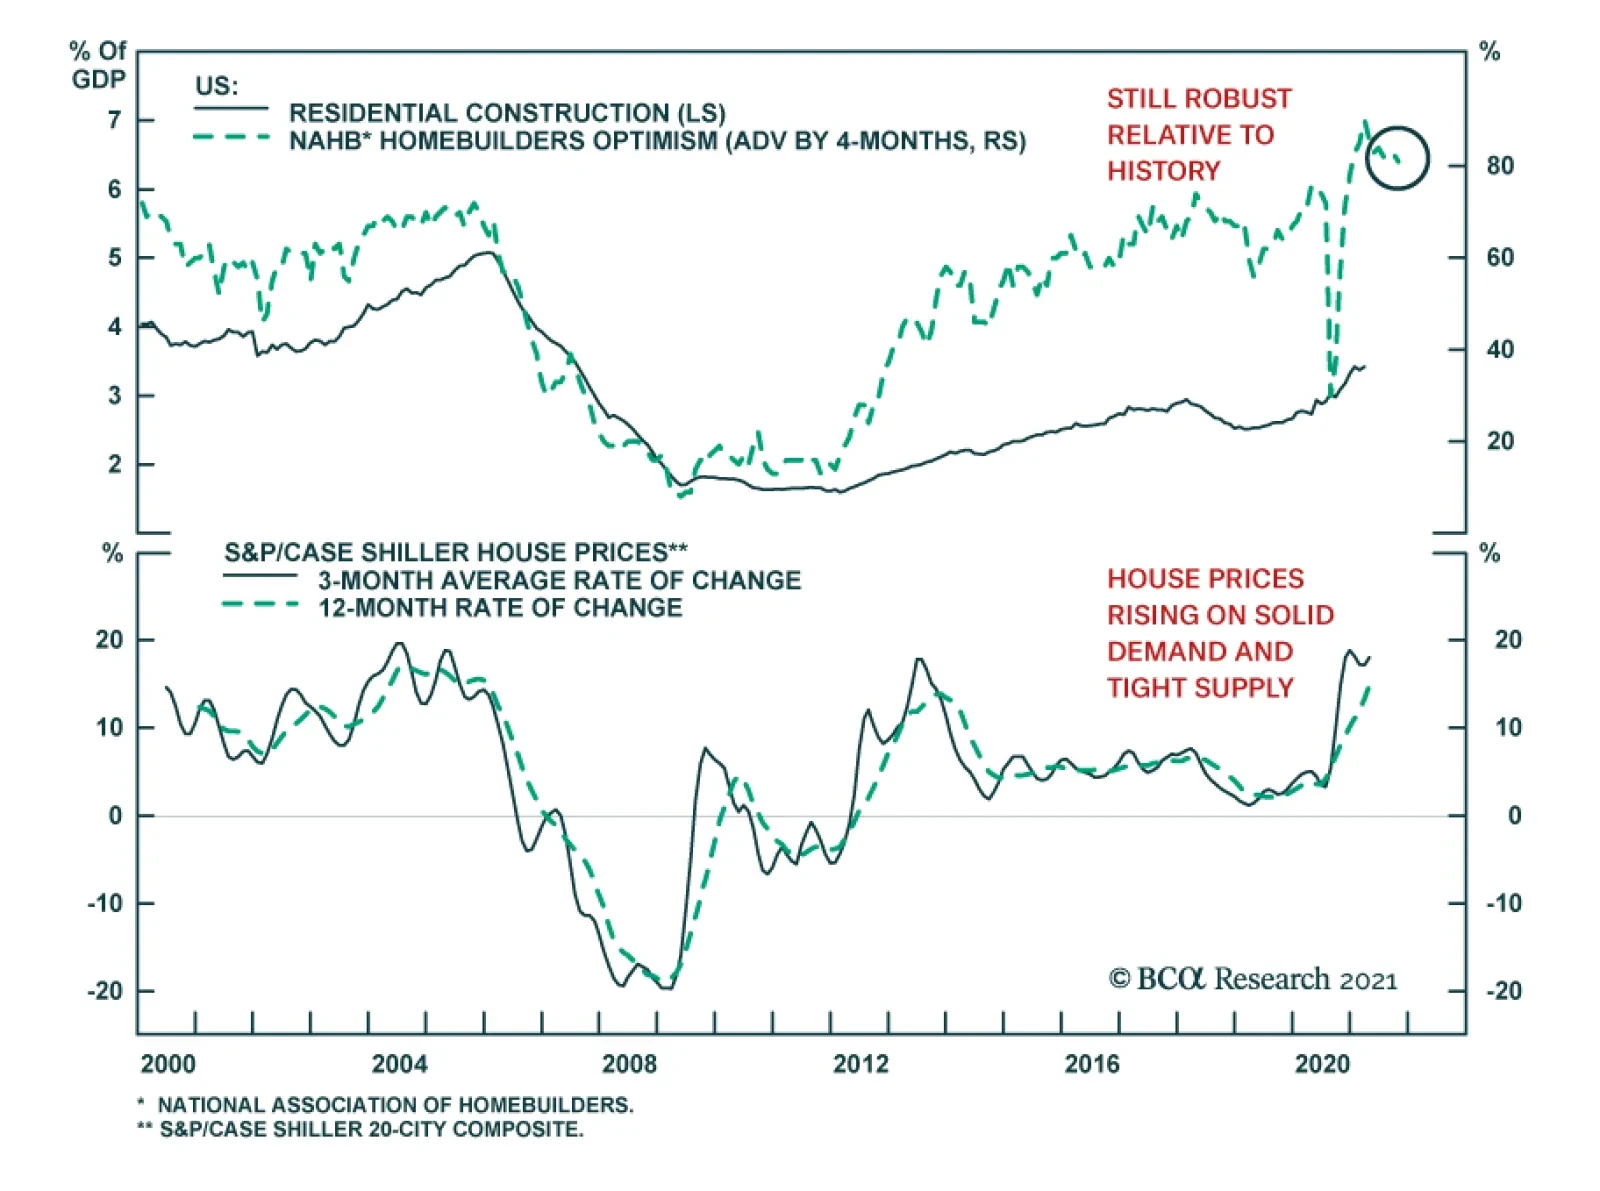
US homebuilder sentiment was a slight disappointment in July. The NAHB Housing Market Index declined for the second consecutive month, ticking down one point to 80. The weaker number reflects a six-point fall in buyer traffic and a single point decline in…
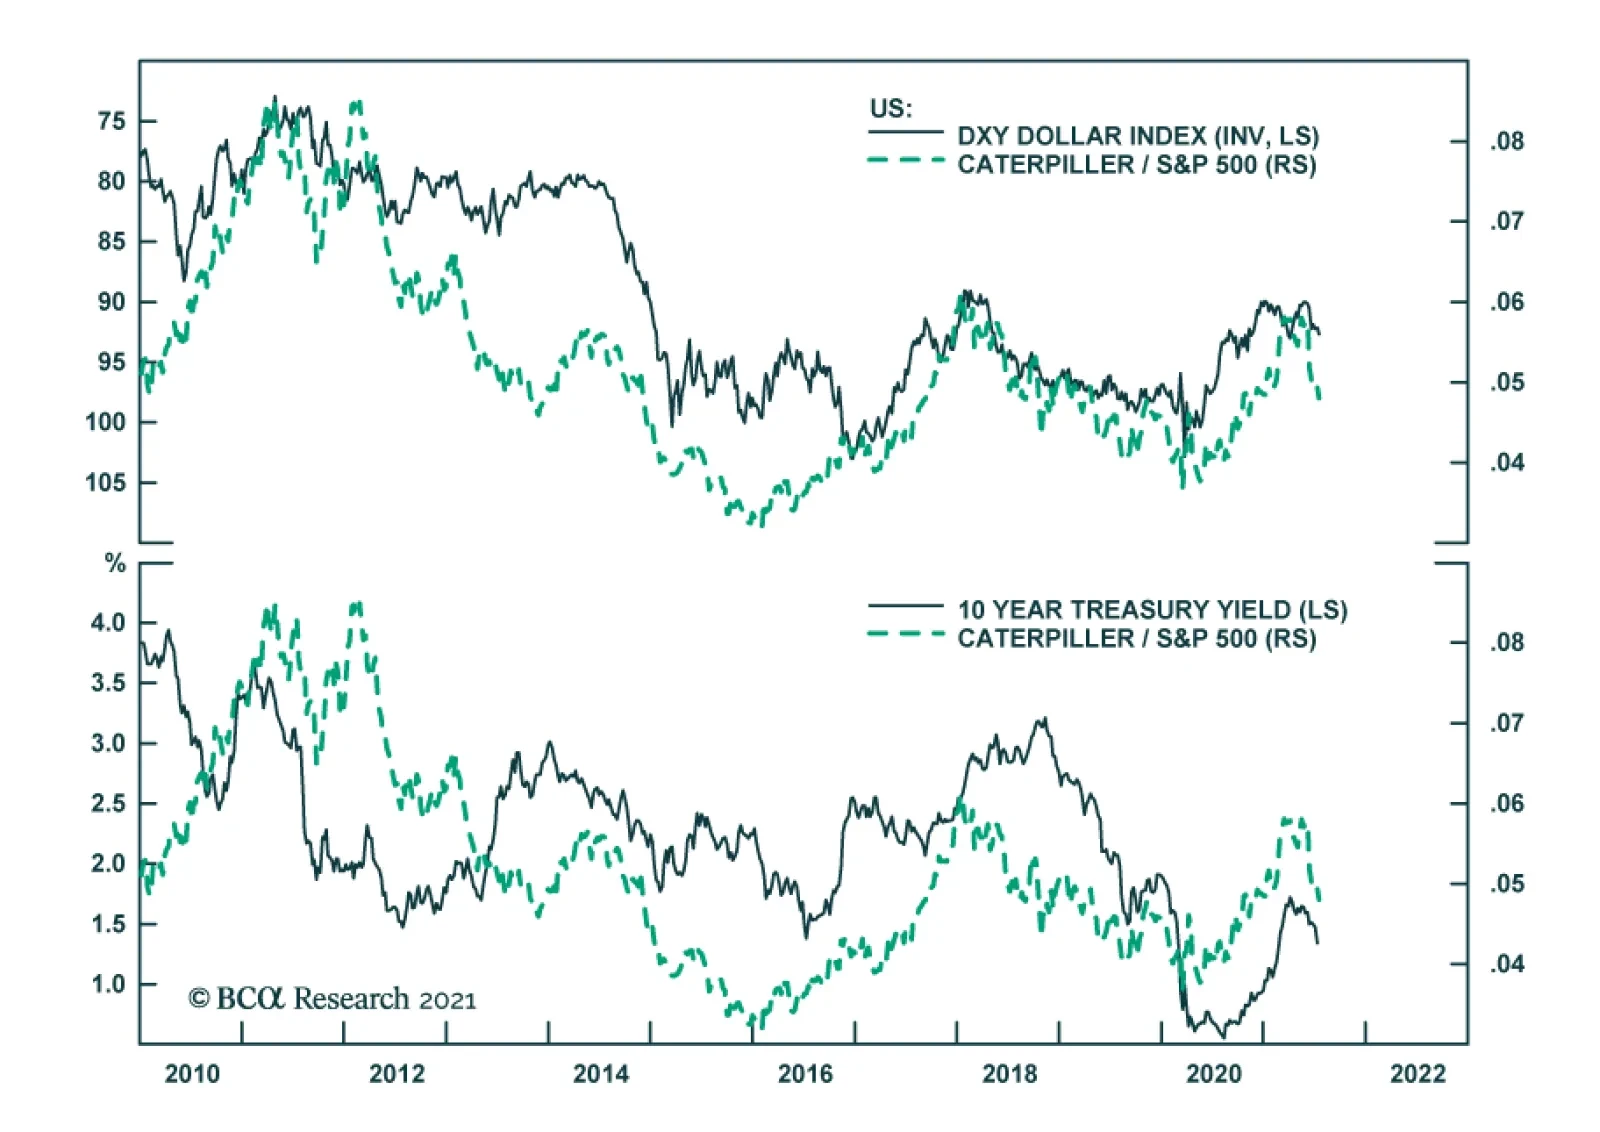
Caterpillar has been underperforming the broad US market since mid-March, a move that slightly predates the rebound in the dollar and the decline in global yields. The tight inverse relationship between the relative performance of Caterpillar and the…
Highlights From a credit perspective, the five largest banks have turned the page on the pandemic: The big banks have returned to their pre-COVID lending standards and, ex-Wells Fargo, have released 70% of the loan-loss reserves they built up in the first half of 2020. Households have a ton of dry powder to support consumption and they’re deploying it with gusto: Consumers have begun to give their plastic a workout, with first half 2021 debit and credit card spending surging well beyond first half 2019 levels. Unfortunately for bank earnings, however, consumers are paying off their balances every month and businesses are still awash in liquidity: Expectations about a second-half lending pickup are mixed. Households and businesses have plenty of cash on hand and it is unclear when they will again need to borrow. Credit performance is stellar: Banks are disappointed that the appetite for new loans is so weak, but ample cash and soaring collateral values have shrunk delinquencies and charge-offs to extremely low levels. What The Banks See Chart 1New Delinquency Lows In All Categories
The Big Bank Beige Book, July 2021
The Big Bank Beige Book, July 2021
Another quarterly earnings season began last week with the systemically important banks (BAC, C, JPM and WFC) and USB leading the way. We review their results and their calls for insight into the broad macro backdrop as revealed by the actions and intentions of their household and business customers, borrower performance, lender willingness and the overall state of the financial system. The banks differed on whether business and consumer lending demand will revive before the year is out, but they were unanimous in the view that fiscal transfers have stunted consumer borrowing and that businesses won’t need to borrow until they work through their own excess cash holdings. The flood of cash in the system is supporting outstanding credit performance (Chart 1) and every bank released loan loss reserves and foresees releasing more if the expansion continues to follow its current course. We took the banks’ observations as confirmation of our view that the economy is in very good shape and is poised to grow far above trend well into 2022. Household spending has come roaring back, reviving the prospects for industries that languished throughout the pandemic, like dining, travel, lodging and entertainment. Businesses have raised plenty of cash from lenders and investors, but they’ve also been generating it via more efficient operations. They will help keep the momentum going as they hire, invest, and restock depleted inventories to meet surging demand. The outlook for the banks’ own stocks is not as clear. Outsized income from lumpy streams like trading and debt and equity underwriting will slow, despite full investment banking pipelines, and most of the benefit from unwinding last year’s buildup of bad debt reserves, except at Wells Fargo, has already been realized (Table 1). The banks cannot unleash their full earnings potential until loan demand recovers and interest rates rise, and their net interest income prospects were top of mind for the analyst community. We do expect the banks will get some relief as longer duration Treasury yields back up to reflect inflation’s stirrings and the economy’s strength, but we are not counting on a major inflection in lending demand. Absent a backup in yields, we do not yet see a catalyst for the five biggest banks to outperform the S&P 500 over the rest of the year. Table 1Not Many More Reserves Left To Release
The Big Bank Beige Book, July 2021
The Big Bank Beige Book, July 2021
Households Are Spending (Chart 2), … Chart 2Consumption Is Back In A Big Way ...
Consumption Is Back In A Big Way ...
Consumption Is Back In A Big Way ...
[C]onsumer spending from our own customers … is not only much higher than … in 2020, which you would expect, but is notably 22% higher … compared to 2019. (Moynihan, BAC CEO) [C]ombined debit and credit [card] spend was up 45% year-on-year, and more importantly up 22% versus the more normal pre-COVID second quarter of 2019. (Barnum, JPM CFO) [T]he pump is primed. … The pandemic is kind of in [consumers’] rearview mirror … and they’re raring to go. (Dimon, JPM CEO) In Branded Cards, total purchase sales were up 40% versus last year and, importantly, up 11% versus the second quarter of 2019. And in Retail Services, purchase sales also grew versus … second quarter 2019[.] So, the good news is that we’re continuing to see the recovery in spend. (Mason, C CFO) Weekly debit card spend was up every week compared to 2019 during the second quarter and areas hardest hit by the pandemic have recovered, including travel, up 11%; entertainment, up 38%; and restaurant spending, up 28% during the week ending June 25th, compared with 2019. Consumer credit card spending activity continued to increase, up 13% in the second quarter, compared to 2019. As of the week ended June 25th, travel … was the only category that has not fully rebounded to [2Q19] levels. (Scharf, WFC CEO) Sales volume trends … are encouraging. As of the end of June, total sales volumes across each of the three payments businesses exceeded comparable 2019 levels. Certain pandemic-impacted spend categories continue to lag, in particular corporate travel and entertainment. However, consumer travel and hospitality spend volumes are rebounding faster than we expected, and the pace of improvement in recent weeks has accelerated a bit. (Dolan, USB CFO) … They’re Just Not Borrowing (Yet) (Chart 3) Chart 3... While Credit Card Debt Has Been Left Behind
... While Credit Card Debt Has Been Left Behind
... While Credit Card Debt Has Been Left Behind
[Mortgage balances] are only modestly down this quarter as our origination volumes are finally overcoming the payoffs. We are pleased with the trajectory through the period and that feeds into the second half of the year, … [when it will be] good to start with a trend that has reversed the past quarters’ declines. (Moynihan, BAC) [People’s behavior hasn’t changed;] [t]hey just have more cash, and so they paid off their credit cards, which is a completely responsible thing for them to do. And when they can get out and spend more money, which is starting to happen, I think you’ll see them use these lines[.] … So we’ll see where it goes, but the good news is it’s going in a different direction. (Moynihan, BAC) [W]e … believe that the … acceleration and pickup in spend is going to translate to … loan growth in [credit] card[s], but we think that pay rates are going to remain quite elevated at a minimum through the end of this year [because of households’ cash buffers (Chart 4)]. So as a result, we don’t really see revolving … balances increasing meaningfully this year[.] (Barnum, JPM) Chart 4A Mountain Of Excess Savings
A Mountain Of Excess Savings
A Mountain Of Excess Savings
Looking ahead, we expect the growth in purchase sales to translate into loan growth by the end of the year as stimulus moderates and consumers return to more normal payment patterns. (Mason, C) [W]hile it’s hard to predict exactly what will happen during the second half, … we are seeing signs of green shoots with modest growth … compared to the first quarter in auto, other consumer [and] credit card. (Santomassimo, WFC CFO) You’re seeing a little bit of growth in card [balances]; although [spending] has really picked up, it hasn’t quite translated into bigger volumes given the payment rates … are still really high. I think they’ll come down and normalize eventually, but they’re still pretty high. (Santomassimo, WFC) We do expect consumer lending to get a little bit stronger, because of [consumer spending]. … [W]e saw some nice growth in the credit card space right at the end of June. And while [payment rates] continue to be elevated, I think the fact that they’re not increasing … will help credit card balances as well. And … also when we think about loan growth, auto lending continues to be very strong. (Dolan, USB) Businesses Are In Limbo [E]xcluding the PPP loan forgiveness, middle-market lending and our business banking team [serving companies with annual revenues of $5 million to $50 million] finally had a month of growth in June, the first since March 2020. (Moynihan, BAC) [O]n the commercial side, it’s really [credit] line usage. Honestly, it can’t go any lower – maybe it can, but theoretically it can’t because it’s been stuck here for a good four or five quarters. (Moynihan, BAC) [O]ur commercial committed exposures … grew quarter-over-quarter [and are] above [their] pre-pandemic level, so [businesses] are getting ready to borrow more. [R]evolver utilization is still at historic lows, but we would expect that to move up as the economy improves … [and] inventories are built across various industries. … Some of the inventory building has been hampered by trucking and ocean liner [bottlenecks, but] you could start to see it [once] some of those kinks are worked out. (Donofrio, BAC CFO) I’ve learned a lot more about ports from our customers than I ever thought I would, [and] it’s going to take a while [to iron out supply chain kinks]. … [E]verybody talks about the chip [shortage], … but it really comes down to the efficient operations of ports … and having people to work and unload the ships (Chart 5). [I]t’s still constraining, but it’s getting incrementally better, [and most of our contacts] are saying it’ll all be [resolved by] the end of the year. And we’ll see it [in lending]. (Moynihan, BAC) Chart 5US Ports Are Still Trying To Clear Backlogs
US Ports Are Still Trying To Clear Backlogs
US Ports Are Still Trying To Clear Backlogs
C&I loans were down 1% quarter-on-quarter with lower [credit line] utilization partially offset by new middle market loan activity. (Barnum, JPM) [T]he second the economy starts to grow, … you’re going to see [middle market] loans go up because inventory, receivables and capital expenditures [will need to be financed]. (Dimon, JPM) The general view from our [business] clients is optimistic in terms of the go-forward environment. (Mason, C) [O]ne never wants to jinx these things, but we really have a fabulous pipeline heading into the second half of the year around the world and it gives you a good sense of confidence and continued momentum. (Fraser, C CEO) [T]he [investment banking] pipeline remains very strong. We expect M&A activity and the IPO markets to remain active and investment banking fees … to be up year-on-year. (Barnum, JPM) We saw investment banking close this quarter with record pipelines. (Moynihan, BAC) In the commercial bank, loans are still down and utilization rates are pretty low on a historic basis [for] lots of reasons – high liquidity, supply chain issues, demand for product in certain industries … and we haven’t really seen [loan demand] inflect yet, … [but there are] lots of good conversations. So I think people are really thinking about investments and building inventory levels over the coming quarters, but [it] will take some time before it starts to translate into loan growth. (Santomassimo, WFC) [I]t’s going to take a little bit of time for C&I [lending] to develop simply because of the amount of liquidity that customers have and are continuing to generate. (Dolan, USB) [A]cross our markets, … middle market customers are certainly much more optimistic today than they were even a quarter or two quarters ago. That usually translates into making longer-term … investments. … I do think that the supply chain is impacting it to some extent, but I think that’s more transitory. (Dolan, USB) Banks Are Ready, Willing (Chart 6) And Able (Chart 7) Chart 6Open For Business
Open For Business
Open For Business
[Our] deposits are $1.9 trillion and [our] loans are $900 billion and change, and that difference has got to be put to work. And the reality is we generated $80 billion [of] deposit growth, and we got to put it to work. And that’s what we do. (Moynihan, BAC) [W]e’re going to get deposits. [They’re] going to fund loan growth. Whatever is left over will probably go in securities, but then we still have a bunch of excess liquidity, so that can be deployed as well, either in the near term or long term, depending on how we balance liquidity against capital and earnings. (Donofrio, BAC) One of the significant things that’s going on is we’ve really finished unwinding all of our credit pullbacks from the [global financial] crisis. So we’re fully back in the [home mortgage] correspondent channel. (Barnum, JPM) Chart 7Finally Putting In A Bottom?
Finally Putting In A Bottom?
Finally Putting In A Bottom?
Chart 8Chrome Is The Most Precious Metal
Chrome Is The Most Precious Metal
Chrome Is The Most Precious Metal
We started to tighten our credit policies in March 2020 in response to the pandemic and we have now essentially returned back to pre-COVID levels or policies, however, we continue to be thoughtful of the much higher asset prices in areas like residential real estate and auto (Chart 8). (Santomassimo, WFC) I think we mentioned this last quarter but we’re now back to fundamentally the credit box that we had on a pre-pandemic level really across all the product categories. (Dolan, USB) Investment Implications We remain bullish on the economy and risk assets as we look out six to twelve months. As the banks highlighted, consumer spending is roaring, businesses cannot go much longer without ramping up spending and hiring to meet burgeoning demand and credit performance is spectacular as borrowers and lenders are flush with cash. The S&P 500 is expensive at between 21 and 22 times forward four-quarter earnings, but the analyst consensus is projecting a highly unusual drop in earnings from the prior quarter’s annualized run rate and we expect the second quarter will produce another sizable beat along the lines of the last four quarters. Prospective returns on “safe” investment alternatives are unappealing and we continue to recommend that investors with one-year timeframes overweight equities. Chart 9Losing Ground
Losing Ground
Losing Ground
As for the SIFI banks themselves, we think their significant outperformance versus the overall market has come to an end (Chart 9, top panel). They were ridiculously inexpensive when we were bulled up on them last spring and summer (Table 2) amidst wildly exaggerated potential credit losses but there’s no re-rating or credit performance catalyst on the horizon now. We disagree with our Counterpoint colleagues’ contention that banks are in the midst of a secular earnings decline but we do expect they will find themselves hemmed in over the rest of the year by the overabundance of capital in the financial system. As we noted last quarter, traditional intermediation isn’t very rewarding when every creditworthy borrower has more money than he or she needs. We are comfortable staying on the neutral sidelines with our US Equity Strategy team.1 Table 2Big Bank Valuations Have Mostly Normalized
The Big Bank Beige Book, July 2021
The Big Bank Beige Book, July 2021
Doug Peta, CFA Chief US Investment Strategist dougp@bcaresearch.com Footnotes 1 Our Global Investment Strategy team is calling for banks to outperform the overall market, as reiterated in its latest publication.